Prevalent and dynamic binding of the cell cycle checkpoint kinase Rad53 to gene promoters
- Cold Spring Harbor Laboratory, United States
Figures
Figure 1
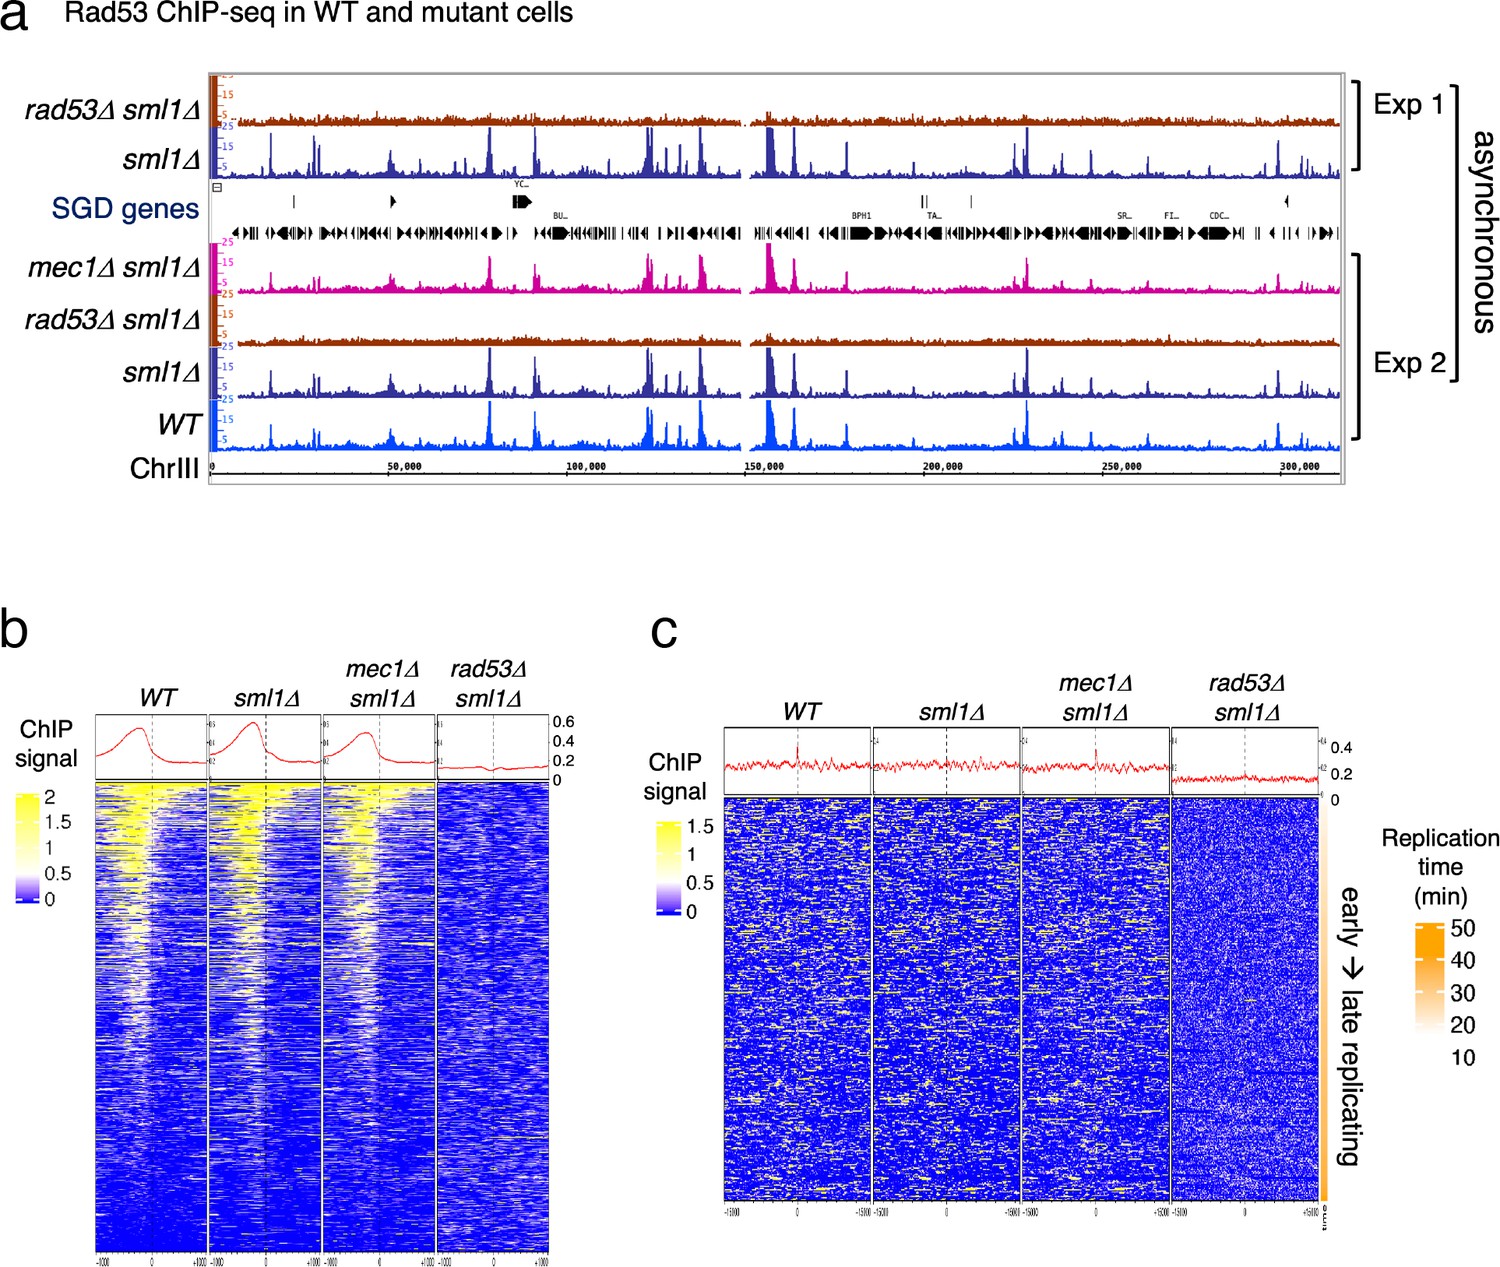
Rad53 is recruited to genomic loci other than replication origins in proliferating yeast cells.
(a) Coverage tracks of Rad53 ChIP-seq signals in WT, sml1Δ, rad53Δsml1Δ, and mec1Δ sml1Δ for chromosome III. Asynchronous yeast cultures were processed for ChIP-seq analysis for distribution of Rad53 at genomic loci. The results from two independent experiments are presented. Experiment 1 compares only sml1Δ, rad53Δsml1Δ. (b) Heatmaps and average signals of Rad53 across 2-kb intervals centered on transcription start sites (TSSs) for proliferating WT, sml1Δ, rad53Δsml1Δ, and mec1Δ sml1Δ cells. (c) Heatmaps of ChIP-seq signals across 30-kb intervals centered on all origins annotated in OriDB database (Siow et al., 2012).
Figure 2 with 4 supplements
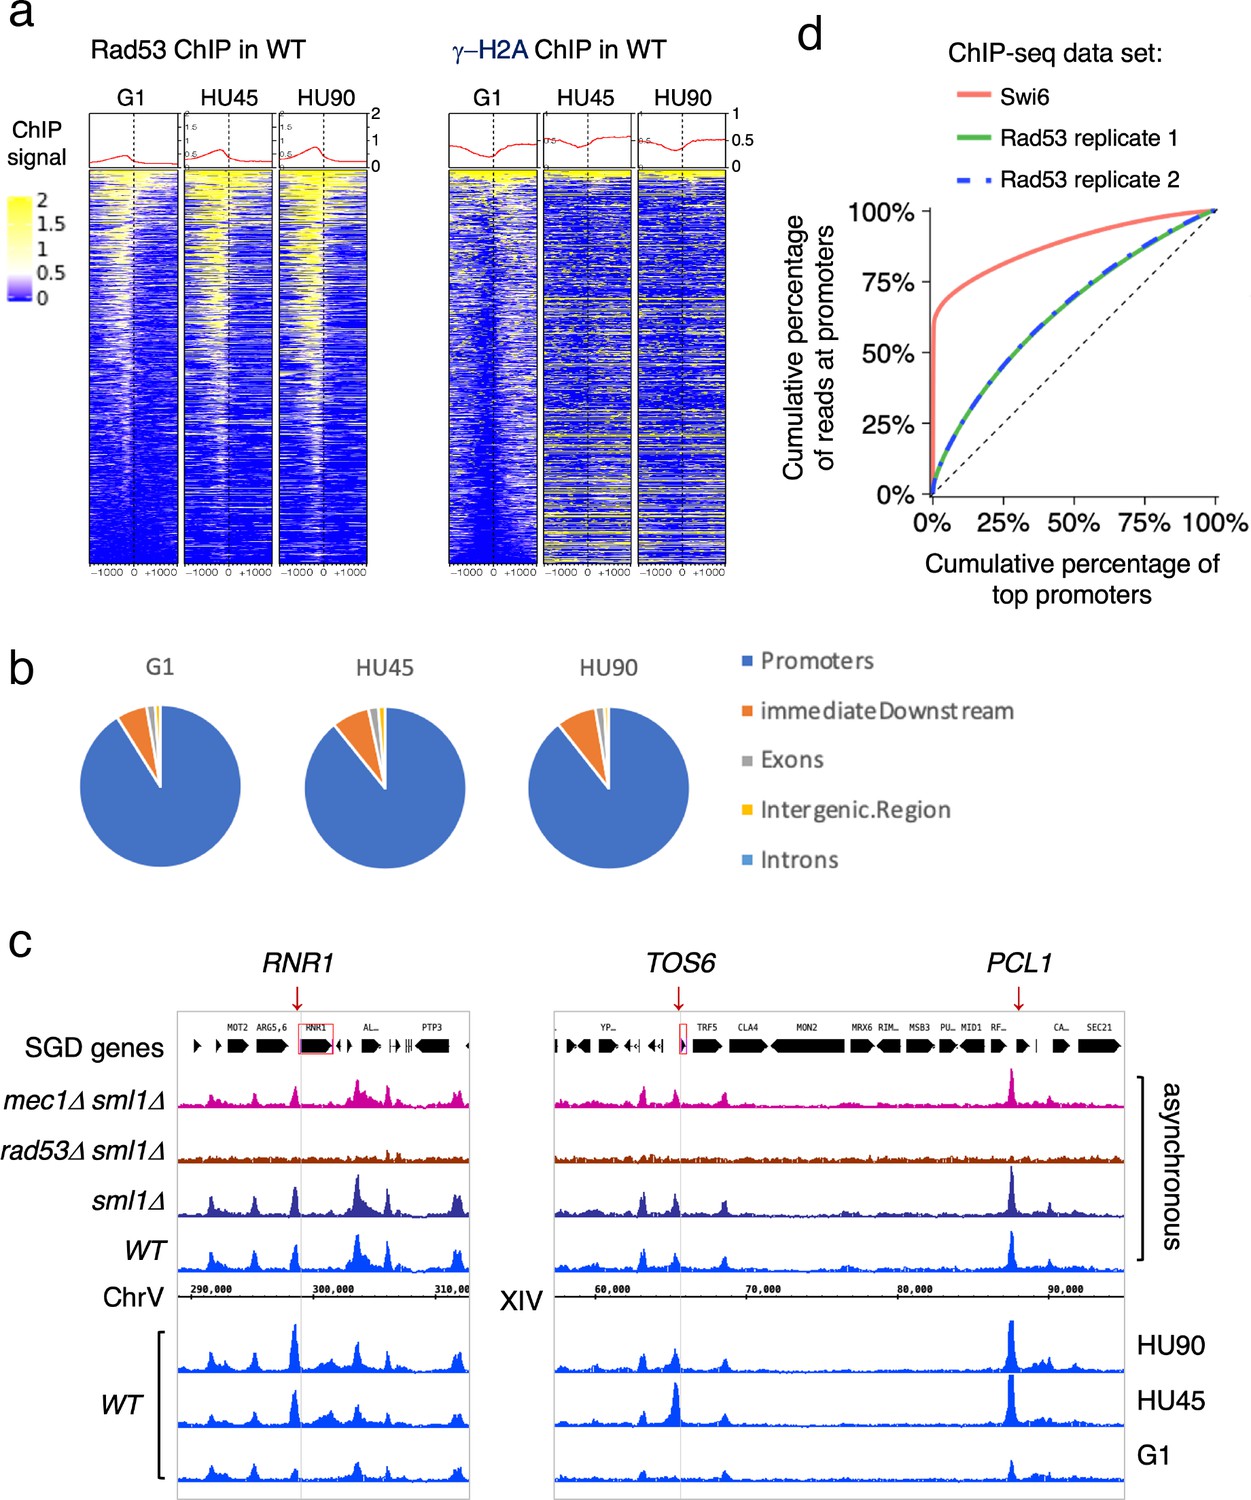
Rad53 is recruited to transcription start site (TSS) and the binding changes with the cell cycle stage.
Cells were synchronized in G1 phase and released into YPD containing 0.2M hydroxyurea (HU) for 45 and 90min (HU45 and HU90, respectively). (a) Heatmaps and average signals of Rad53 and γ-H2A ChIP-seq signals across 2-kb intervals centered on TSSs for WT cells at stages of G1, HU45, and HU90. (b) Distribution of aggregated peak numbers around TSS using merged Rad53 ChIP-seq peaks from all three stages (G1, HU45, and HU90). Pie charts showing the distribution of Rad53 ChIP-seq peaks in relation to gene features. (c) Rad53 ChIP-seq profiles near RNR1, PCL1, and TOS6 genes in proliferating WT, sml1Δ, rad53Δ sml1Δ, and mec1Δ sml1Δ cells, and WT cells at stages of G1, HU45, and HU90. (d) Lorenz curves for ChIP-seq read counts of Swi6 and Rad53 mapped to gene promoters showing inequality for promoter binding.
Figure 2—figure supplement 1
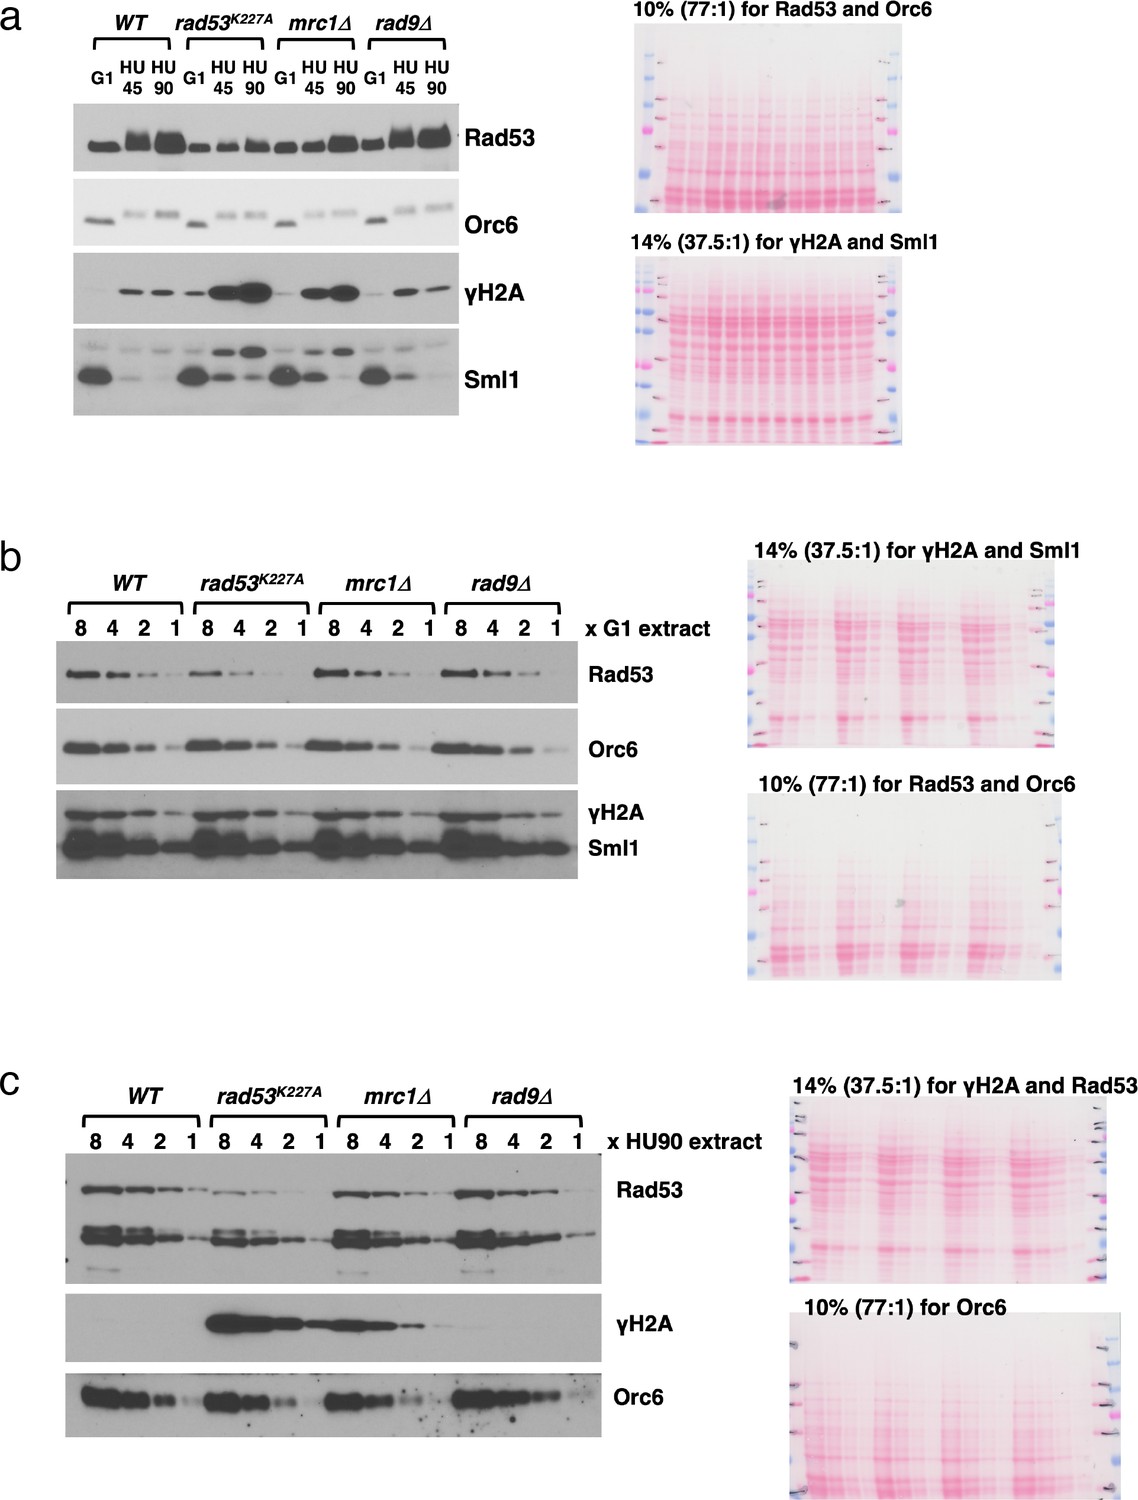
Relative level of Rad53 protein changes in cells.
(a) Immunoblots monitoring protein status for Rad53, Orc6, γ-H2A, and Sml1 during checkpoint activation from G1 to HU45 and HU90. (b) Comparison of Rad53 protein level in G1 extracts from WT, rad53K227A, mrc1Δ, and rad9Δ cells. Blots for Orc6, γ-H2A, and Sml1 are included for reference. (c) Comparison of Rad53 protein level in HU90 extracts from WT, rad53K227A, mrc1Δ, and rad9Δ cells. 14% sodium dodecyl sulfate–polyacrylamide gel electrophoresis (SDS–PAGE) was used for the Rad53 titration blot to allow collapsing of all phosphorylated forms into a single band. Twofold dilutions of the samples are loaded.
-
Figure 2—figure supplement 1—source data 1
Rad53 and Orc6 in Figure 2—figure supplement 1a.
- https://cdn.elifesciences.org/articles/84320/elife-84320-fig2-figsupp1-data1-v2.zip
-
Figure 2—figure supplement 1—source data 2
γ-H2A in Figure 2—figure supplement 1a.
- https://cdn.elifesciences.org/articles/84320/elife-84320-fig2-figsupp1-data2-v2.zip
-
Figure 2—figure supplement 1—source data 3
Sml1 in Figure 2—figure supplement 1a.
- https://cdn.elifesciences.org/articles/84320/elife-84320-fig2-figsupp1-data3-v2.zip
-
Figure 2—figure supplement 1—source data 4
Rad53 in Figure 2—figure supplement 1b.
- https://cdn.elifesciences.org/articles/84320/elife-84320-fig2-figsupp1-data4-v2.zip
-
Figure 2—figure supplement 1—source data 5
Orc6 in Figure 2—figure supplement 1b.
- https://cdn.elifesciences.org/articles/84320/elife-84320-fig2-figsupp1-data5-v2.zip
-
Figure 2—figure supplement 1—source data 6
γ-H2A and Sml1 in Figure 2—figure supplement 1b.
- https://cdn.elifesciences.org/articles/84320/elife-84320-fig2-figsupp1-data6-v2.zip
-
Figure 2—figure supplement 1—source data 7
Rad53 in Figure 2—figure supplement 1c.
- https://cdn.elifesciences.org/articles/84320/elife-84320-fig2-figsupp1-data7-v2.zip
-
Figure 2—figure supplement 1—source data 8
Orc6 in Figure 2—figure supplement 1c.
- https://cdn.elifesciences.org/articles/84320/elife-84320-fig2-figsupp1-data8-v2.zip
-
Figure 2—figure supplement 1—source data 9
γ-H2A in Figure 2—figure supplement 1c.
- https://cdn.elifesciences.org/articles/84320/elife-84320-fig2-figsupp1-data9-v2.zip
-
Figure 2—figure supplement 1—source data 10
All images used in Figure 2—figure supplement 1a.
- https://cdn.elifesciences.org/articles/84320/elife-84320-fig2-figsupp1-data10-v2.zip
-
Figure 2—figure supplement 1—source data 11
All images used in Figure 2—figure supplement 1b.
- https://cdn.elifesciences.org/articles/84320/elife-84320-fig2-figsupp1-data11-v2.zip
-
Figure 2—figure supplement 1—source data 12
All images used in Figure 2—figure supplement 1c.
- https://cdn.elifesciences.org/articles/84320/elife-84320-fig2-figsupp1-data12-v2.zip
Figure 2—figure supplement 2

Comparison of ChIP-seq signals of γ-H2A and Rad53 with and without sequences found enriched promiscuously in previous studies.
Heatmaps across 2-kb intervals centered on transcription start sites (TSSs) using ChIP-seq data with antibodies against γ-H2A (a, b) or Rad53 (c–e). (a, c) The complete datasets, (b, d) the datasets following removal of the hyper-ChIPable regions, and (e) the signal data for genes only at the hyper-ChIPable regions observed by Teytelman et al. and Park et al. Note the pattern of Rad53 localization in (e) is both upstream and downstream of the TSSs, unlike that found for Rad53 ChIP-seq surrounding TSSs in (c) and (d). (f) KEGG enrichment analysis for the 296 genes associated with hyper-ChIPable regions shows mostly tRNA and snoRNA genes.
Figure 2—figure supplement 3
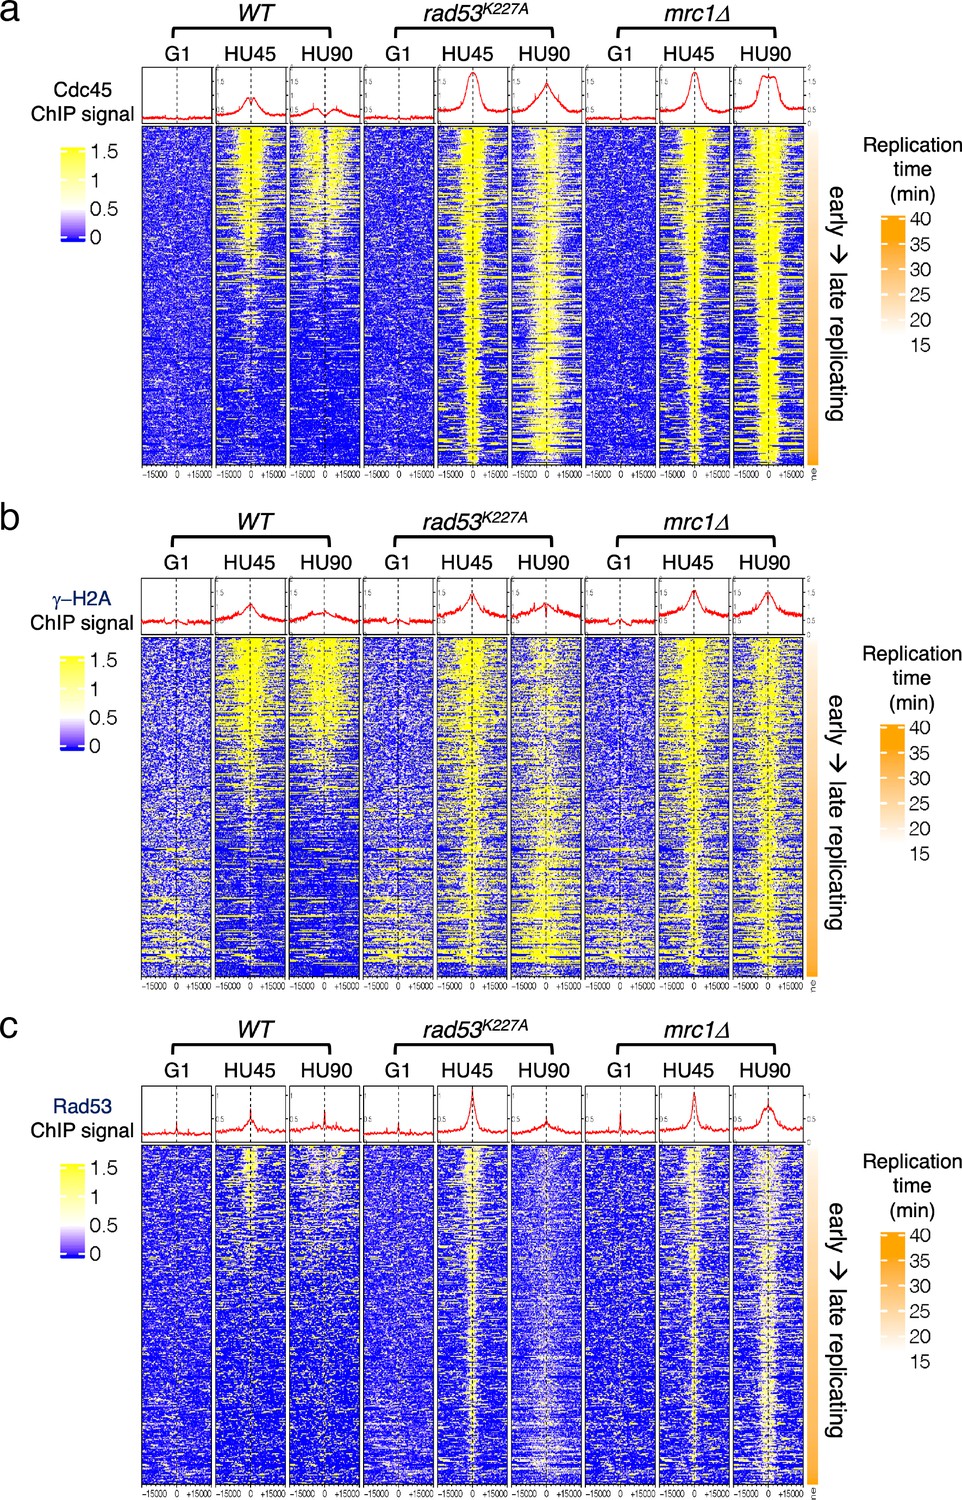
Heatmaps of ChIP-seq signal across 30kb centered on all active origins.
WT, rad53K227A, and mrc1Δ mutant cells at stages of G1, HU45, and HU90 were collected and processed for ChIP-seq analysis. (a–c) Heatmaps of ChIP-seq signal of Cdc45, γ-H2A, and Rad53, respectively, across 30-kb intervals centered on all active origins (see Definition of the origin types in Methods). Origins are ordered according to the associated replication timing data reported in previous study (Yabuki et al., 2002).
Figure 2—figure supplement 4

Rad53 ChIP-seq profiles near RNR1, PCL1, and TOS6 genes in at stages of G1, HU45, and HU90.
Coverage tracks of Rad53 ChIP-seq signals from WT, rad53K227A, and mrc1Δ mutant datasets at stages of G1, HU45, and HU90.
Figure 3
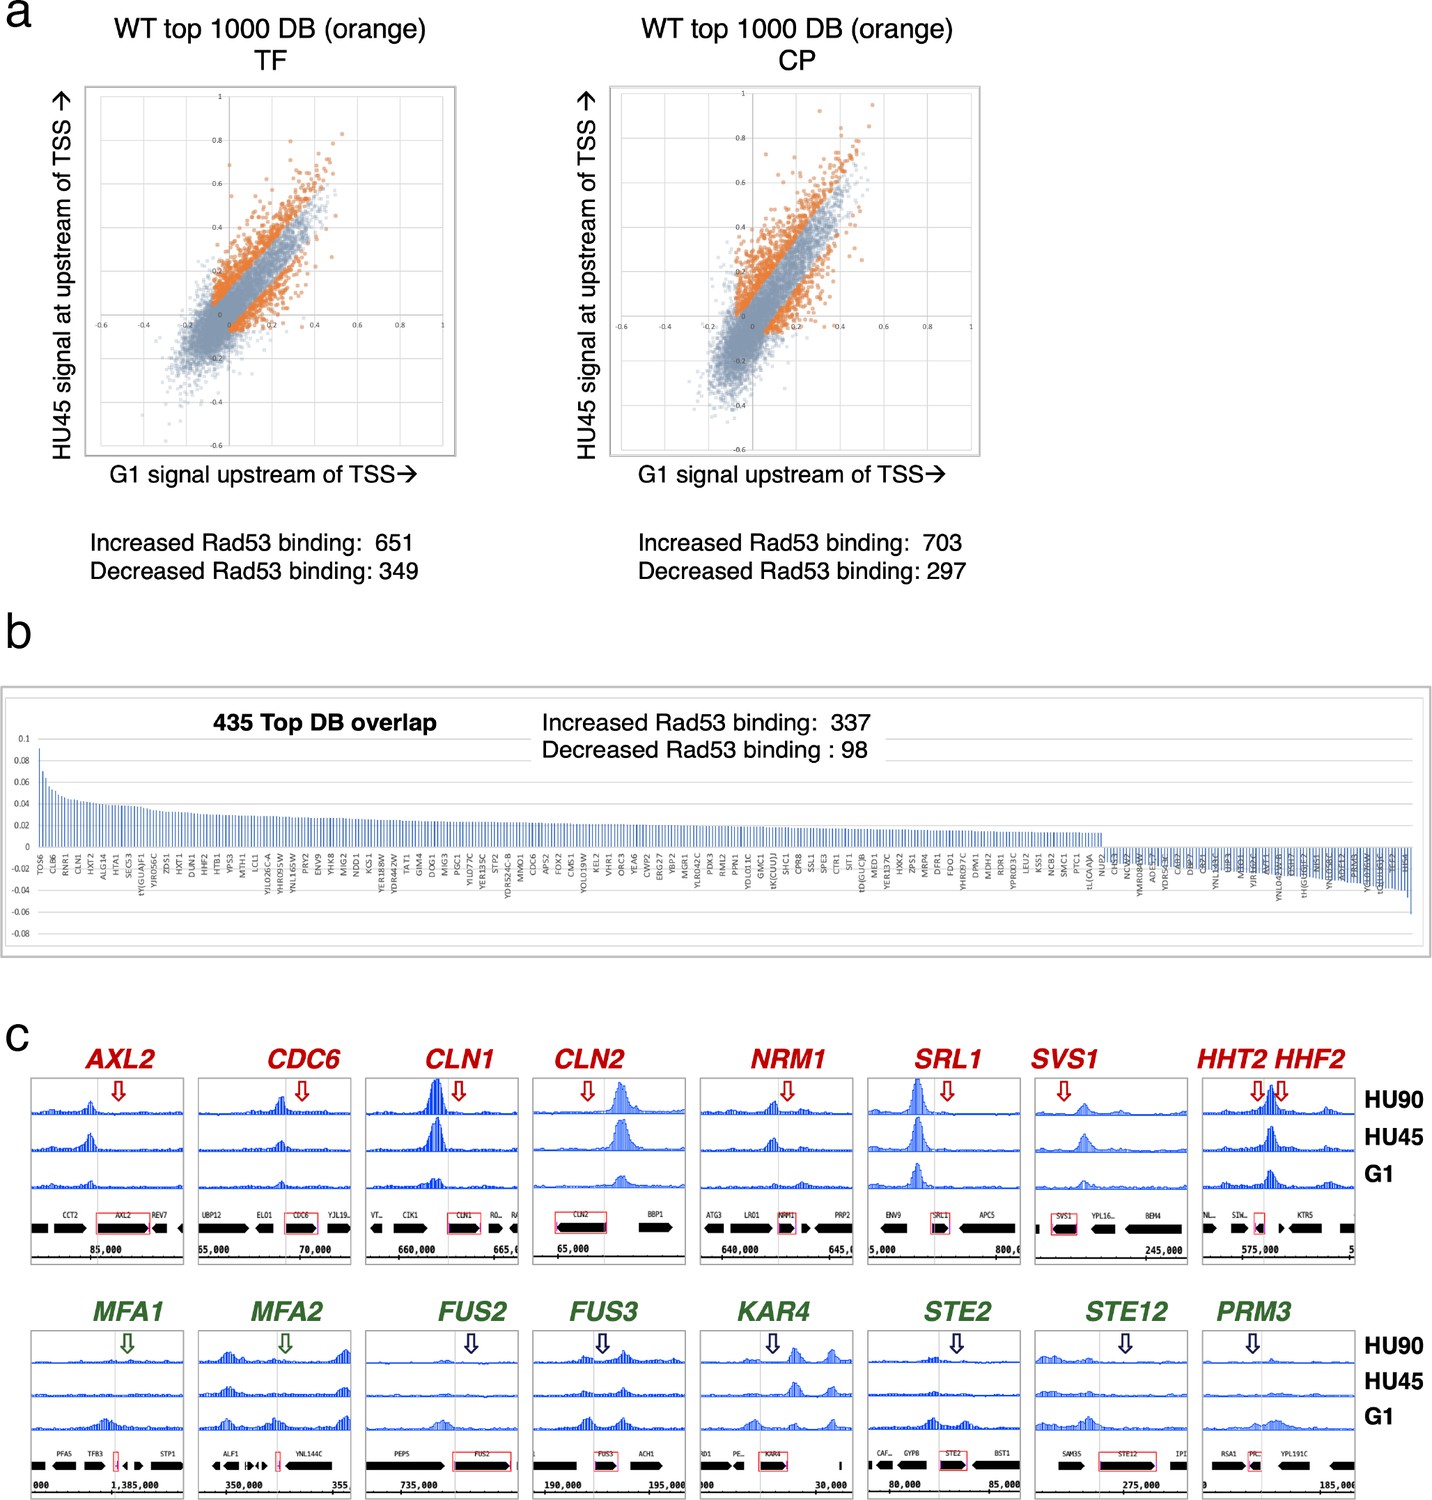
Identification of genes with Rad53-binding changes at the promoters.
(a) Scatter plots compare the signals in G1 (x-axis) and HU45 (y-axis) at 500-bp intervals upstream of transcription start sites (TSSs) for all genes in WT datasets from two independent experiments, TF and CP. Orange dots indicated the 1000 genes with highest binding changes (top 1000 DB) and satisfying the filter of minimal signal of −0.075 (Maximal = 1). The Venn diagram to the right illustrates the identification of 435 genes that are found in both experiments (435 top DB overlap). (b) Binding changes (y-axis: residuals from analysis of experiment TF) for 435 top DB overlap. (c) Examples of coverage tracks for selected genes show Rad53 signal changes at the indicated gene promoters from G1 to HU45 and HU90.
Figure 4 with 1 supplement
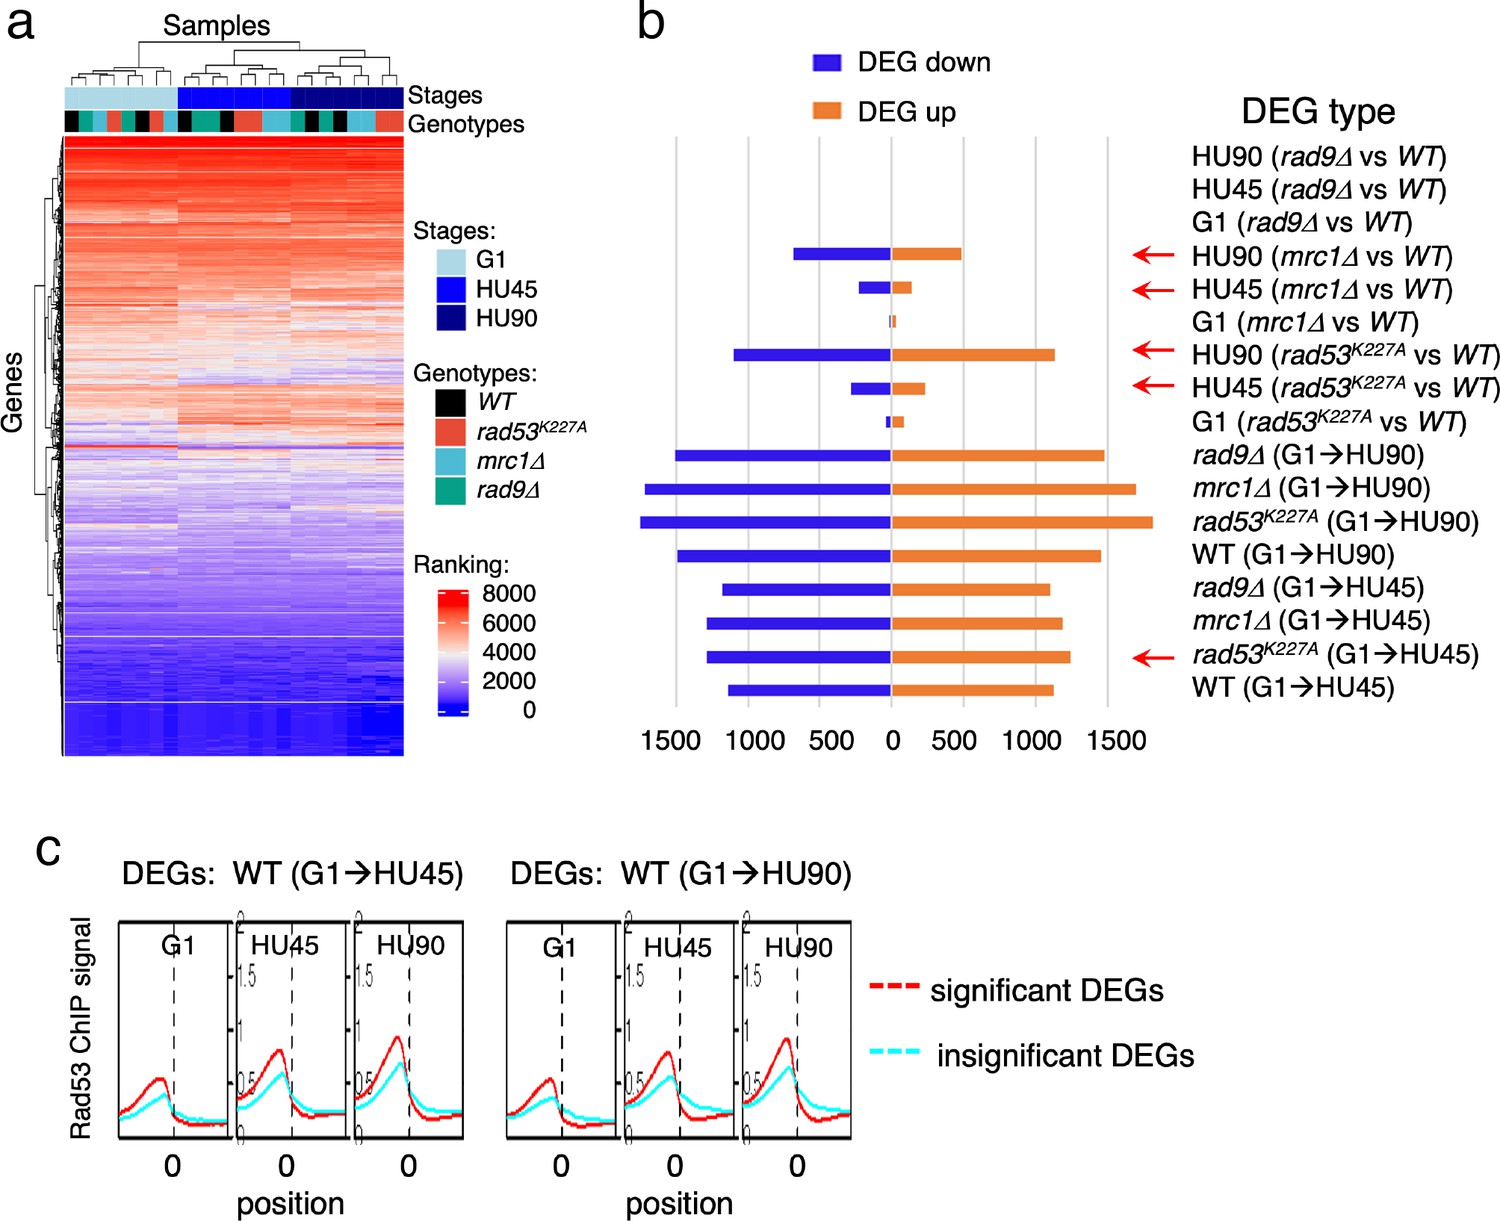
Gene expression changes in WT and checkpoint mutants under stress and the tendency of higher Rad53 binding at promoter of genes with significant differential expression.
WT, rad9Δ, rad53K227A, and mrc1Δ cells were synchronized in G1-phase and released into YPD containing 0.2M hydroxyurea (HU). Cells at stages of G1, HU45, and HU90 were collected and processed for RNA-seq analysis. (a) Rank data analysis of RNA-seq samples. (b) Bar graph summarizing on the x-axis the number of genes that show statistically significant differential expression (DEGs). The types of pairwise comparison are indicated to the right. Blue bars, downregulated DEGs. Orange bars, upregulated DEGs. (c) Average Rad53 ChIP-seq signal across 2-kb intervals centered on at transcription start site (TSS) for statistically significant DEGs (red) and the insignificant (cyan). Left panel shows the result of DEGs from comparison of G1 and HU45 datasets of WT (DEGs: WT(G1 → HU45)) and right panel shows DEGs from comparison of G1 and HU90 datasets (DEGs: WT(G1 → HU90)).
Figure 4—figure supplement 1
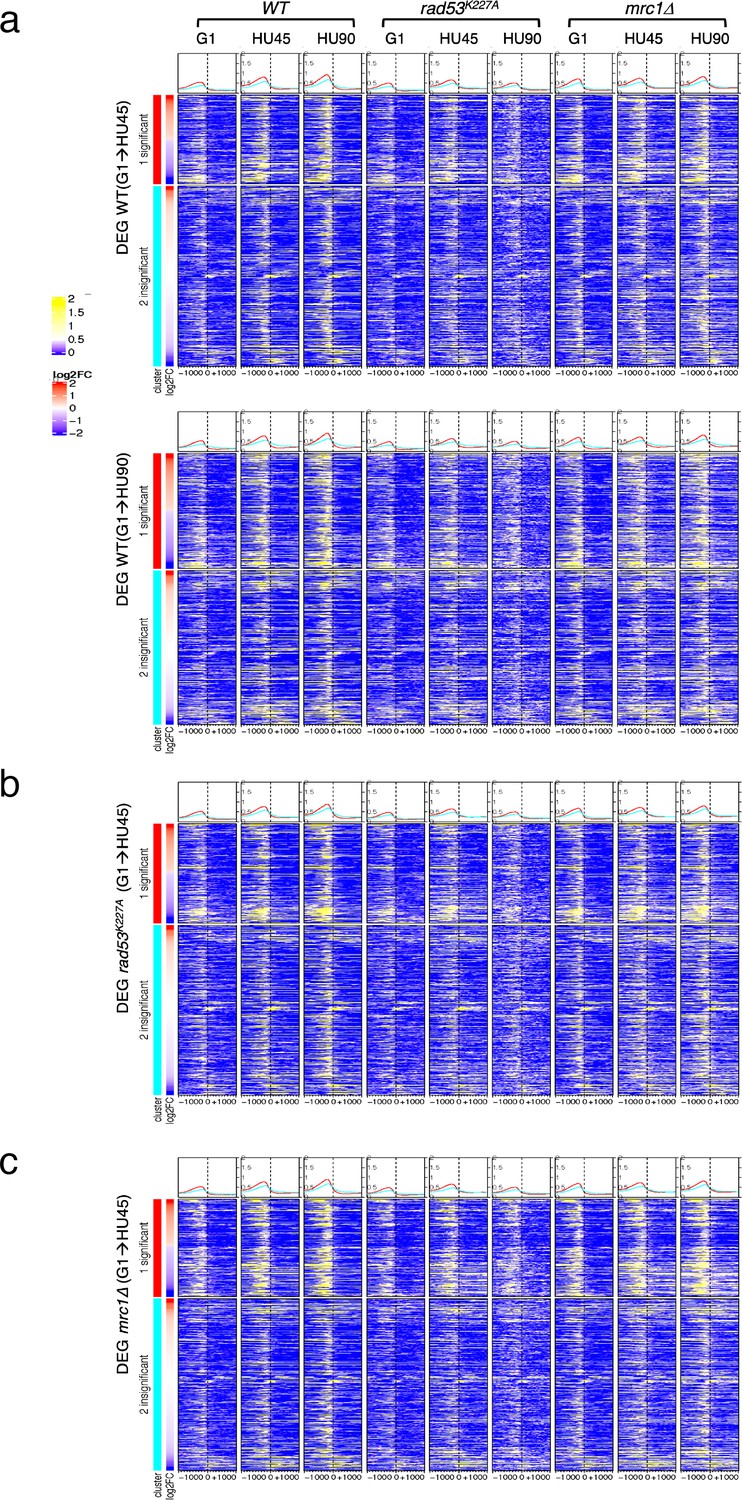
Average Rad53 ChIP-seq signal and heatmaps of signal across 2-kb intervals centered on transcription start site (TSS) for stage-dependent differentially expressed genes (DEGs).
(a) Rad53 ChIP-seq signal in WT, rad53K227A, and mrc1Δ mutant cells at stages G1, HU45, and HU90 for DEGs from WT(G1 → HU45) (upper panel) and from WT(G1 → HU90) (lower panel; the ordering of datasets is the same as in upper panel). (b, c) Rad53 ChIP-seq signal in DEGs from rad53K227A(G1 → HU45) and mrc1∆(G1 → HU45), respectively. The ordering of datasets is the same as in (a). Genes in each heatmap group are arranged in descending order according to the differential expression level (i.e., log2 fold change (log2FC)). The graphs plotted on top of the heatmaps show the average ChIP-seq signals for significant (red) and for the insignificant (cyan) from comparisons indicated at the left of panels.
Figure 5
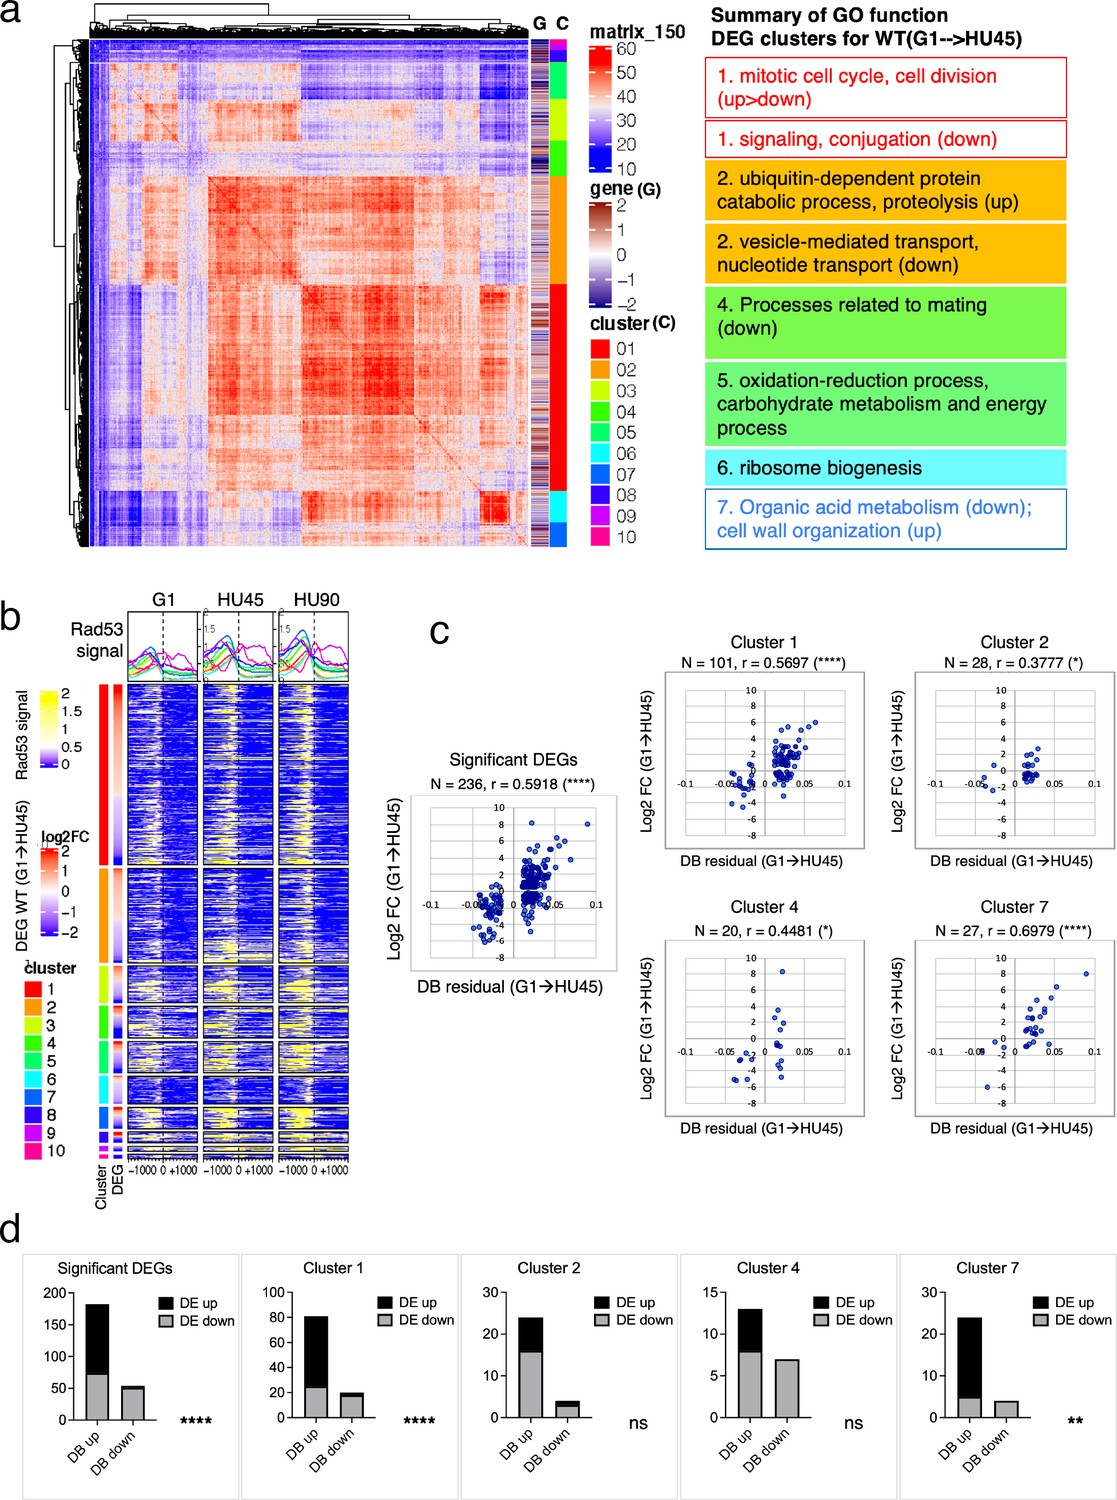
Correlation between differential binding of Rad53 at promoter and differential gene expression (DEG).
(a) Coexpression cluster matrix for significant DEGs in WT(G1 → HU45). Cluster (C): color codes for DEG clusters. Gene (G): level of differential expression in log2FC. (b) Heatmaps of Rad53 ChIP-seq signal across 2-kb intervals centered on transcription start site (TSS) parsed by the DEG clusters in (a). Genes within each cluster are arranged in descending order according to the differential expression level (i.e., log2FC). (c) Scatter plots of Rad53-binding changes at the promoter against expression changes for the 236 significant DEGs in the 435 top DB overlap group (leftmost panel) and subgroups in clusters 1, 2, 4, and 7. Spearman’s correlation r is indicated on top of each plot (****p < 0.0001; *p < 0.05). N, number of genes in the group analyzed. (d) Result of Fisher’s exact test for association between binding changes (DB) and expression changes (DE) for groups presented in (c). ****p < 0.0001; **p < 0.01; ns, not significant. Examples of genes in the cluster are shown below the plot.
Figure 6 with 1 supplement

Origin-proximal differentially expressed genes (DEGs) are biased toward downregulation in the mrc1Δ mutant.
DEGs from HU45 (mrc1Δ vs. WT) comparison were analyzed. (a) Coexpression cluster matrix for significant DEGs. Cluster (C): color codes for DEG clusters. Gene (G): level of differential expression in log2FC. (b) Heatmaps of Rad53 ChIP-seq signal across 2-kb intervals centered on transcription start site (TSS) parsed by the DEG clusters in (a). ChIP-seq signal in WT, rad53K227A, and mrc1Δ mutant cells at stages G1, HU45, and HU90 are shown. (c) Summary of gene–origin relation for DEGs coexpression clusters. Distance between each TSS and its nearest origin center is indicated in pink gradient as well as light purple (<2kb) and dark purple (<1kb). Relative TSS-origin orientation and origin type are indicated. (d) Stacked bar charts presenting number (top panels) and proportion (bottom panels) of down- and upregulated DEGs as categorized by (1) TSS to origin distance (left panels), (2) closest origin type within 5kb of TSS (middle panels; none: no origins within 5kb of TSS), and (3) origin–gene orientation (right panels; CD: co-directional; HO: head-on).
Figure 6—figure supplement 1

Origin-proximal differentially expressed genes (DEGs) are biased toward downregulation in the rad53K227A mutant.
(a) Coexpression cluster matrix for significant DEGs from HU45 (rad53K227A vs. WT) comparison. Cluster (C): color codes for DEG clusters. Gene (G): level of differential expression in log2FC. (b) Heatmaps of Rad53 ChIP-seq signal across 2-kb intervals centered on transcription start site (TSS) for DEG clusters in (a). ChIP-seq signal in WT, rad53K227A, and mrc1Δ mutant cells at stages G1, HU45, and HU90 are shown. (c) Summary of gene–origin relation for DEGs coexpression clusters from HU45 (rad53K227A vs. WT). Distance between each TSS and its nearest origin center is indicated in pink gradient as well as light purple (<2kb) and dark purple (<1kb). Relative TSS-origin orientation and origin type are indicated.
Figure 7
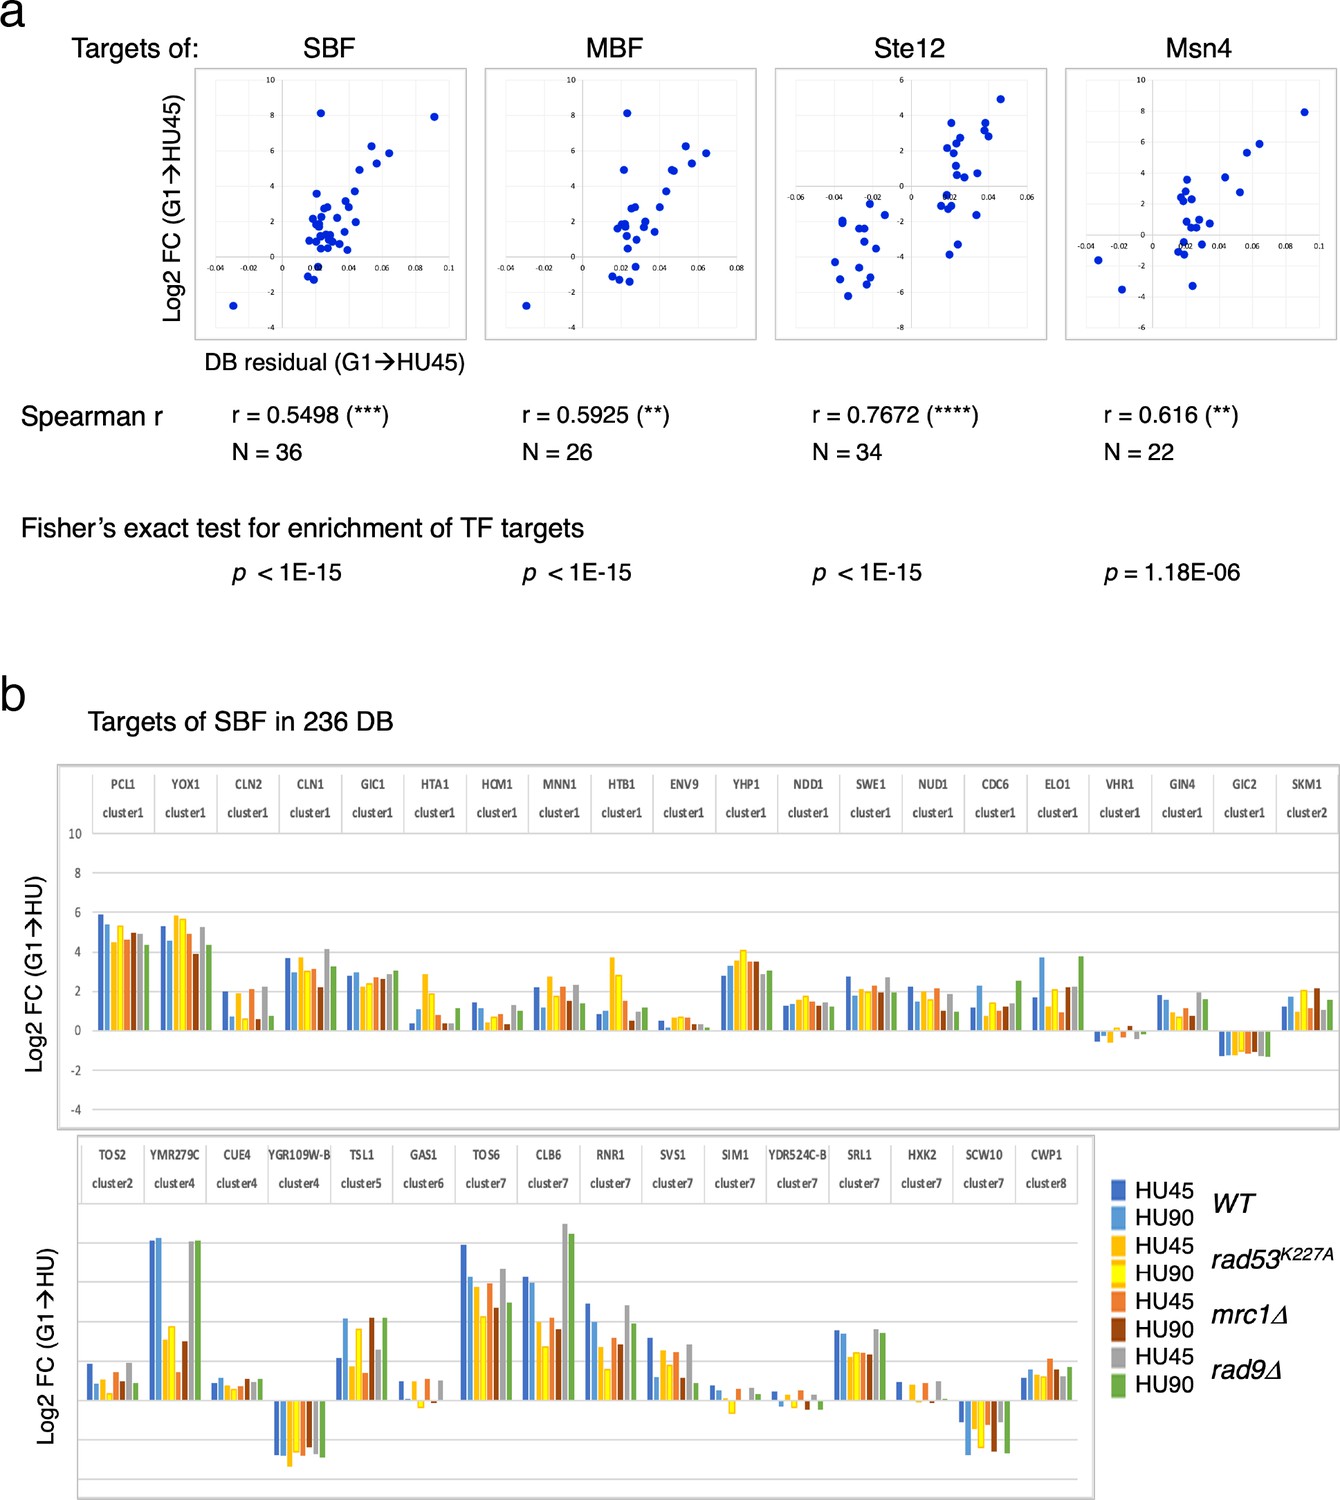
Differential binding of Rad53 at promoters and differential expression of target genes of SBF, MBF, Msn4, and Ste12.
(a) Top panels: scatter plots of binding changes (DB residual) and expression changes (log2FC) for targets of indicated transcription regulators that are in the 236 DB/differentially expressed genes (DEGs) group. Spearman’s correlation r is shown under each plot (****p < 0.0001; ***p < 0.001; **p < 0.01). N, number of genes in the group analyzed. Result of Fisher’s exact test for enrichment of each group of transcription regulator targets in the 236 DB/DEGs is also indicated below. (b) Profiles of differential expression in column graphs for each of the 36 SBF targets in the 236 DB/DEGs. Color-coded columns showing expression change (log2FC (G1 → HU45) and log2FC (G1 → HU90)) extracted from WT, rad53K227A, mrc1Δ, and rad9Δ datasets.
Figure 8
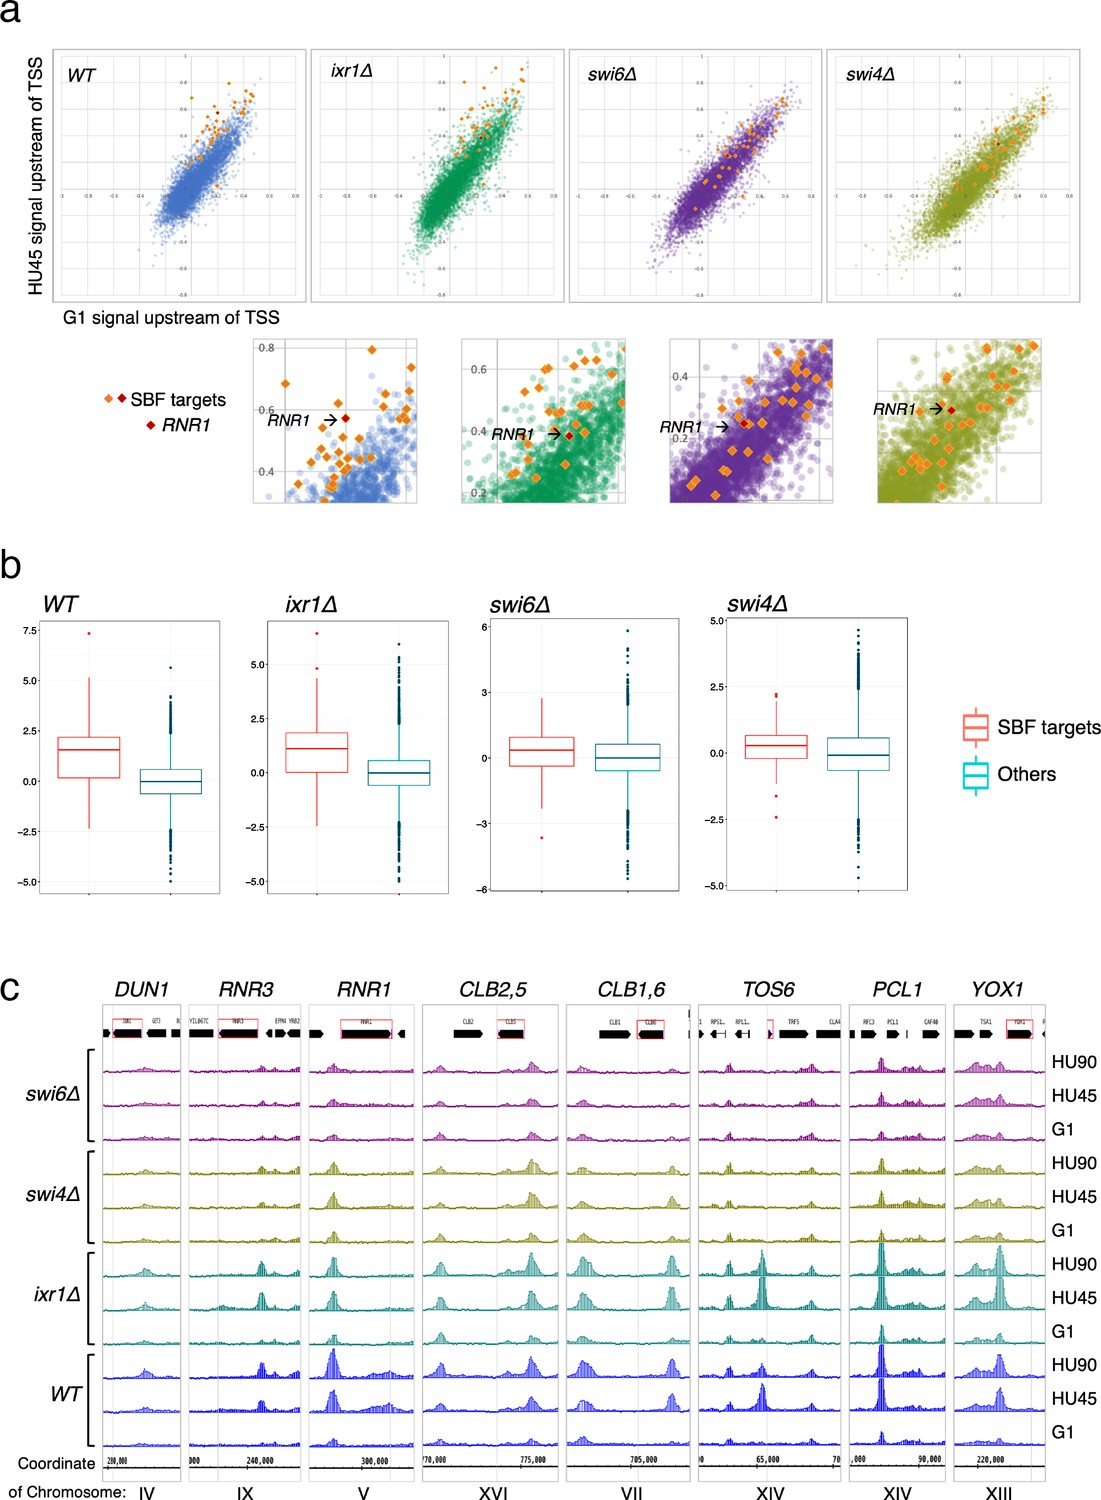
SBF plays a major role in the localization of Rad53 to the promoters of its target genes under replication stress.
(a) Top panels: Scatter plots compare Rad53 ChIP-seq signals in G1 (x-axis) and HU45 (y-axis) at 500-bp intervals upstream of transcription start sites (TSSs) for all genes in WT, ixr1Δ, swi4Δ, and swi6Δ mutants. Signals for SBF targets found in the 435 top DB overlap are shown as orange or red diamond (RNR1 in red diamond). Signals for the rest of genes are shown as dots in color blue (WT), green (ixr1Δ), purple (swi6Δ), and light olive (swi4Δ). Bottom panels: Close-up for specific area from above panels. (b) Box plots showing Z-score distribution for DB residuals (G1 → HU45) for genes that are annotated as targets for both Swi4 and Swi6 (SBF targets) and genes that are otherwise (Others) in WT, ixr1Δ, swi4Δ, and swi6Δ mutants (p value by Wilcoxon rank sum test: WT, 2.2e-16; ixr1Δ, 3.174e−12; swi4Δ, 0.001608; swi6Δ, 0.002857). (c) Coverage tracks showing distribution of Rad53 ChIP-seq signal near selected top DB genes in WT, ixr1Δ, swi4Δ, and swi6Δ mutants at stages of G1, HU45, and HU90.
Tables
Key resources table
| Reagent type (species) or resource | Designation | Source or reference | Identifiers | Additional information |
|---|---|---|---|---|
| Strain, strain background (Saccharomyces cerevisiae) | YS2571 | doi:10.1073/pnas.1404063111 | MATa bar1Δ::TRP1 URA3::BrdU-Inc ade2-1 can1-100 his3-11,–15 leu2-3,112 trp1-1 ura3-1 | |
| Strain, strain background (Saccharomyces cerevisiae) | YS3110 | This paper | MATa rad53K227A::KanMX4 bar1Δ::TRP1 URA3::BrdU-Inc ade2-1 can1-100 his3-11,–15 leu2-3,112 trp1-1 ura3-1 | |
| Strain, strain background (Saccharomyces cerevisiae) | YS3285 | This paper | MATa mrc1Δ::KanMX4 bar1Δ::TRP1 URA3::BrdU-Inc ade2-1 can1-100 his3-11,–15 leu2-3,112 trp1-1 ura3-1 | |
| Strain, strain background (Saccharomyces cerevisiae) | YS3382 | This paper | MATa rad9Δ::HIS3 bar1Δ::TRP1 URA3::BrdU-Inc ade2-1 can1-100 his3-11,–15 leu2-3,112 trp1-1 ura3-1 | |
| Strain, strain background (Saccharomyces cerevisiae) | YS3388 | This paper | MATa ixr1Δ::HIS3 bar1Δ::TRP1 URA3::BrdU-Inc ade2-1 can1-100 his3-11,–15 leu2-3,112 trp1-1 ura3-1 | |
| Strain, strain background (Saccharomyces cerevisiae) | YS3401 | This paper | MATa swi4Δ::HIS3 bar1Δ::TRP1 URA3::BrdU-Inc ade2-1 can1-100 his3-11,–15 leu2-3,112 trp1-1 ura3-1 | |
| Strain, strain background (Saccharomyces cerevisiae) | YS3406 | This paper | MATa swi6Δ::HIS3 bar1Δ::TRP1 URA3::BrdU-Inc ade2-1 can1-100 his3-11,–15 leu2-3,112 trp1-1 ura3-1 | |
| Strain, strain background (Saccharomyces cerevisiae) | YS2828 | doi:10.1101/gr.195248.115 | MATa URA3::BrdU-Inc ade2-1 can1-100 his3-11,–15 leu2-3,112 trp1-1 ura3-1 | |
| Strain, strain background (Saccharomyces cerevisiae) | YS3066 | doi:10.1101/gr.195248.116 | MATa sml1Δ::HIS3 URA3::BrdU-Inc ade2-1 can1-100 his3-11,–15 leu2-3,112 trp1-1 ura3-1 | |
| Strain, strain background (Saccharomyces cerevisiae) | YS3075 | doi:10.1101/gr.195248.117 | MATa mec1Δ::TRP1 sml1Δ::HIS3 URA3::BrdU-Inc ade2-1 can1-100 his3-11,–15 leu2-3,112 trp1-1 ura3-1 | |
| Strain, strain background (Saccharomyces cerevisiae) | YS3077 | doi:10.1101/gr.195248.118 | MATa rad53∆::KanMX sml1Δ::HIS3 URA3::BrdU-Inc ade2-1 can1-100 his3-11,–15 leu2-3,112 trp1-1 ura3-1 | |
| Antibody | Anti-Rad53 antibody | Abcam | Cat# ab104232, RRID:AB_2687603 | |
| Antibody | Anti-Histone H2A (phospho S129) antibody | Abcam | Cat# ab15083, RRID:AB_301630 | |
| Antibody | Anti-Cdc45 antibody (polyclonal CS1485) | doi:10.1016/j.molcel.2006.07.033 | ||
| Antibody | Anti-Orc6 antibody (monoclonal SB49) | Other | Stillman lab | |
| Antibody | Anti Sml1 | Suppressor of Mec1 lethality antibody | Agrisera | Cat# AS10 847 | |
| Peptide, recombinant protein | α-Factor | Other | WHWLQLKPGQPMY | |
| Commercial assay or kit | TruSeq ChIP Library Preparation Kit | Illumina | Cat# IP-202-1012, IP-202-1024 | |
| Commercial assay or kit | TruSeq stranded mRNA library preparation kit | Illumina | Cat# 20020594 | |
| Commercial assay or kit | MinElute PCR purification kit | Qiagen | Cat# 28004 | |
| Chemical compound, drug | Hydroxyurea | Sigma | H8627-25G | |
| Software, algorithm | GraphPad Prism 9 | GraphPad | RRID:SCR_002798 | |
| Software, algorithm | Bowtie | doi:10.1002/0471250953.bi1107s32 | RRID:SCR_005476 | |
| Software, algorithm | bamCoverage | doi:10.1093/nar/gku365 | ||
| Software, algorithm | STAR | doi:10.1093/bioinformatics/bts635 | ||
| Software, algorithm | MACS2 | RRID:SCR_013291 | ||
| Software, algorithm | ChIPpeakAnno | RRID:SCR_012828 | ||
| Software, algorithm | DescTools | Andri Signorell et mult. al. (2021) | DescTools: Tools for descriptive statistics. R package version 0.99.41, 598 https://cran.r-project.org/package=DescTools |
Table 1
Yeast strains used in this study.
| Strain | Genotype | Source |
|---|---|---|
| YS2571 | MATa bar1Δ::TRP1 URA3::BrdU-Inc ade2-1 can1-100 his3-11,–15 leu2-3,112 trp1-1 ura3-1 | Sheu et al., 2014 |
| YS3110 | MATa rad53K227A::KanMX4 bar1Δ::TRP1 URA3::BrdU-Inc ade2-1 can1-100 his3-11,–15 leu2-3,112 trp1-1 ura3-1 | This study |
| YS3285 | MATa mrc1Δ::KanMX4 bar1Δ::TRP1 URA3::BrdU-Inc ade2-1 can1-100 his3-11,–15 leu2-3,112 trp1-1 ura3-1 | This study |
| YS3382 | MATa rad9Δ::HIS3 bar1Δ::TRP1 URA3::BrdU-Inc ade2-1 can1-100 his3-11,–15 leu2-3,112 trp1-1 ura3-1 | This study |
| YS3388 | MATa ixr1Δ::HIS3 bar1Δ::TRP1 URA3::BrdU-Inc ade2-1 can1-100 his3-11,–15 leu2-3,112 trp1-1 ura3-1 | This study |
| YS3401 | MATa swi4Δ::HIS3 bar1Δ::TRP1 URA3::BrdU-Inc ade2-1 can1-100 his3-11,–15 leu2-3,112 trp1-1 ura3-1 | This study |
| YS3406 | MATa swi6Δ::HIS3 bar1Δ::TRP1 URA3::BrdU-Inc ade2-1 can1-100 his3-11,–15 leu2-3,112 trp1-1 ura3-1 | This study |
| YS2828 | MATa URA3::BrdU-Inc ade2-1 can1-100 his3-11,–15 leu2-3,112 trp1-1 ura3-1 | Sheu et al., 2016 |
| YS3066 | MATa sml1Δ::HIS3 URA3::BrdU-Inc ade2-1 can1-100 his3-11,–15 leu2-3,112 trp1-1 ura3-1 | Sheu et al., 2016 |
| YS3075 | MATa mec1Δ::TRP1 sml1Δ::HIS3 URA3::BrdU-Inc ade2-1 can1-100 his3-11,–15 leu2-3,112 trp1-1 ura3-1 | Sheu et al., 2016 |
| YS3077 | MATa rad53∆::KanMX sml1Δ::HIS3 URA3::BrdU-Inc ade2-1 can1-100 his3-11,–15 leu2-3,112 trp1-1 ura3-1 | Sheu et al., 2016 |
Additional files
Download links
A two-part list of links to download the article, or parts of the article, in various formats.
Downloads (link to download the article as PDF)
Open citations (links to open the citations from this article in various online reference manager services)
Cite this article (links to download the citations from this article in formats compatible with various reference manager tools)
Prevalent and dynamic binding of the cell cycle checkpoint kinase Rad53 to gene promoters
eLife 11:e84320.
https://doi.org/10.7554/eLife.84320


