Mitotic chromosomes scale to nuclear-cytoplasmic ratio and cell size in Xenopus
- Department of Molecular and Cell Biology, University of California, Berkeley, United States
- Department of Systems Biology, University of Massachusetts Medical School, United States
- Advanced BioImaging Facility, McGill University, Canada
- Howard Hughes Medical Institute, United States
Figures
Figure 1 with 5 supplements
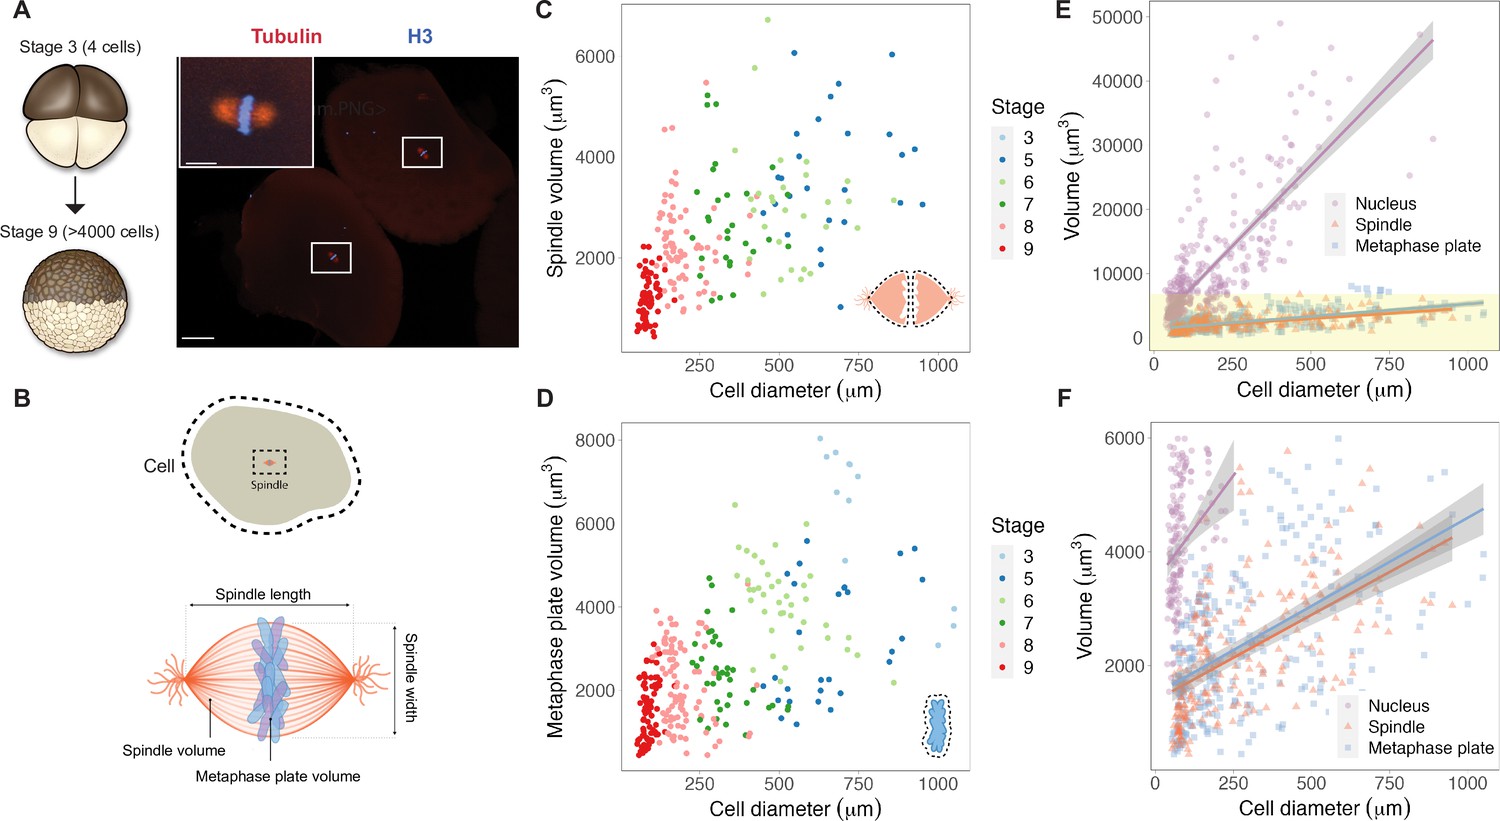
Metaphase plates scale continuously with cell size.
(A) Experimental scheme for whole-embryo immunofluorescence. Blastula-stage embryos undergoing synchronous divisions were fixed during mitosis and stained with anti-histone H3 and anti-tubulin antibodies to visualize mitotic chromosomes and spindles, respectively. Representative image of two cells from a stage 6 embryo with white rectangles outlining mitotic spindles, scale bar = 100 μm. Inset: magnified view of one of the mitotic spindles, scale bar = 20 μm. (B) Dimensions of cells and spindles were either directly measured or calculated (for details, see ‘Materials and methods’). (C) Measurements of spindle volume or (D) total mitotic chromosome (metaphase plate) volume plotted against cell diameter, colored by developmental stage. (E) Volumes of spindles, nuclei, and metaphase plates all plotted against cell diameter, fit with linear models. 95% confidence intervals shown in gray. (F) Zoom-in of yellow panel shown in (E). n = 3 biological replicates. Fold-change in size of nuclei (approximately 10-fold), spindles (approximately 2-fold), and metaphase plates (approximately 3-fold) were estimated by calculating the difference in median size in stage 3 vs. stage 8 embryos. Source data are available in Figure 1—source data 1.
-
Figure 1—source data 1
This file contains all of the source data for Figure 1 and related supplemental figures.
- https://cdn.elifesciences.org/articles/84360/elife-84360-fig1-data1-v2.zip
Figure 1—figure supplement 1
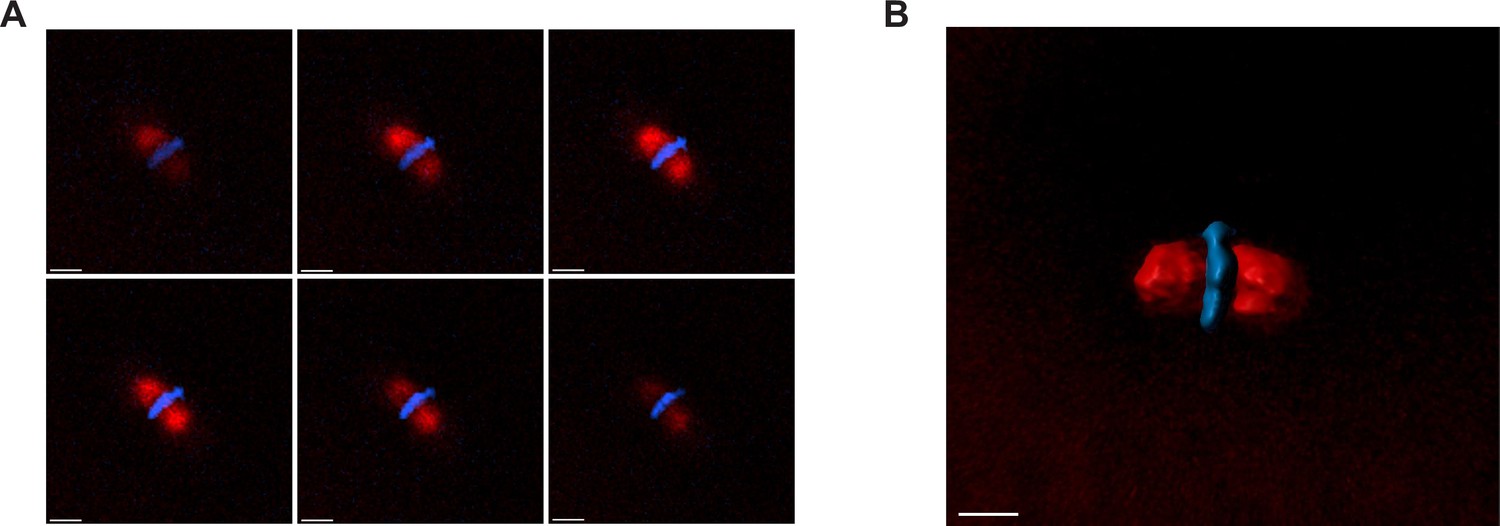
3D segmentation of mitotic spindles.
(A) Example z-stacks of the representative spindle shown in Figure 1A. (B) 3D segmentation of the representative spindle, performed using Imaris (see ‘Materials and methods’ for details). Scale bar = 20 μm.
Figure 1—figure supplement 2
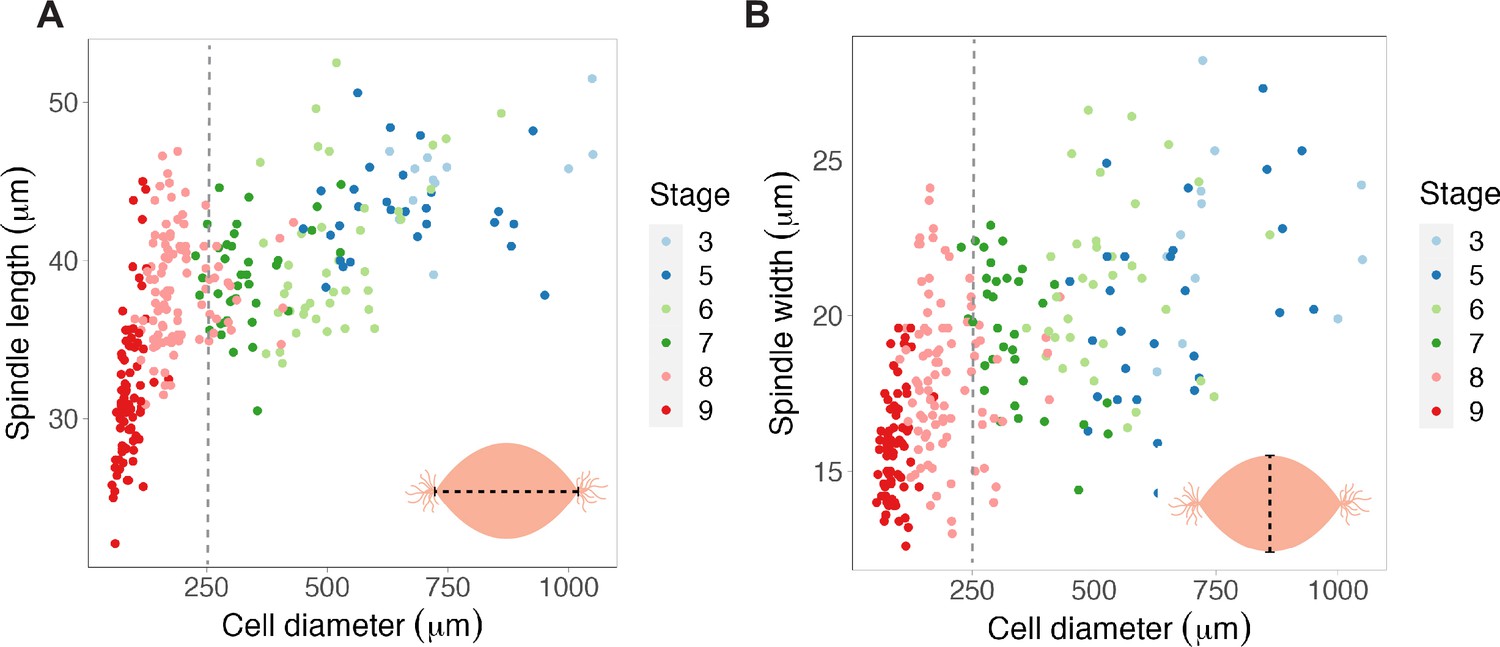
Scaling of spindle length vs. width to cell size.
(A) Spindle lengths and (B) widths plotted against cell diameter. Gray dotted lines are placed at ~250 μm to help visualize the inflection point reached in spindle length scaling, but not in spindle width scaling. n = 3 biological replicates. Source data are available in Figure 1—source data 1.
Figure 1—figure supplement 3
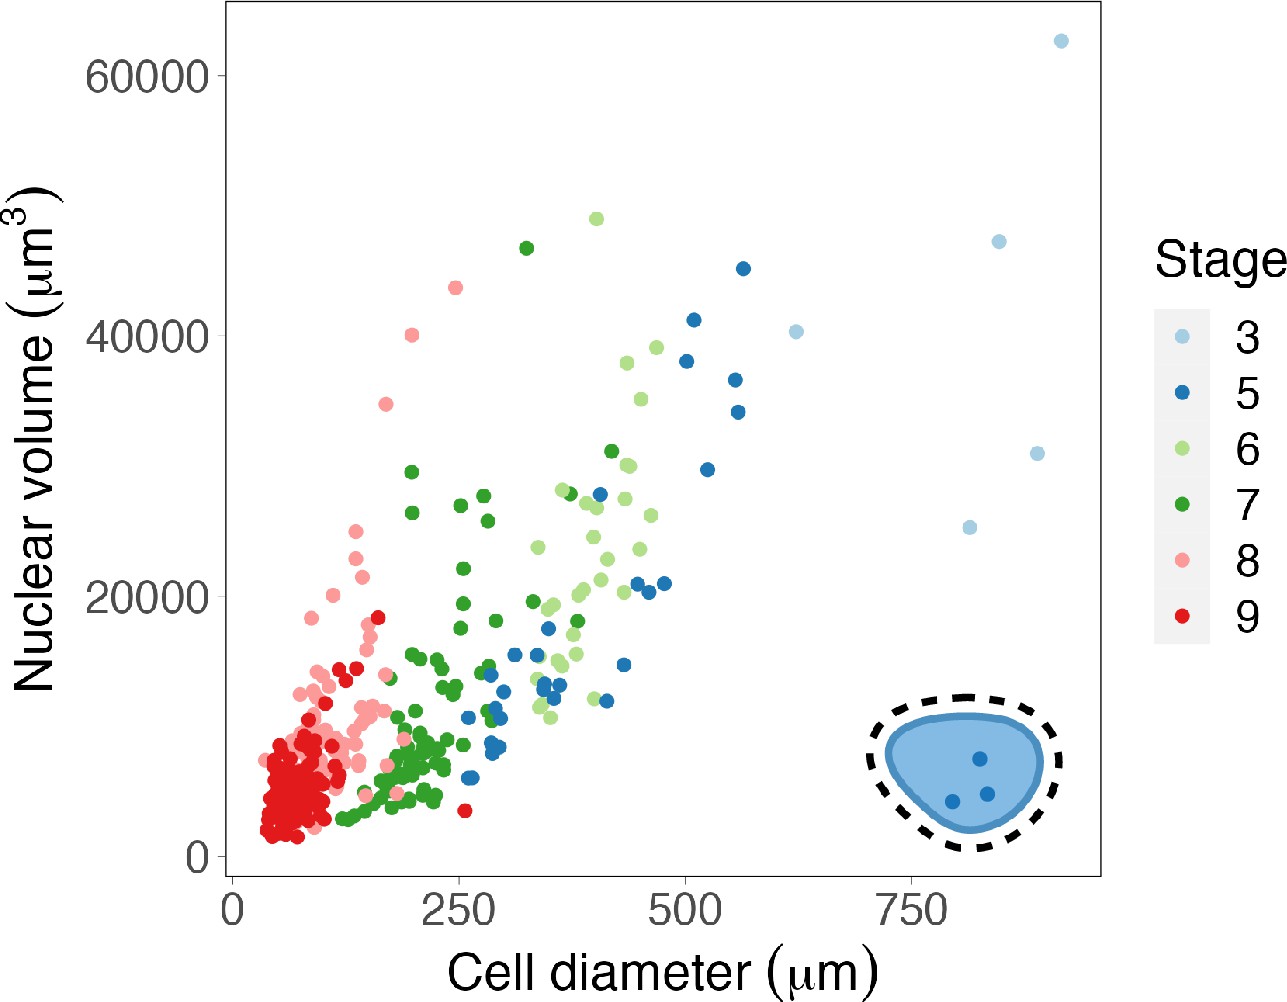
Nuclear volumes scale continuously with cell size.
Nuclear volumes plotted against cell diameter. Raw data used with permission from Jevtić and Levy, 2015. Source data are available in Figure 1—source data 1.
Figure 1—figure supplement 4
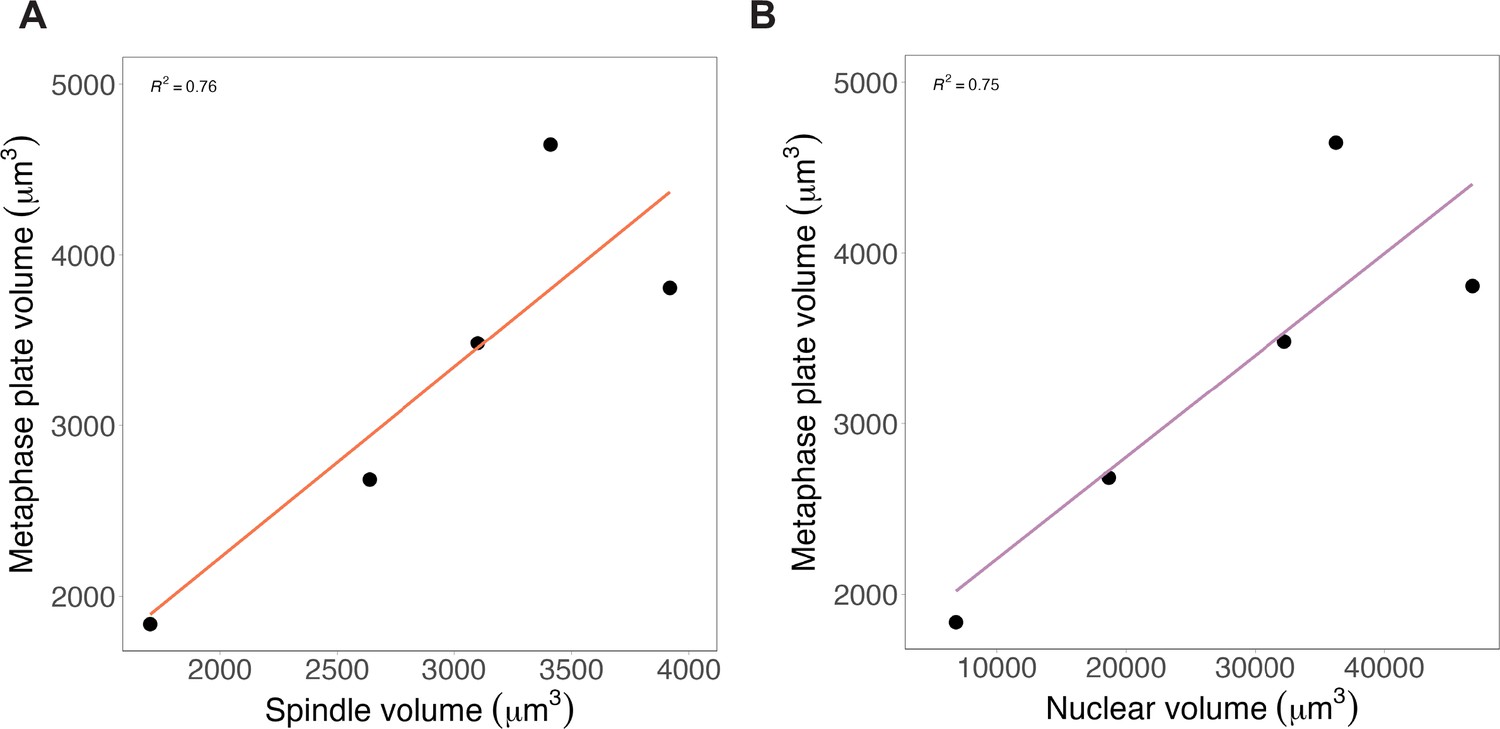
Metaphase plates scale similarly with both nuclei and spindles.
(A) Average total mitotic chromosome volumes plotted against (A) spindle volumes or (B) nuclear volumes, binned by cell diameter (bin 1 = 35–239 μm, bin 2 = 239–442 μm, bin 3 = 442–645 μm, bin 4 = 645–848 μm, bin 5 = 848–10,500 μm). Data are fit with a linear regression, n = 3 biological replicates. Source data are available in Figure 1—source data 1.
Figure 1—figure supplement 5
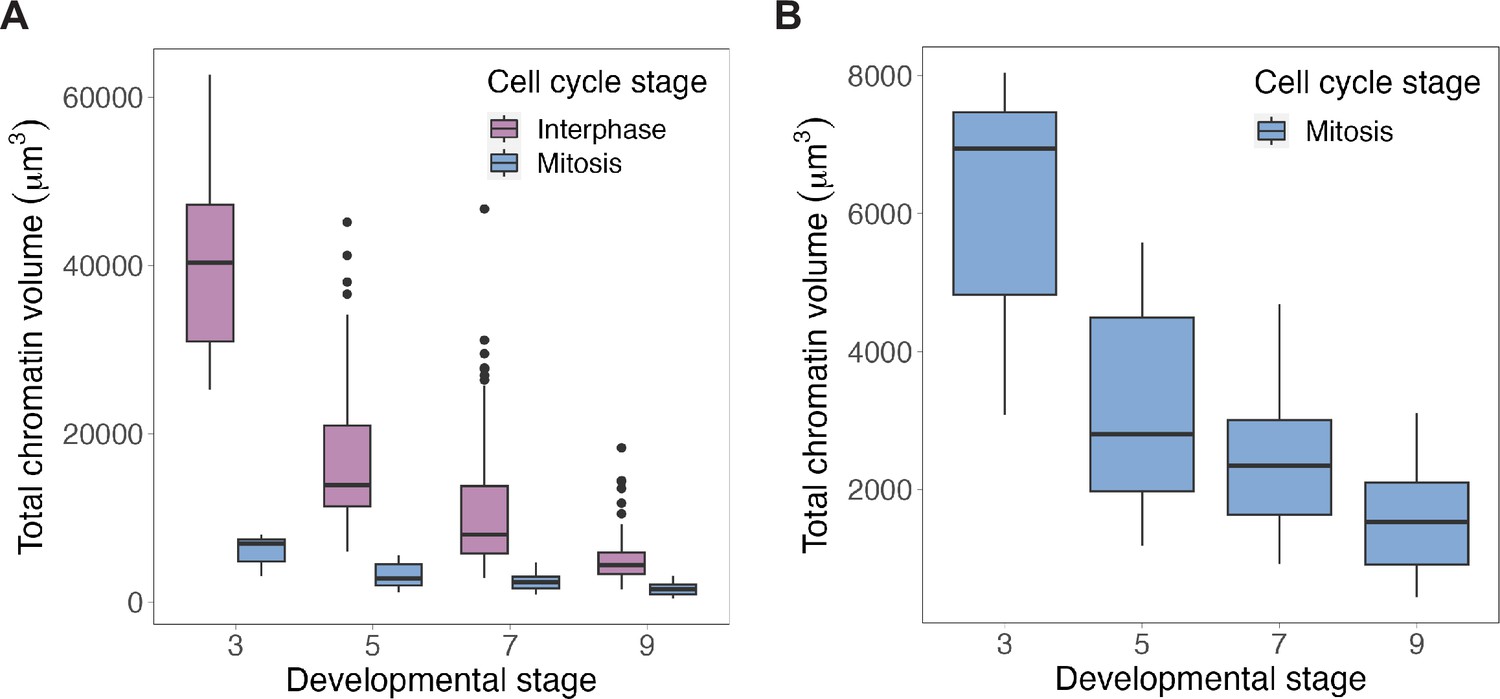
Total chromatin volumes in interphase (nuclei) or mitosis (metaphase plates) during early cleavage divisions.
(A) Chromatin volumes, either in interphase (purple) or metaphase (blue), binned by developmental stage. (B) Zoomed-in view of metaphase plate volumes. n = 3 biological replicates. Source data are available in Figure 1—source data 1.
Figure 2 with 1 supplement
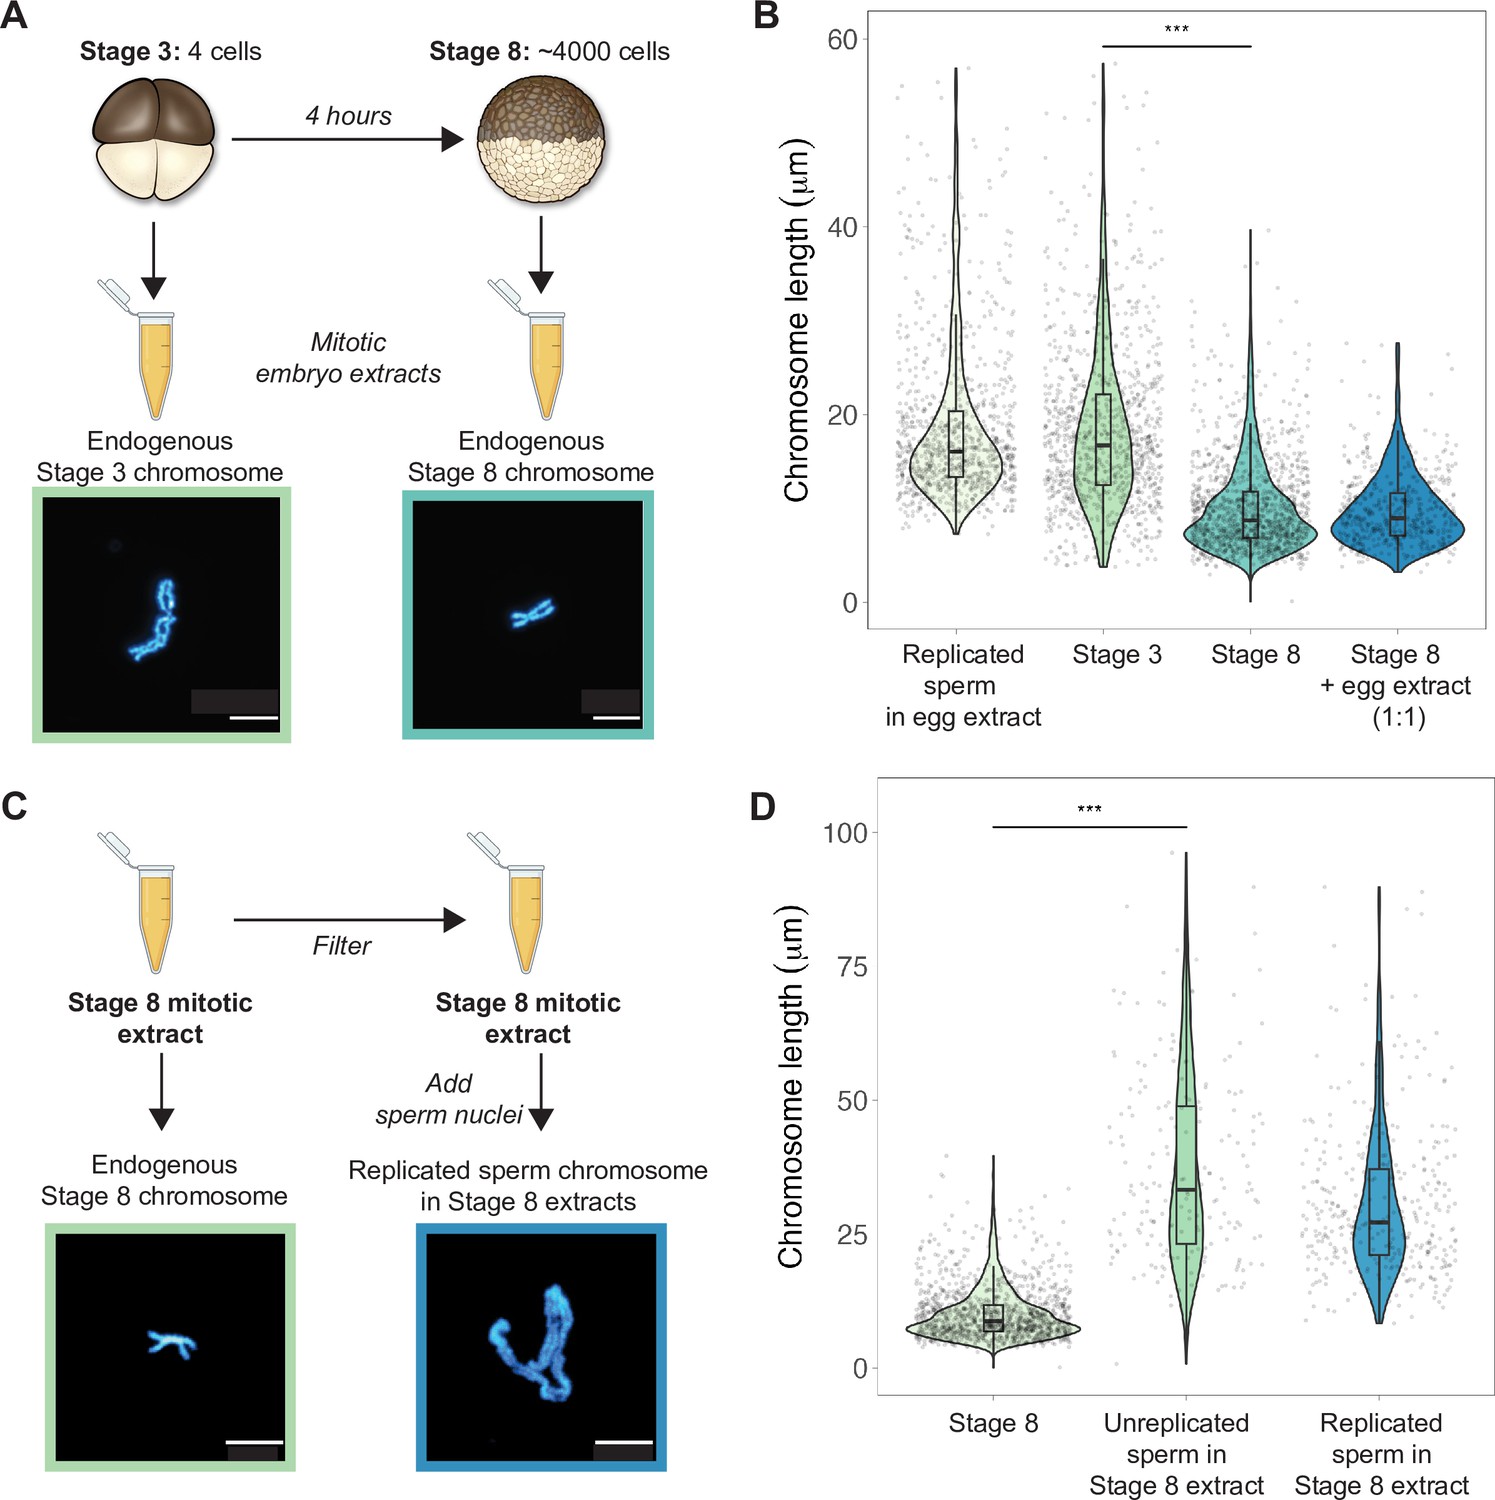
Mitotic chromosomes scale length-wise.
(A) Mitotic extracts were prepared from stage 3 or stage 8 embryos, and single endogenous mitotic chromosomes were centrifuged onto coverslips and stained with Hoechst DNA dye. Representative images of stage 3 and stage 8 chromosomes are shown. (B) Length distributions of sperm mitotic chromosomes replicated in egg extract, mitotic chromosomes isolated from embryo extracts and stage 8 embryo extract chromosomes after mixing 1:1 with egg extract. (C) Stage 8 extracts were filtered to remove endogenous chromosomes, then unreplicated or replicated sperm nuclei were added to form mitotic chromosomes. Representative images of an endogenous stage 8 chromosome or replicated sperm chromosome formed in stage 8 extracts. (D) Quantification of chromosome lengths for the experiment shown in (C), for both replicated and unreplicated sperm conditions. n = 3 biological replicates, >50 chromosomes per replicate. Scale bar = 10 μm. ***p<0.001 by the Mann–Whitney U test. Source data are available as Figure 2—source data 1.
-
Figure 2—source data 1
This file contains all of the source data for Figure 2 and the related supplemental figure.
- https://cdn.elifesciences.org/articles/84360/elife-84360-fig2-data1-v2.zip
Figure 2—figure supplement 1
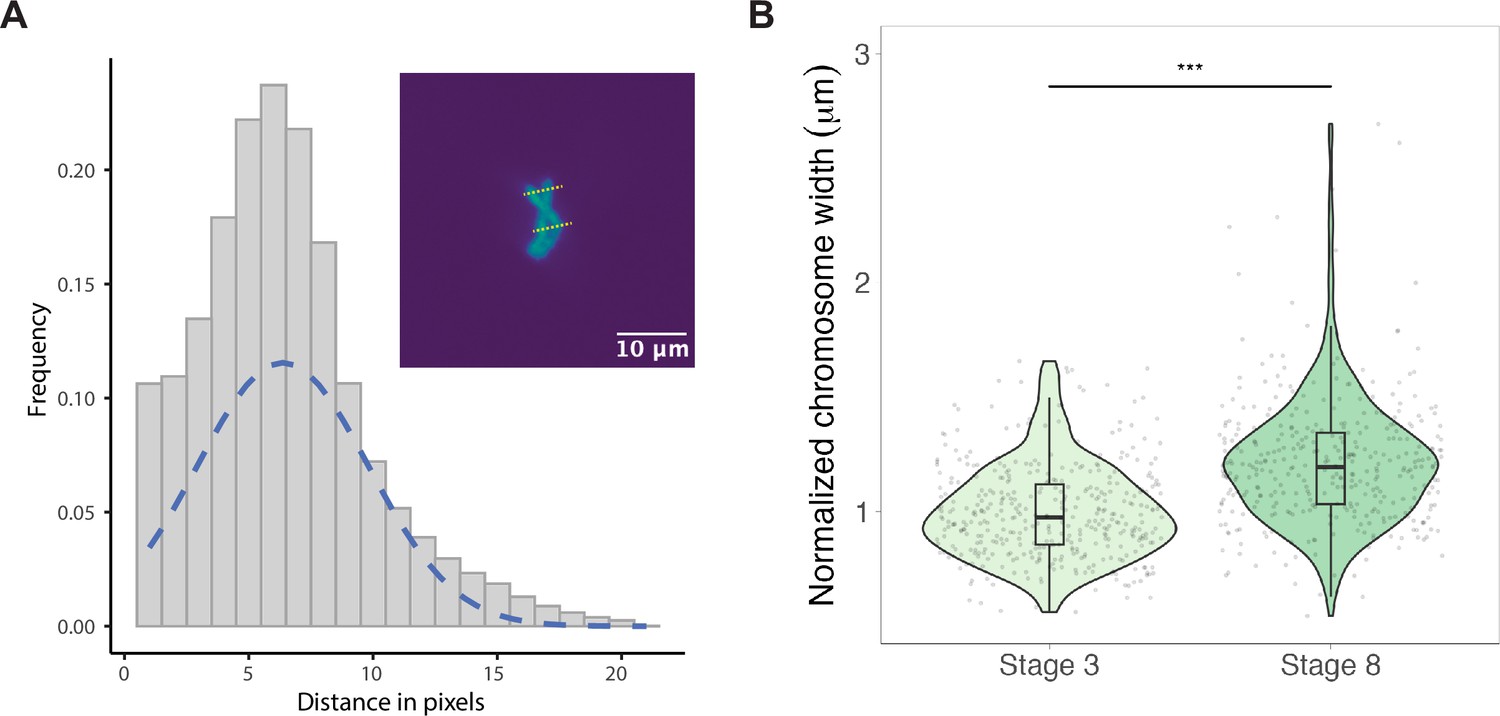
Chromosome width increases slightly during early embryo cleavage stages.
(A) Chromosome widths were calculated by performing a line scan across the long axis of the chromosome followed by a Gaussian fit. The full width half max (FWHM) of the Gaussian curve was used to determine chromosome width. (B) Chromosome widths of stage 3 vs. stage 8 chromosomes (normalized to the median of stage 3 widths) isolated from mitotic embryo extracts, showing a 1.2-fold increase in median width from stage 3 to stage 8. n = 3 biological replicates. **p<0.001 by the Mann–Whitney U test. Source data are available as Figure 2—source data 1.
Figure 3 with 6 supplements
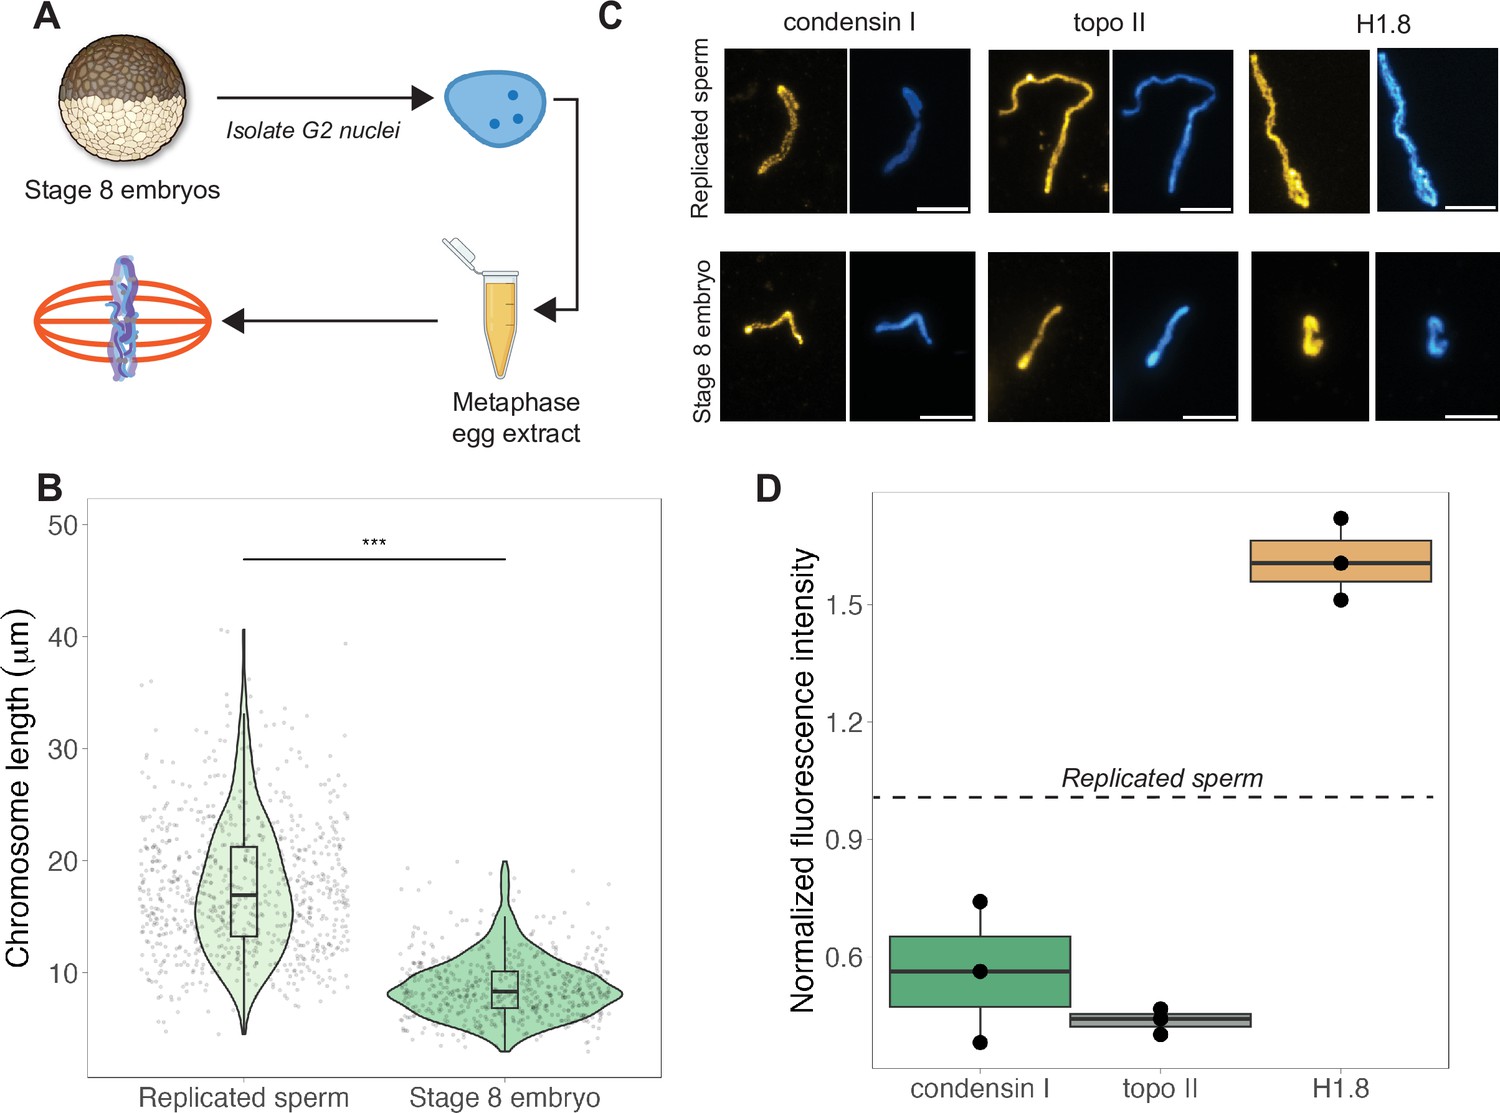
Egg extracts recapitulate mitotic chromosome scaling through differential recruitment of condensin I, topo II, and histone H1.8.
(A) Experimental scheme (also see ‘Materials and methods’). Stage 8 embryos were arrested in G2 using cycloheximide, then fractionated to isolate cytoplasm containing nuclei. Embryo nuclei were pelleted and added to metaphase-arrested egg extracts to form mitotic spindles and chromosomes. (B) Lengths of replicated sperm chromosomes or stage 8 embryo chromosomes formed in metaphase egg extracts. (C) Representative images of mitotic chromosomes prepared by adding replicated sperm nuclei (top) or stage 8 embryo nuclei (bottom) to metaphase egg extracts, and stained with antibodies for condensin I (xCAP-G), topo II, or histone H1.8. Scale bar = 10 μm. (D) Abundances of topo II, condensin I, and histone H1.8 (calculated by normalizing immunofluorescence signal to Hoechst signal, see ‘Materials and methods’ for details) on short embryo chromosomes normalized to long sperm chromosomes (denoted by dotted line), from three different extracts. n = 3 biological replicates, >50 chromosomes per replicate. ***p<0.001 by the Mann–Whitney U test. Source data are available in Figure 3—source data 1.
-
Figure 3—source data 1
This file contains all of the source data for Figure 3 and related supplemental figures.
- https://cdn.elifesciences.org/articles/84360/elife-84360-fig3-data1-v2.zip
Figure 3—figure supplement 1
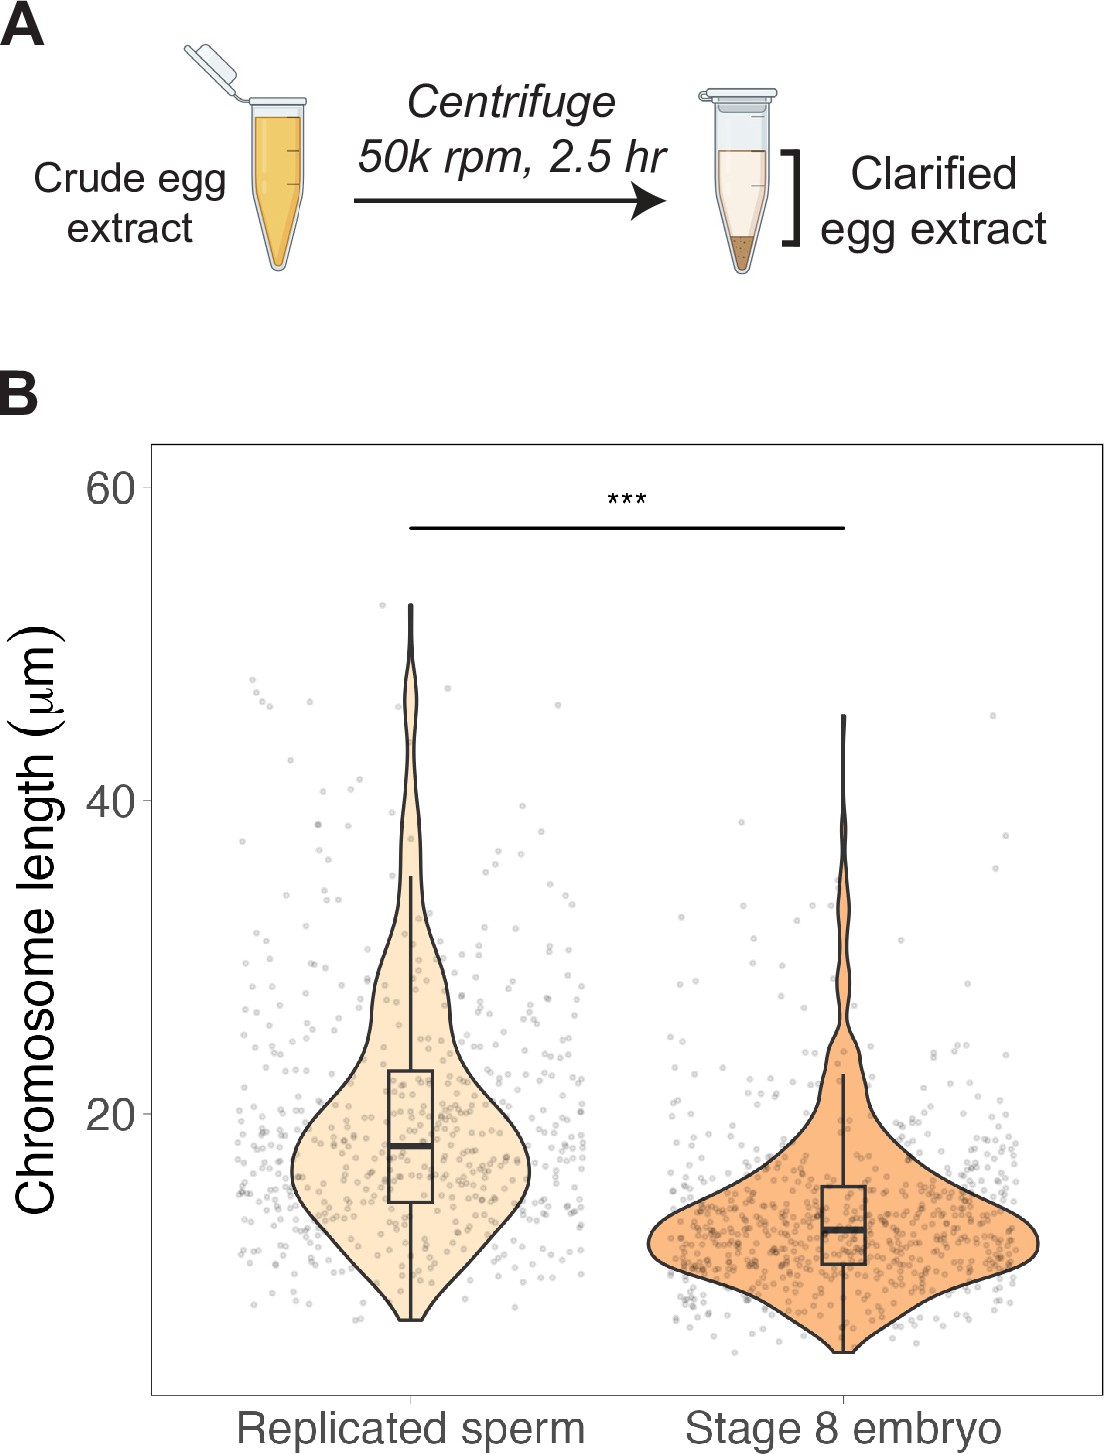
Clarified egg extracts support mitotic chromosome scaling.
(A) Crude extracts were centrifuged at high speed to pellet membranes. (B) Quantification of mitotic chromosome lengths from either replicated sperm nuclei or stage 8 embryo nuclei added to clarified metaphase egg extracts. n = 3 biological replicates, >50 chromosomes per replicate. ***p<0.001 by the Mann–Whitney U test. Source data are available in Figure 3—source data 1.
Figure 3—figure supplement 2
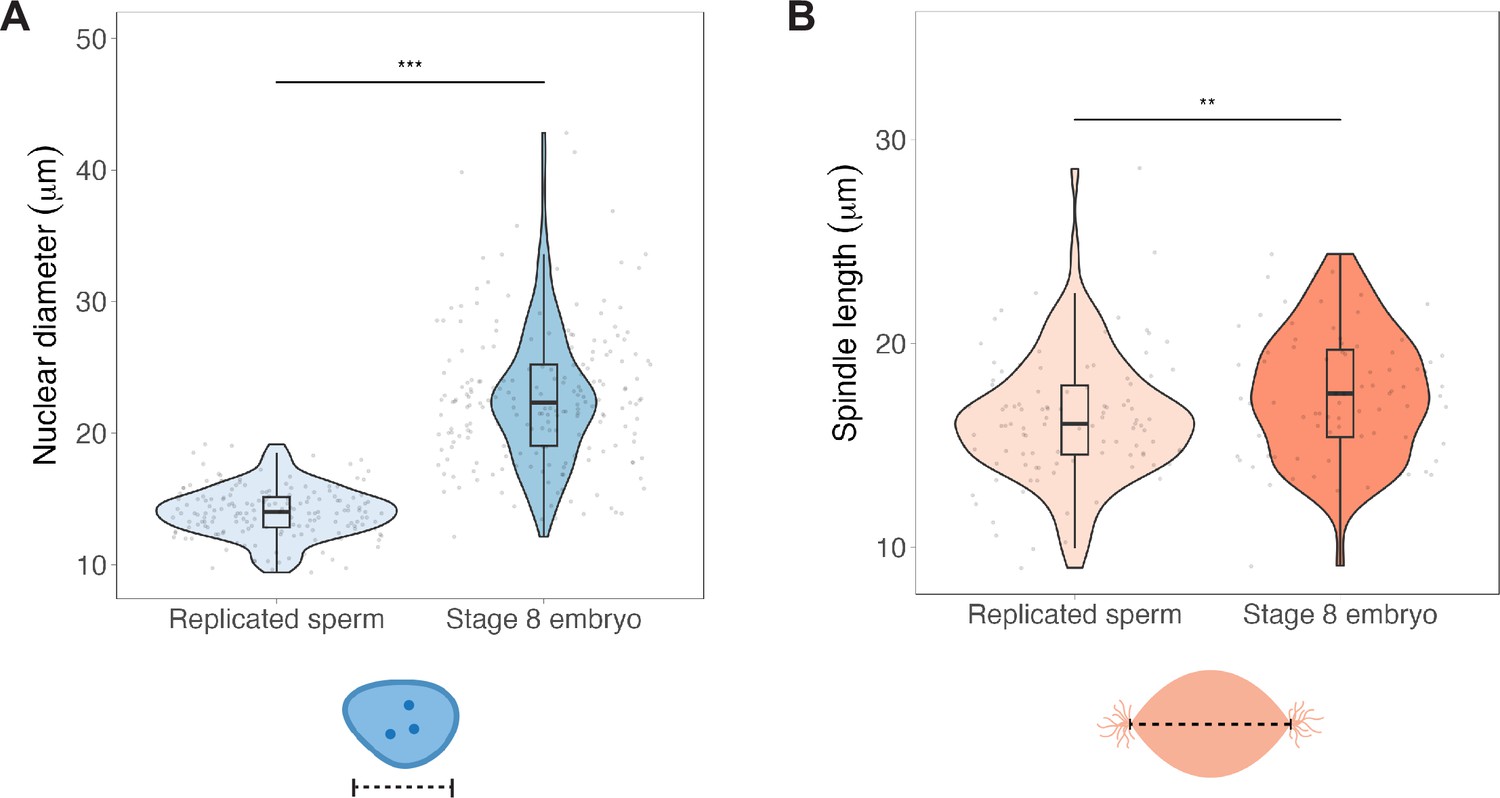
Nuclei and spindles do not scale with mitotic chromosome size in egg extracts.
(A) Diameters of replicated sperm nuclei or stage 8 embryo nuclei measured just before addition to metaphase egg extracts. (B) Lengths of spindles formed around either replicated sperm nuclei or embryo nuclei in metaphase egg extracts. n = 3 biological replicates, >25 structures per replicate. ***p<0.001, **p=0.004 by the Mann–Whitney U test. Source data are available in Figure 3—source data 1.
Figure 3—figure supplement 3
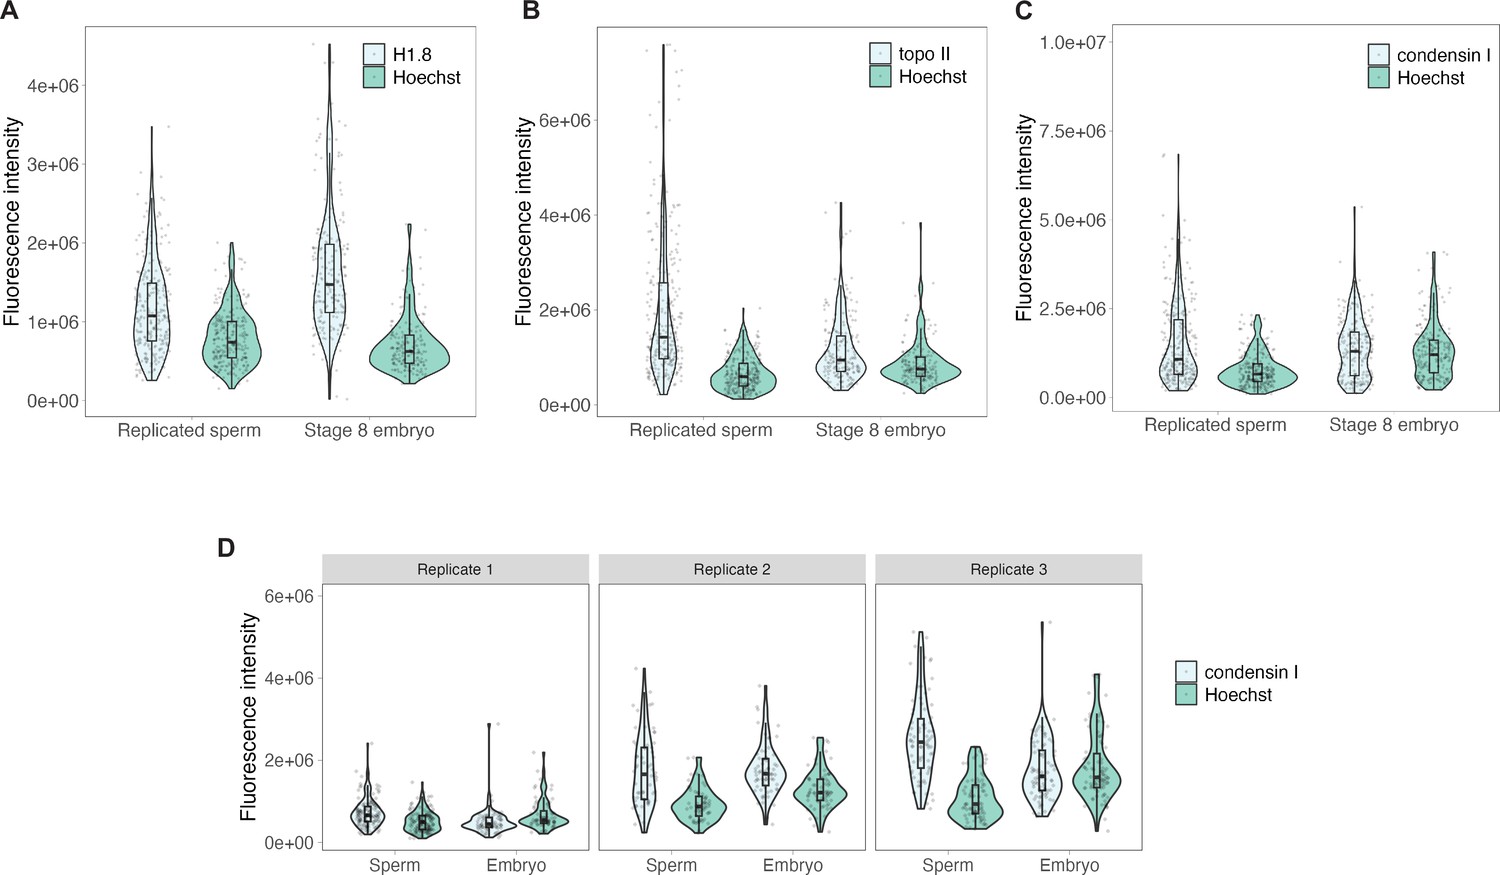
Raw fluorescence intensities for embryo vs. sperm immunofluorescence.
(A–C) Background-subtracted fluorescence intensities for data presented in Figure 3D, with protein of interest and Hoechst signals plotted separately. n = 3 biological replicates, >50 chromosomes per replicate. (D) Raw intensities for three biological replicates of condensin I immunofluorescence experiment. Source data are available in Figure 3—source data 1.
Figure 3—figure supplement 4
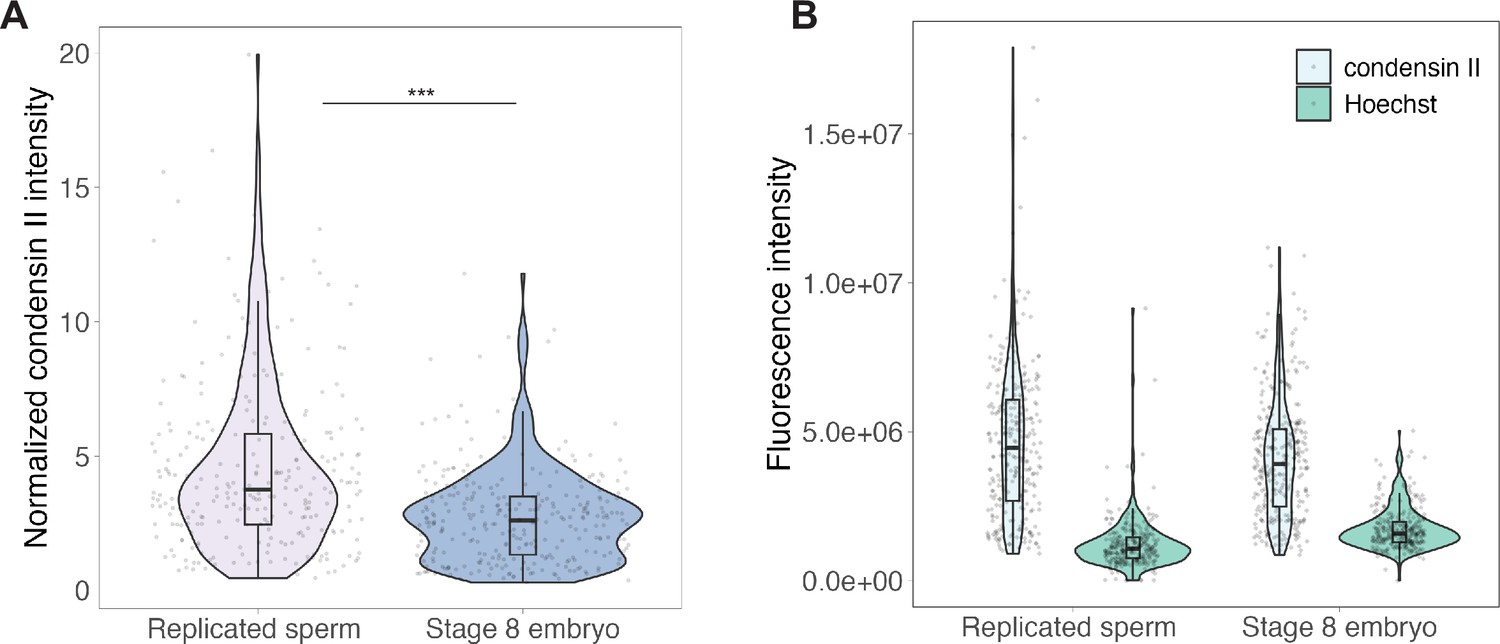
Immunofluorescence of condensin II on sperm vs. embryo chromosomes formed in egg extracts.
(A) Condensin II intensities of replicated sperm or stage 8 embryo chromosomes, normalized to Hoechst signal. (B) Raw fluorescence intensities for condensin II (xCAP-G2) or Hoechst for the data shown in (A). n = 3 biological replicates, >50 chromosomes per replicate. ***p<0.001 by the Mann–Whitney U test. Source data are available in Figure 3—source data 1.
Figure 3—figure supplement 5
Scaling factors are reloaded onto embryo chromosomes after an additional interphase in egg extracts.
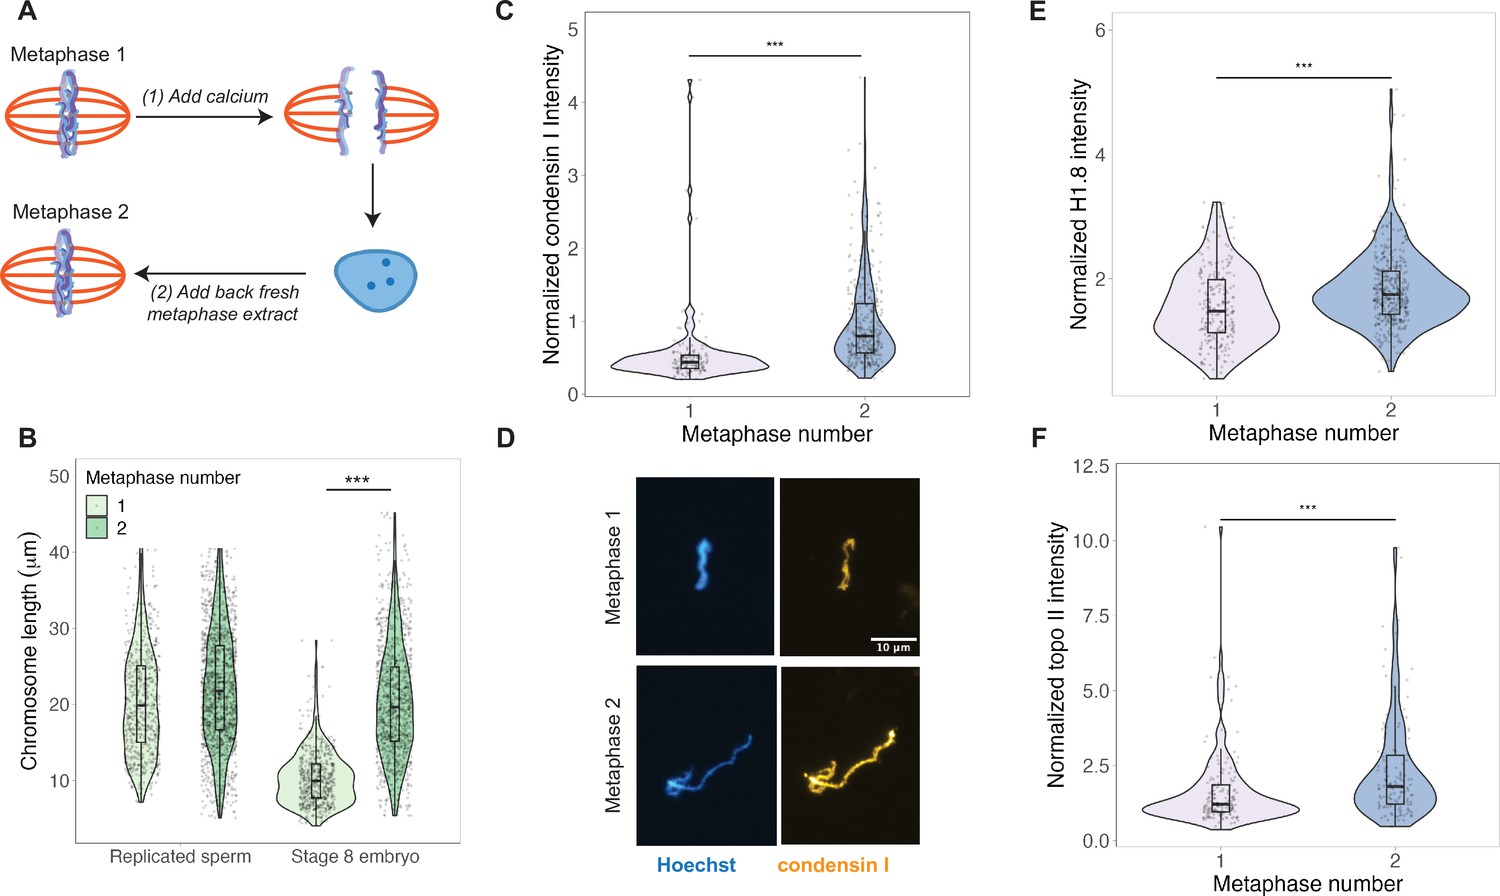
(A) Schematic of anaphase experiment. Calcium is added to send metaphase spindles containing embryo chromosomes into anaphase, and then interphase. After nuclei were formed, fresh metaphase extract was added to trigger a second round of mitotic chromosome formation. (B) Chromosome lengths for the first and second metaphase, for both replicated sperm and stage 8 embryo mitotic chromosomes. (C) Abundance of condensin I (xCAP-G) on stage 8 embryo chromosomes in the first or second metaphase. (D) Representative images of embryo chromosomes from metaphase 1 or metaphase 2, stained for condensin I. (E, F) Abundance of histone H1.8 and topo II on stage 8 embryo chromosomes in the first or second metaphase. Based on median values, condensin I increased 2-fold, histone H1.8 increased 1.2-fold, and topo II increased 1.5-fold from the first to second metaphase. n = 3 biological replicates, >50 chromosomes per replicate. ***p<0.001 by the Mann–Whitney U test. Source data are available in Figure 3—source data 1.
Figure 3—figure supplement 6
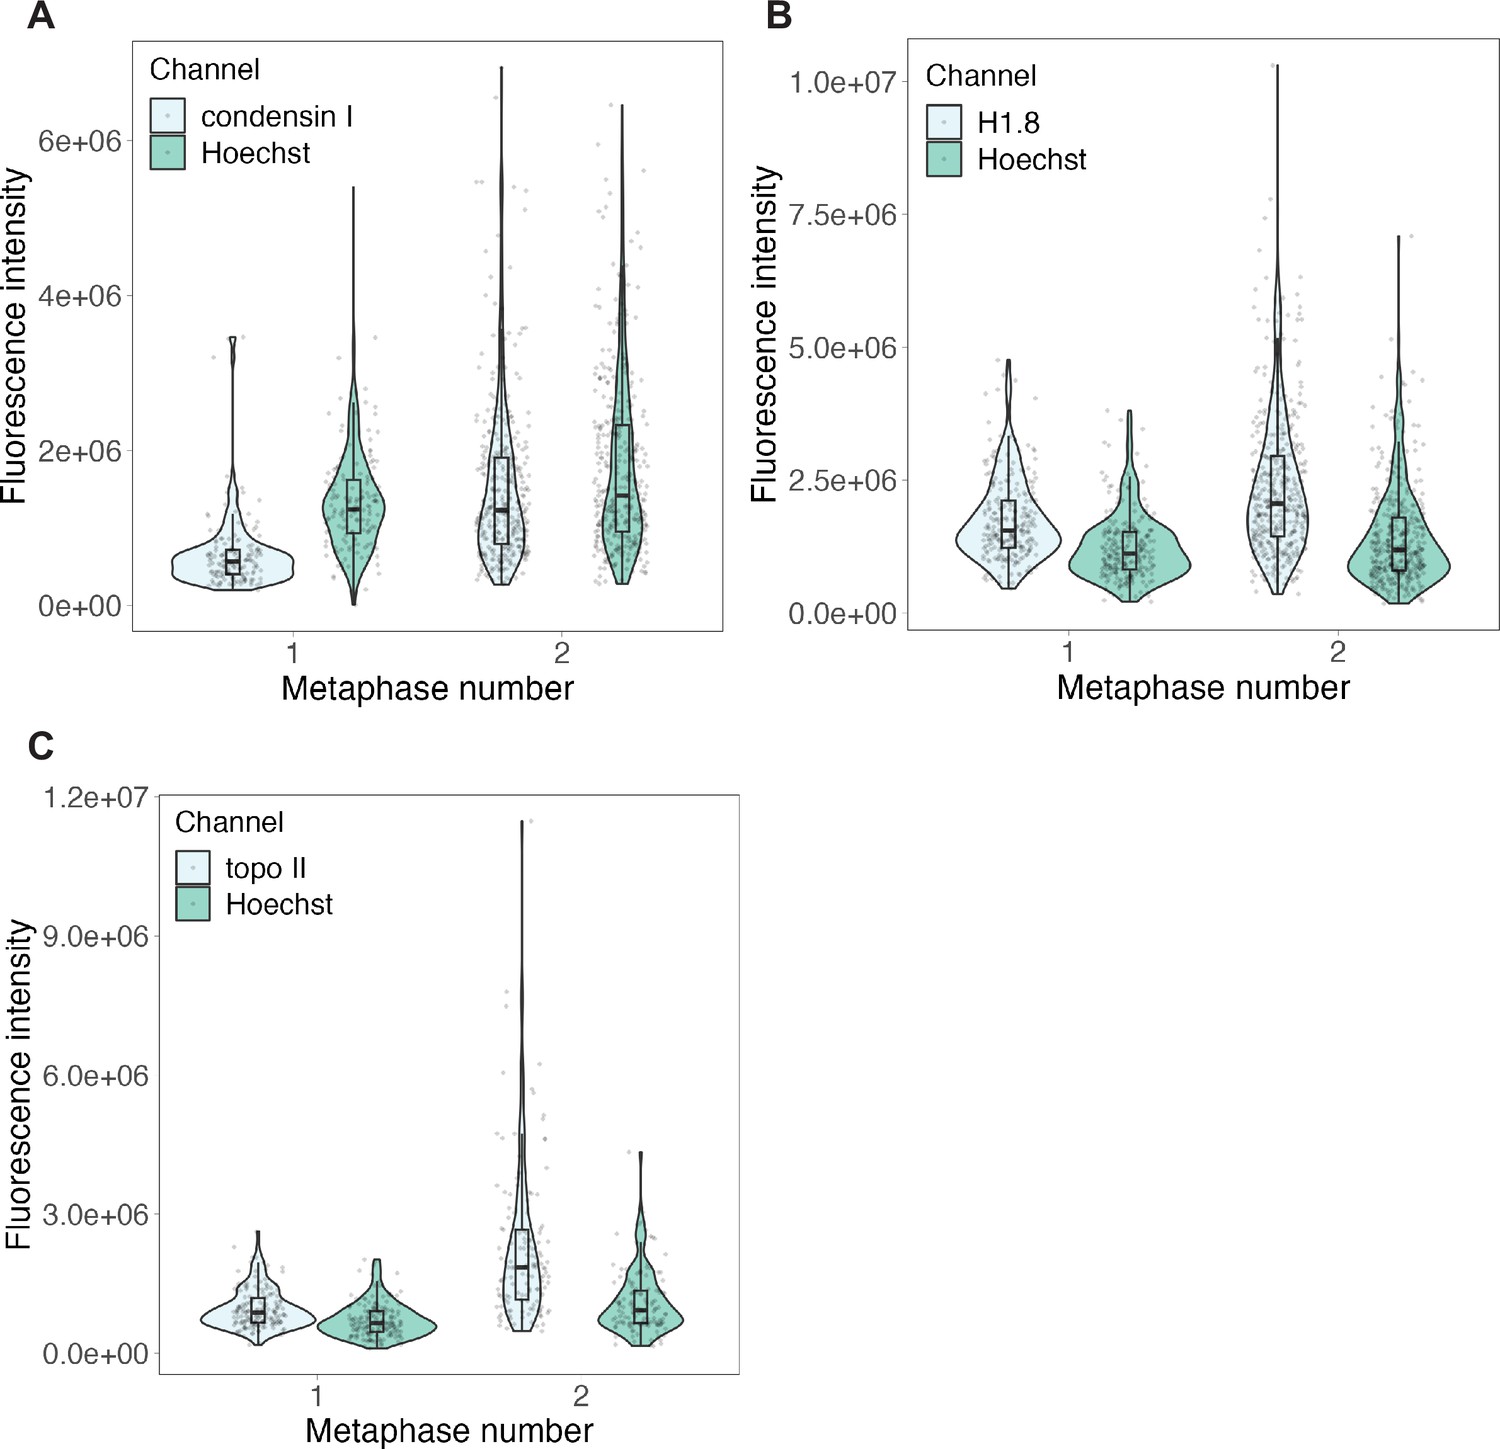
Raw fluorescence intensities for anaphase experiments.
Background-subtracted fluorescence intensities for immunofluorescence of (A) condensin I, (B) H1.8 and (C) topo II presented in Figure 3—figure supplement 5D–F. Protein of interest and Hoechst signals are plotted separately. n = 3 biological replicates, >50 chromosomes per replicate. Source data are available in Figure 3—source data 1.
Figure 4
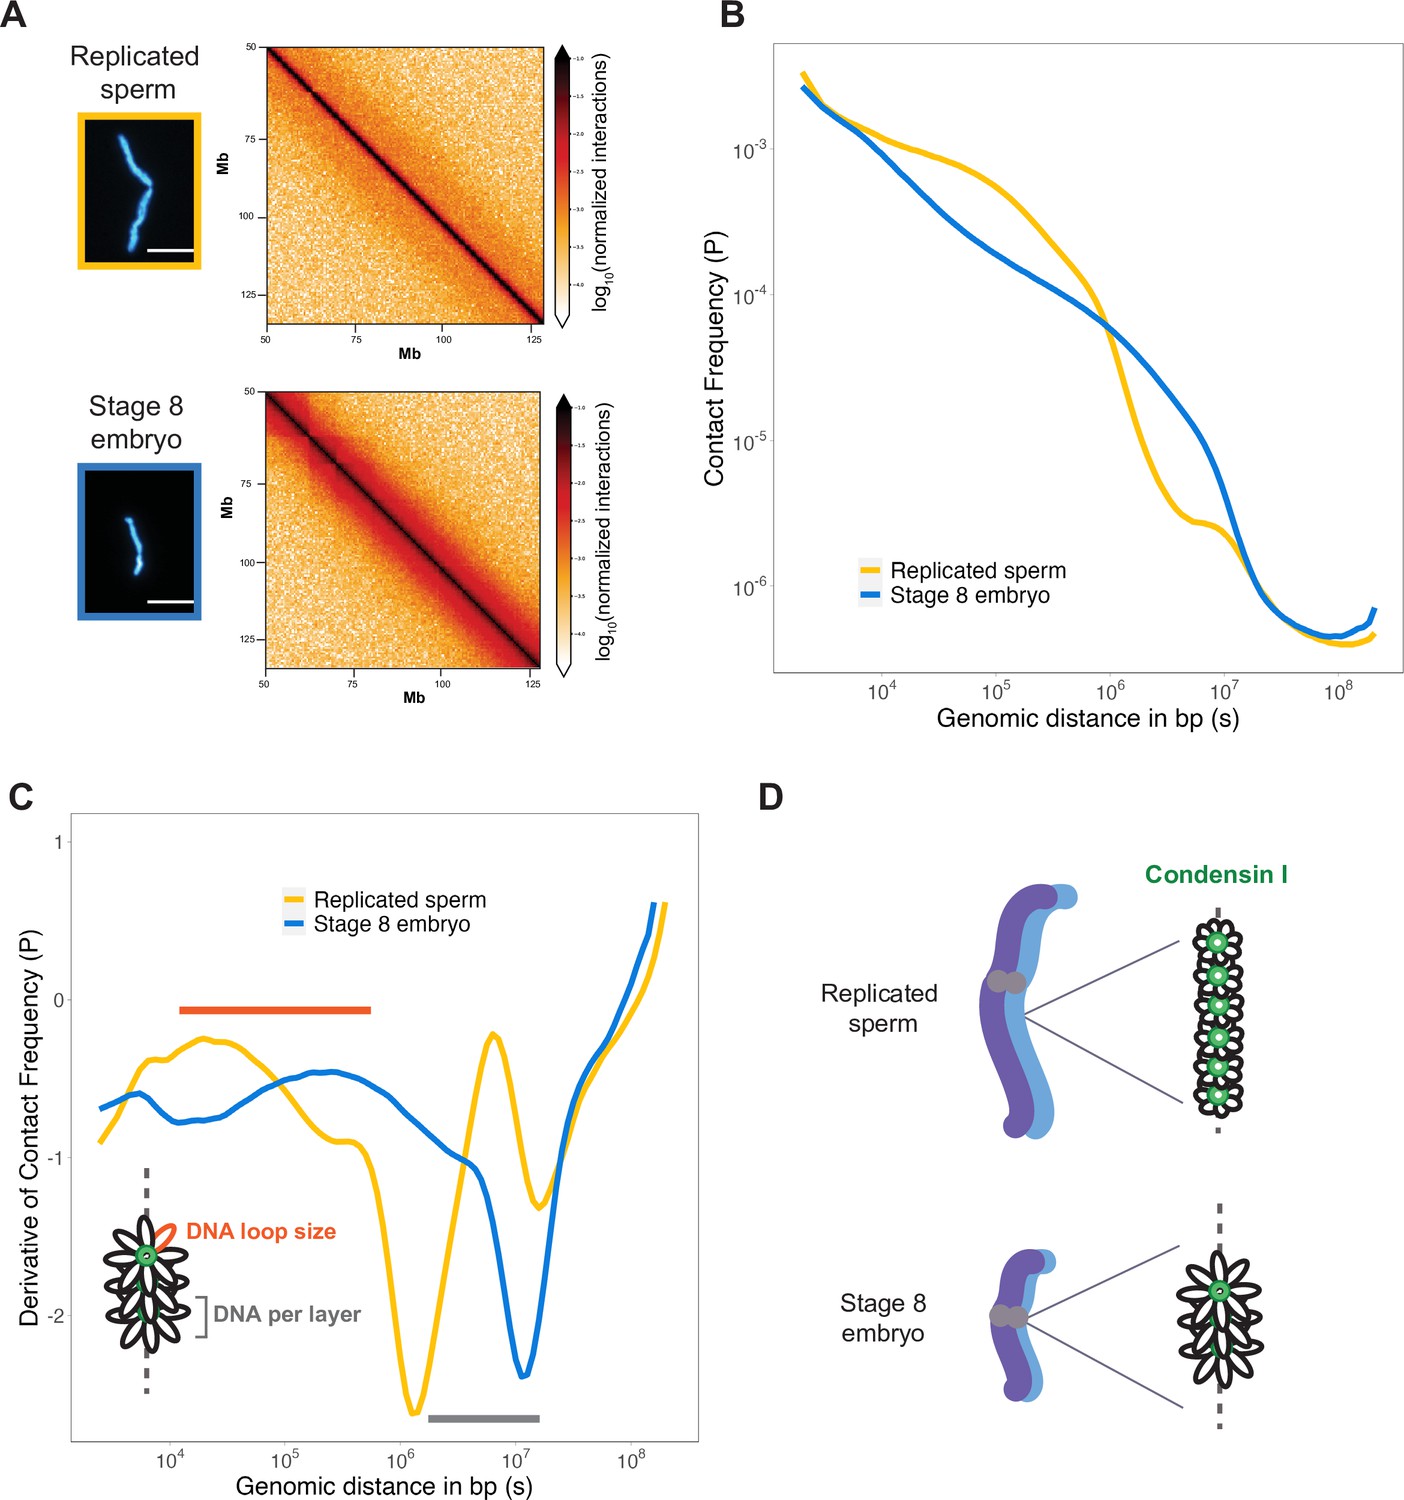
Mitotic chromosomes scale through extensive remodeling of DNA loop architecture.
(A) Hi-C maps of chromosome 4S from replicated sperm or stage 8 embryo chromosomes formed in metaphase egg extracts. (B) Plots comparing how contact frequency (P) genome-wide decays as a function of genomic distance (s) for replicated sperm (yellow) or stage 8 mitotic chromosomes (blue). (C) Derivative of contact frequencies from (B). Based on previous models, peaks at 104–106 bp show differences in loop size (orange bar), while inflection points at 106–107 bp reveal differences in DNA amount per layer (gray bar). (D) Model depicting how lower condensin I occupancy on short embryo chromosomes results in an increase in DNA loop size and DNA per layer. Plots display average values from two biological replicates. Source data available as Figure 4—source data 1.
-
Figure 4—source data 1
This file contains all of the source data for Figure 4 and related supplemental figures.
- https://cdn.elifesciences.org/articles/84360/elife-84360-fig4-data1-v2.zip
Figure 5 with 4 supplements
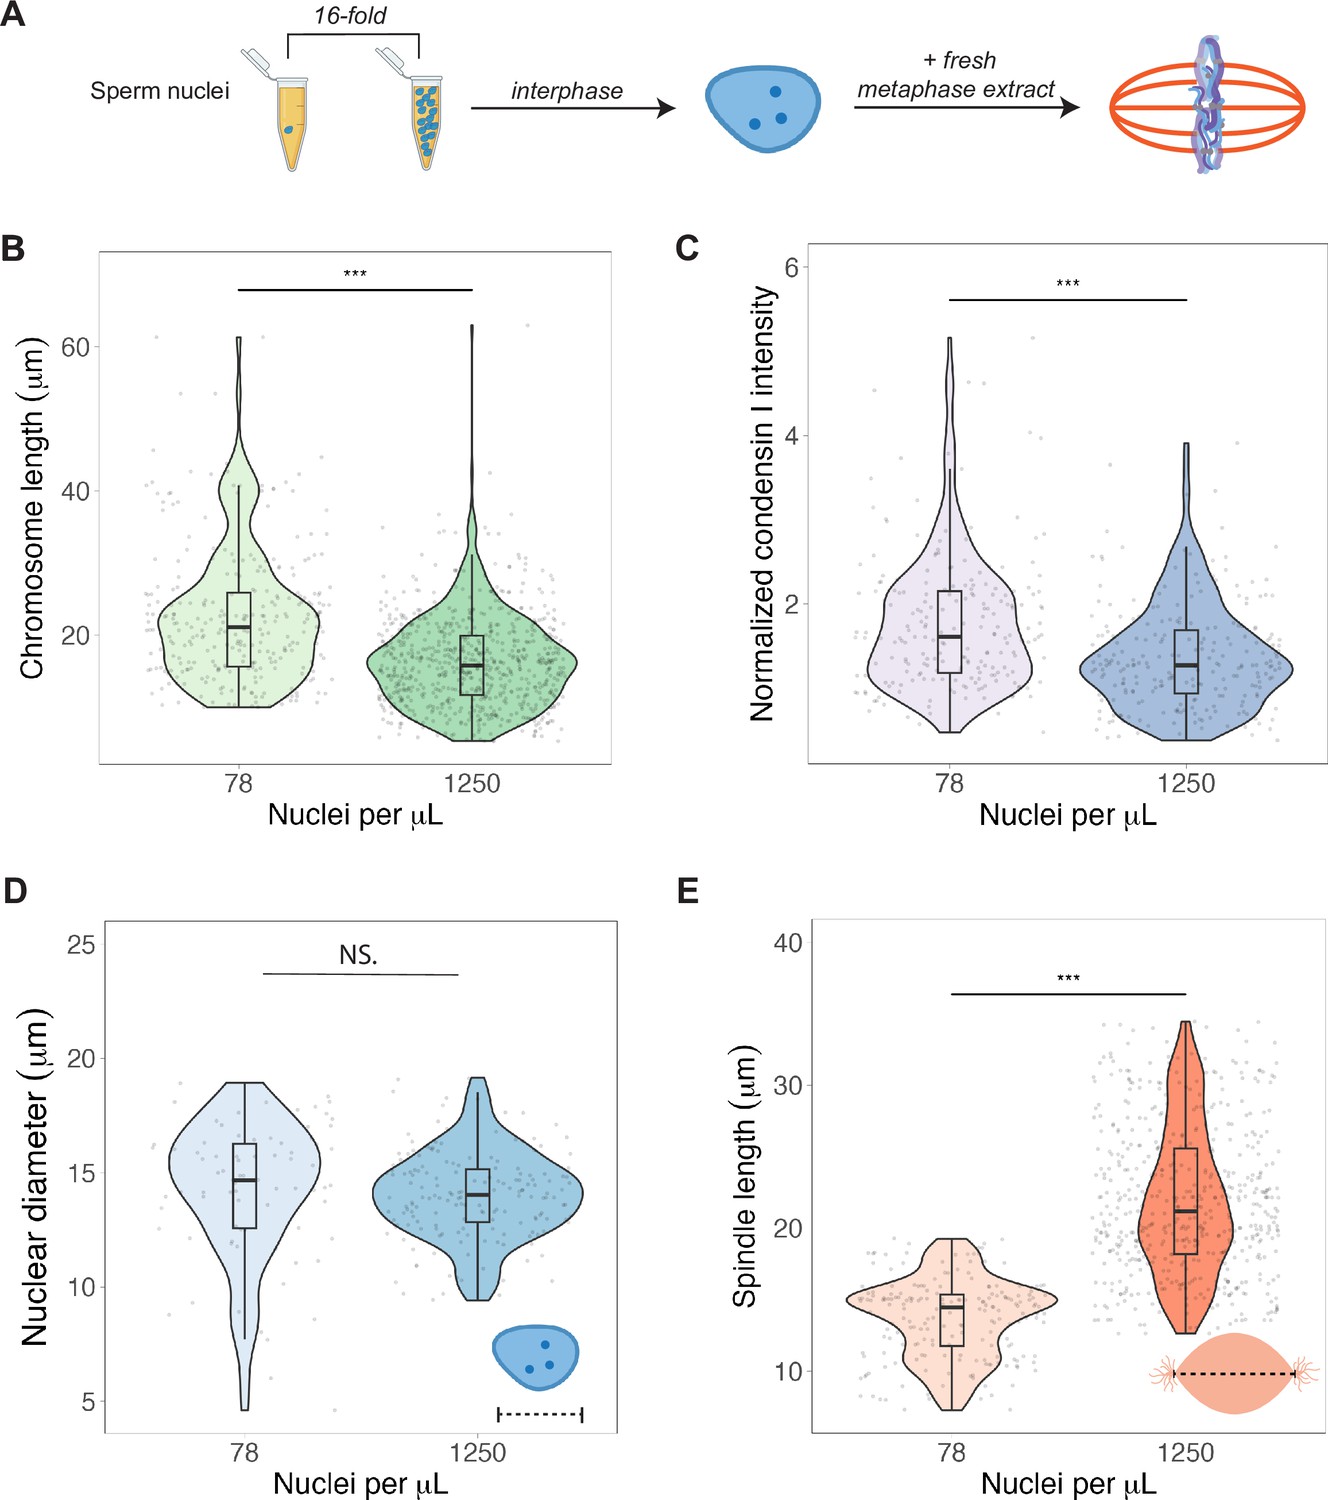
Nuclear-cytoplasmic ratio regulates mitotic chromosome scaling, but not nuclear or spindle scaling.
(A) Concentration of sperm nuclei in egg extracts was varied 16-fold to mimic concentrations found in early (78 nuclei/μL) vs. late (1250 nuclei/μL) blastula stages. (B) Quantification of mitotic chromosome lengths and (C) condensin I abundance in extracts containing high or low concentrations of sperm nuclei (difference in median intensity is 1.6-fold). (D) Nuclear diameters for samples containing low or high concentrations of sperm nuclei. (E) Spindle lengths for samples containing low or high concentrations of sperm nuclei. n = 3 biological replicates, >50 structures per replicate, ***p<0.001 by the Mann–Whitney U test. NS denotes p=0.09. Source data are available in Figure 5—source data 1.
-
Figure 5—source data 1
This file contains all of the source data for Figure 5 and related supplemental figures.
- https://cdn.elifesciences.org/articles/84360/elife-84360-fig5-data1-v2.zip
Figure 5—figure supplement 1
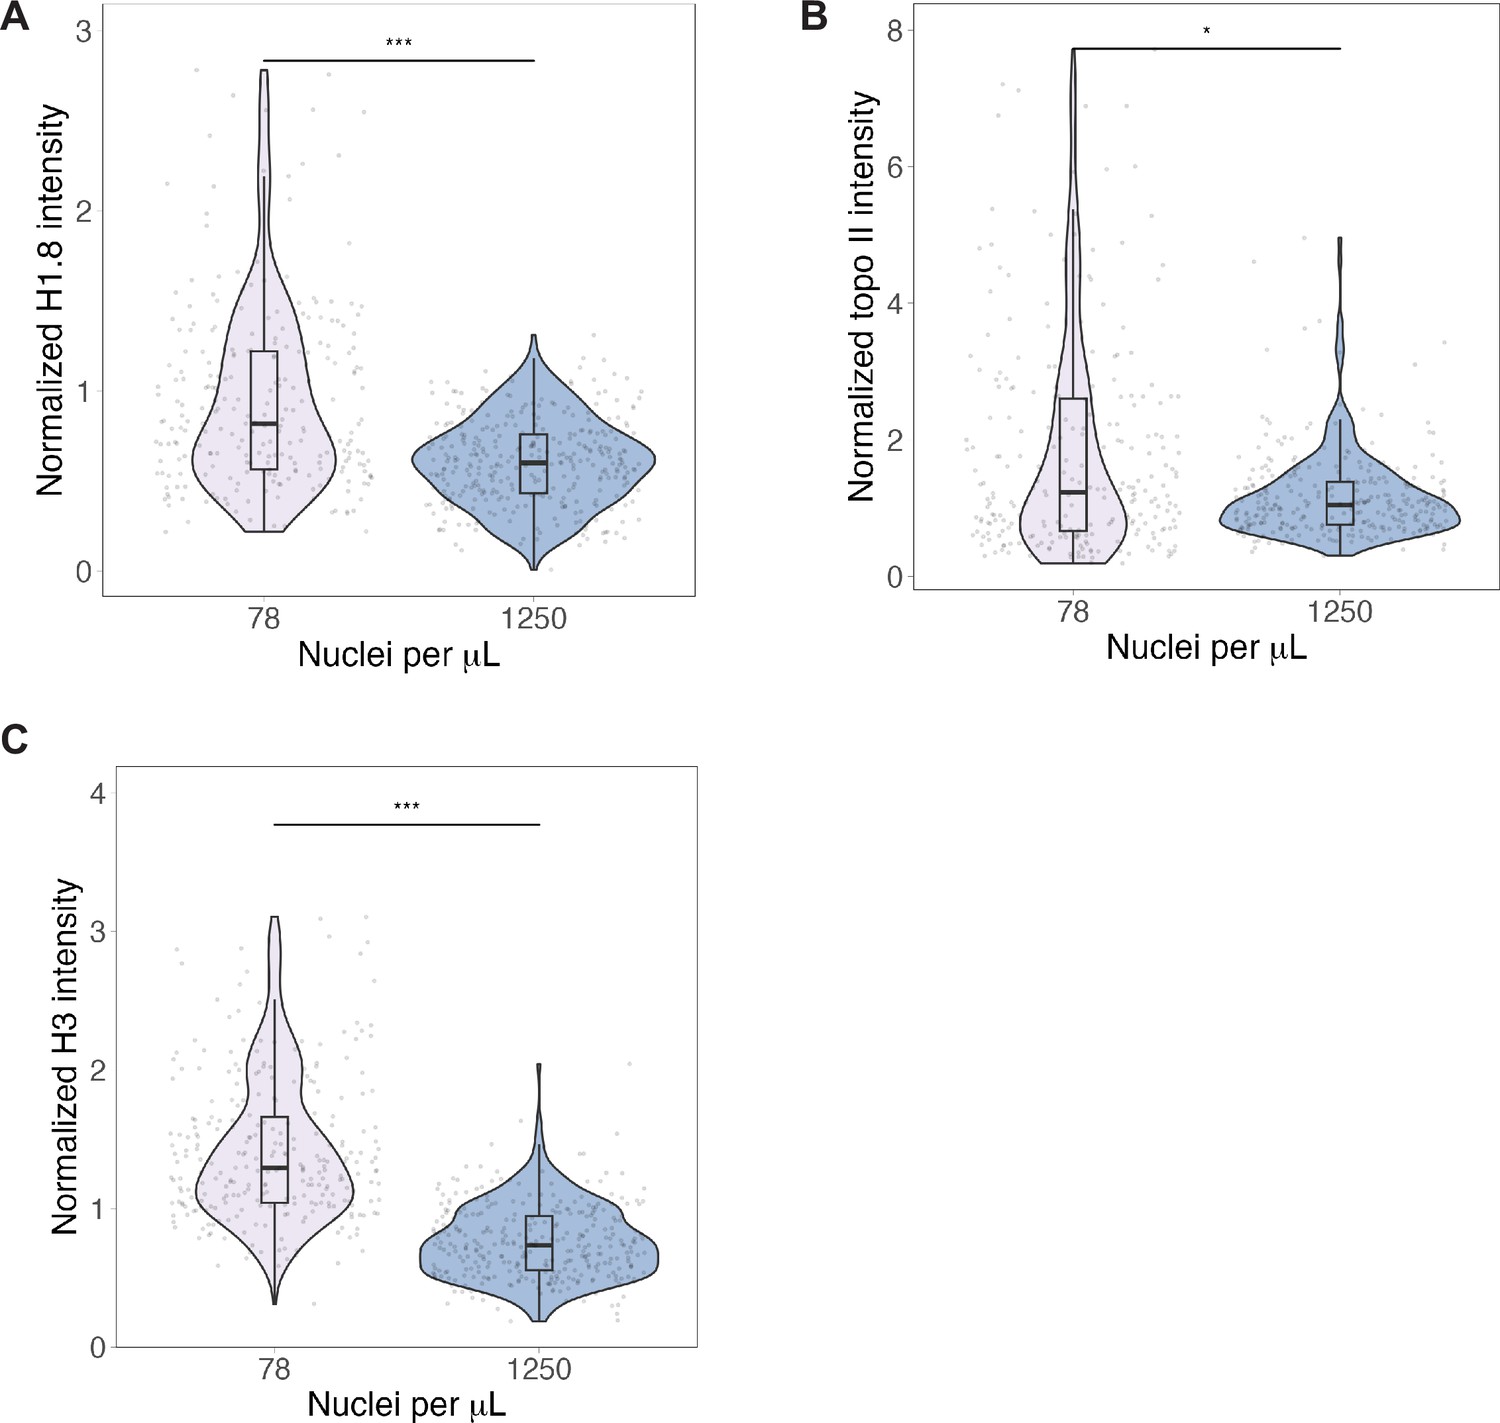
Titration of topo II, histone H1.8, and H3 on mitotic chromosomes.
Normalized fluorescence intensity of (A) H1.8, (B) topo II, and (C) H3 on sperm mitotic chromosomes in samples containing low or high concentrations of nuclei. Differences in median intensities: 1.4-fold for H1.8, 1.2-fold for topo II, 1.8-fold for H3. n = 3 biological replicates, >50 chromosomes per replicate, ***p<0.001 by the Mann–Whitney U test. *p=0.0013. Source data are available in Figure 5—source data 1.
Figure 5—figure supplement 2
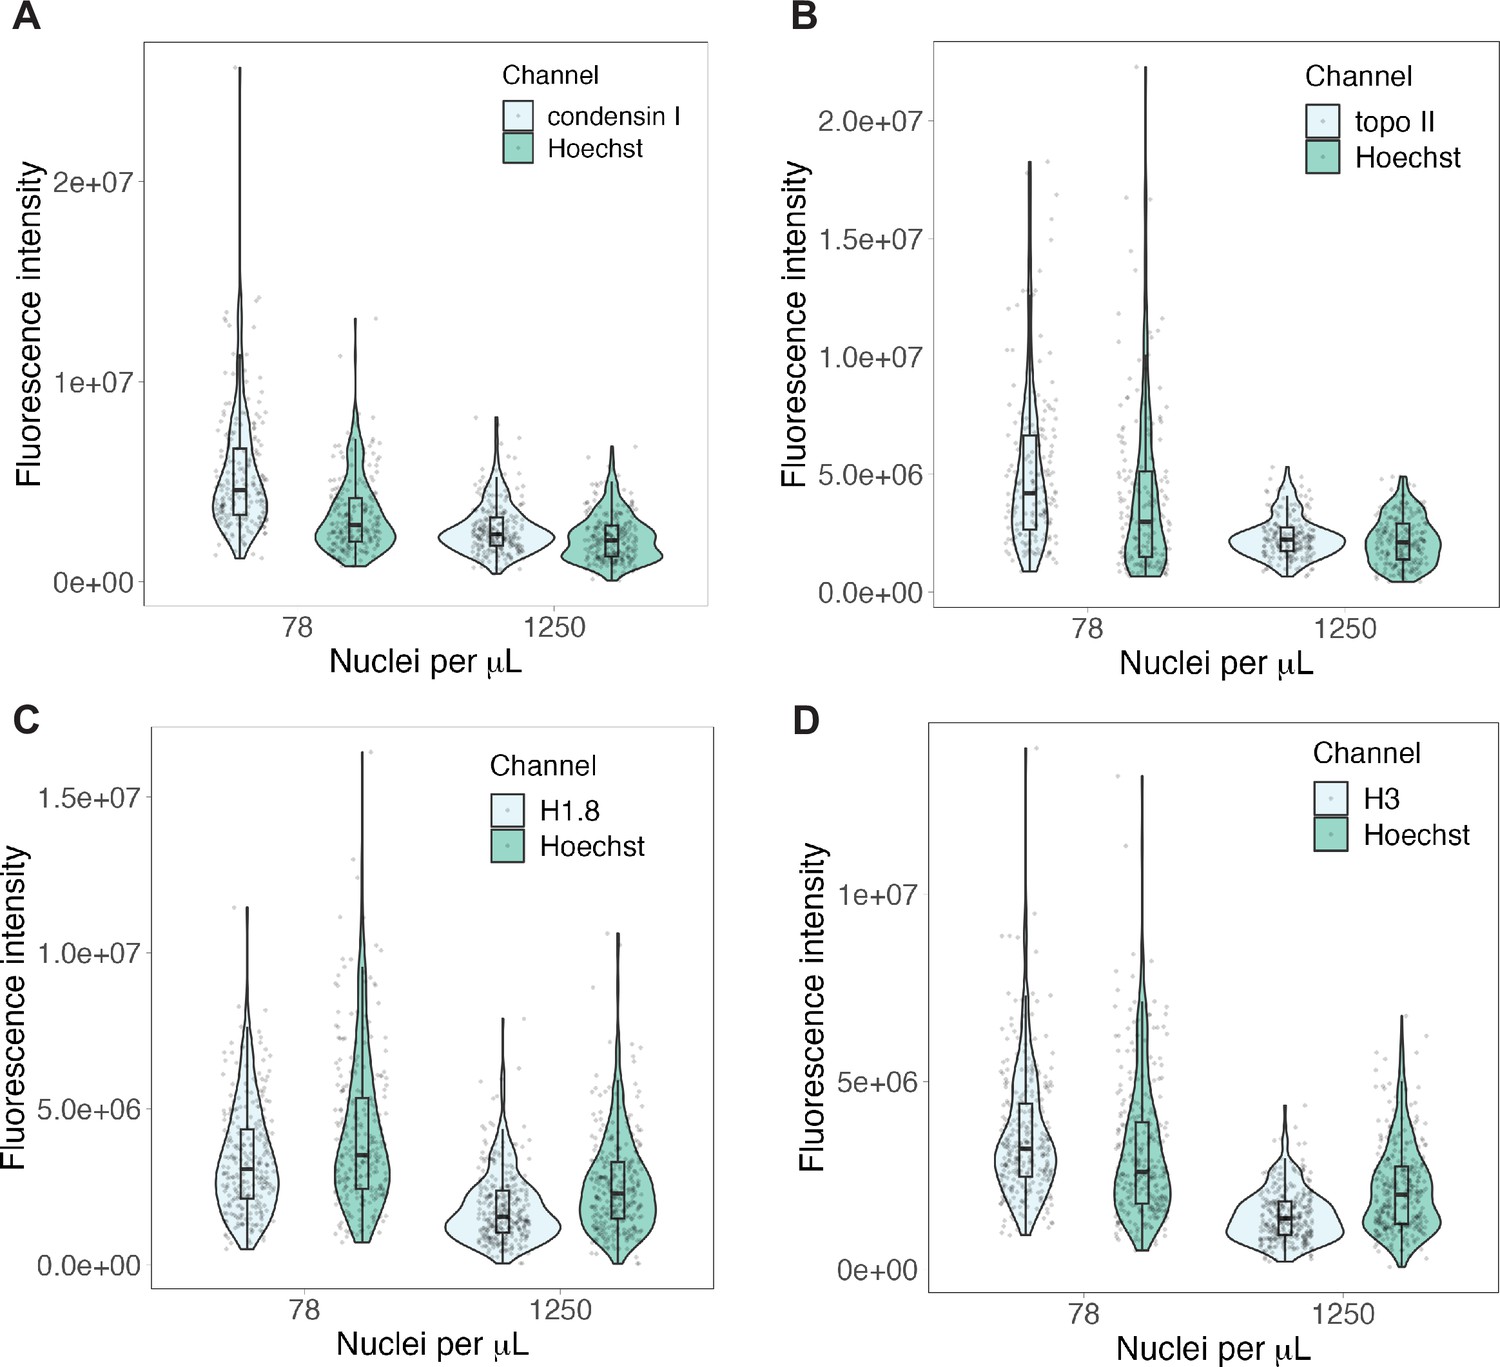
Raw fluorescence intensities for nuclear-cytoplasmic (N/C) ratio experiments.
Background-subtracted fluorescence intensities for immunofluorescence of (A) condensin I, (B) topo II, (C) H1.8 and (D) H3 presented in Figure 5C and Figure 5—figure supplement 1A-C. Channels for protein of interest and Hoechst plotted separately. n = 3 biological replicates, >50 chromosomes per replicate. Source data are available in Figure 5—source data 1.
Figure 5—figure supplement 3
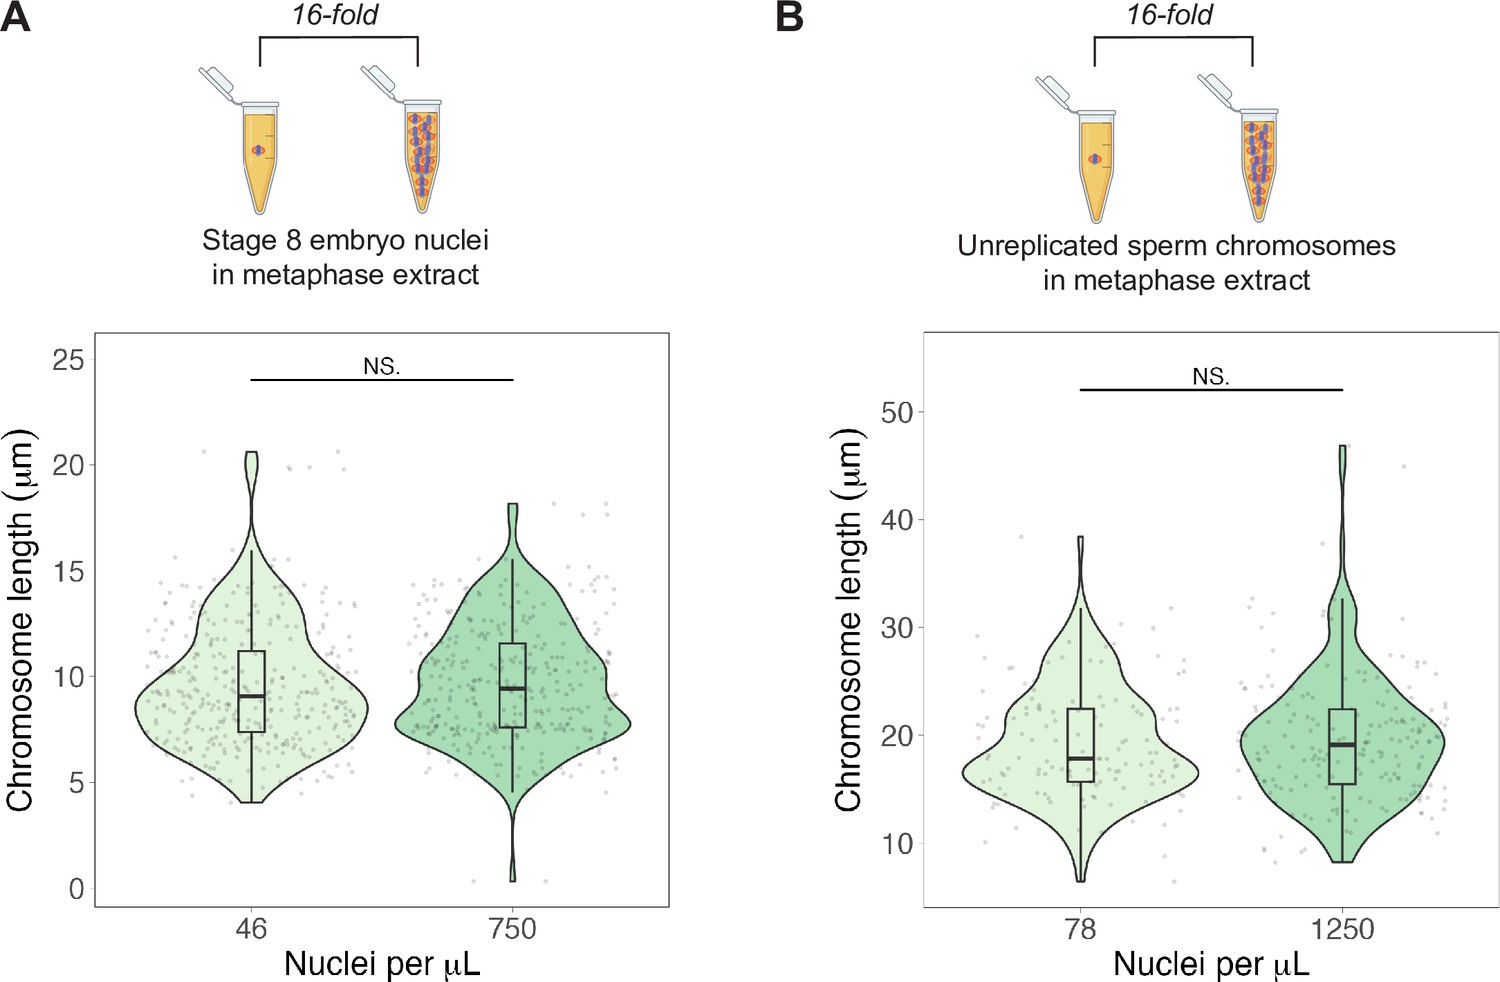
Nuclear-cytoplasmic (N/C) ratio does not affect chromosome lengths of embryo chromosomes or unreplicated sperm chromosomes.
(A) Top: schematic of experiment—stage 8 embryo nuclei were added to metaphase egg extracts at N/C ratios spanning a 16-fold range. Bottom: quantification of mitotic chromosome lengths in samples containing high or low concentrations of stage 8 embryo nuclei. (B) Top: schematic of experiment—unreplicated sperm chromosomes were added to metaphase egg extracts at N/C ratios spanning a 16-fold range. Bottom: quantification of mitotic chromosome lengths in samples containing high or low concentrations of unreplicated sperm nuclei. n = 3 biological replicates, >50 chromosomes per replicate. For both plots, NS denotes p>0.5 by the Mann–Whitney U test. Source data are available in Figure 5—source data 1.
Figure 5—figure supplement 4
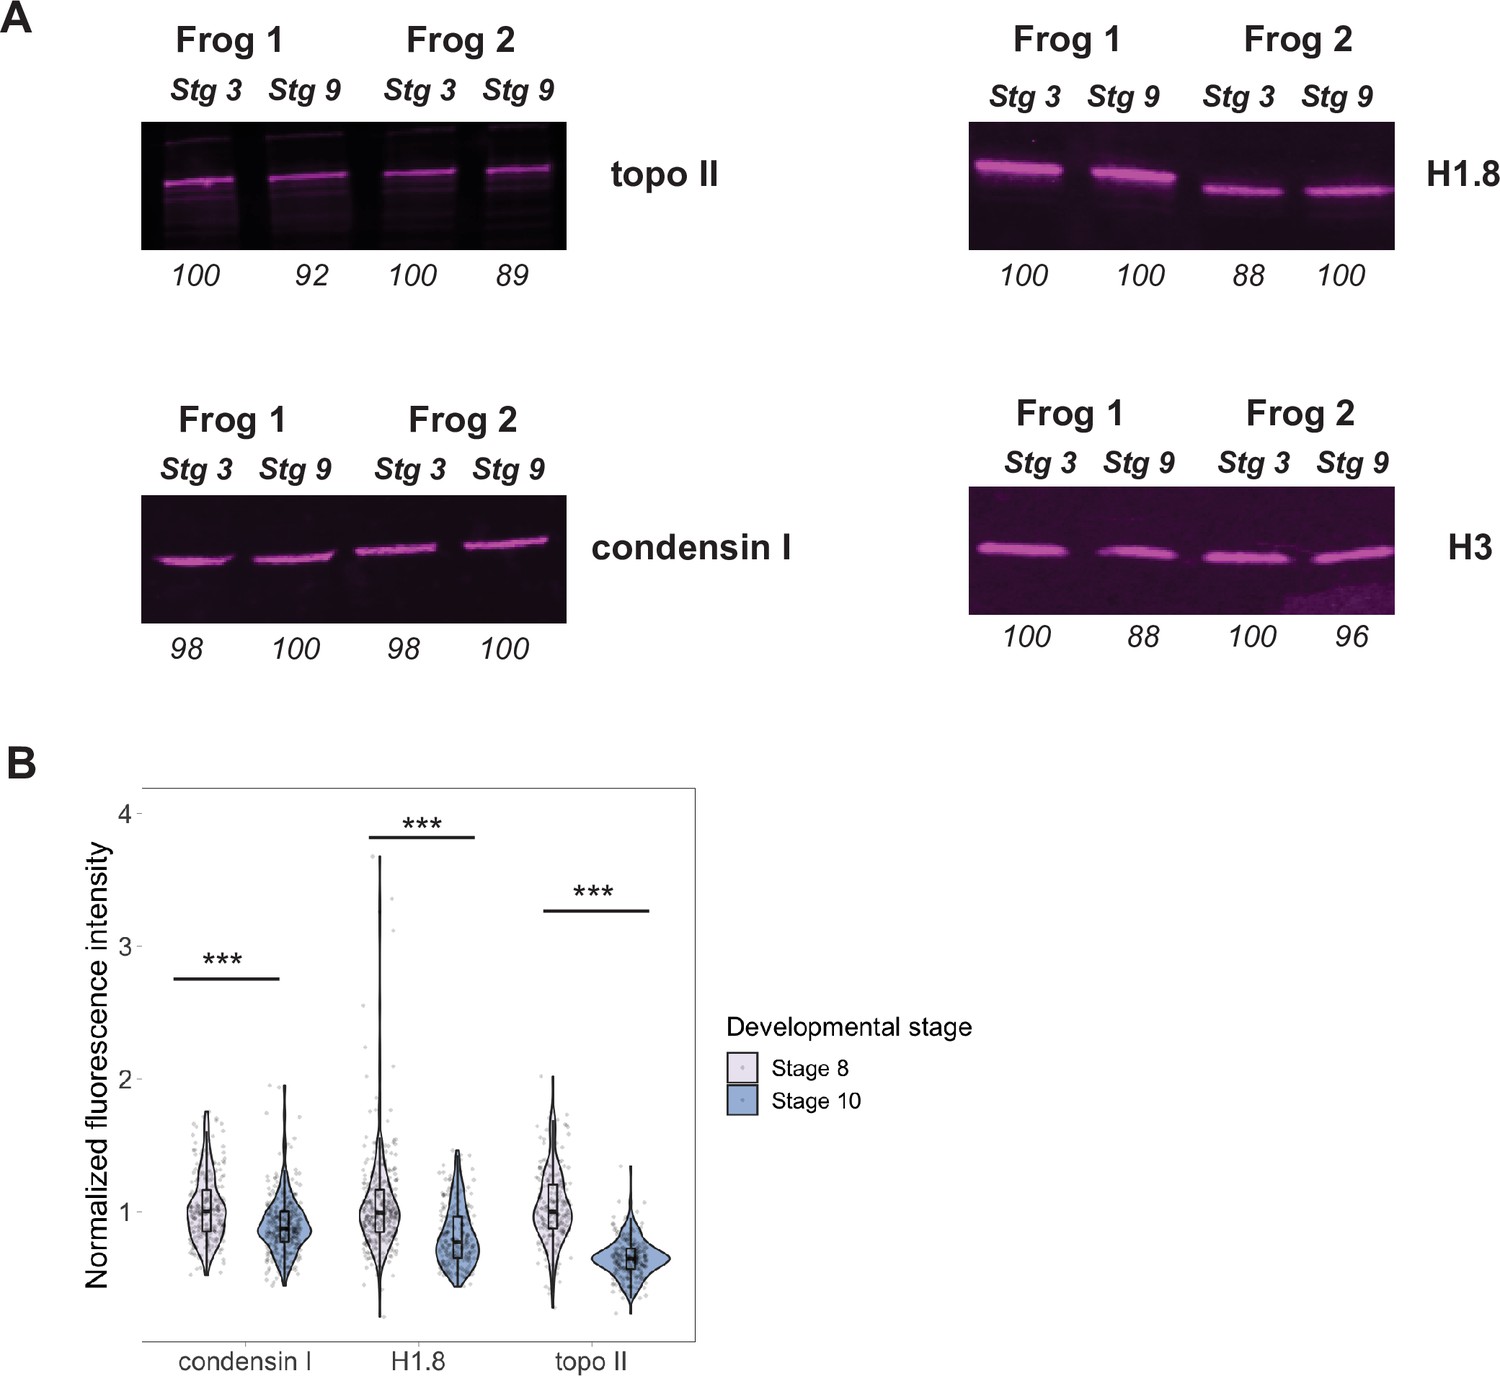
Titration of chromatin factors during early embryogenesis.
(A) Western blots of whole-embryo extracts from early (stage 3) or late (stage 9) blastula stages. Numbers below each band indicate the relative differences in signal intensity, normalized to the higher intensity band for that biological replicate and antibody (set at 100). (B) Immunofluorescence of nuclei from stage 8 or 10 embryos showing the depletion of nuclear factors in later stages. All data were normalized to the median of stage 8 data. n = 3 biological replicates, >50 nuclei per replicate, and ***p<0.001 by the Mann–Whitney U test. Source data are available in Figure 5—source data 1.
Figure 6 with 1 supplement
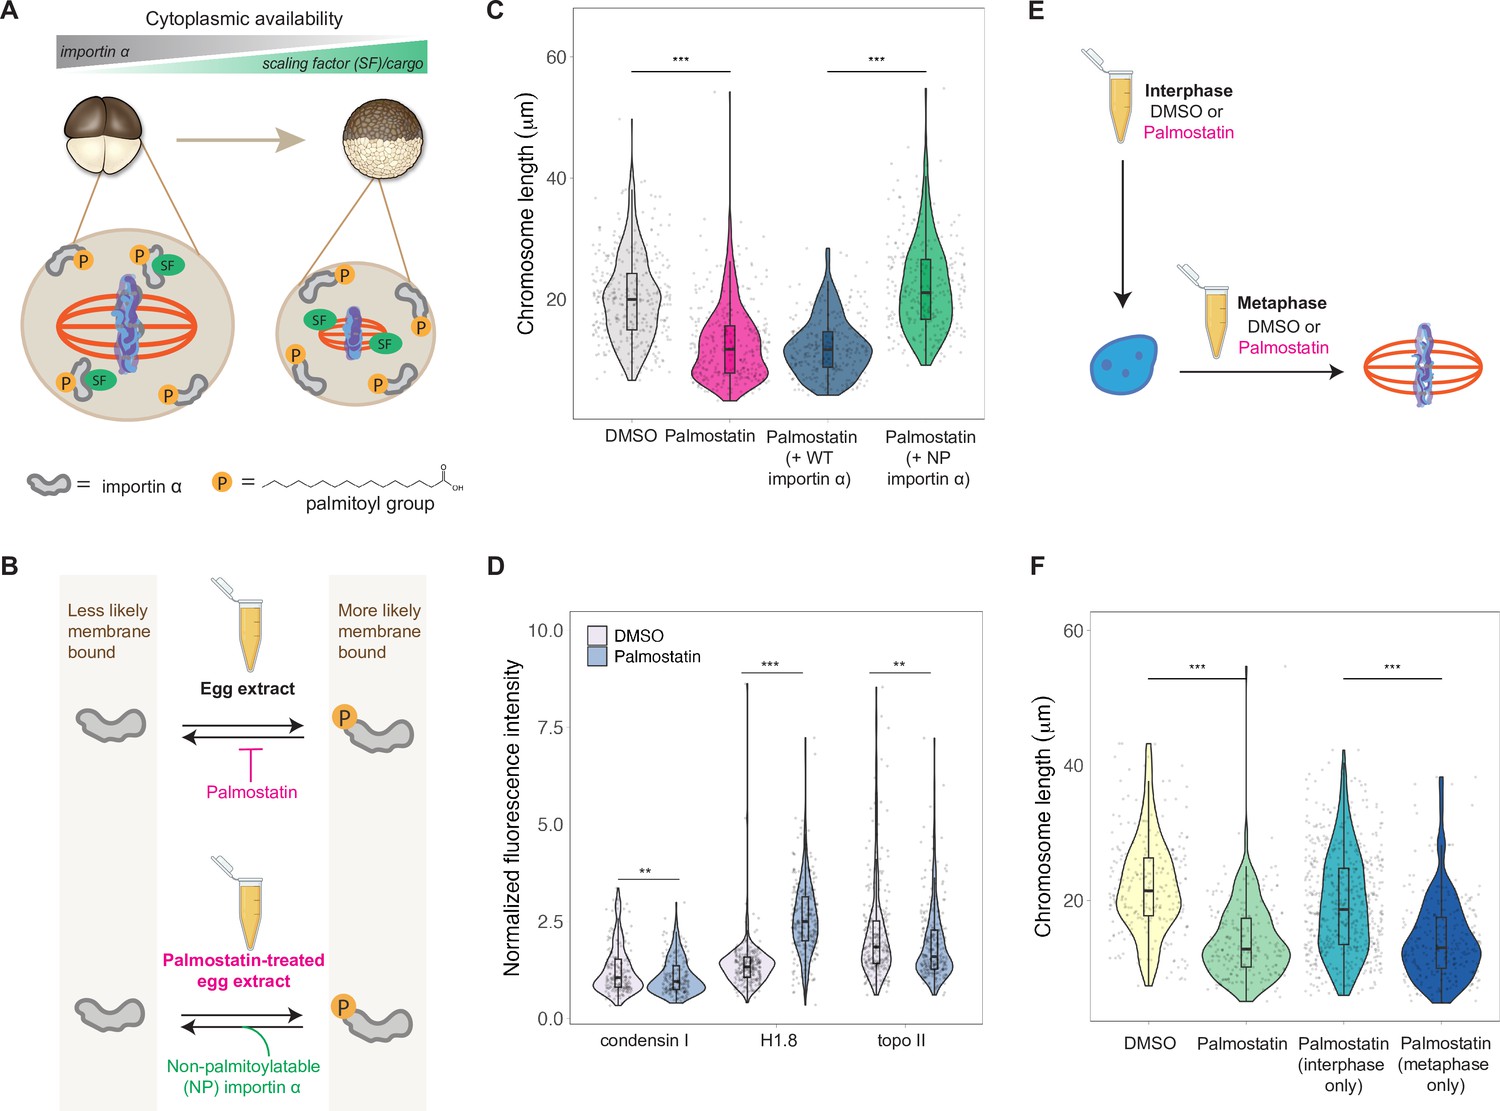
Importin α partitioning scales mitotic chromosomes to spindle and cell size.
(A) Model for how importin α scales mitotic spindles to cell size (Brownlee and Heald, 2019). Due to palmitoylation of importin α, a portion of it is driven to the cell membrane, where it can no longer interact with nuclear localization sequence (NLS)-containing scaling factors, freeing them to shrink the mitotic spindle. As cell surface area/volume (SA/V) increases during embryogenesis, proportionally more importin α is driven to the membrane, thus increasing the cytoplasmic availability of scaling factors. (B) Top: inhibition of the major depalmitoylation enzyme APT1 by adding the drug palmostatin to egg extracts mimics smaller cells by increasing the proportion of palmitoylated, membrane-bound importin α. Bottom: addition of non-palmitoylatable (NP) importin α should rescue chromosome size in palmostatin-treated egg extracts by increasing the proportion of cytoplasmic importin α. (C) Quantification of mitotic chromosome lengths in palmostatin-treated extracts and rescue of chromosome length by addition of non-palmitoylatable (NP) importin α but not by wild-type (WT) importin α. (D) Quantification of condensin I, histone H1.8, and topo II abundance of mitotic chromosomes formed in DMSO or palmostatin-treated extracts. (E) Schematic of experiment to test whether importin α partitioning plays a role in chromosome scaling during interphase or metaphase. (F) Quantification of chromosome lengths for experiment described in (E). n = 3 biological replicates, >50 chromosomes per replicate. ***p<0.001 and ** <0.01 by the Mann–Whitney U test. Source data are available in Figure 6—source data 1.
-
Figure 6—source data 1
This file contains all of the source data for Figure 6 and related supplemental figures.
- https://cdn.elifesciences.org/articles/84360/elife-84360-fig6-data1-v2.zip
Figure 6—figure supplement 1
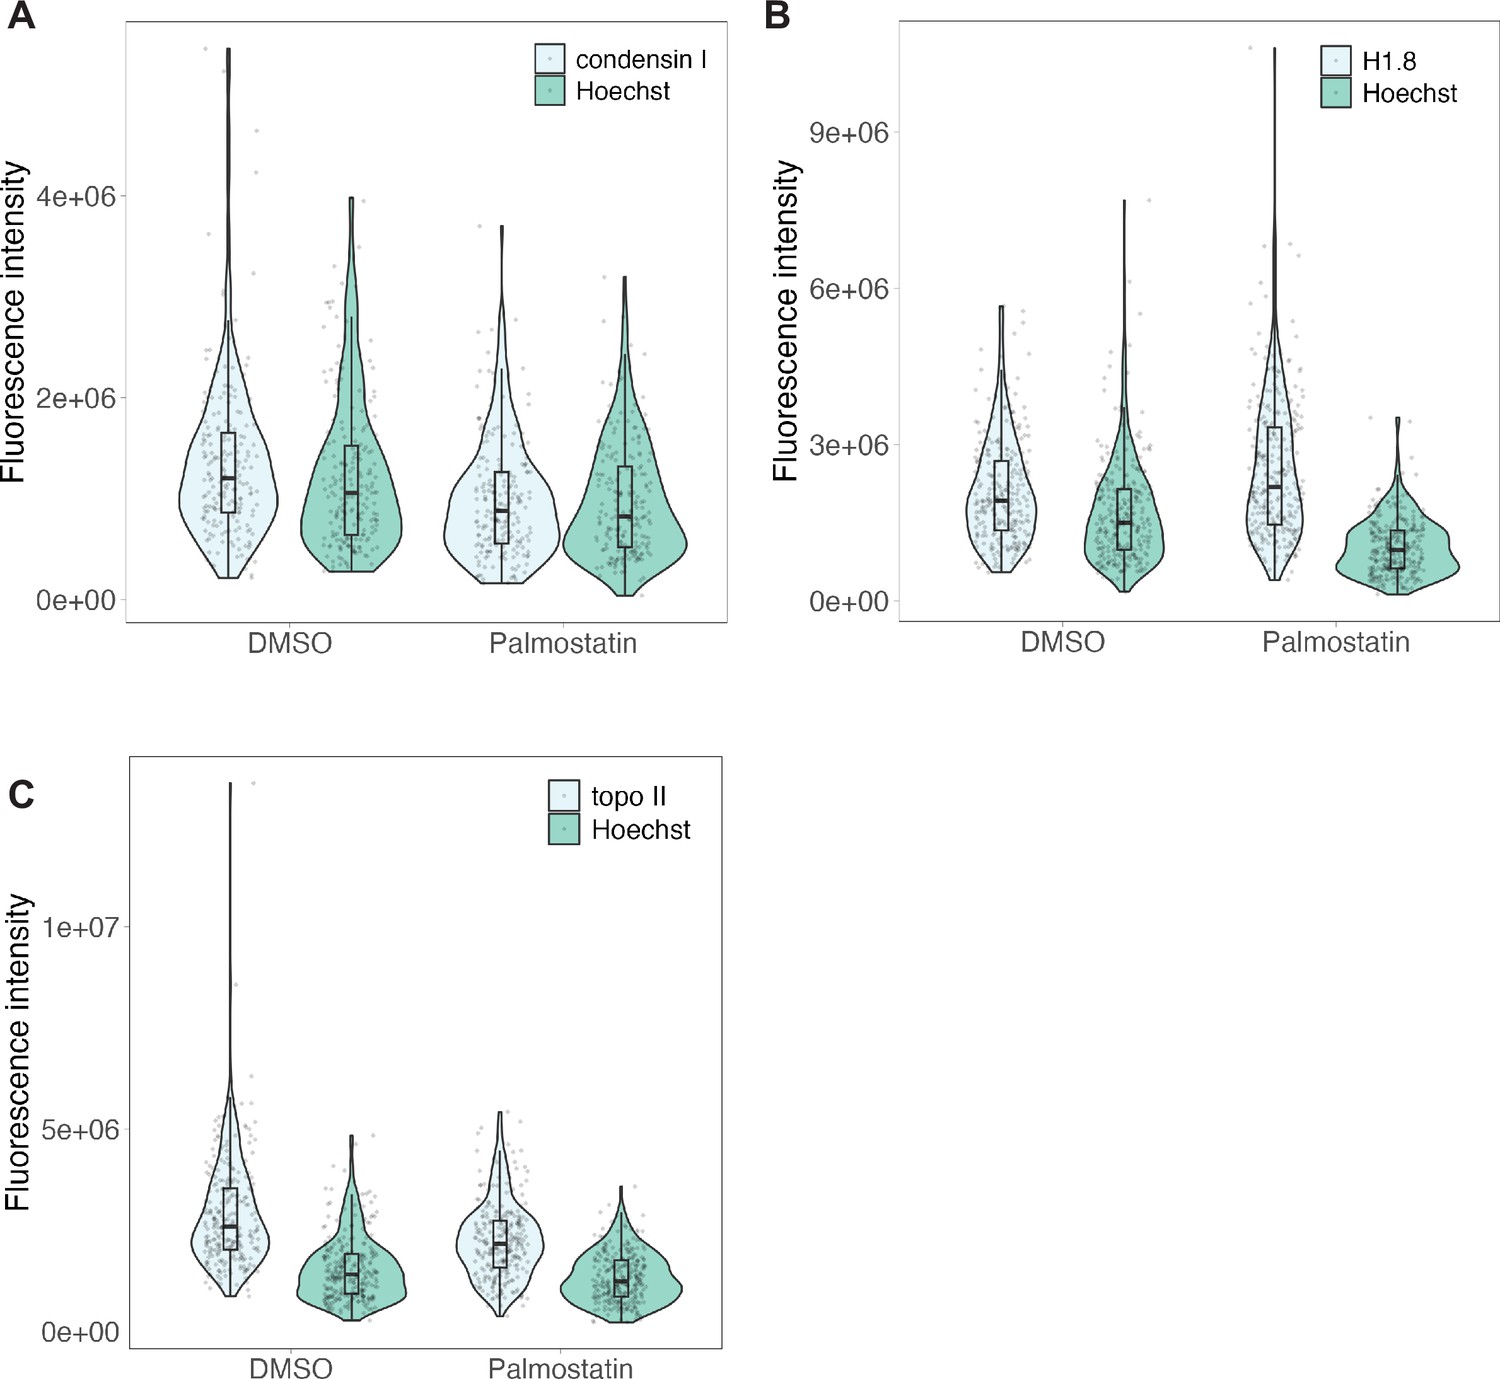
Raw fluorescence intensities for palmostatin experiments.
Background-subtracted fluorescence intensities for immunofluorescence of (A) condensin I, (B) H1.8 and (C) topo II for data presented in Figure 6D, with protein of interest and Hoechst signals plotted separately. n = 3 biological replicates, >50 chromosomes per replicate. Source data are available in Figure 6—source data 1.
Figure 7
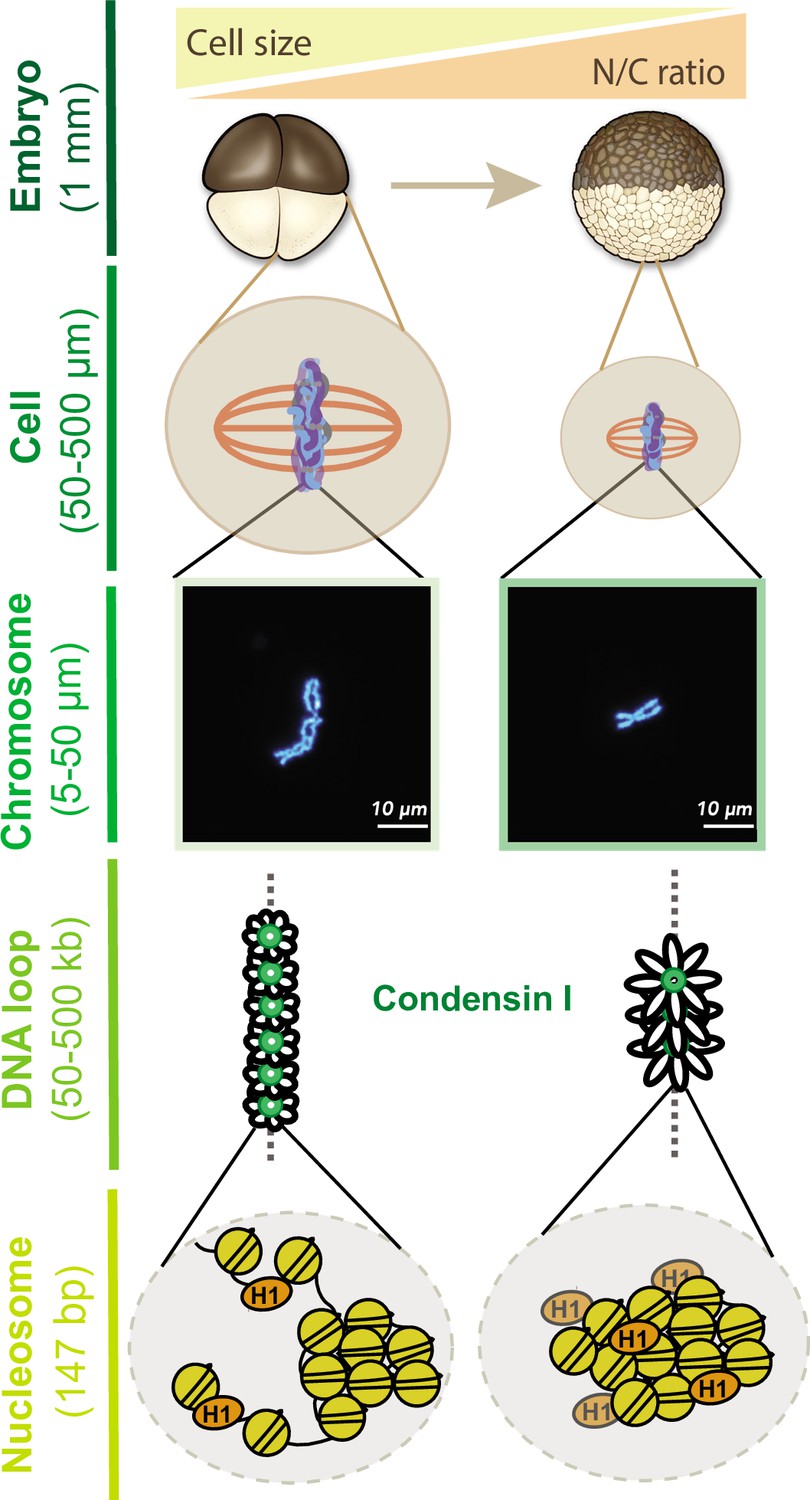
Multi-scale model for mitotic chromosome scaling.
Mitotic chromosomes scale to two independent cues during development: cell size and nuclear-cytoplasmic (N/C) ratio. In the N/C ratio pathway, exponentially increasing genome copy numbers results in titration of chromatin-bound maternal factors during interphase, leading to decreased condensin I levels on metaphase chromosomes. A decrease in condensin I results in increased DNA loop size, thus allowing the same amount of DNA to be accommodated on a shorter axis. The cell size pathway additionally scales mitotic chromosomes to spindle and cell size during metaphase through increased partitioning of palmitoylated importin α to the cell membrane and release of linker histone H1.8 into the cytoplasm. We speculate that increased H1.8 could result in increased inter-nucleosomal compaction, thus creating a denser chromosome fiber.
Author response image 1
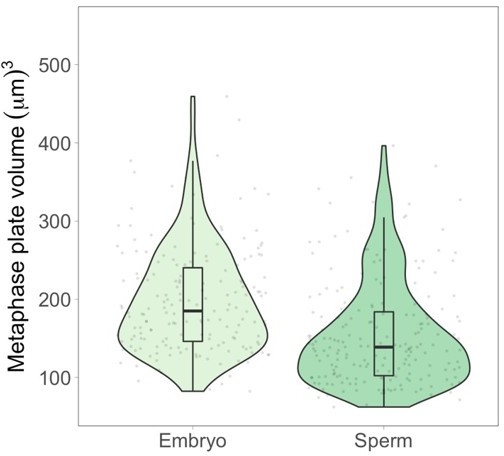
Metaphase plate volume measurements of stage 8 embryo nuclei and sperm nuclei within spindles formed in egg extract.
Since embryo nuclei contain both maternal and paternal genomes, a similar metaphase plate size would indicate a 2-fold decrease in volume for embryo chromosomes. However, median embryo metaphase plate volumes are 1.3fold larger, indicating that metaphase plate volumes follow the same trend but do not quantitatively recapitulate scaling of individual mitotic chromosomes. See text above for additional explanation. n = 4 biological replicates.
Tables
Key resources table
| Reagent type (species) or resource | Designation | Source or reference | Identifiers | Additional information |
|---|---|---|---|---|
| Biological sample (Xenopus laevis) | Male and female adult frogs | National Xenopus Resource (NXR) Xenopus 1 | ||
| Chemical compound, drug | Human chorionic gonadotropin hormone (hCG) | Sigma-Aldrich | CG10-10VL | |
| Chemical compound, drug | Pregnant mare serum gonadotropin (PMSG) | BioVendor | Catalog # RP1782725000 | |
| Peptide, recombinant protein | cyclinBΔ90 | Wilbur and Heald, 2013 | ||
| Peptide, recombinant protein | UbcH10 C114S | Wilbur and Heald, 2013 | ||
| Antibody | Anti-xCAP-G (rabbit polyclonal) | Susannah Rankin | IF (1:500) WB (1:1000) | |
| Antibody | Anti-xCAP-G2 (rabbit polyclonal) | Susannah Rankin | IF (1:100) | |
| Antibody | Anti-H1.8 (rabbit polyclonal) | Maresca et al., 2005 | IF (1:1000) WB (1:1000) | |
| Antibody | Anti-TopoII-a (rabbit polyclonal) | Yoshiaki Azuma | IF (1:1000) WB (1:1000) | |
| Antibody | Anti-H3, Clone MABI 0301 (mouse monoclonal) | Abcam | Catalog # 39763 | Whole-embryo IF (1:500) Extract IF (1:1000) |
| Antibody | Anti-E7 beta-tubulin (mouse monoclonal) | Developmental Studies Hybridoma Bank (DSHB) | Link to product | Whole-embryo IF (1:250) |
| Antibody | Alexa Fluor 568 goat-anti-rabbit IgG (polyclonal) | Invitrogen | Catalog # A11011 | IF (1:1000) |
| Antibody | Alexa Fluor 568 goat-anti-mouse IgG (polyclonal) | Invitrogen | Catalog # A11004 | IF (1:1000) |
| Antibody | Alexa Fluor 700 goat-anti-rabbit IgG (polyclonal) | Invitrogen | Catalog # A21038 | WB (1:10,000) |
| Antibody | IRDye-800CW goat anti-mouse IgG (polyclonal) | LI-COR | Catalog # 926-32210 | WB (1:10,000) |
| Chemical compound, drug | APT1 Inhibitor (Palmostatin B) | Sigma-Aldrich | Catalog # 178501 | Reconstitute with DMSO, store at –80°C in aliquots, discard after 3 mo |
| Recombinant DNA reagent | pSNAP/Importin α (WT and NP) | Brownlee and Heald, 2019 |
Additional files
Download links
A two-part list of links to download the article, or parts of the article, in various formats.
Downloads (link to download the article as PDF)
Open citations (links to open the citations from this article in various online reference manager services)
Cite this article (links to download the citations from this article in formats compatible with various reference manager tools)
Mitotic chromosomes scale to nuclear-cytoplasmic ratio and cell size in Xenopus
eLife 12:e84360.
https://doi.org/10.7554/eLife.84360


