Within-host diversity improves phylogenetic and transmission reconstruction of SARS-CoV-2 outbreaks
- Department of Infectious Diseases, Imperial College London, United Kingdom
- Department of Infection, Immunity and Inflammation, University College London, United Kingdom
- Department of Statistics, University of Warwick, United Kingdom
- Department of Microbiology, Great Ormond Street Hospital, United Kingdom
- UCL Genomics, University College London, United Kingdom
- Department of Virology, East & South East London Pathology Partnership, Royal London Hospital, Barts Health NHS Trust, United Kingdom
Figures
Figure 1 with 4 supplements
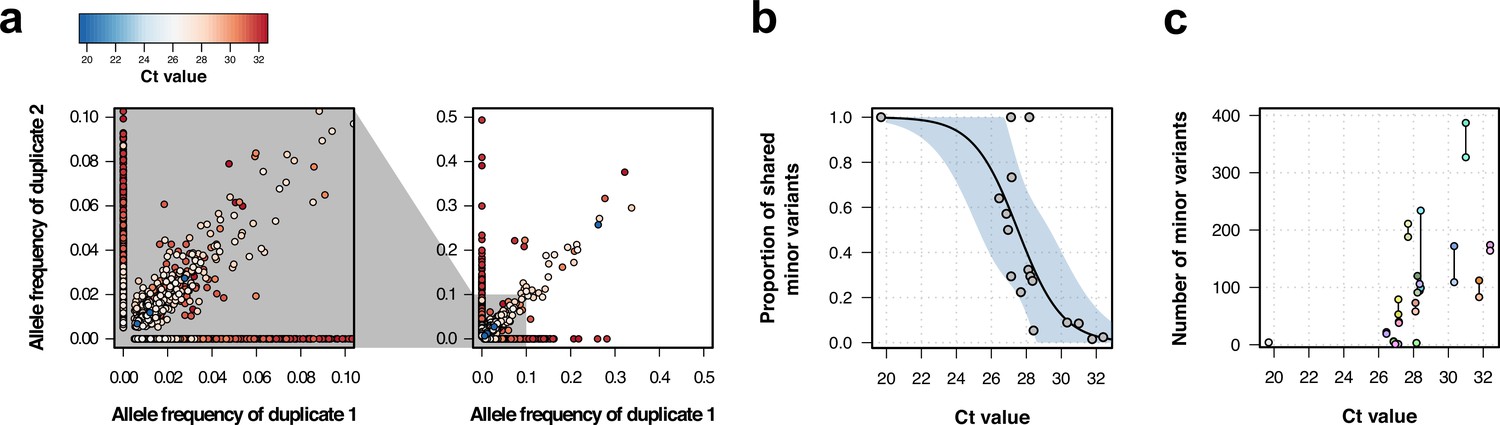
Genomic analysis of technical duplicates before filtering.
(a) Allele frequency comparison between technical replicates for all frequencies (right) and for frequencies up to 1% (left). Colors represent the Ct value for the sample. (b) Proportion of shared minor variants between technical replicates in relation to the Ct value. (c) Total number of minor variants in relation to the Ct value. Lines linked two technical replicates. Each sequence has a different color, with sequences from the same patient having a different shade of the same color.
Figure 1—figure supplement 1
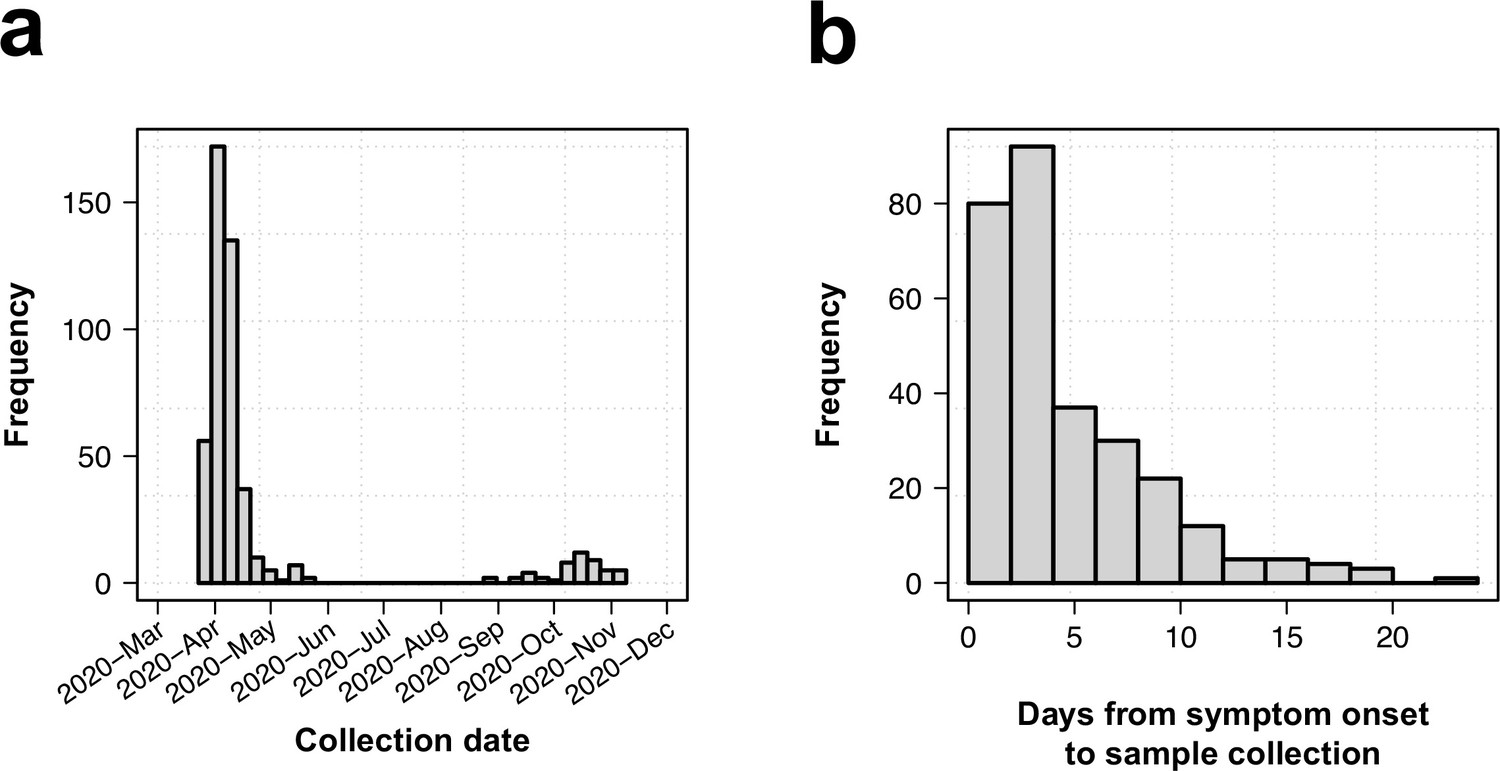
Collection date distribution and time from symptom and days from symptom onset.
(a) Distribution of collection dates. (b) Histogram of time from symptom onset to sample collection.
Figure 1—figure supplement 2

Sample mean coverage distribution.
Density distribution of mean coverage.
Figure 1—figure supplement 3
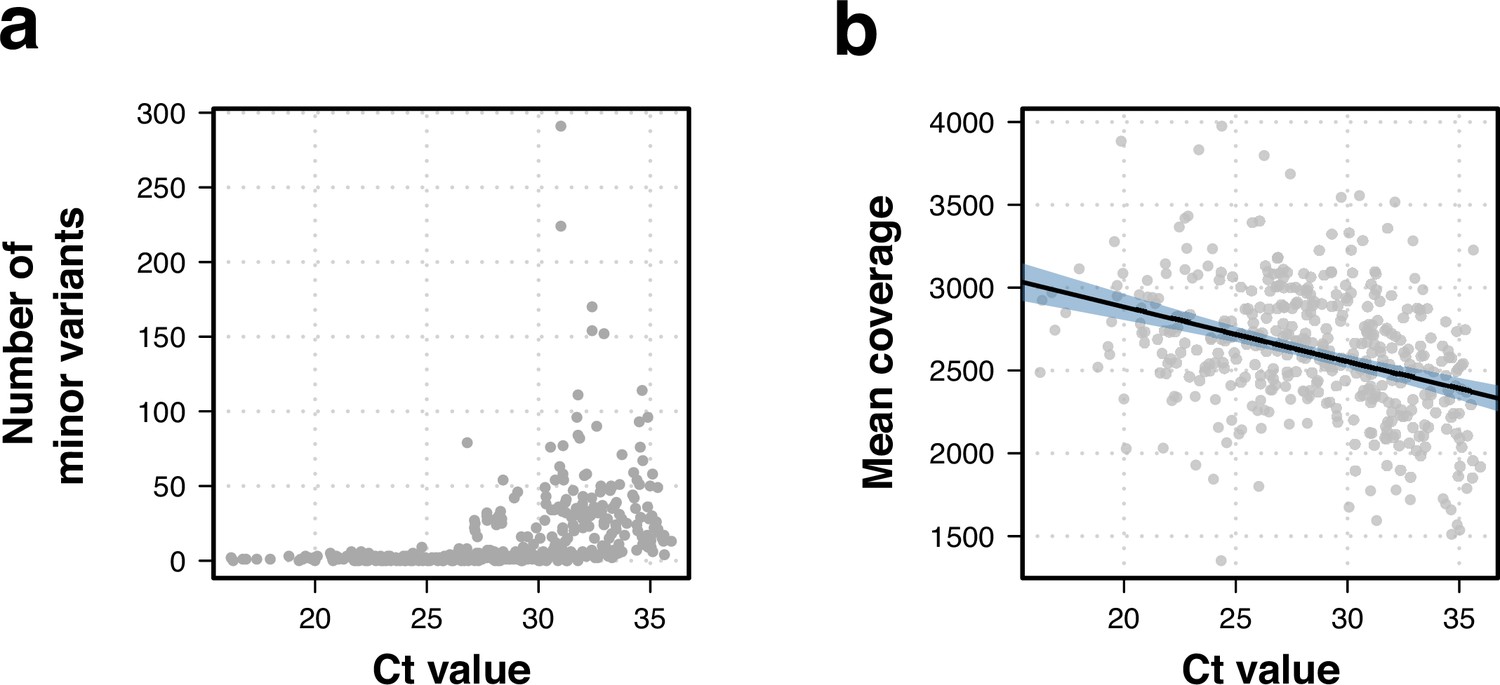
Effects of Ct value on whole-genome sequencing data.
(a) Higher Ct values were linked to a higher number of within-sample variation. (b) Correlation between Ct value and isolate sequencing mean coverage. Lower coverage was associated to higher Ct values (R2=0.13, t-statistic p-value <0.001).
Figure 1—figure supplement 4
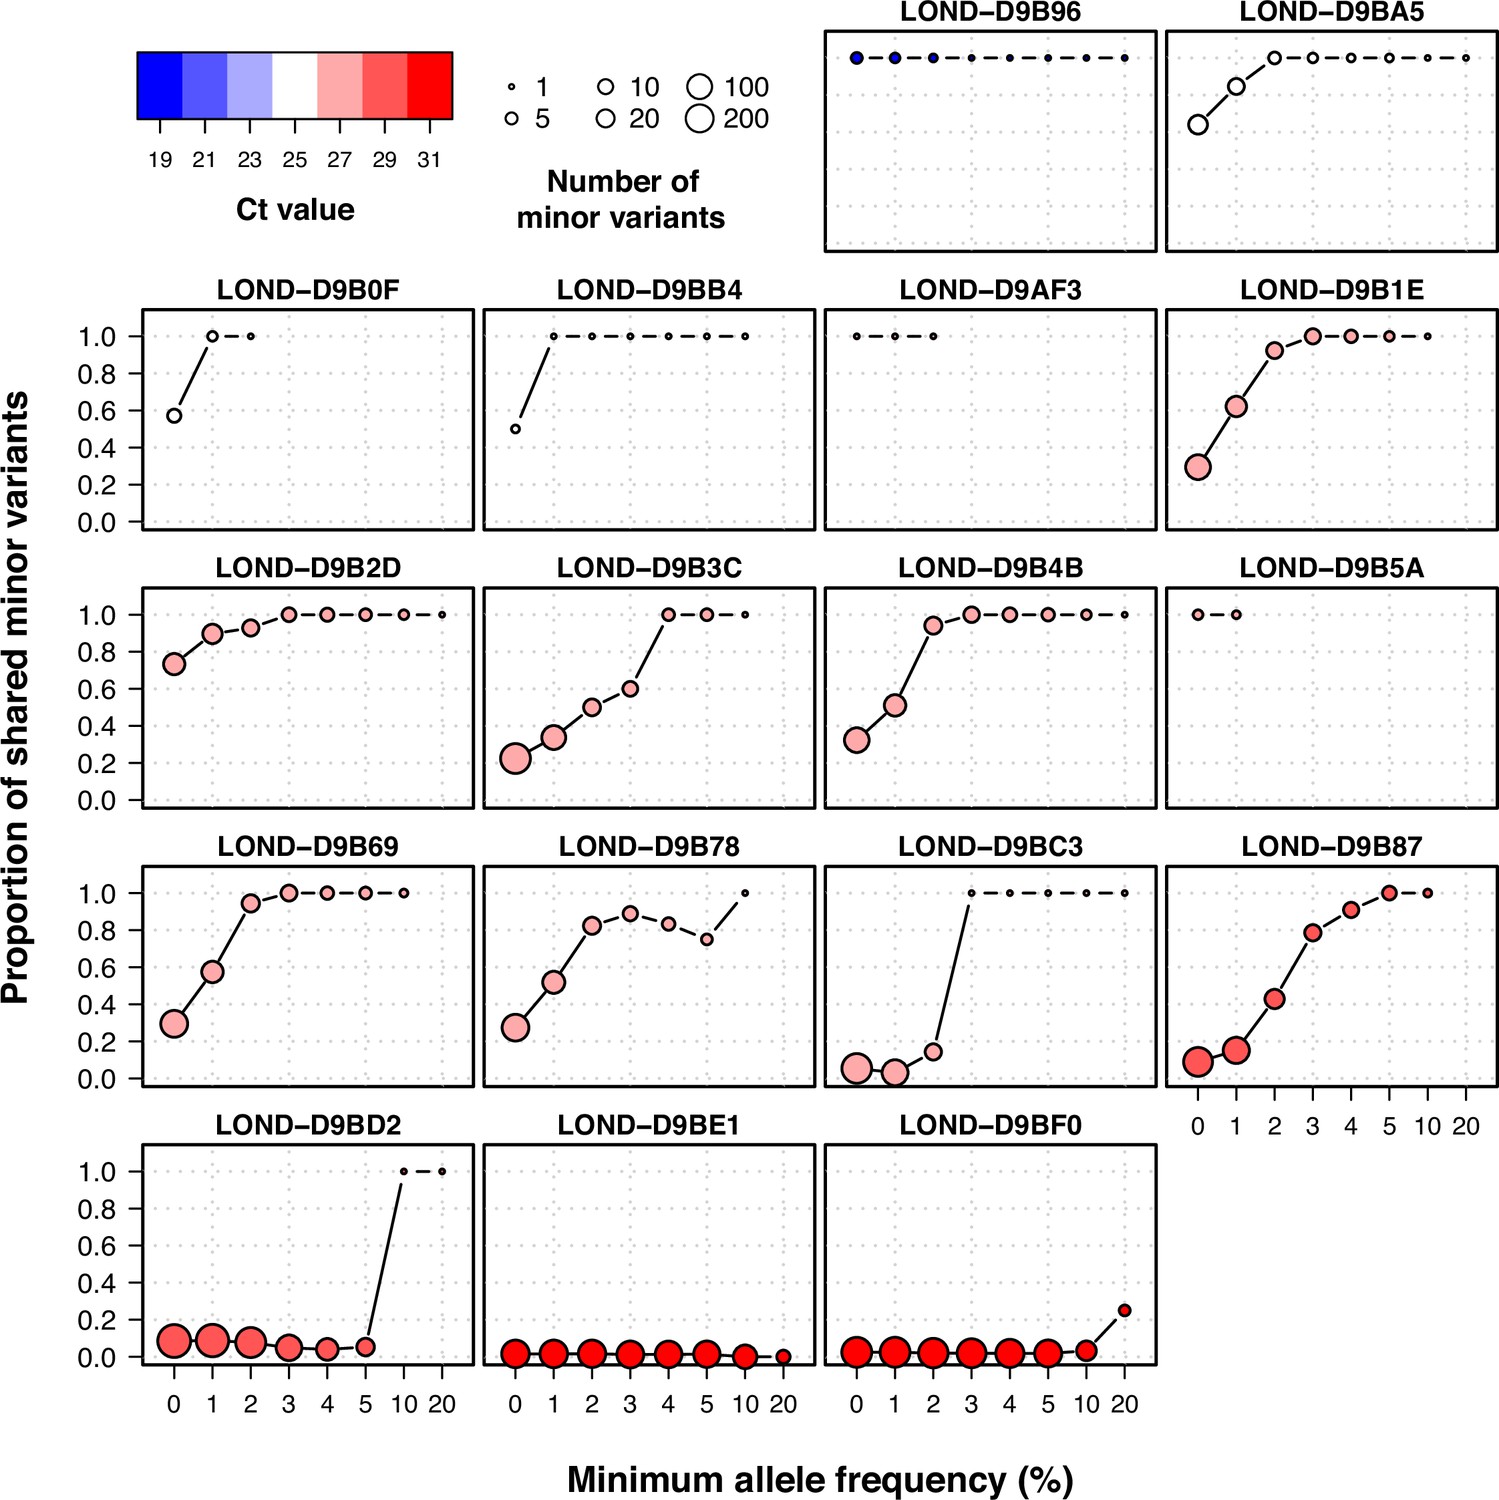
Proportion of shared minor variants between technical replicates using different filters of allele frequency.
Individual plots of shared within-host variants between technical duplicates using increasing thresholds of allele frequency. Colors represent Ct value, while the size of the point shows the total number of within-host variants between the two samples.
Figure 2 with 3 supplements
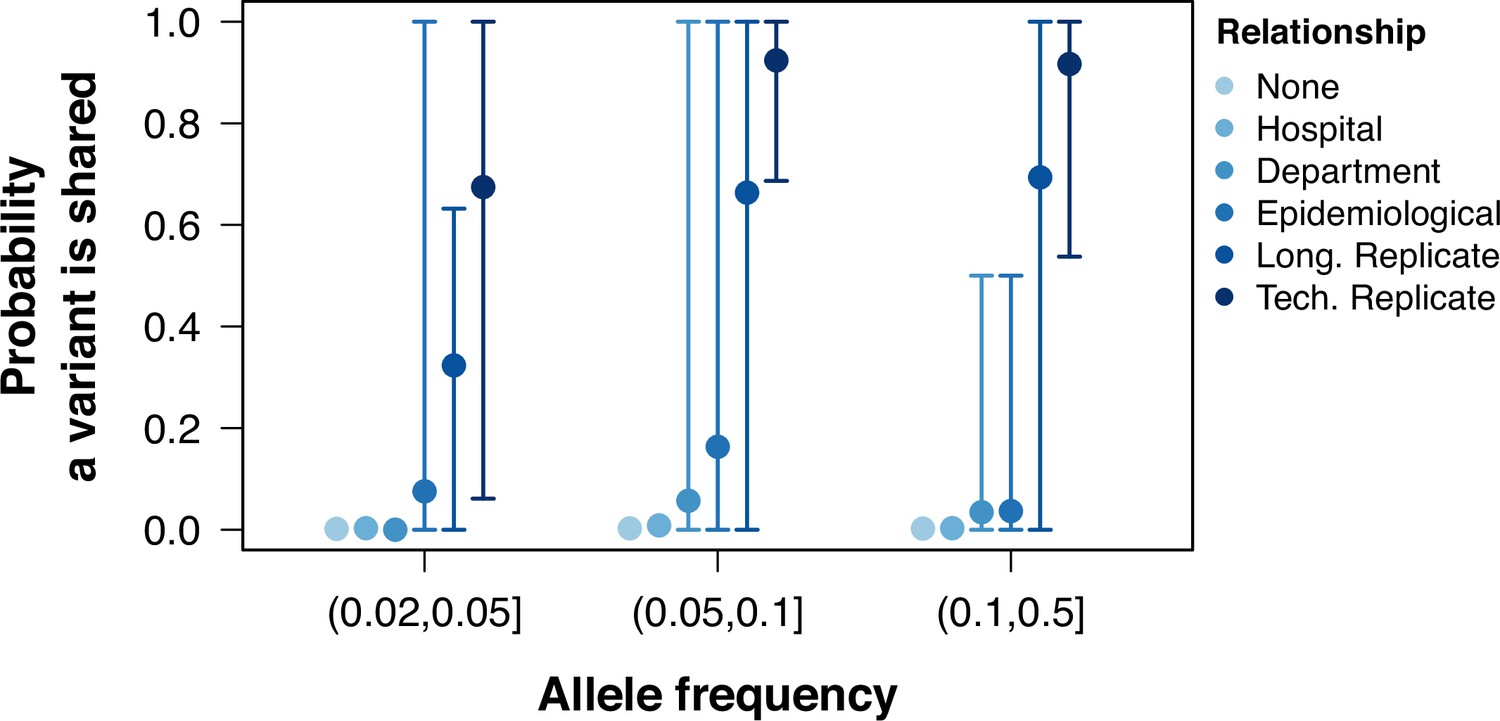
Probability of sharing within-host variants in sample pairs.
The probability of variants shared between pairs of samples calculated as the number of low-frequency variants in both samples divided by the total number of variants between the pair. Colors grouped samples by their relationship. Points represent the mean probability a variant is shared between all pairwise samples within a group and allele frequency. Error bars show the 95th and 5th percentiles.
Figure 2—figure supplement 1

Allele frequency comparison in pairwise sample pairs.
Pairwise allele frequency comparison between isolate pairs with different relationships. Allele frequencies were compared between isolates with no relationship, from the same hospital, from the same department, with epidemiological links, as well as between longitudinal and technical replicates.
Figure 2—figure supplement 2

Probability that minor variants are shared.
Probability that low-frequency variants are shared inferred with a logistic model with allele frequency and epidemiological relationship as independent variable and whether a variant is shared or not as dependent variable. Y-axis in logarithmic scale for representation. Solid lines represent the model‘s best fit, while shaded areas show the 95% CI.
Figure 2—figure supplement 3
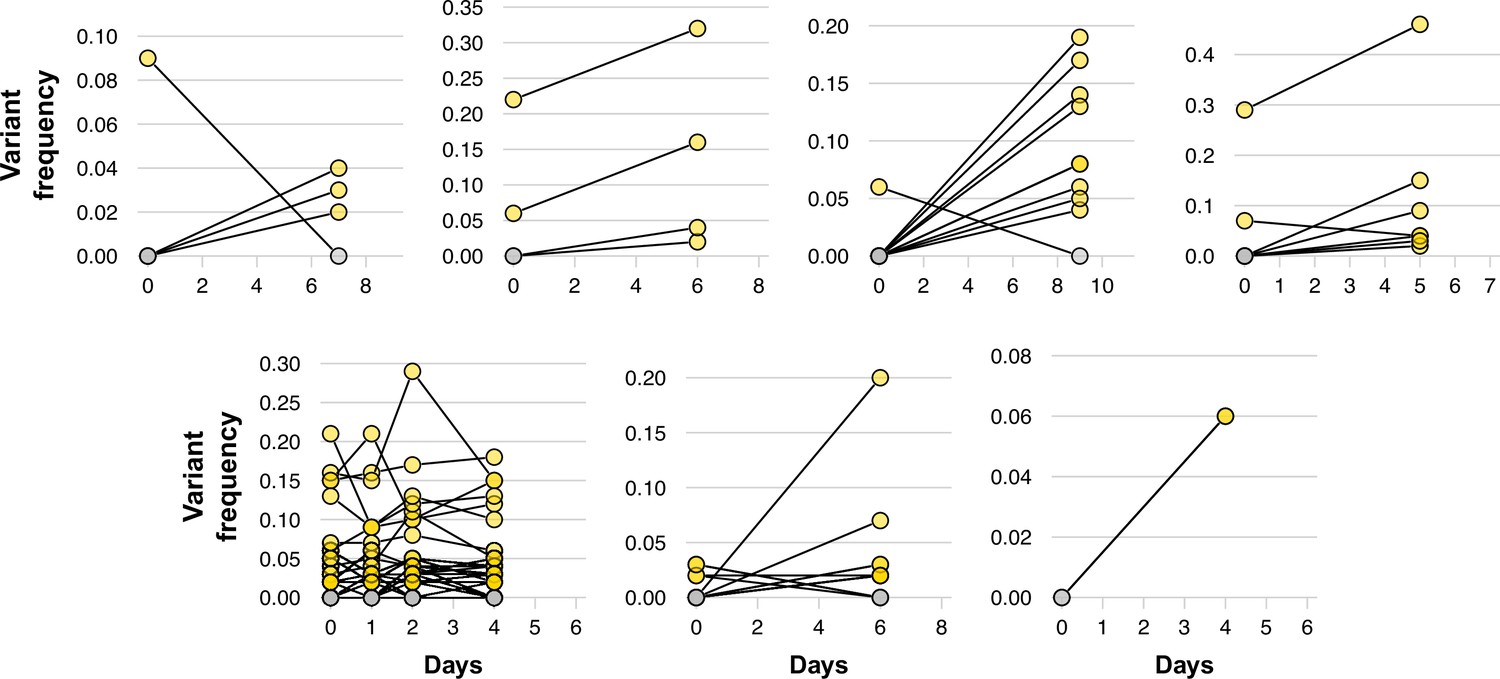
Dynamics of low-frequency variants in longitudinal duplicates.
Variant frequency of low-frequency variants through time in longitudinal duplicates. Each panel represents a single individual, with variants indicated by dots at each time point. The same variant at different time points is linked by lines. Yellow colors represent variants that are consistently found at each time point, while gray dots show variants that present in the first sampling event but lost in subsequent isolates.
Figure 3
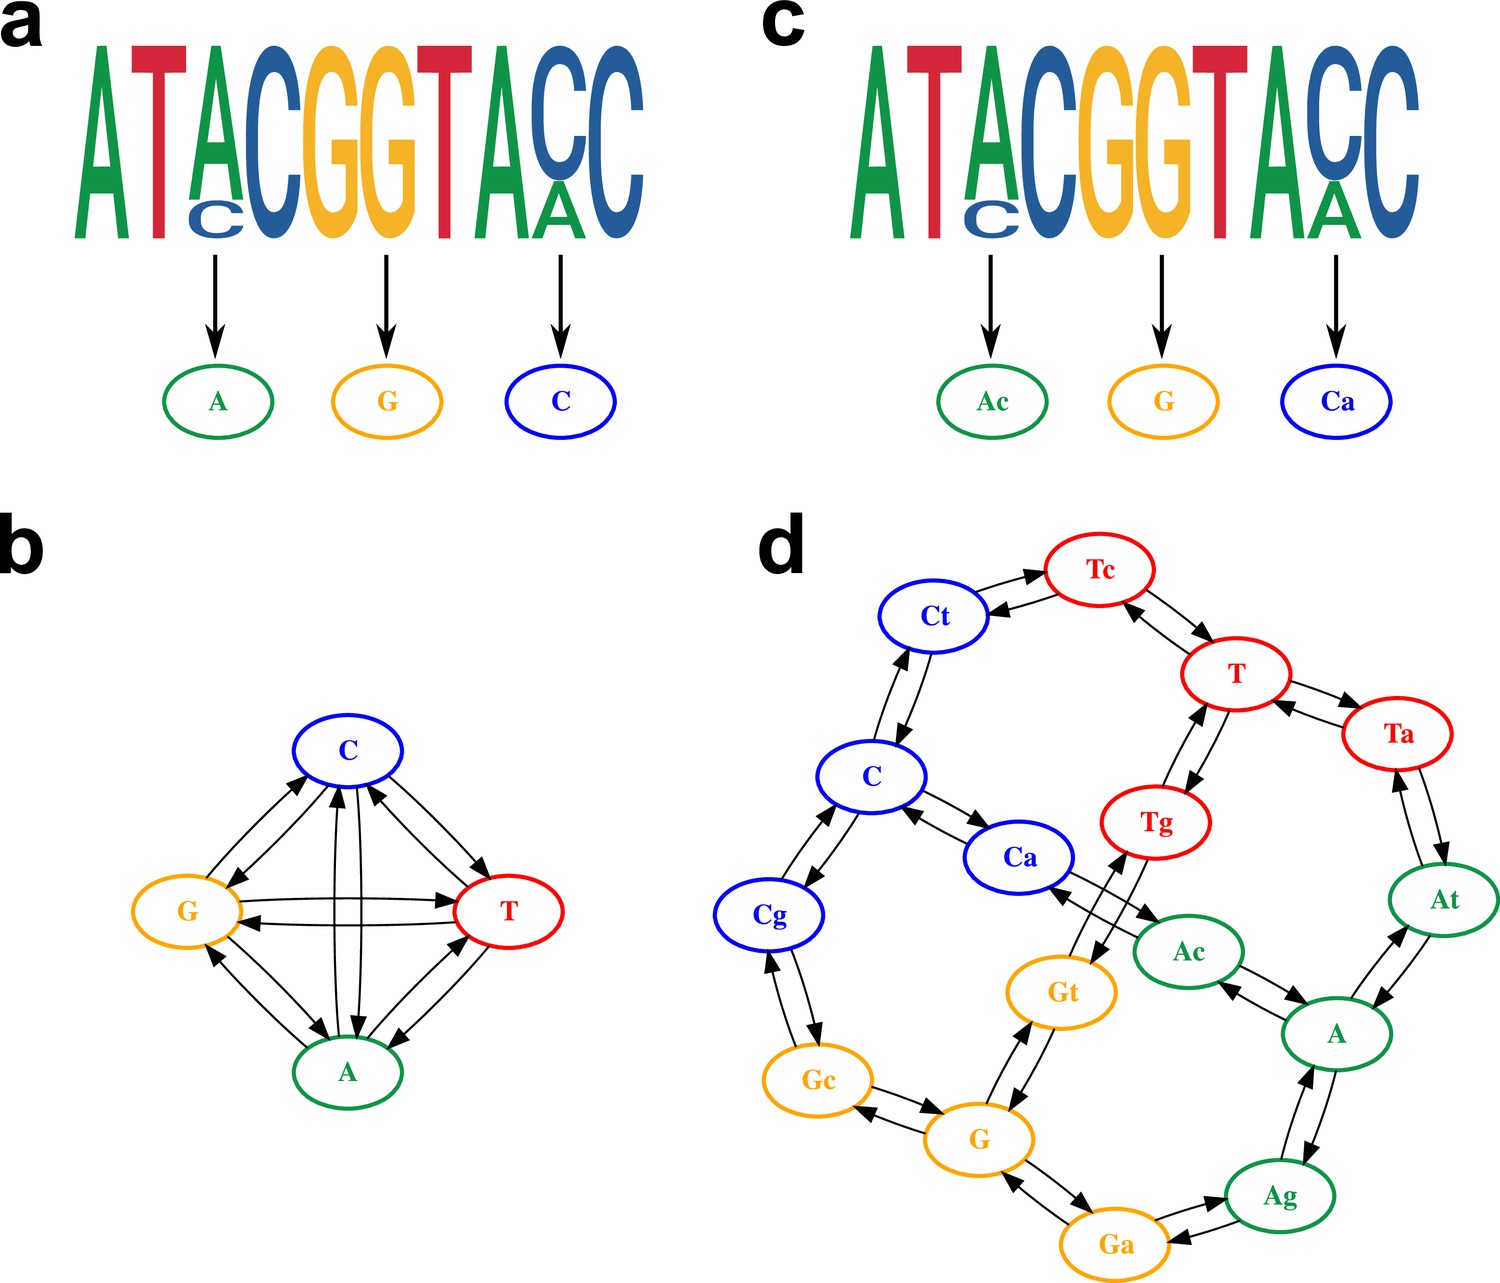
Model of within-host diversity.
Proposed evolutionary model of within-host diversity in genomic sequences. Uppercase letters represent the major variant in the population, while lowercase letters indicate presence of a minor variant alongside the major one. (a, c) Genome sequences where some positions show within-sample variation (top), represented by a major allele (big size letter) and a minor one (smaller size), as well as its representation in the alignment (bottom). (b, d) Models of nucleotide evolution. Character transitions are indicated by arrows. (a) Consensus sequence, where only the major allele is represented in the alignment. (b) Model of nucleotide evolution using the consensus sequence, with four character states representing the four nucleotides. (c) Sequence with within-sample variation, represented by an uppercase letter for the major allele and a lower case letter for the minor allele. (d) Model of nucleotide evolution with 16-character states accounting for within-sample variation.
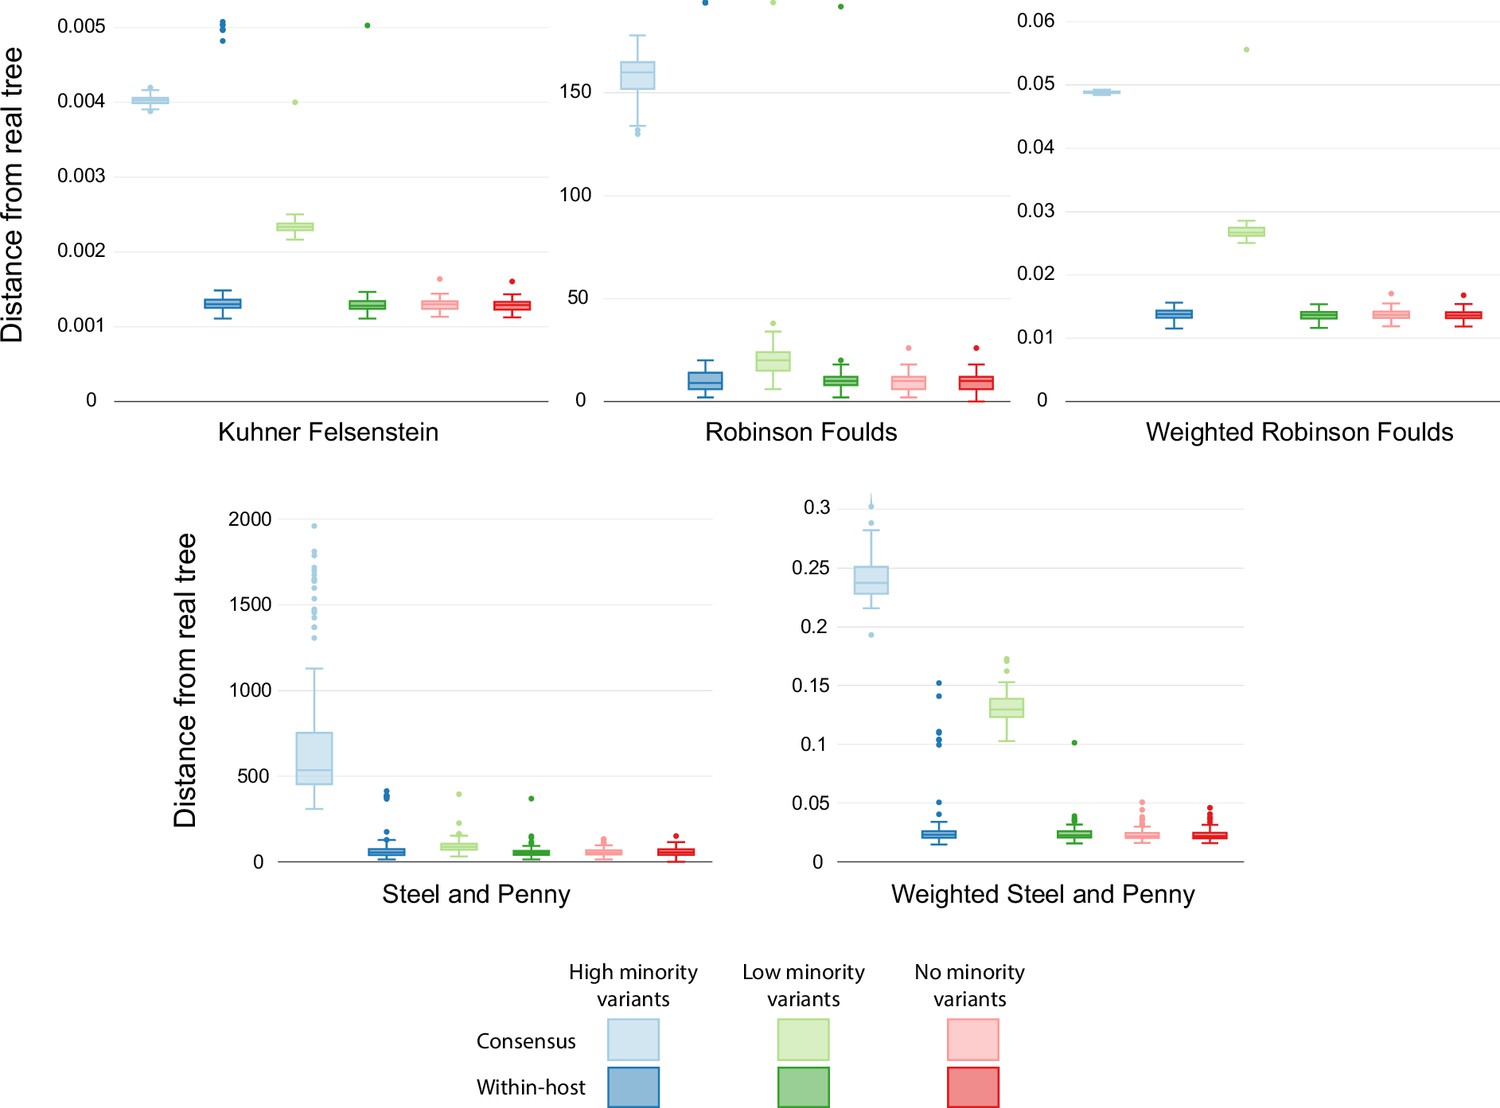
Figure 4 with 2 supplements
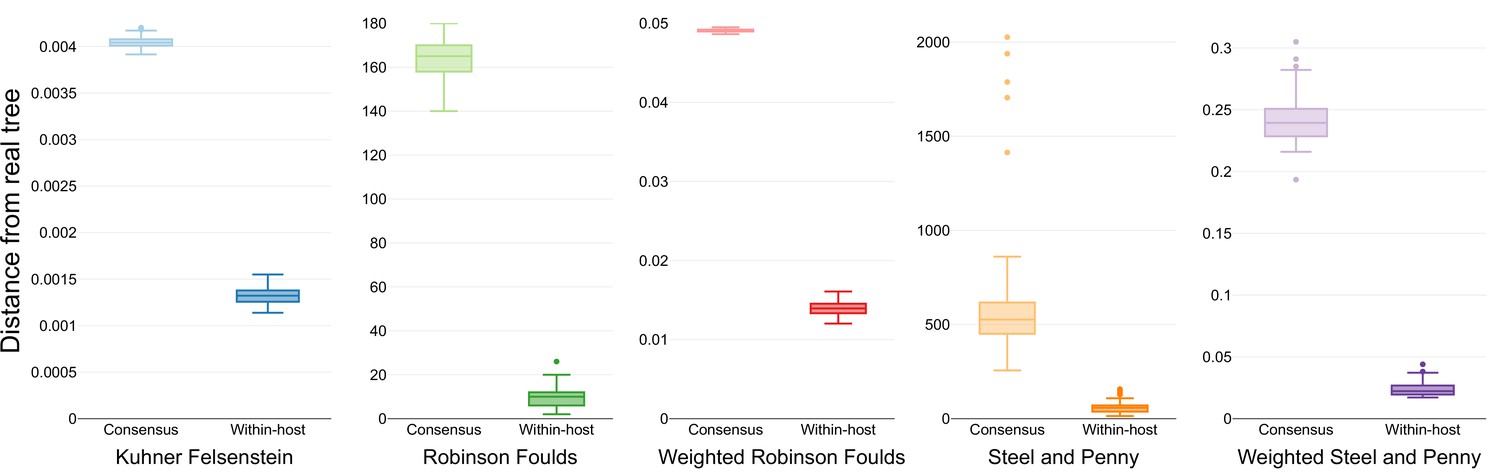
Similarity scores for inferred trees.
Comparison of the phylogenetic trees inferred using simulated sequences from known random starting trees and different phylogenetic models. Colors differentiate the metrics used for the comparison.
Figure 4—figure supplement 1
Similarity scores for inferred trees with different rates.
Comparison of the phylogenetic trees inferred using simulated sequences with different transition/transversion rates to reflect different within-host diversity levels. Colors show the different rates of within-host evolution. Light colors represent trees inferred with consensus alignments, while dark colors show trees inferred with the model accounting for within-host diversity.
Figure 4—figure supplement 2

Similarity scores for inferred trees from coalescent simulations.
Comparison of the phylogenetic trees inferred using simulated sequences from known coalescent starting trees and different phylogenetic models. Colors differentiate the metrics used for the comparison.
Figure 5
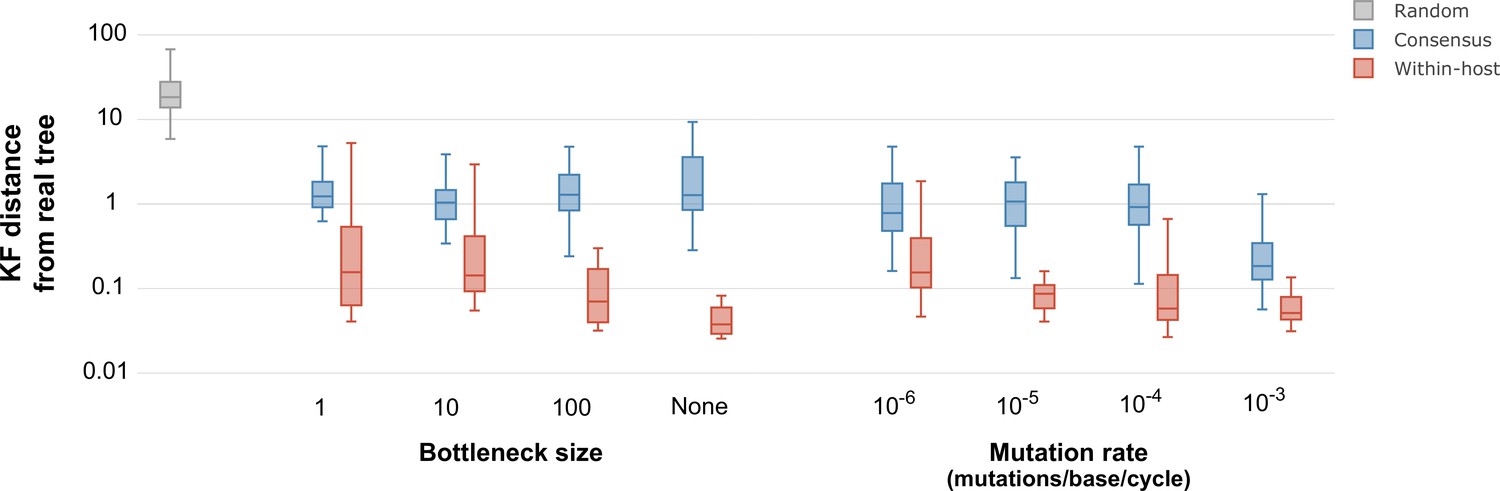
Inferred phylogenetic trees from outbreak simulations.
Kuhner and Felsenstein (KF) tree distance between phylogenetic trees from simulated outbreaks. Phylogenies were inferred using consensus sequences (blue) and alignments reflecting within-sample diversity (red), and compared to the known phylogeny of the simulated outbreak. For reference, gray color represents a set of random trees. Outbreak simulations were performed with different bottleneck sizes and mutation rates. The mutation rate is measured as the number of mutations per base per generation cycle.
Figure 6 with 3 supplements
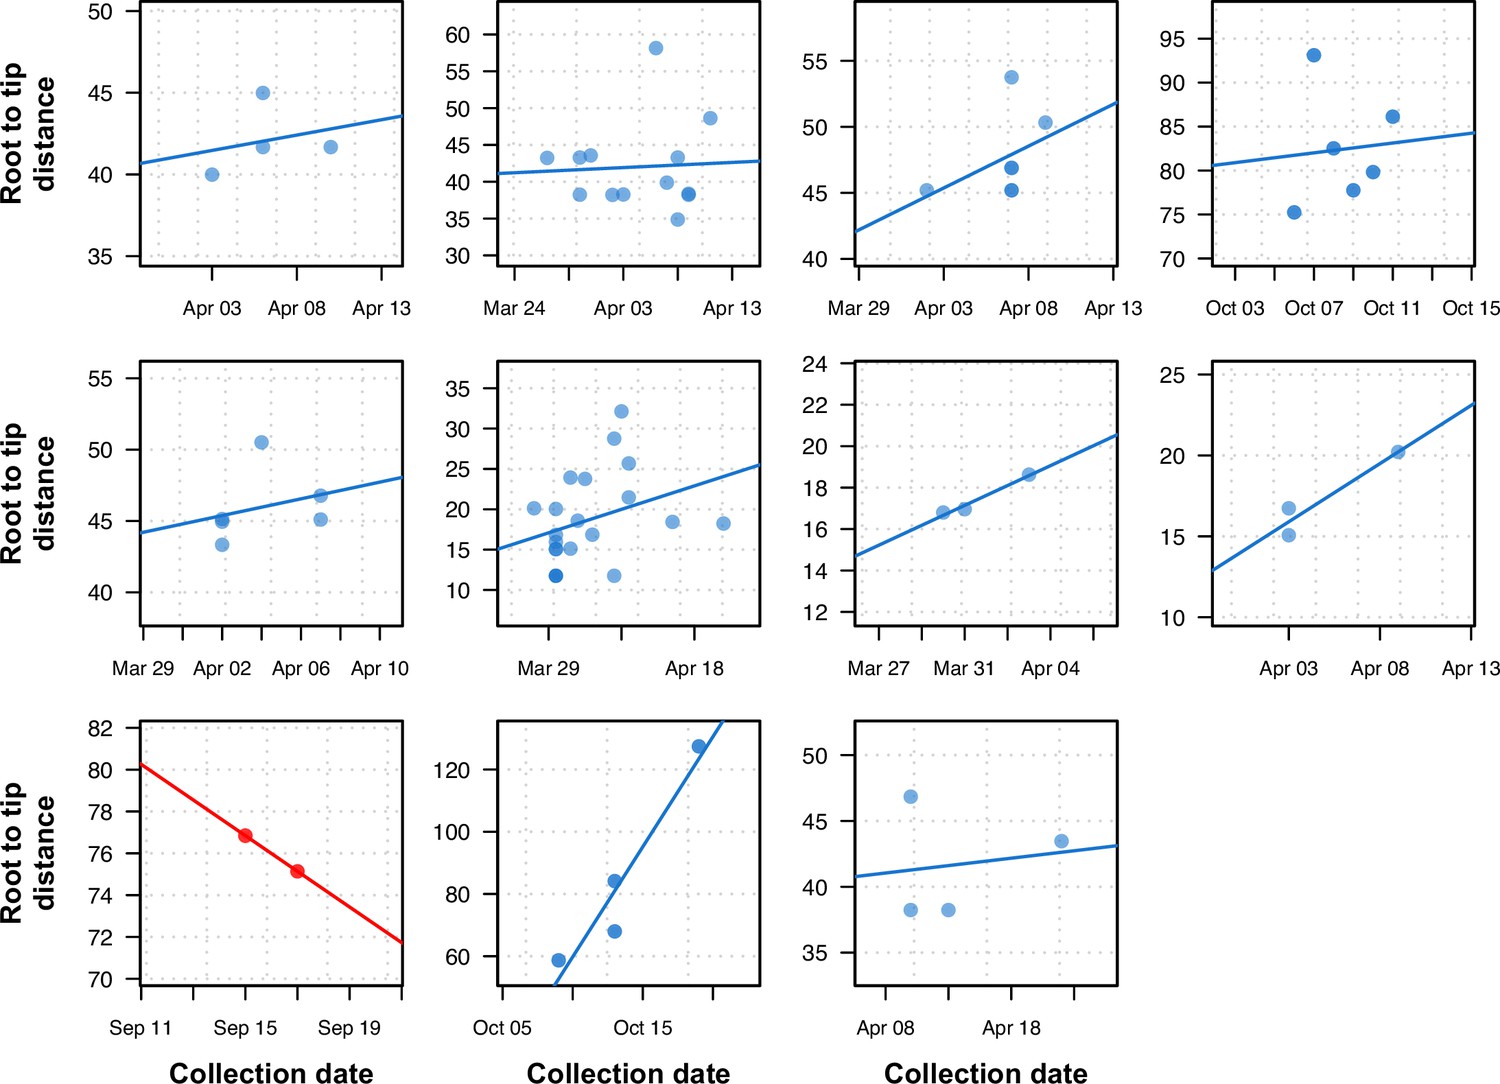
Previously uninformative clusters present temporal signal when using within-sample diversity.
A set of 11 outbreak clusters (one per panel, each plotting the root-to-tip distance in number of substitutions per genome against time) in which all samples had identical consensus genomes sequences (and therefore no temporal signal). Blue colors indicate those regressions that after utilizing within sample diversity now have a positive slope (temporal signal), and red shows those regressions that have a negative slope (misleading or false positive temporal signal).
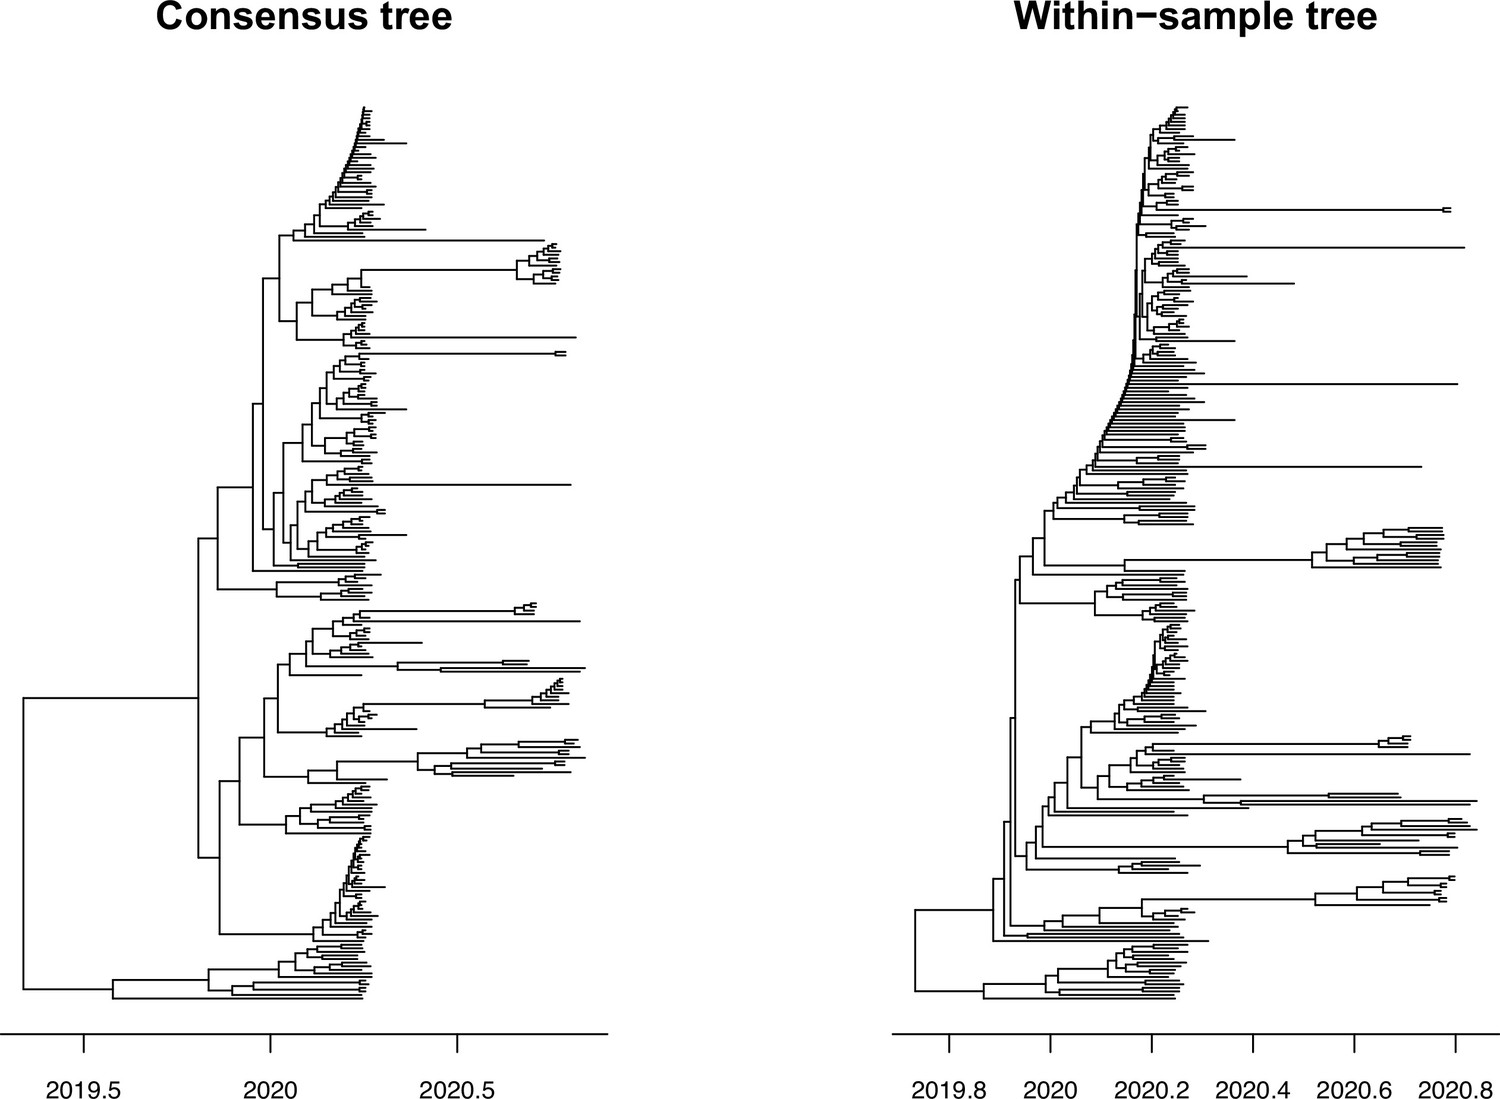
Figure 6—figure supplement 1
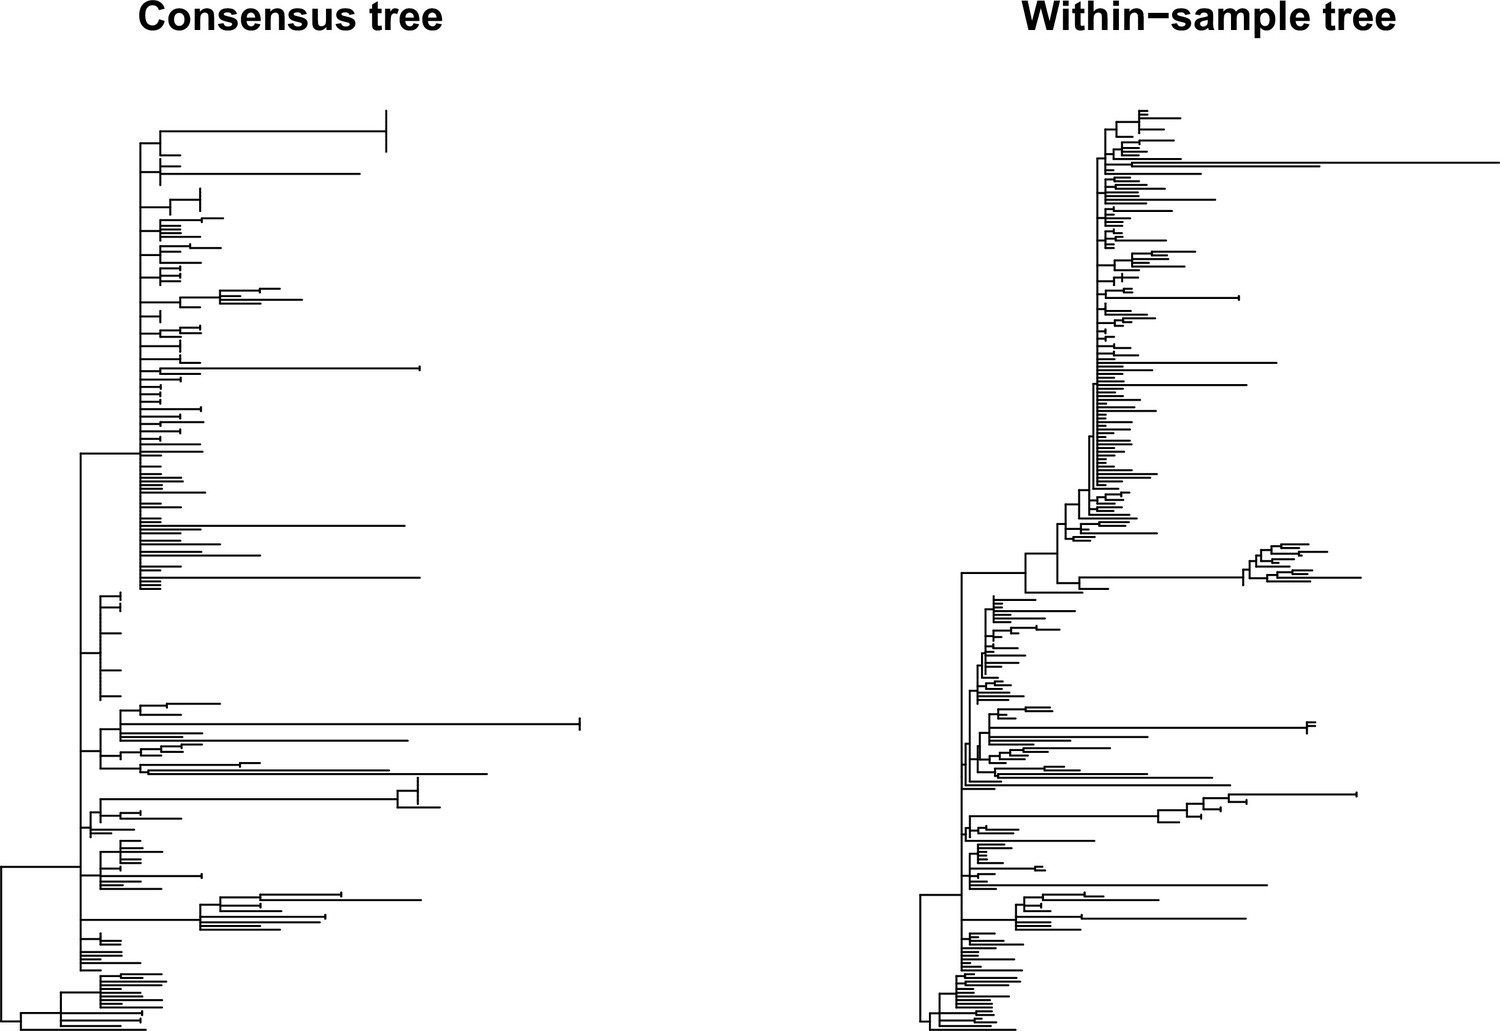
Phylogenetic trees for SARS-CoV-2.
SARS-CoV-2 phylogenetic trees inferred from consensus sequences (left) and an alignment with major and minor variant information (right).
Figure 6—figure supplement 2

Genetic distance between longitudinal samples.
The genetic distance in the phylogenetic tree inferred using within-sample diversity increased as the between longitudinal samples progressed. Black line shows the best fit in a linear model, while the blue shaded area represents the 95% CI.
Figure 6—figure supplement 3
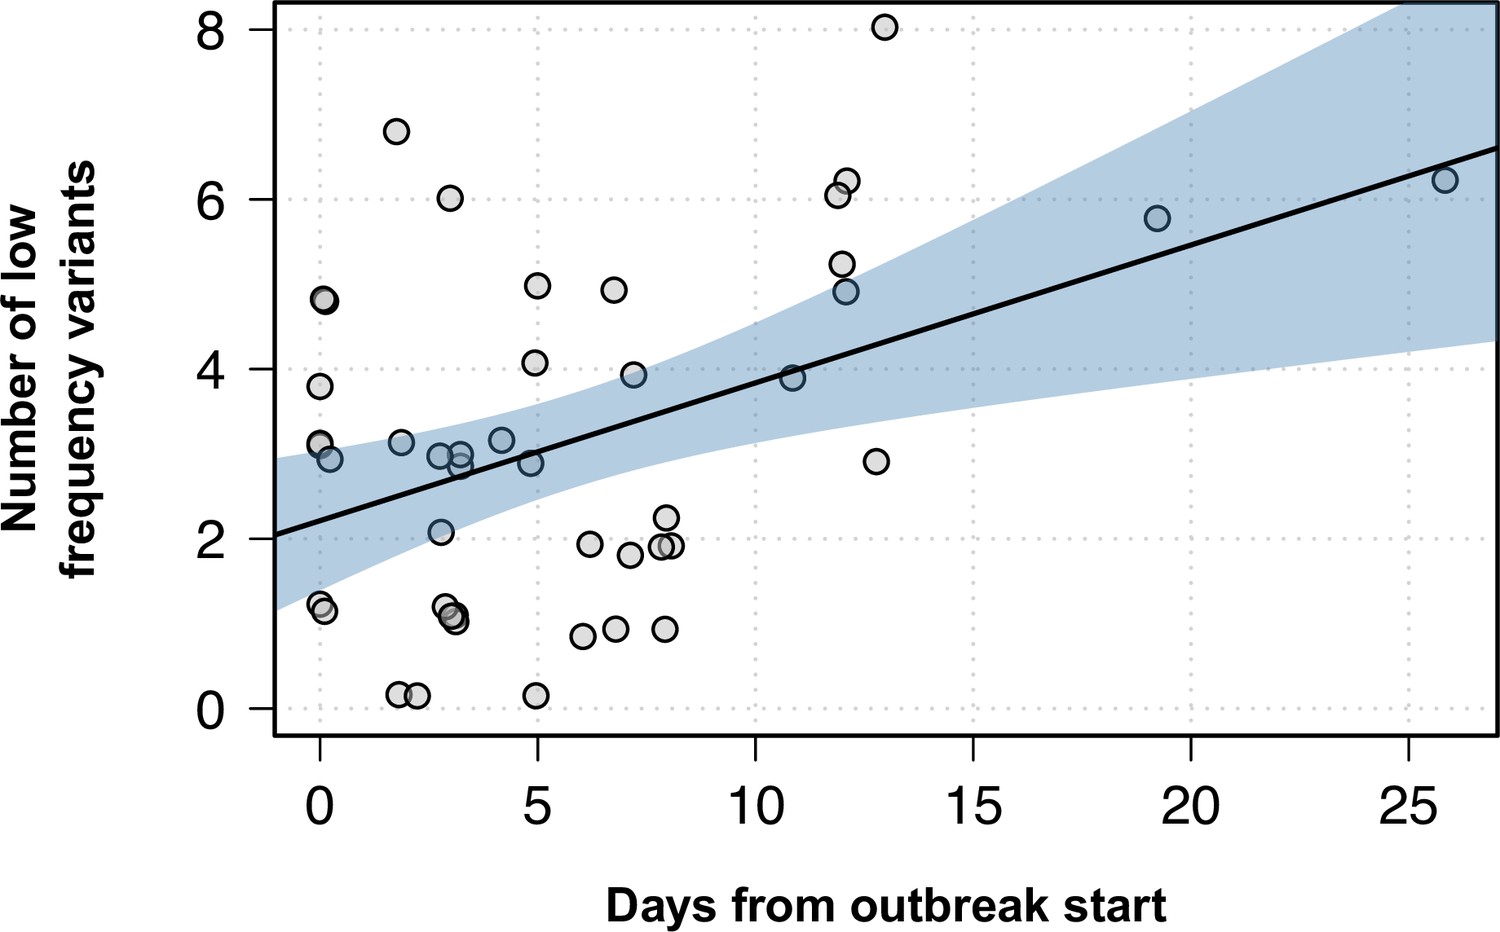
Number of low-frequency variants within outbreaks as the outbreak progresses.
Y-axis shows the number of low-frequency variants for each isolate within an outbreak, while the x-axis represents the days since that particular outbreak started. Black line shows the best fit in a linear model, while the blue shaded area represents the 95% CI.
Figure 7 with 2 supplements
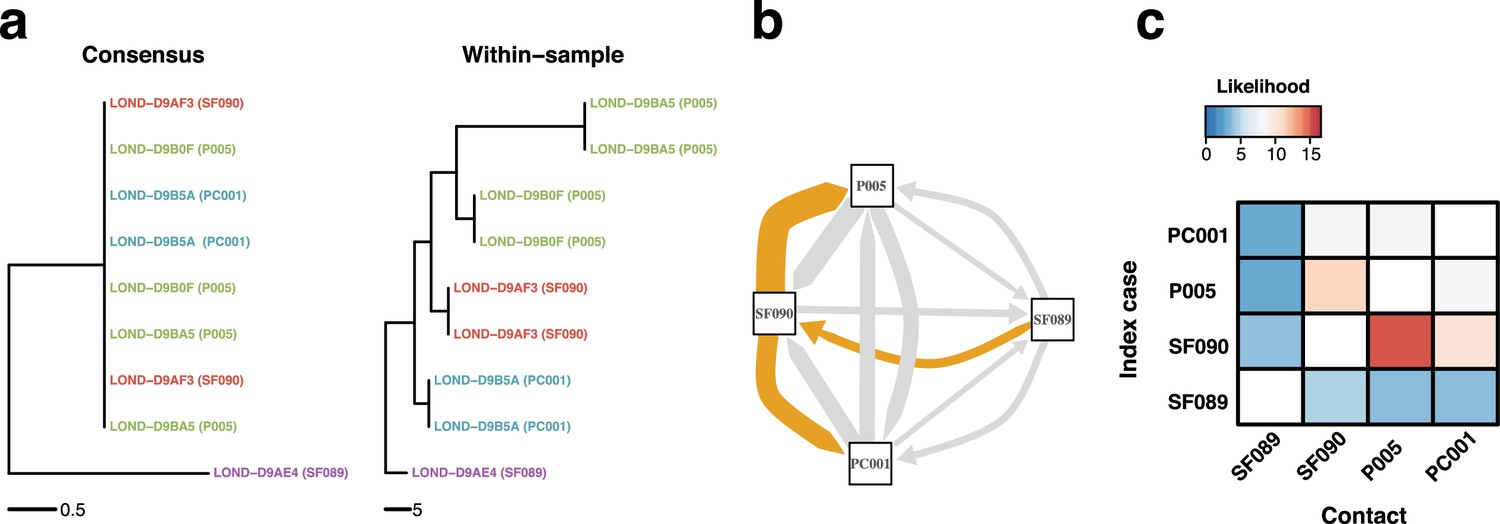
Within-sample variation improves resolution of infectious disease outbreaks.
Effect of using low-frequency variants in phylogenetic inference. (a) Maximum likelihood phylogeny using the consensus sequences (left) and the alignment leveraging within-sample variation. Replicates of the same sample share the same color. Sample IDs are coded as follows: SF, for staff members; P, for patients; and PC, for patient contacts. (b) Transmission network inferred using within-sample variation. Edge width is proportional to the likelihood of direct transmission using a susceptible-exposed-infectious-removed (SEIR) model. Colored edges represent the Edmunds optimum branching and thus the most likely chain. (c) Heatmap of the likelihood of direct transmission between all pairwise pairs of samples using a SEIR model. Vertical axis is the infector while the horizontal axis shows the infectee.
Figure 7—figure supplement 1
Time-calibrated phylogenetic trees for SARS-CoV-2.
SARS-CoV-2 phylogenetic trees inferred from consensus sequences (left) and an alignment with major and minor variant information (right). Branch lengths are measured in years.
Figure 7—figure supplement 2
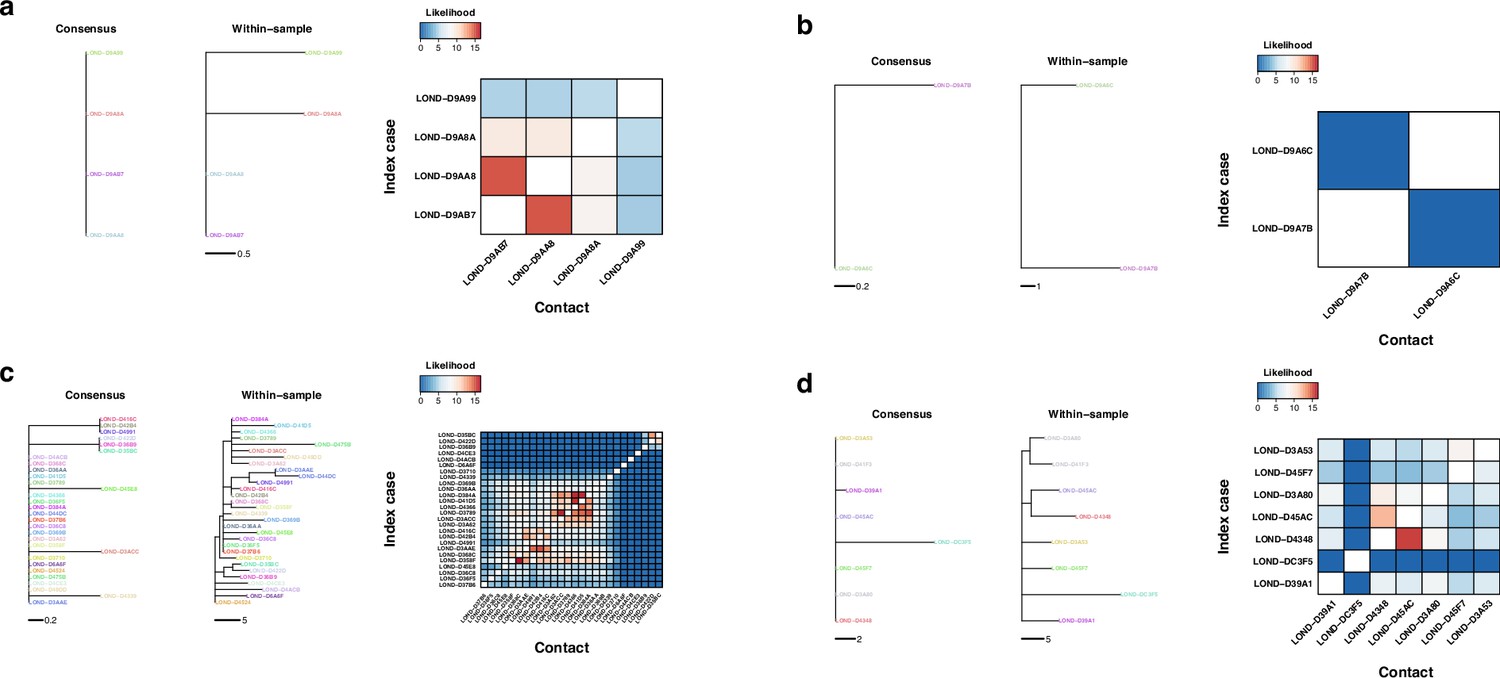
Phylogenetic and transmission for SARS-CoV-2 outbreaks.
(a–d) Phylogenies of SARS-CoV-2 outbreaks. The branch lengths are in units of substitutions per genome, and the scales are shown under the trees. Colors represent samples from the same individual. Samples with the same name are technical replicates. Left tree of each panel shows the phylogeny inferred with the consensus alignment. Right tree represents the phylogeny inferred using within-sample variation. Heatmap shows the likelihood of direct transmission for each pair of samples in a susceptible-exposed-infectious-removed (SEIR) model of transmission. Vertical axis is the infector while the horizontal axis shows the infectee.
Tables
Table 1
SNP distance between pairs of samples.
| Sample relationship | Estimate (95% CI) | p-Value |
|---|---|---|
| None | 11.04 (10.94–11.15) | Reference |
| Hospital | 9.78 (9.48–10.09) | <1×10⁻⁴ |
| Department | 5.15 (4.54–5.83) | <1×10⁻⁴ |
| Epidemiological | 1.5 (1.22–1.78) | <1×10⁻⁴ |
| Longitudinal duplicates | 0 (0–0.2) | <1×10⁻⁴ |
| Technical replicate | 0 (0–0.2) | <1×10⁻⁴ |
Additional files
-
Supplementary file 1
Study participants metadata.
- https://cdn.elifesciences.org/articles/84384/elife-84384-supp1-v2.tsv
-
Supplementary file 2
Sample collection and demographics.
- https://cdn.elifesciences.org/articles/84384/elife-84384-supp2-v2.csv
-
Supplementary file 3
Metrics used for phylogenetic tree comparison.
- https://cdn.elifesciences.org/articles/84384/elife-84384-supp3-v2.csv
-
Supplementary file 4
Transition/transversion rates and base frequencies of the known simulated tree.
- https://cdn.elifesciences.org/articles/84384/elife-84384-supp4-v2.csv
-
Supplementary file 5
Inferred transition/transversion rates and base frequencies when using the consensus sequence.
Numbers show the average of 100 simulations.
- https://cdn.elifesciences.org/articles/84384/elife-84384-supp5-v2.csv
-
Supplementary file 6
Inferred transition/transversion rates and base frequencies when accounting for within-host diversity.
Numbers show the average of 100 simulations.
- https://cdn.elifesciences.org/articles/84384/elife-84384-supp6-v2.csv
-
MDAR checklist
- https://cdn.elifesciences.org/articles/84384/elife-84384-mdarchecklist1-v2.docx
Download links
A two-part list of links to download the article, or parts of the article, in various formats.
Downloads (link to download the article as PDF)
Open citations (links to open the citations from this article in various online reference manager services)
Cite this article (links to download the citations from this article in formats compatible with various reference manager tools)
Within-host diversity improves phylogenetic and transmission reconstruction of SARS-CoV-2 outbreaks
eLife 12:e84384.
https://doi.org/10.7554/eLife.84384


