The evolution of colistin resistance increases bacterial resistance to host antimicrobial peptides and virulence
- Department of Biology, University of Oxford, United Kingdom
- Synthetic and Systems Biology Unit, Biological Research Centre, Eötvös Loránd Research Network, Hungary
- Doctoral School of Multidisciplinary Medical Sciences, University of Szeged, Hungary
- Guangdong Provincial Key Laboratory of Veterinary Pharmaceutics Development and Safety Evaluation, South China Agricultural University, China
- Fujian Provincial Key Laboratory of Soil Environmental Health and RegulaWon, College of Resources and Environment, Fujian Agriculture and Forestry University, China
- Beijing Advanced Innovation Centre for Food Nutrition and Human Health, College of Veterinary Medicine, China Agricultural University, China
Figures
Figure 1 with 2 supplements
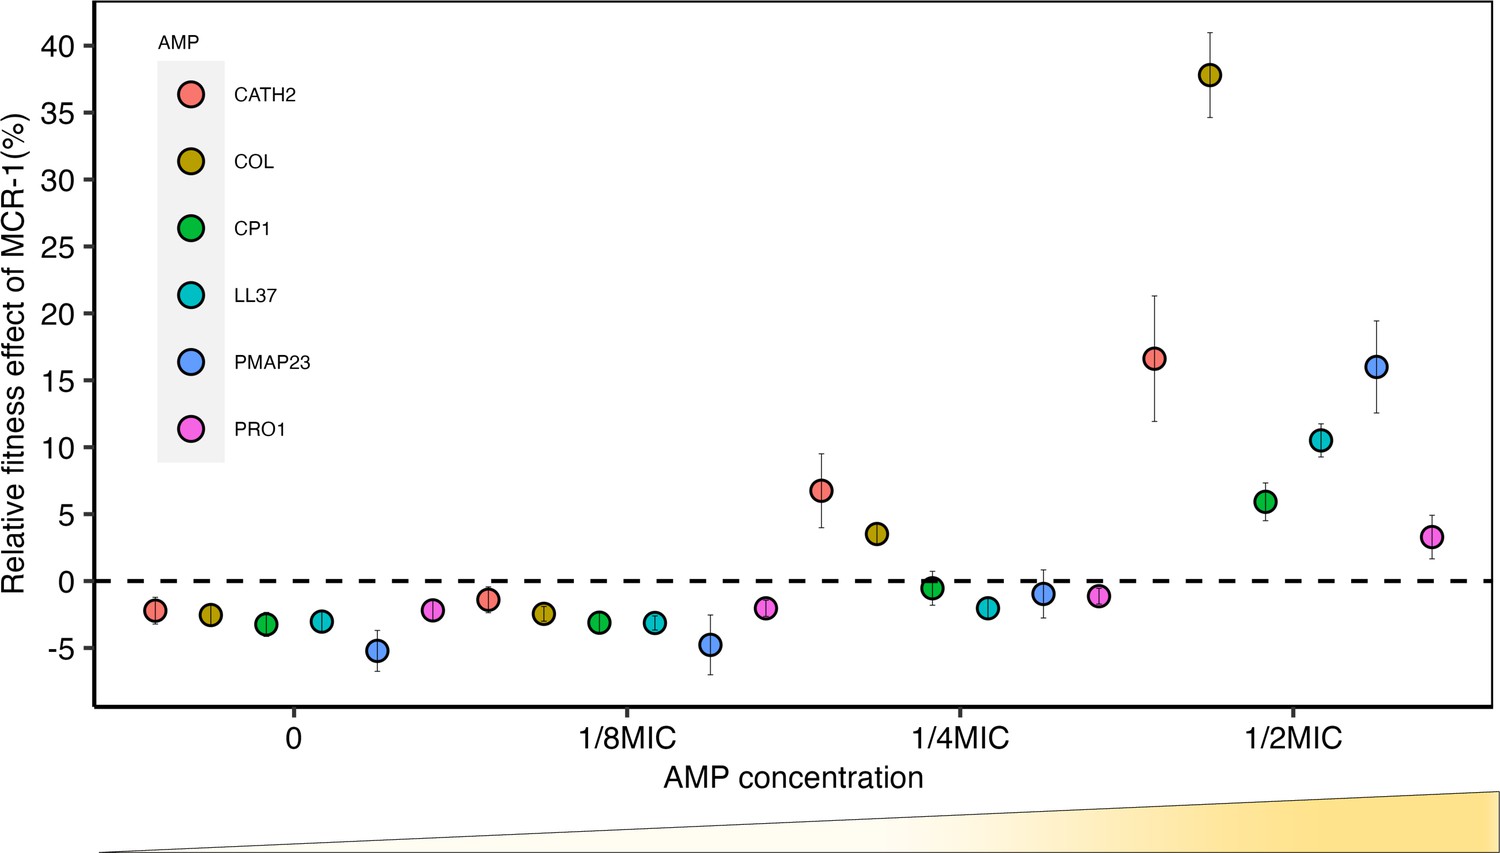
Sub-minimum inhibitory concentration (sub-MIC) doses of antimicrobial peptides (AMPs) generate selection for mobile colistin resistance (MCR).
E. coli carrying mcr-1 expression vector (pSEVA:MCR-1) or an empty vector control (pSEVA:EV) were competed against a tester strain carrying a chromosomally integrated GFP across a range of AMP concentrations (n = 6 biological replicates per competition). Plotted points show the competitive fitness effect of the MCR-1 expressing strain relative to the empty vector control (±SE). To facilitate comparisons across AMPs, fitness is plotted as a function of relative AMP concentration, and the dashed line represents equal fitness.
Figure 1—figure supplement 1
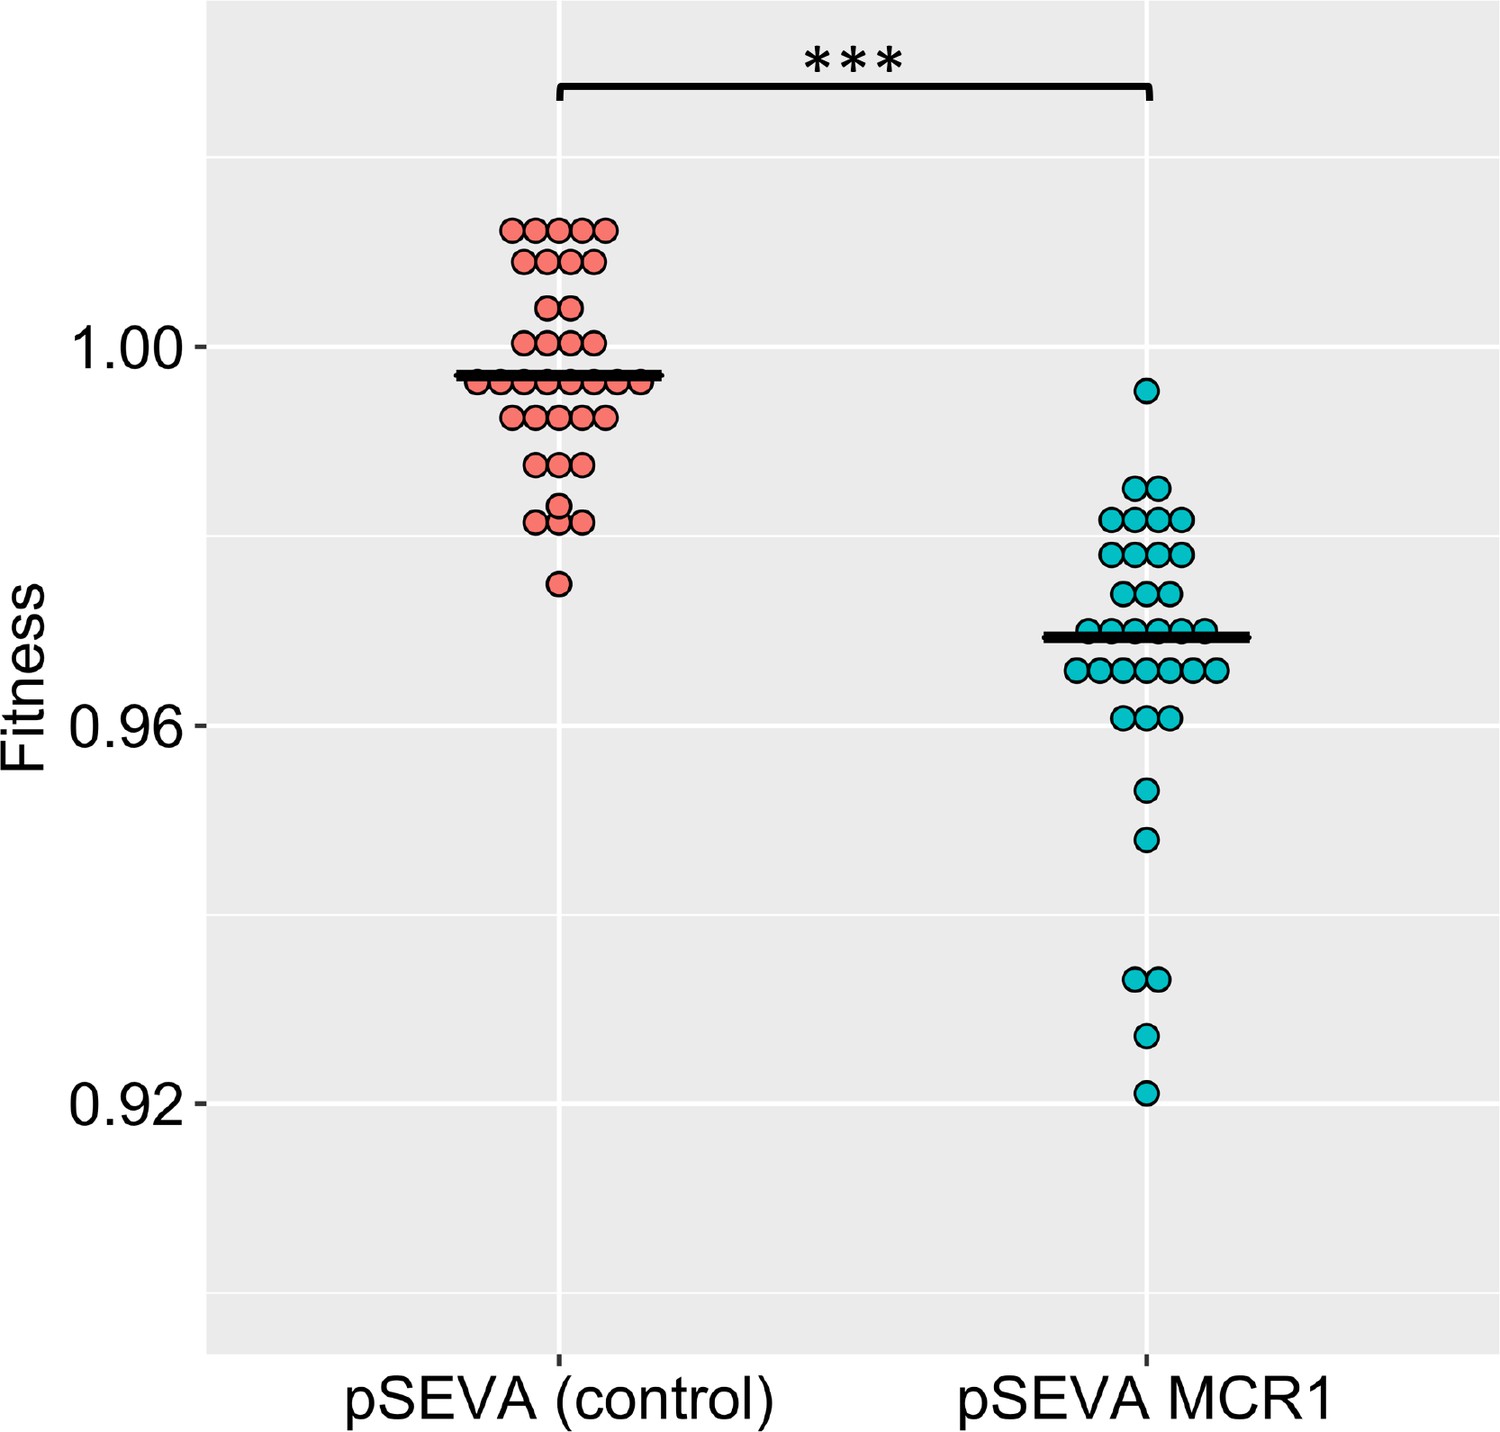
MCR-1 imposes a significant fitness burden in the absence of an antimicrobial peptide (AMP) (p=1.174e-15, from two-sided Mann–Whitney U-test, n = 36 for each genotype).
In this figure, we have plotted fitness data for colistin and five host AMPs together for each genotype. Fitness was calculated by competing the pSEVA plasmid strains against GFP-labeled E. coli (see ‘Methods’).
Figure 1—figure supplement 2
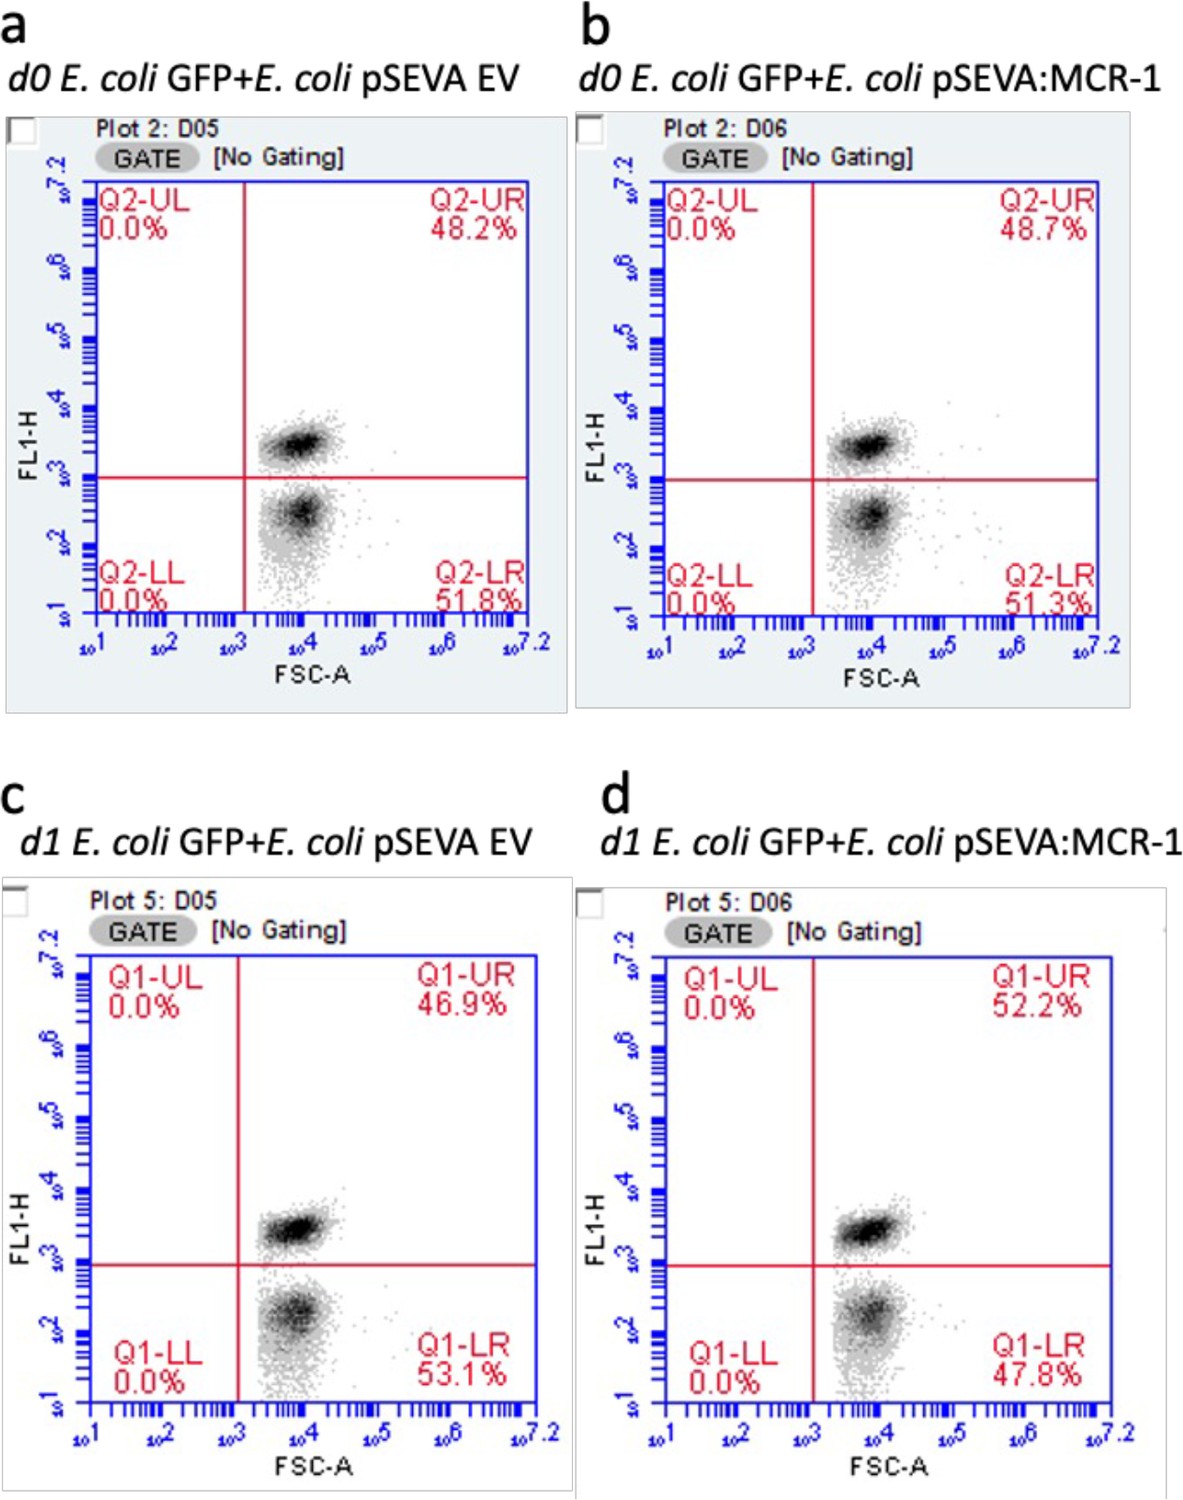
Gating strategy to analyze the selective fitness benefits of MCR-1.
Figures show cell density of fluorescent (GFP-labeled E. coli; gate – UR) and nonfluorescent cells (E. coli pSEVA EV or E. coli pSEVA:MCR-1; gate – LR) before (a, b) and after the competition (c, d) in the absence of an antimicrobial peptide (AMP). Cells were gated using FL1-H and forward scatter properties. Data are provided in Supplementary file 2.
Figure 2 with 4 supplements
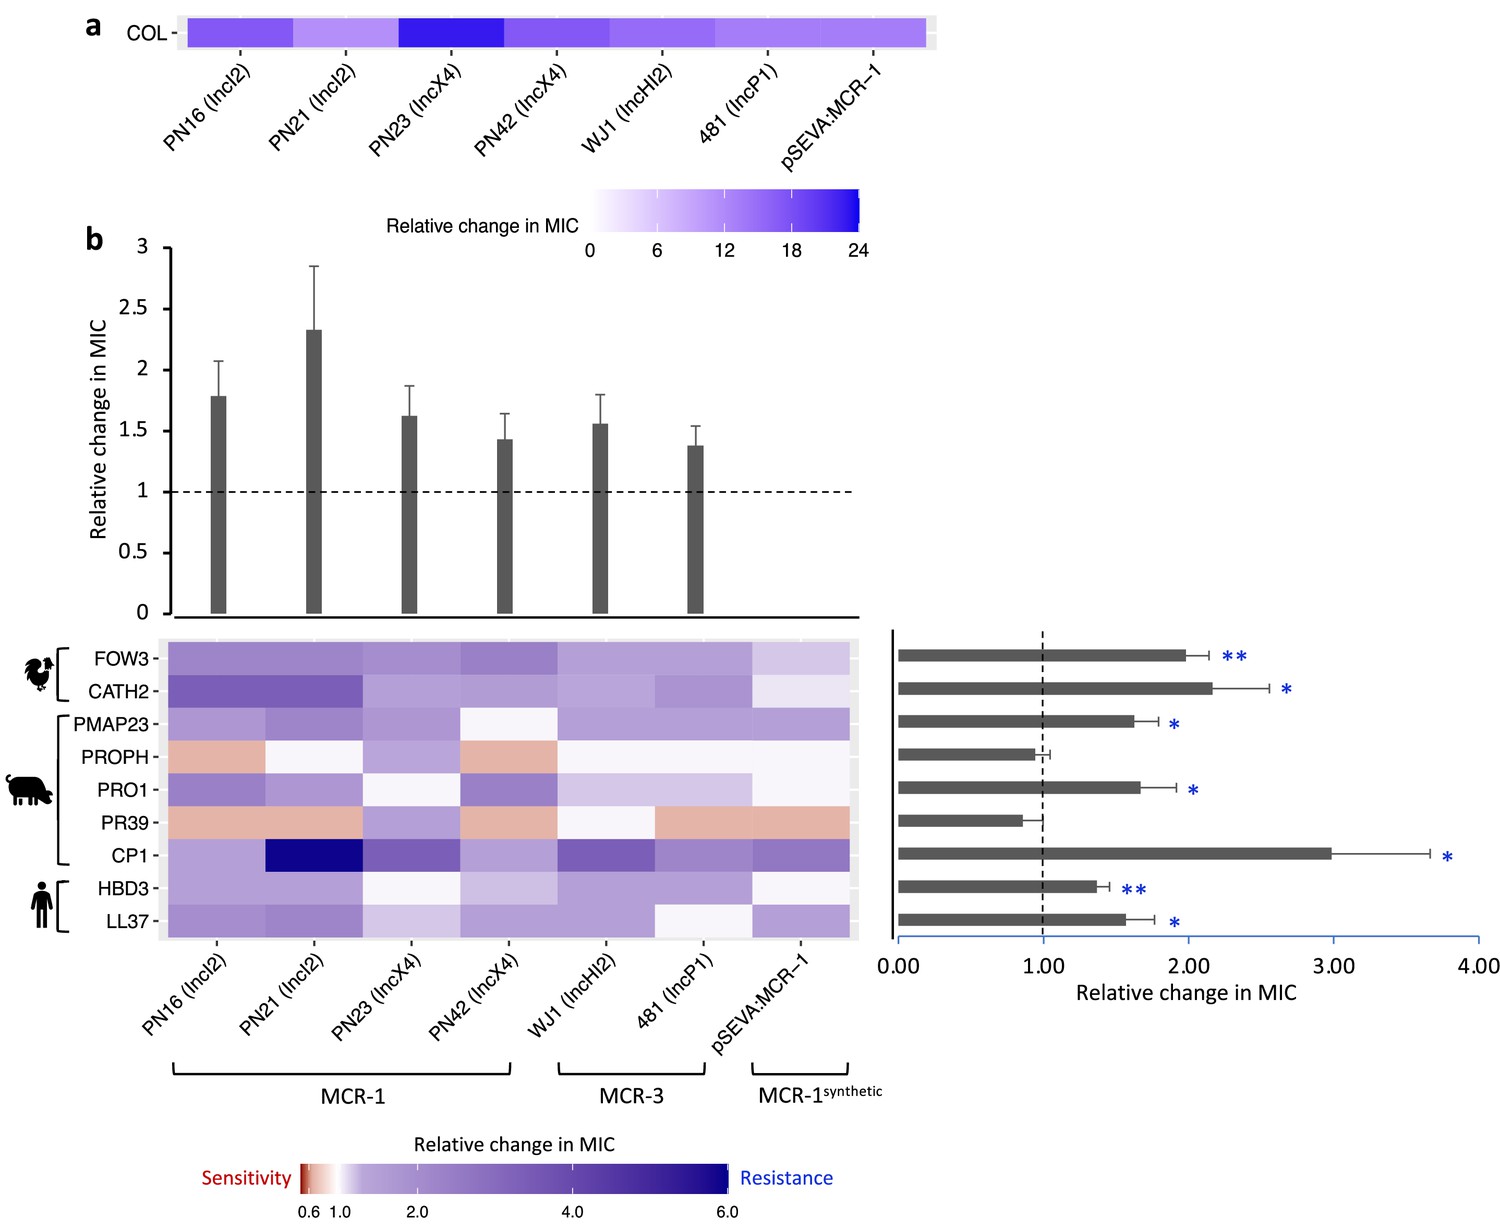
Mobile colistin resistance (MCR)-mediated changes in bacterial susceptibility to host antimicrobial peptides (AMPs).
Heatmaps depict the effect of MCR plasmids on resistance to colistin (a) and host AMPs (b). Bacterial susceptibility to AMPs was tested by measuring minimum inhibitory concentrations (MICs), and changes in resistance were assessed relative to control strains lacking MCR (n = 3 biological replicates per MIC). Natural plasmids carried either MCR-1 or MCR-3 are shown according to plasmid incompatibility group. Resistance for these plasmids was measured relative to the E. coli J53 parental strain. The impact of the synthetic pSEVA:MCR-1 plasmid on resistance was measured relative to a strain with a pSEVA empty vector. Dashed lines represent control strain. Bar plots show average changes in MIC for natural MCR plasmids and did not include pSEVA:MCR1 (±SE; n = 9 for host AMPs, n = 6 for plasmids; *p<0.05 one-sample t-test, LL37- 0.033; HBD3- 0.0088; CP1- 0.032; PR39- 0.353; PRO1- 0.0424; PROPH- 0.5964; PMAP23- 0.0136; CATH2- 0.030; FOW3- 0.001).
Figure 2—figure supplement 1
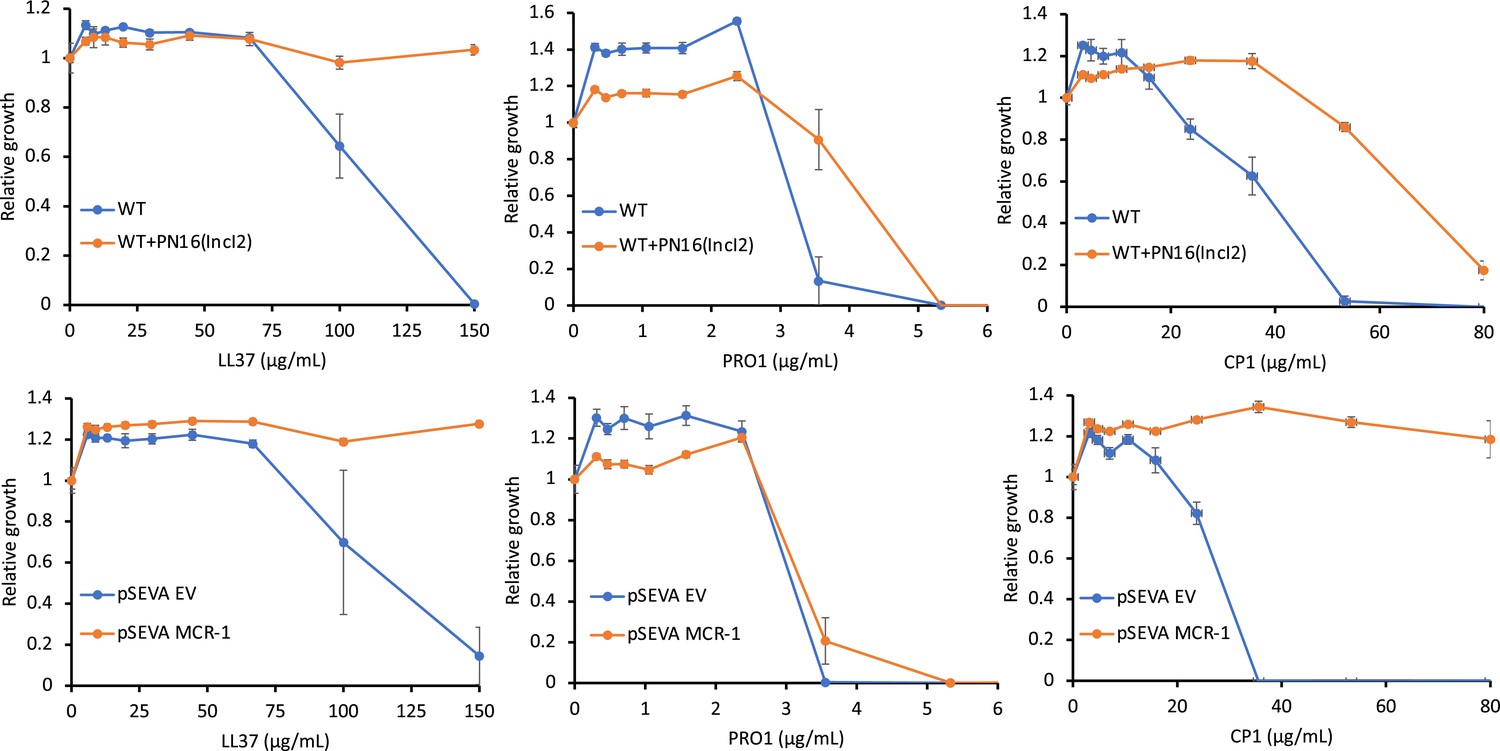
Antimicrobial peptide (AMP) susceptibility of E. coli carrying mobile colistin resistance (MCR) natural plasmids and the synthetic pSEVA:MCR-1.
The minimum inhibitory concentration (MIC) assays were carried out in MHBII (cation-adjusted) medium. Error bars indicate standard errors based on three biological replicates.
Figure 2—figure supplement 2
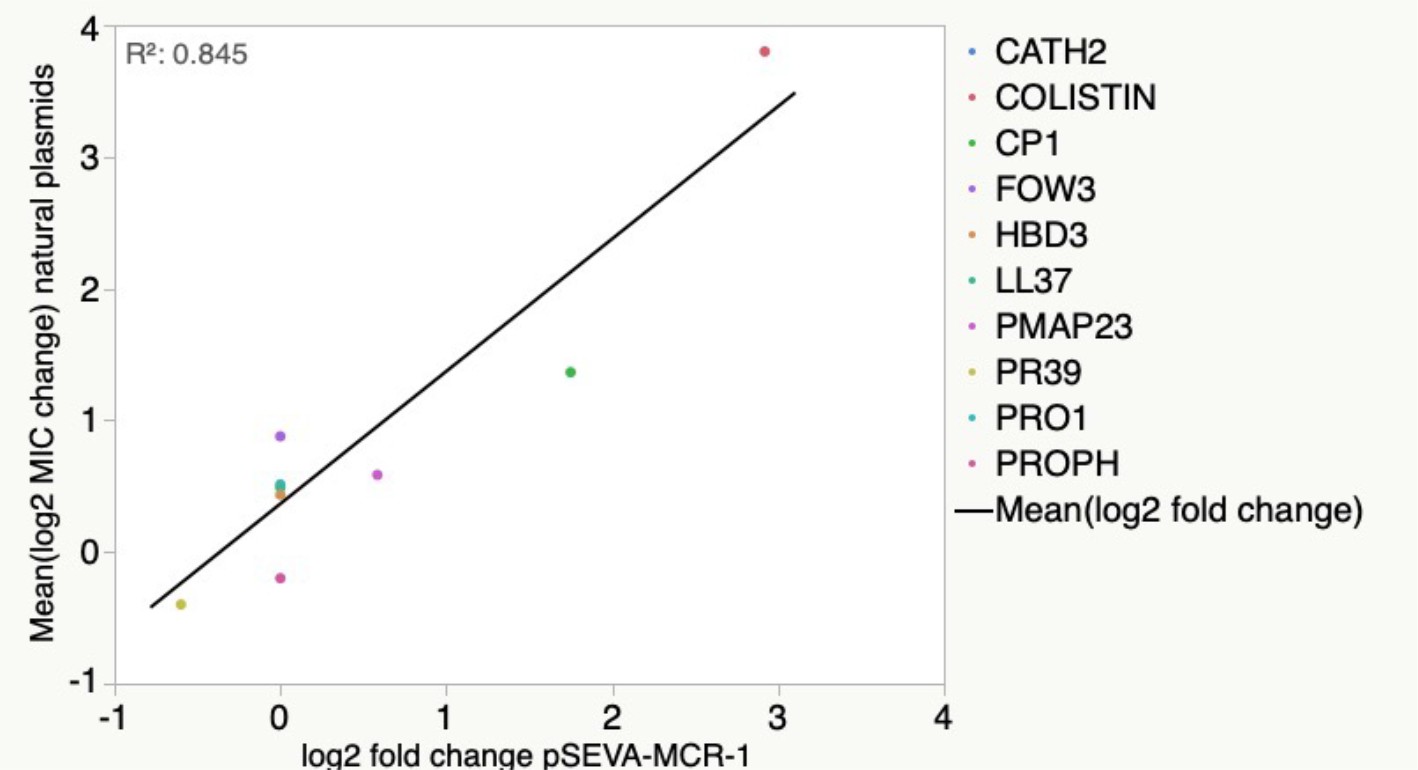
Antimicrobial peptide (AMP) resistance phenotype obtained for pSEVA:MCR-1 is highly correlated with those from the naturally occurring MCR-1 plasmids (linear regression F1,8 = 43.7, p=0.0002, r2 = 0.845).
Figure 2—figure supplement 3
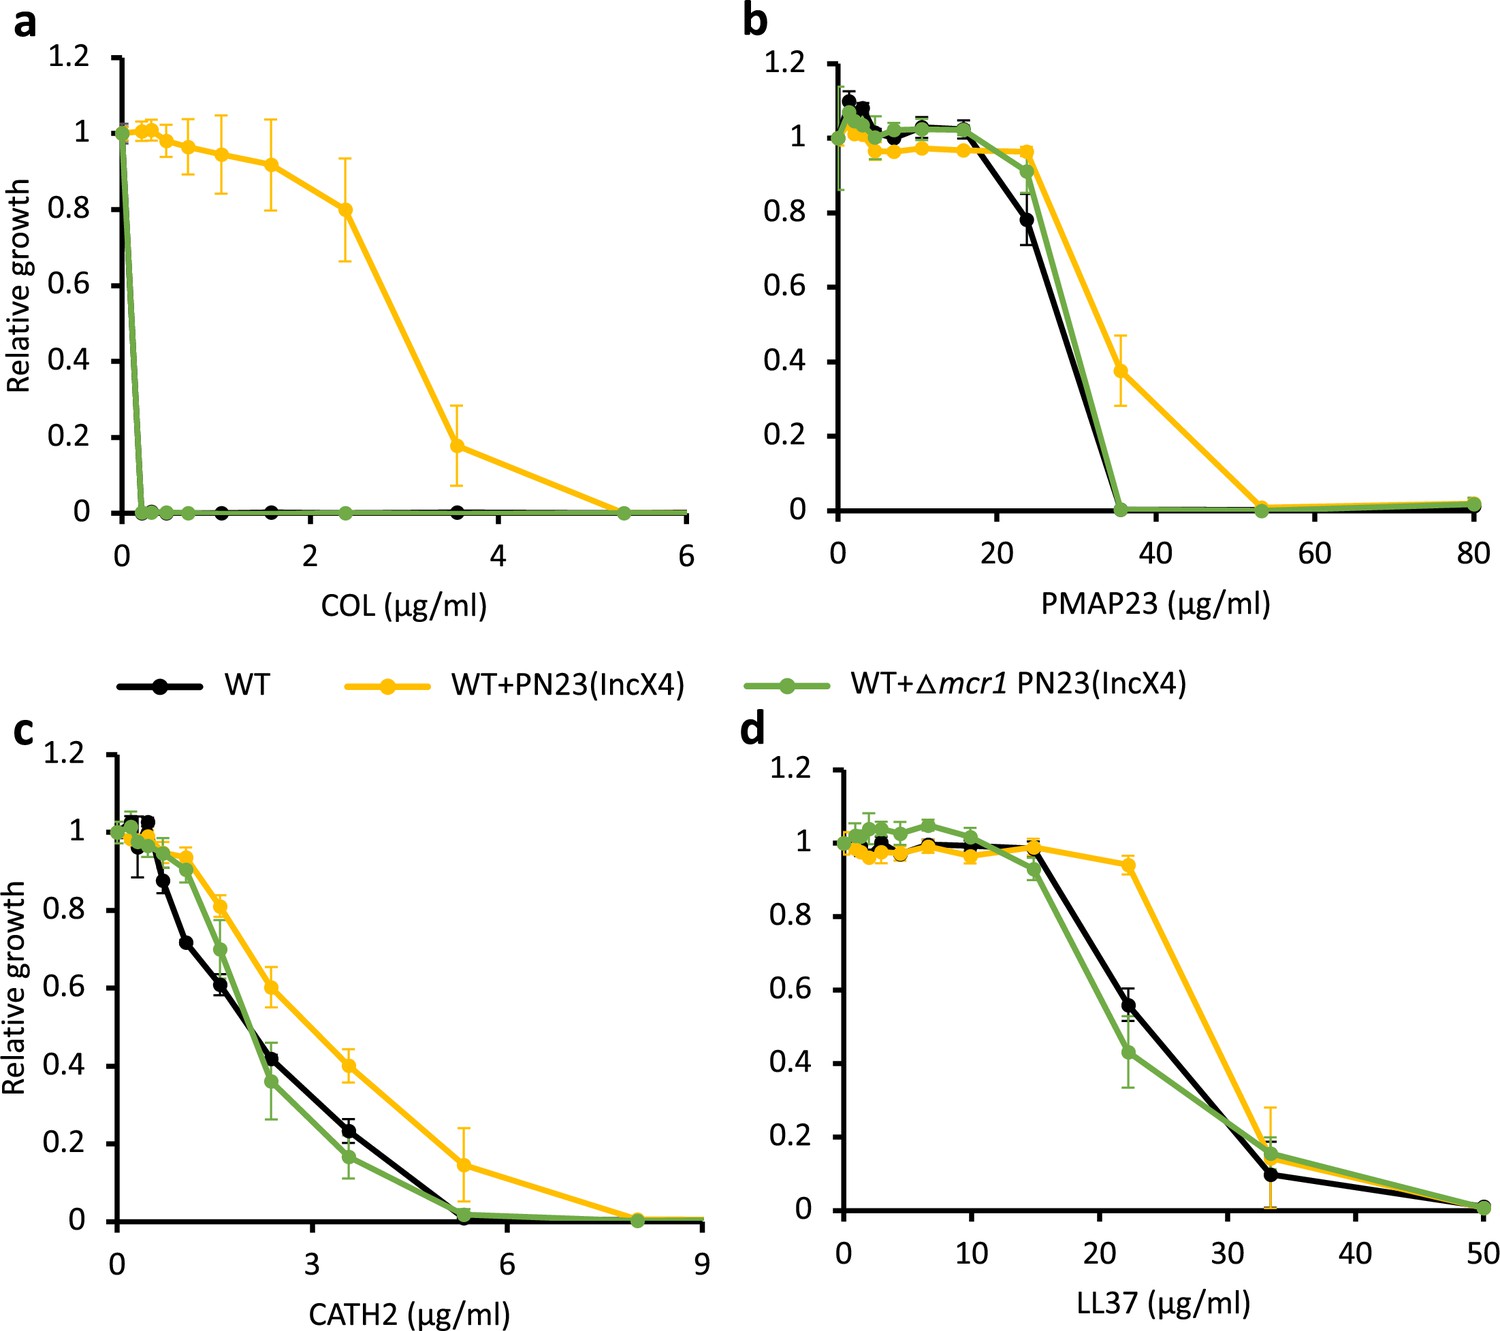
Deletion of MCR-1 from IncX4 natural plasmid results in antimicrobial peptide (AMP) susceptibility similar to the wild-type (WT) control strain.
Bacterial susceptibility to colistin (a) and host AMPs (b-d). Growth is shown relative to growth in the absence of the given AMP (y-axis). Error bars indicate standard errors based on three biological replicates. Black line, WT control strain; yellow line, WT strain carrying IncX4 plasmid with mcr-1 gene; green line, WT strain carrying IncX4 plasmid without mcr-1 gene.
Figure 2—figure supplement 4
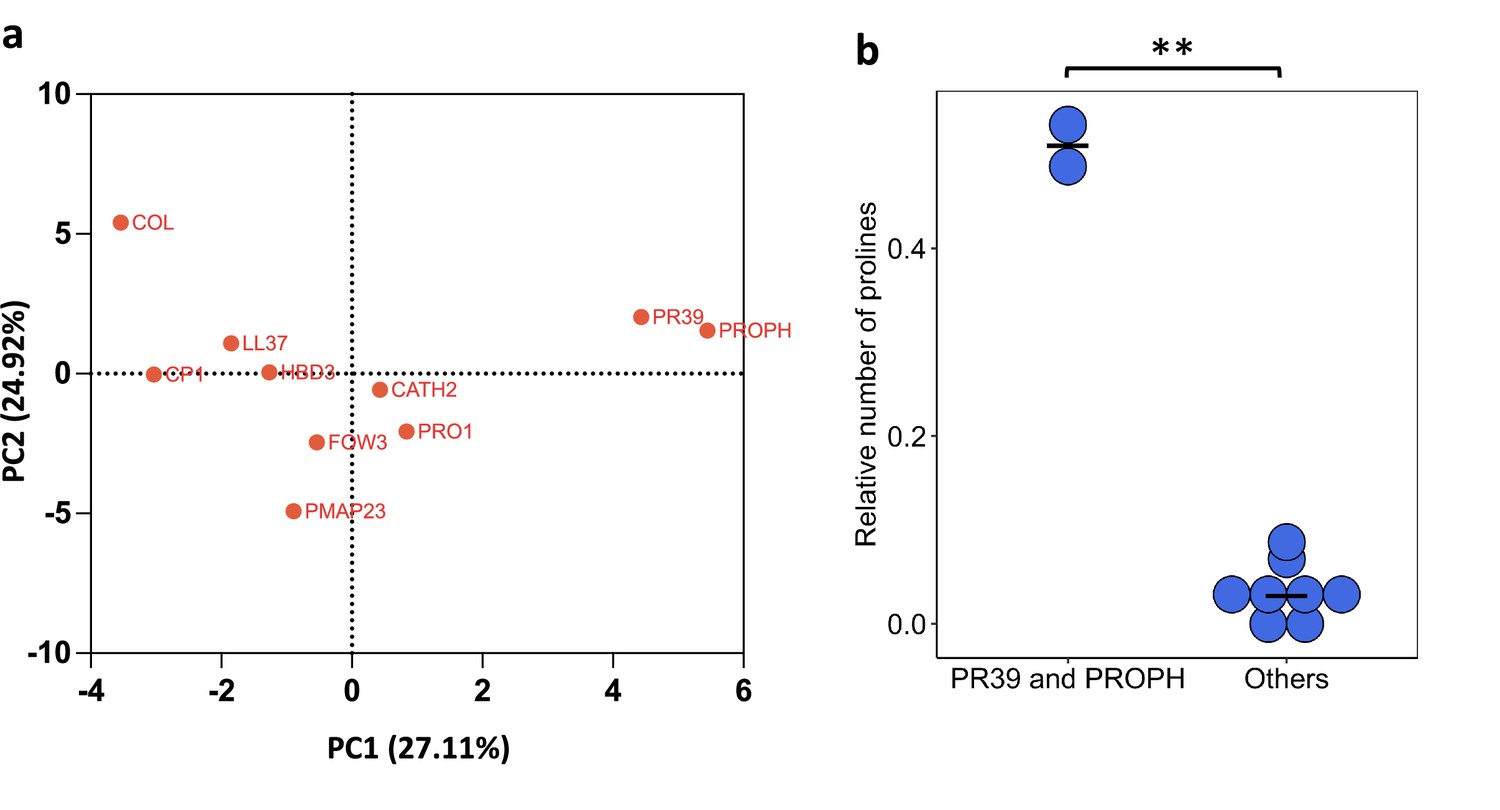
PR39 and PROPH differ from other antimicrobial peptides (AMPs) in their physicochemical properties.
(a) Principal component analysis (PCA) of the physicochemical properties of AMPs. (b) PR39 and PROPH peptides can be distinguished from other AMPs based on their higher proline content (significant differences from Welch’s two-sample t-test, p=0.0086, n = 2 and n = 8 for PR39 and PROPH, and others, respectively).
Figure 3
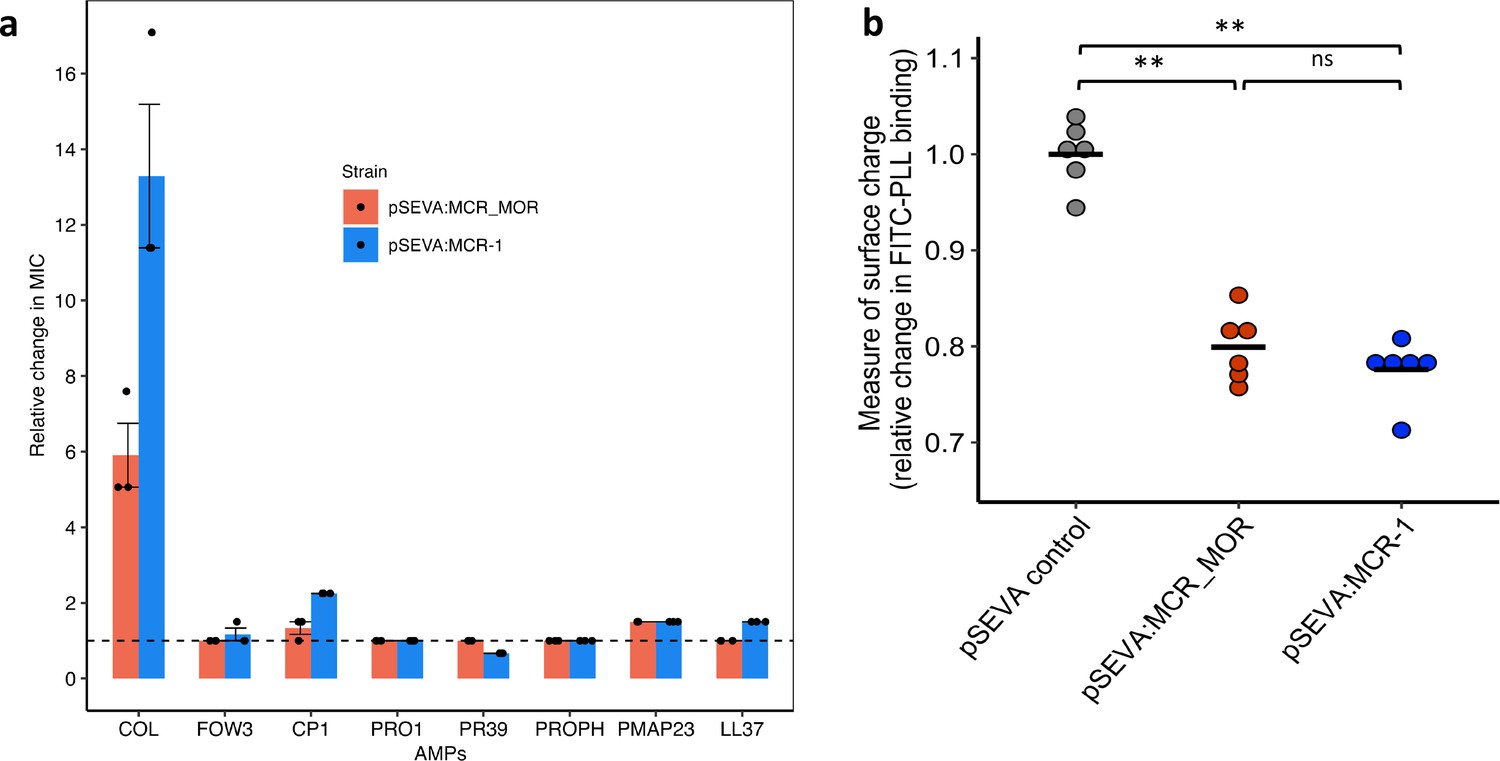
Effect of Moraxella MCR (MCR-MOR) on bacterial susceptibility to antimicrobial peptides (AMPs) (a) and on cell surface charge (b).
(a) AMP susceptibility of E. coli carrying pSEVA:MCR-1 and Moraxella version of MCR (pSEVA:MCR-MOR). The impact of the pSEVA:MCR-1 and pSEVA:MCR-MOR on resistance was measured relative to a strain with a pSEVA empty vector control (dashed line). Error bars indicate standard errors based on three biological replicates. (b) Relative cell surface charge of E. coli strains expressing MCR-1 and MCR-MOR compared to an empty vector control. Cell surface was determined by FITC-PLL binding assay (n = 6 biological replicates/strain). Statistical significance was determined by pairwise comparisons using the two-sided Mann–Whitney U-tests, and double asterisks show differences with a p-value<0.01.
Figure 4
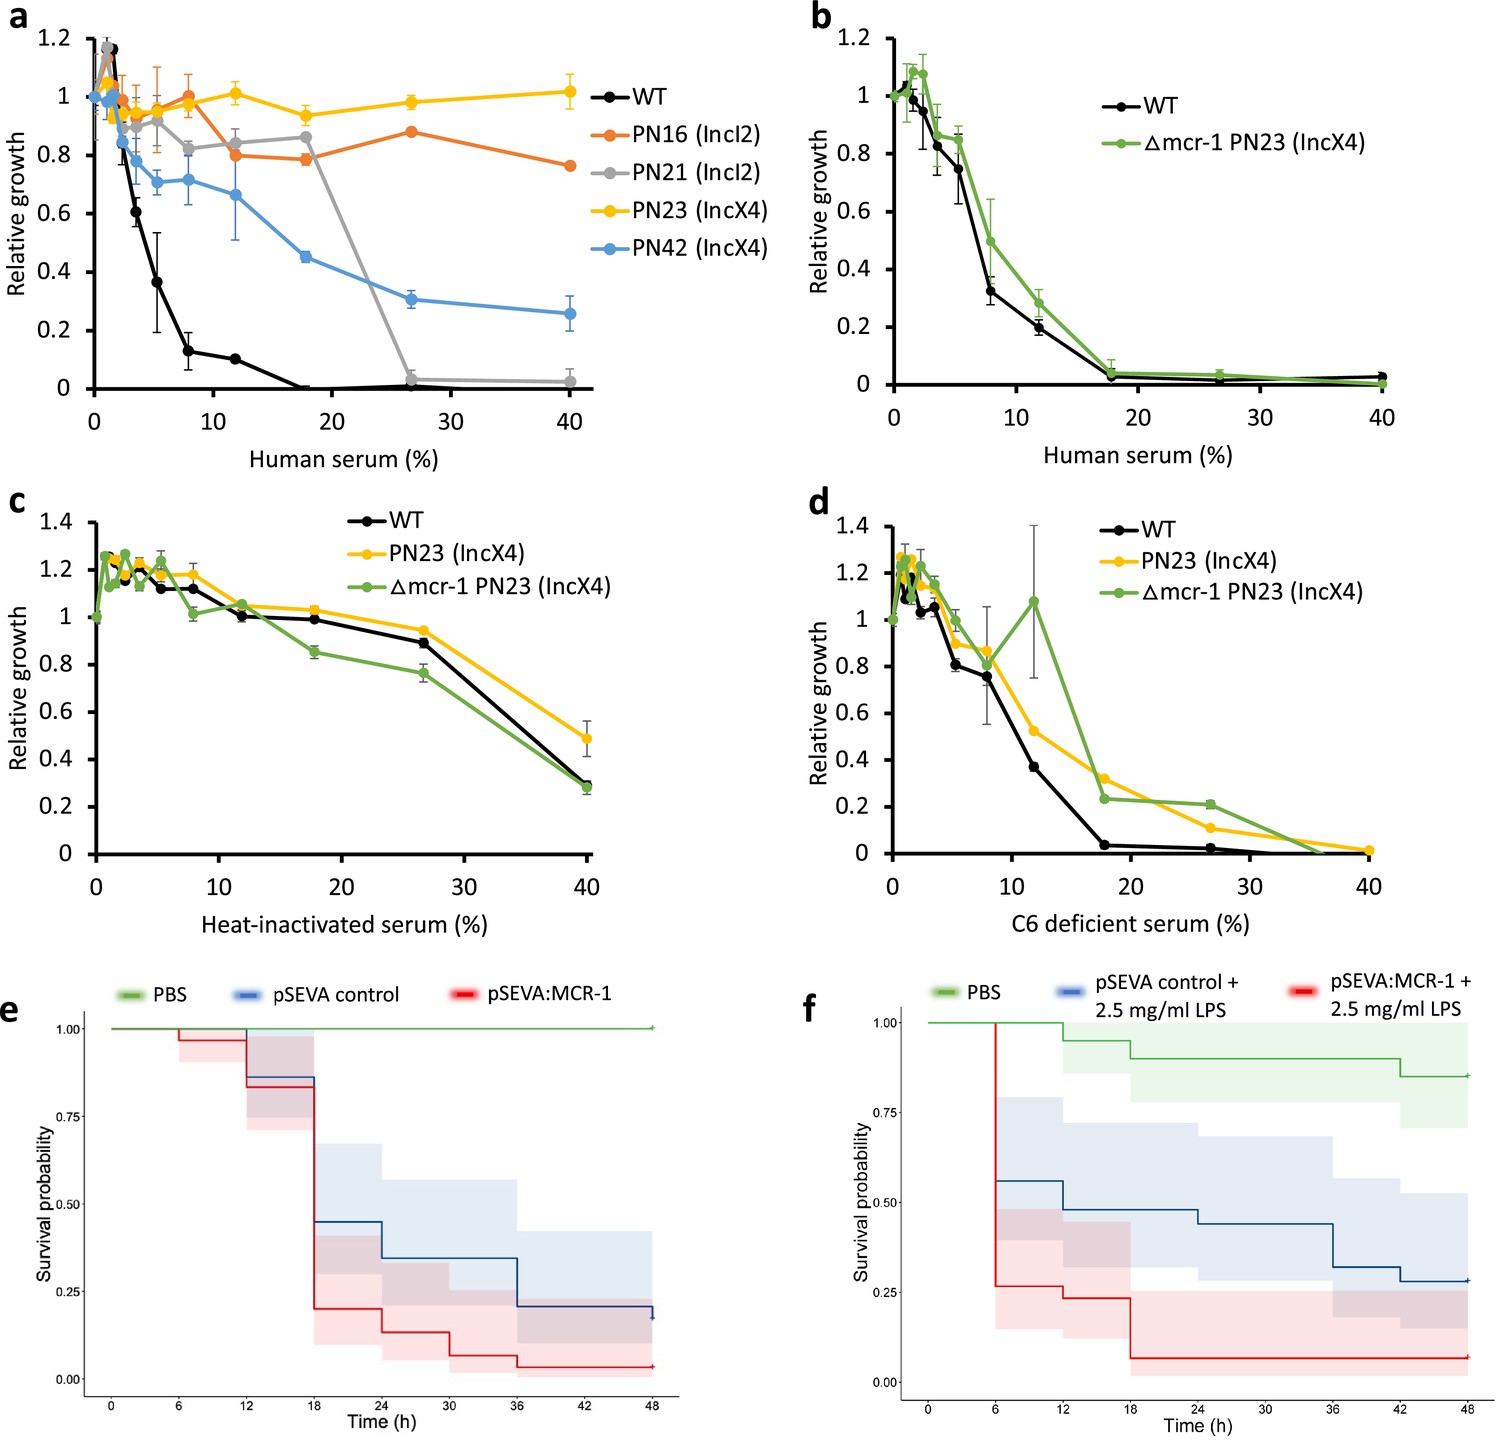
Mobile colistin resistance (MCR) confers resistance to human serum and increases bacterial virulence.
(a–d) Bacterial susceptibility to human serum was determined by measuring bacterial growth in a medium containing human serum relative to serum-free controls ( ± SEM; n = 3 biological replicates/strain). (a) Serum susceptibility of the wild-type (WT) parental strain and transconjugants carrying natural MCR plasmids. (b) Serum susceptibility of the WT parental strain and transconjugant carrying a plasmid with a deletion of mcr-1. (c, d) Susceptibility of E. coli with and without natural MCR plasmid against C6-deficient and heat-inactivated serum. (e, f) Survival of G. mellonella larvae following injection with 5 × 10⁷ E. coli carrying pSEVA:MCR-1 or an empty vector control compared to mock-treated larvae that were injected with PBS. In (f), larvae were pretreated with LPS for 24 hr prior to bacterial infection. Each experiment was performed in triplicate with 10 animals per treatment per replicate, and shaded areas show 95% confidence intervals in survival probability.
Tables
Table 1
List of natural mobile colistin resistance (MCR) plasmids and antimicrobial peptides (AMPs) used in this study.
| AMPs | |||
|---|---|---|---|
| Name | Abbreviation | Major cell and tissue sources | |
| LL-37 cathelicidin | LL37 | Epithelial cells of the testis, skin, gastrointestinal tract, respiratory tract, and in leukocytes, such as monocytes, neutrophils, T cells, NK cells, and B cells |  |
| Human beta-defensin-3 | HBD3 | Neutrophils and epithelial surfaces (e.g., skin, oral, mammary, lung, urinary, eccrine ducts, and ocular) | |
| Cecropin P1* | CP1 | Small intestine |  |
| PR39 | PR39 | Mucosa and lymphatic tissue of the respiratory tract | |
| Protegrin 1 | PRO1 | Bone marrow, leukocytes, and neutrophils | |
| Prophenin-1 | PROPH | Bone marrow and leukocytes | |
| PMAP-23 | PMAP23 | Myeloid tissue, bone marrow, and liver | |
| Chicken cathelicidin-2 | CATH2 | Bone marrow, respiratory tract, gastrointestinal tract, normal intact skin, and multiple lymphoid organs |  |
| Fowlicidin 3 | FOW3 | Bone marrow, lung, and spleen | |
| Colistin | COL | - |  |
| MCR plasmids | |||
| Name (type) | Size (bp) | mcr gene | Reference |
| PN16 (IncI2) | 60,488 | mcr-1 | Yang et al., 2017 |
| PN21 (IncI2) | 60,989 | mcr-1 | Yang et al., 2017 |
| PN23 (IncX4) | 33,858 | mcr-1 | Yang et al., 2017 |
| PN42 (IncX4) | 32,995 | mcr-1 | Yang et al., 2017 |
| WJ1 (IncHI2) | 261,119 | mcr-3 | Yin, 2017 |
| 481 (IncP1) | 53,660 | mcr-3 | Wang et al., 2019 |
-
*
From pig intestinal parasitic nematode.
Appendix 1—table 1
Values from the Shen dataset for the relevant proportions.
| MCR-1 (PCR) | B2 and MCR-1 (whole genome sequencing [WGS] of MCR-positive) | B2 proportion | |||
|---|---|---|---|---|---|
| Category | n | P (MCR) | n | P (B2|MCR) | P (B2) |
| Patients with infection | 59/3724 | 2 (1–2) | 18/55 | 33 (20–45) | Pi(B2) |
| Patients with colonization | 364/2395 | 15 (14–17) | 4/110 | 4 (0–7) | Pc(B2) |
| Healthy carriage | 353/3422 | 10 (9–12) | 3/144 | 2 (0–4) | Ph(B2) |
-
MCR: mobile colistin resistance.
Appendix 1—table 2
Values identified in the literature for in healthy people (h) compared to infections (i) in different settings.
| Study | Details | P(B2) (i: infection; h: healthy) |
|---|---|---|
| Tenaillon et al., 2010 | 2010 synthesis of previous data on phylogroup prevalence in healthy carriage (n = 1117 subjects) | = 26% |
| Luo et al., 2011 | Healthy food handlers in hospital in Beijing, China 2009 (n = 92) | = 48% |
| Marin et al., 2022 | Healthy people, France 1980–2010 (n = 436) | = 29% |
| Li et al., 2010 | Healthy people in Fujian, China 2010 (n = 325) | = 16% |
| Petitjean et al., 2021 | Analysis of E. coli genomes in EnteroBase (n = 70,301) | = 18%* |
| Kallonen et al., 2017 | Bloodstream infection isolates in England, 2001–2012 (n = 1509) | = 67% |
| Davies et al., 2020 | Bloodstream infection isolates in England, 2013–2015 (n = 976) | = 66% |
| Zhang et al., 2021 | Bloodstream infection isolates in Shanxi, China, 2019–2020 (n = 76) | = 34% |
| Hu et al., 2013 | CTX-M-producing E. coli in Hangzhou, China 2010–2012 (n = 46 healthy, n = 36 clinical) | = 18% = 39% |
| Rodríguez et al., 2021 | Bloodstream infection isolates in Spain, 1996–2016 (n = 649 isolates representing 7165 infection episodes) | = 53% |
-
*
Not separated by category since contains a mixture of isolate sources.
Additional files
-
Supplementary file 1
List of the physicochemical and mechanistic properties of the antimicrobial peptides (AMPs) used in this study.
- https://cdn.elifesciences.org/articles/84395/elife-84395-supp1-v2.xlsx
-
Supplementary file 2
Competitive fitness data.
- https://cdn.elifesciences.org/articles/84395/elife-84395-supp2-v2.xlsx
-
Supplementary file 3
Antimicrobial susceptibility of MCR-E. coli to antimicrobial peptides (AMPs).
- https://cdn.elifesciences.org/articles/84395/elife-84395-supp3-v2.xlsx
-
Supplementary file 4
List of oligonucleotides used in this study.
- https://cdn.elifesciences.org/articles/84395/elife-84395-supp4-v2.xlsx
-
Supplementary file 5
List of bacterial strains used in this study.
- https://cdn.elifesciences.org/articles/84395/elife-84395-supp5-v2.xlsx
-
Supplementary file 6
Plasmids used in this study.
- https://cdn.elifesciences.org/articles/84395/elife-84395-supp6-v2.xlsx
-
MDAR checklist
- https://cdn.elifesciences.org/articles/84395/elife-84395-mdarchecklist1-v2.docx
Download links
A two-part list of links to download the article, or parts of the article, in various formats.
Downloads (link to download the article as PDF)
Open citations (links to open the citations from this article in various online reference manager services)
Cite this article (links to download the citations from this article in formats compatible with various reference manager tools)
The evolution of colistin resistance increases bacterial resistance to host antimicrobial peptides and virulence
eLife 12:e84395.
https://doi.org/10.7554/eLife.84395


