Phase separation-mediated actin bundling by the postsynaptic density condensates
- Division of Life Science, Hong Kong University of Science and Technology, Clear Water Bay, Kowloon, China
- Greater Bay Biomedical Innocenter, Shenzhen Bay Laboratory, China
- School of Life Sciences, Southern University of Science and Technology, China
Figures
Figure 1 with 2 supplements
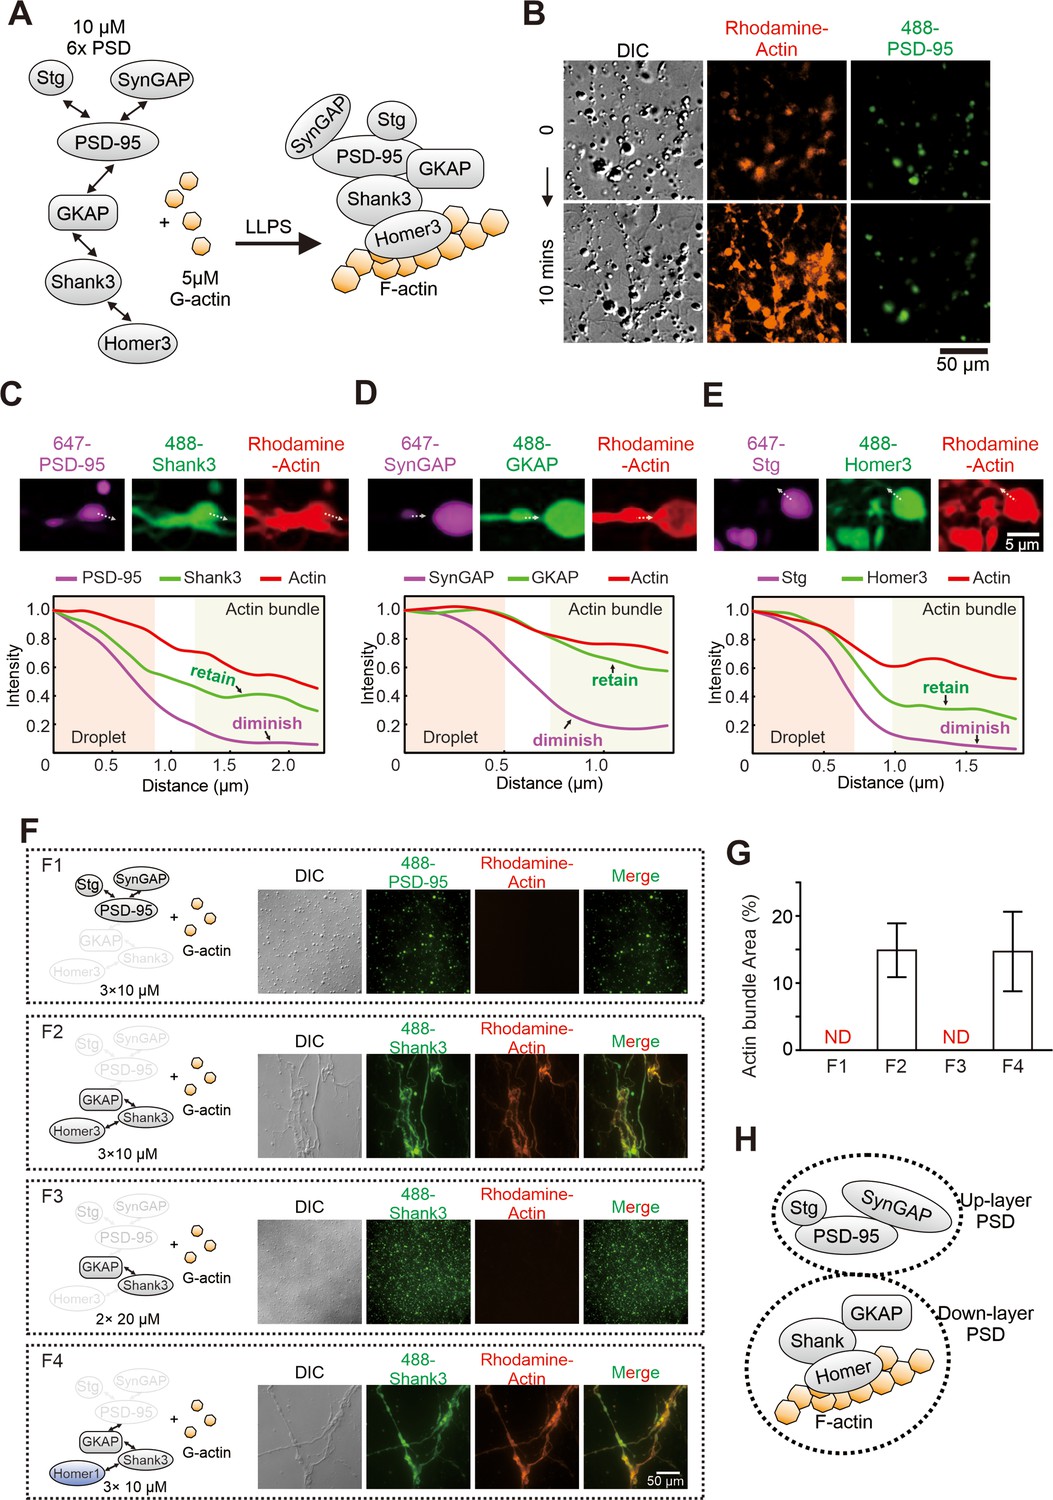
Postsynaptic density (PSD) condensate-mediated actin bundling requires Homer.
(A) Schematic diagram showing the molecular components of the PSD protein network for the actin bundling assay. The interaction details of reconstituted PSD are indicated by two arrow-headed lines. All PSD proteins were at 10 μM and were mixed with 5 μM G-actin (all in final concentrations in the assay mixtures throughout this work). (B) Time-lapse differential interference contrast (DIC)/fluorescent microscopy images showing that PSD condensates (indicated by iFluor-488-PSD-95, 2% labeled) enriched actin (rhodamine-labeled, 5% labeled) and promoted actin polymerization. (C–E) Confocal images and fluorescence intensity line-plots showing that actin bundles co-enriched with Shank3, GKAP, and Homer3, but not with PSD-95, SynGAP, or Stg. All visualized PSD proteins were labeled at 2% with the indicated fluorophores. This protein labeling ratio was used throughout the study unless otherwise stated. (F and G) Representative DIC/fluorescent microscopy images and quantification data showing the actin budling capacities by four combinations of different PSD components. F1: Stg+PSD-95+SynGAP, each at 10 μM; F2: GKAP+Shank3+Homer3, each at 10 μM; F3: GKAP+Shank3, each at 20 μM; F4: GKAP+Shank3+Homer1, each at 10 μM. The concentration of actin was kept at 5 μM in all four conditions. N=5 independent batches of imaging assays and represented as mean ± SD. ND stands for not detectable. (H) A model depicting the assembly of PSD proteins into two layers of condensates and interaction of actins with the lower layer of PSD condensates.
Figure 1—figure supplement 1
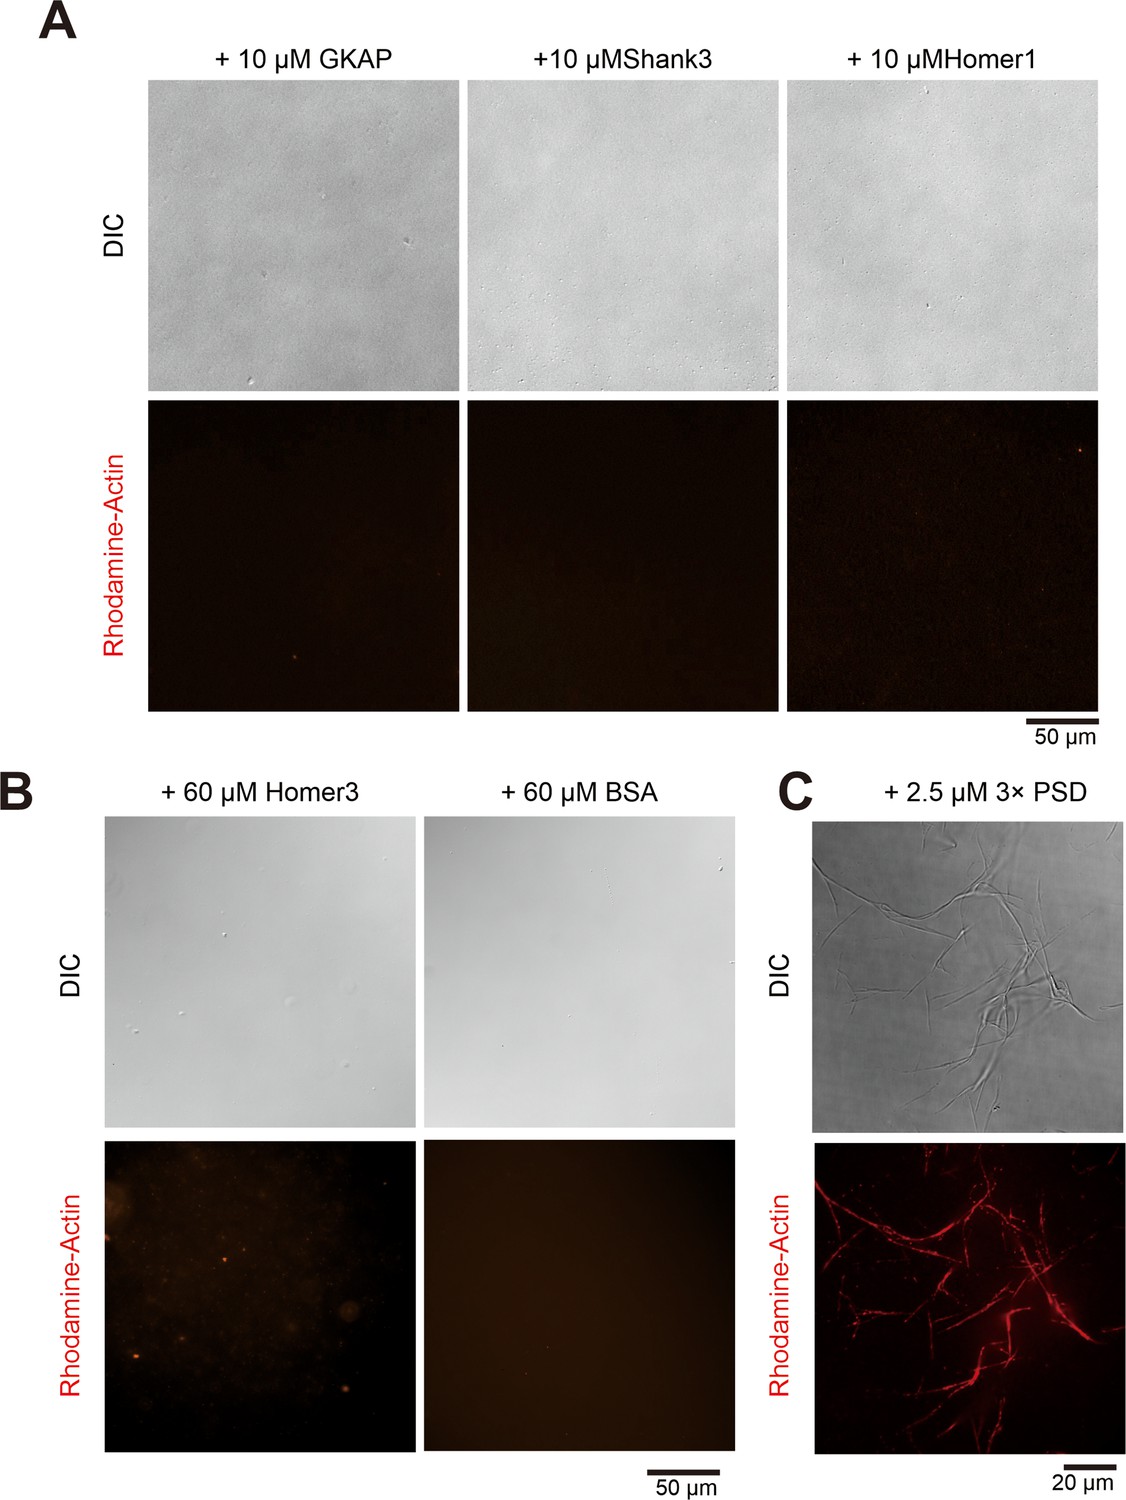
3× Postsynaptic density (PSD) condensates, instead of individual component, bundle actin.
(A) Representative differential interference contrast (DIC) and fluorescence showing that GAKP, Shank3, and Homer1 alone (each in 10 μM) failed to bundle actin (5 μM). (B) Representative DIC and fluorescence images showing that high concentration (60 μM) of Homer3 or BSA did not promote actin (5 μM) bundling. (C) Representative DIC and fluorescence images showing the bundling of actin (5 μM) by GAKP, Shank3, and Homer3 (each in 2.5 μM).
Figure 1—figure supplement 2
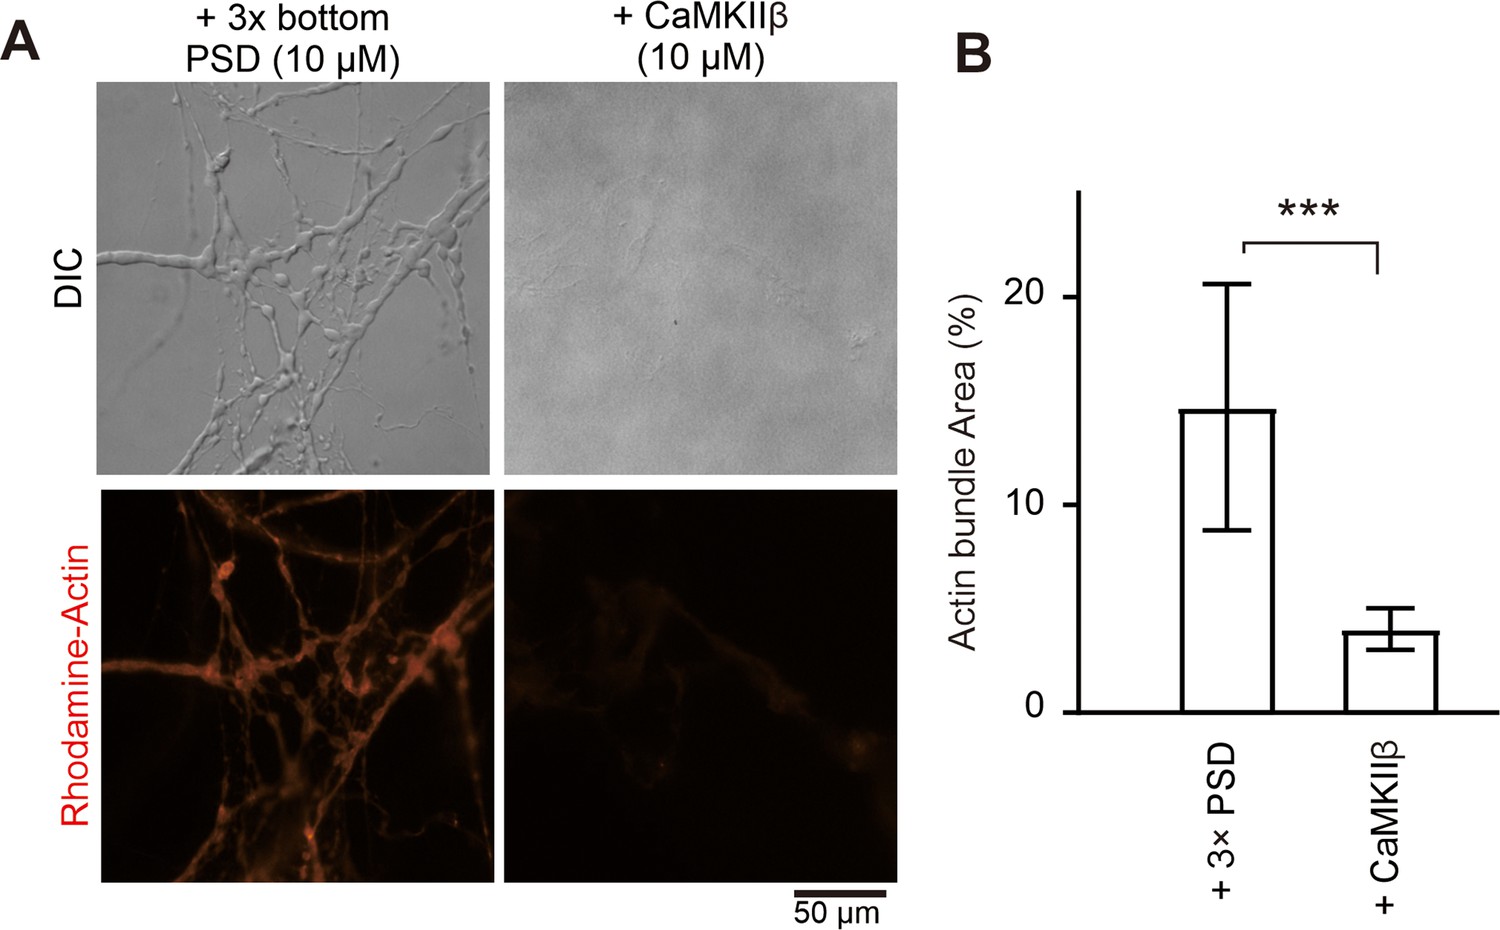
CaMKIIβ can bundle actin filaments but with much weaker capacity than the postsynaptic density (PSD) condensates.
(A and B) Differential interference contrast (DIC)/fluorescence images and quantification data comparing the actin bundling activity of CaMKIIβ and 3× PSD condensates containing GKAP, Shank3, and Homer. Actin was at 5 μM and all other proteins were used at 10 μM. N=5 independent batches for CaMKIIβ, data are presented as mean ± SD, Student’s t-test. ***p<0.001.
Figure 2 with 1 supplement
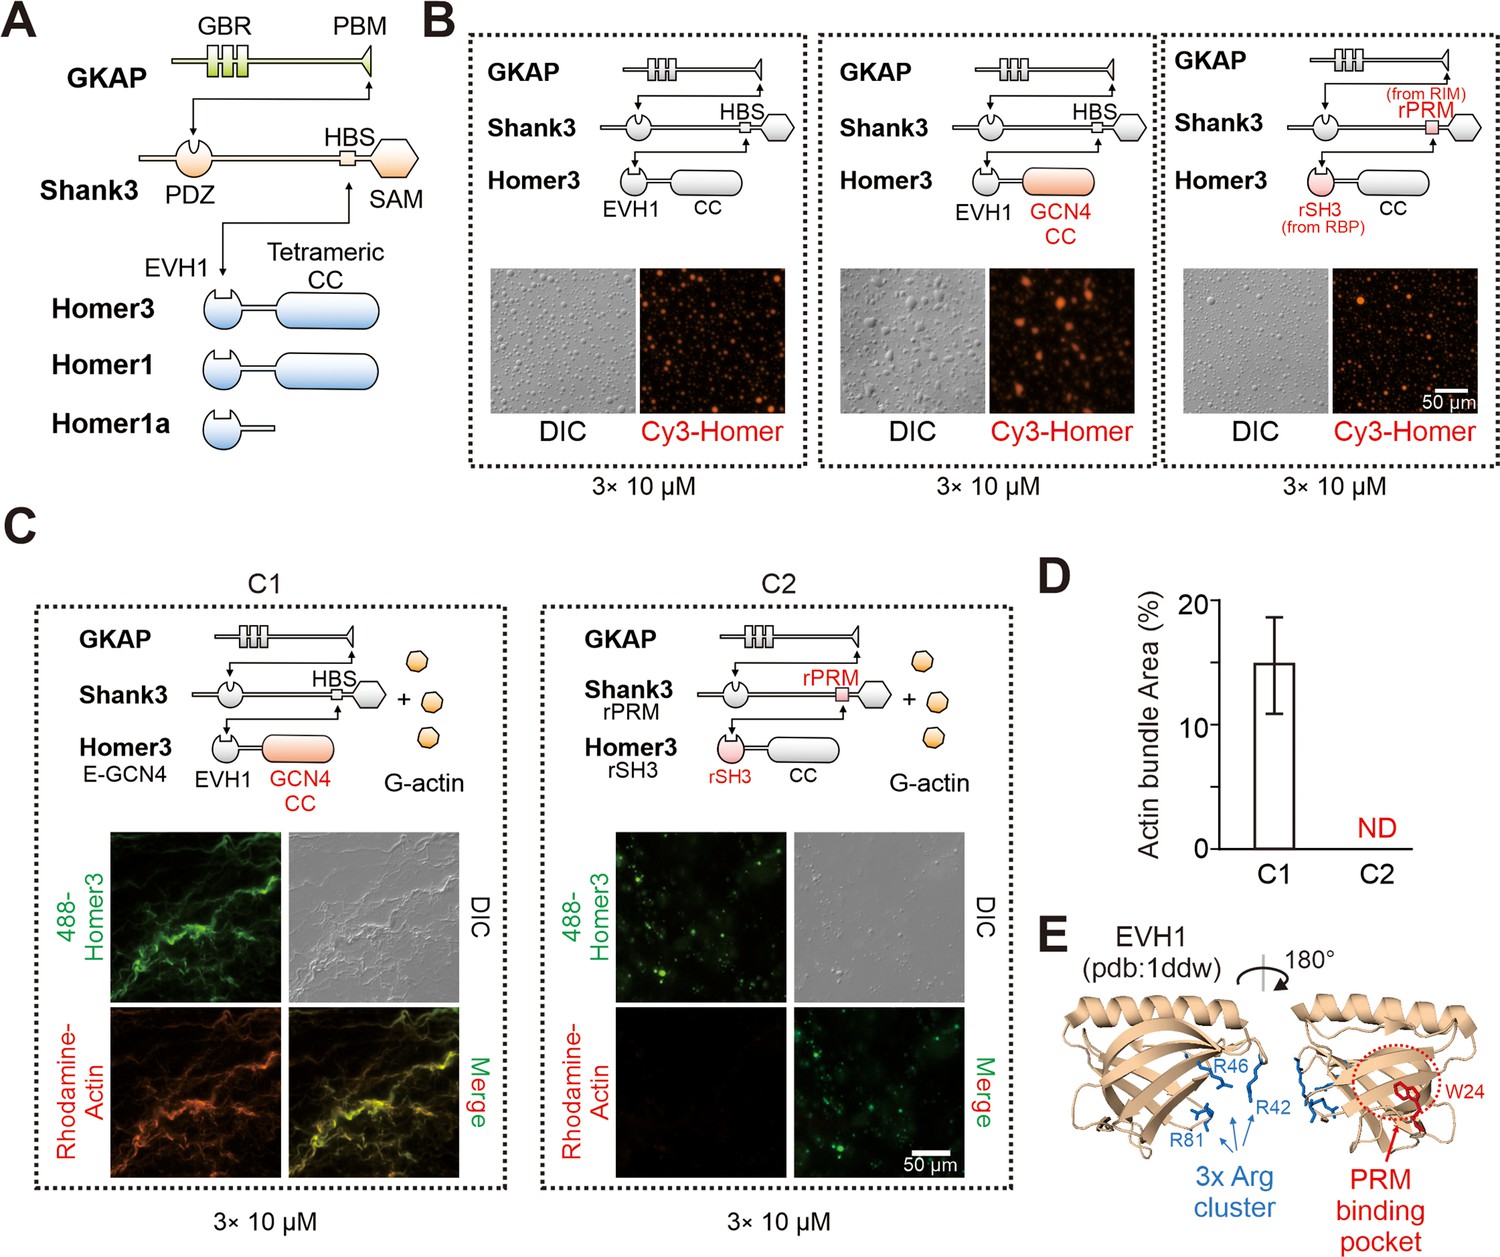
Homer in postsynaptic density (PSD) condensates uses its EVH1 domain to bundle actin.
(A) Schematic diagram showing the domain organizations and detailed interactions among GKAP, Shank3, and Homer3. The black lines with arrows connecting protein domains/motifs depict their direct interactions. (B) Schematic diagrams and representative images showing that the two designed Homer3 chimeras, EVH1-GCN4 (middle) and rSH3-CC (right), could undergo phase separation with GKAP and Shank as Homer3 WT (left) did. The concentrations of all protein were fix at 10 μM. (C and D) Representative differential interference contrast (DIC)/fluorescent microscopy images and quantitative data showing that Homer3 EVH1-GCN4, but not Homer3 rSH3-CC, promoted actin bundling when mixing with GKAP and Shank3. The concentrations of all PSD proteins were fixed at 10 μM, and G-actin was used in 5 μM. N=5 independent batches of imaging assays and are presented as mean ± SD. (E) Structure analysis of EVH1 from Homer1 indicating a conserved (also see in Figure 2—figure supplement 1) positive charged surface away from the proline-rich motif (PRM)-binding pocket.
Figure 2—figure supplement 1
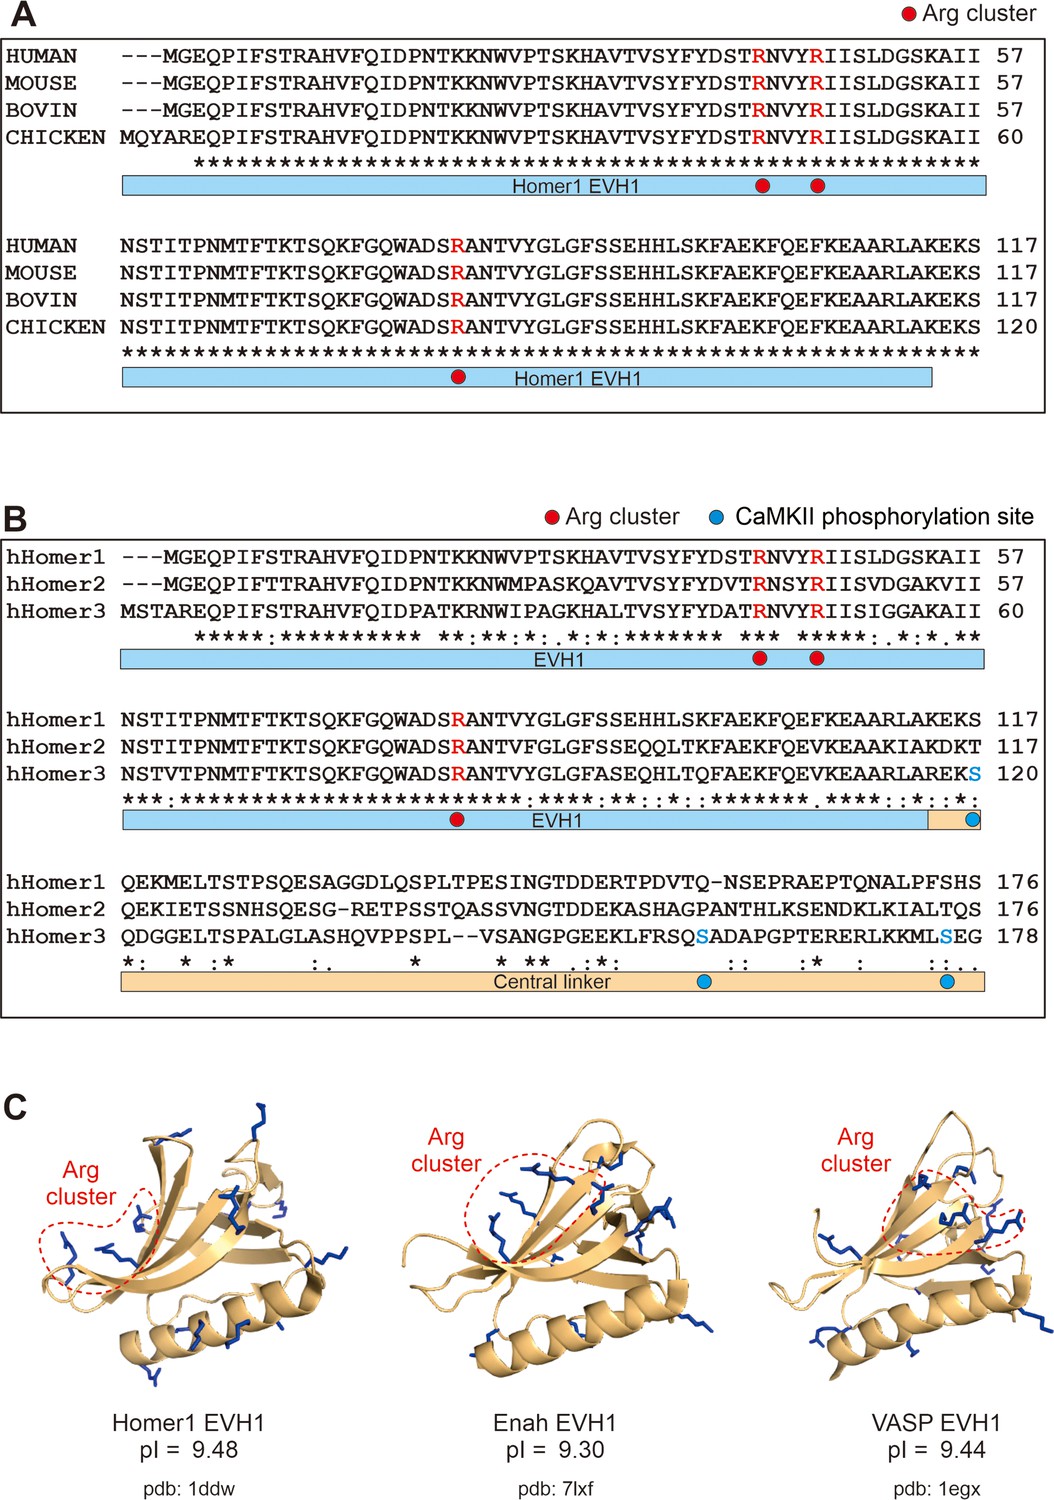
Conservation and structural analysis of the Homer EVH1 domains and representative EVH1 domains from other proteins.
(A) Amino acid sequence alignment of EVH1 domain of Homer1 from the indicated species. The three Arg residues forming the ‘3× Arg cluster’ are marked in red circles. (B) Amino acid sequence alignment of the EVH1 domain and the central linker from Homer1, -2, and -3. The three Arg residues forming the ‘3× Arg cluster’ are marked with red circles and the CaMKIIα phosphorylation sites on Homer3 are highlighted with blue circles. (C) Ribbon diagram showing that the EVH1 domain from Homer, Enah, and VASP each contains a positively charged, actin-binding surface that is located away from the Pro-rich motif-binding pocket.
Figure 3
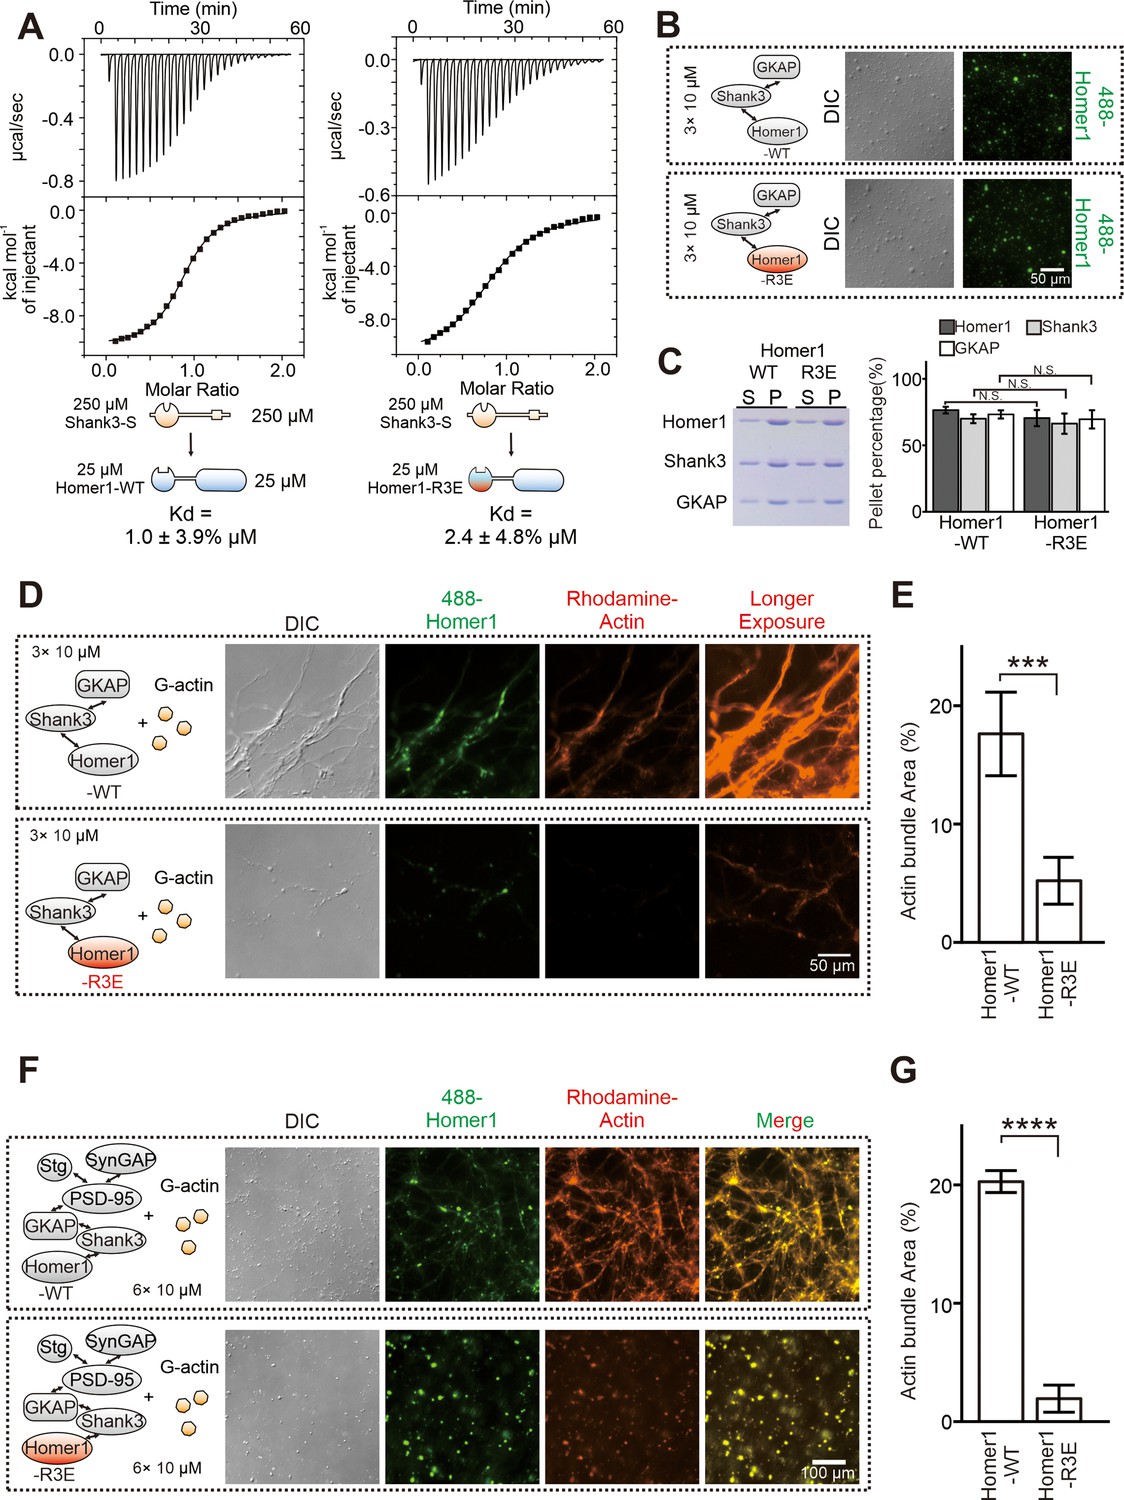
The R3E mutation on EVH1 weakens actin bundling without affecting phase separation of Homer with postsynaptic density (PSD) proteins.
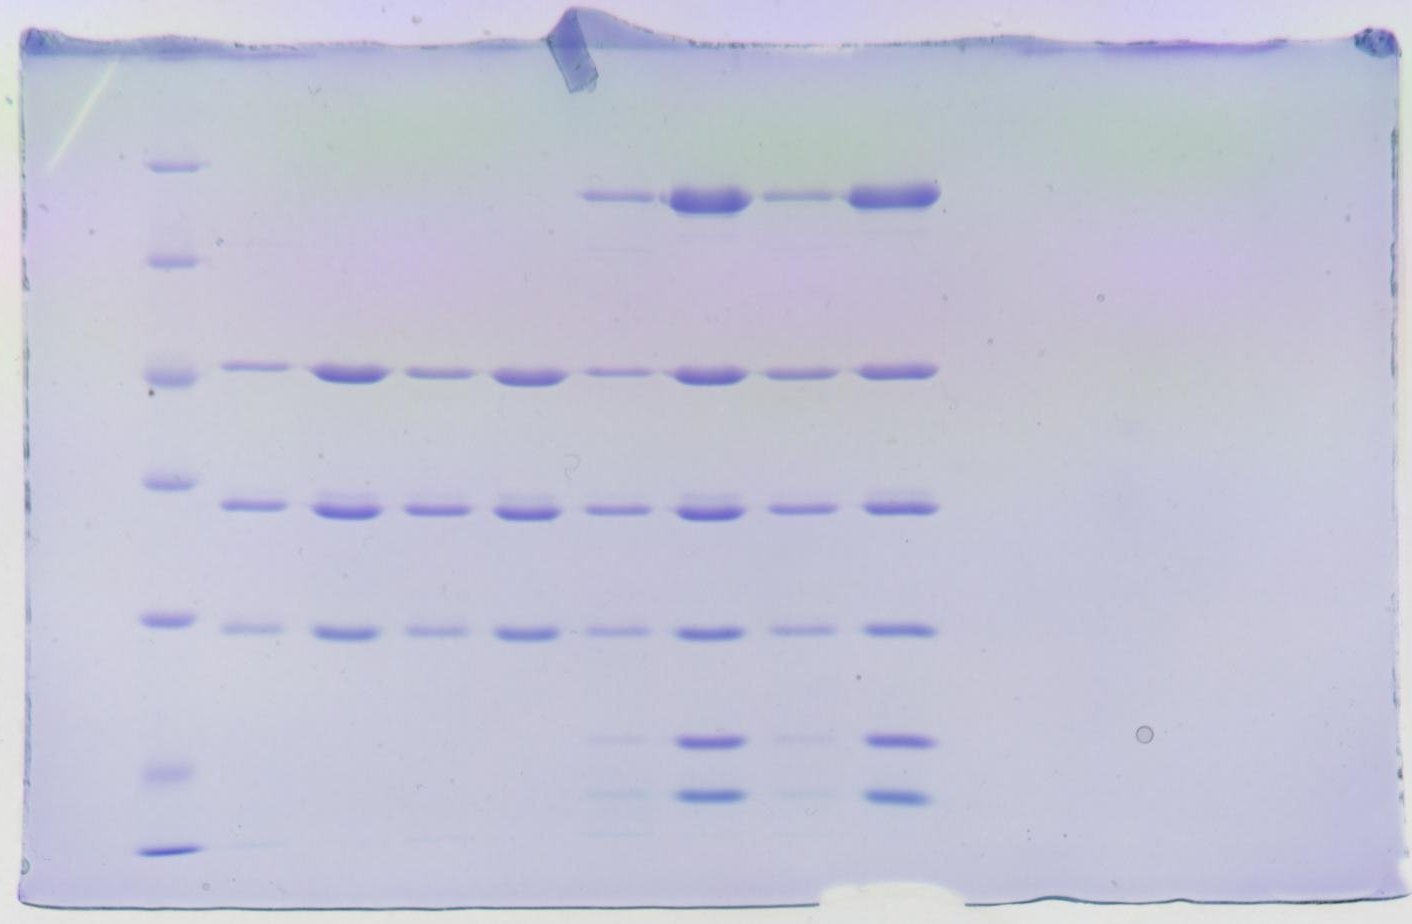
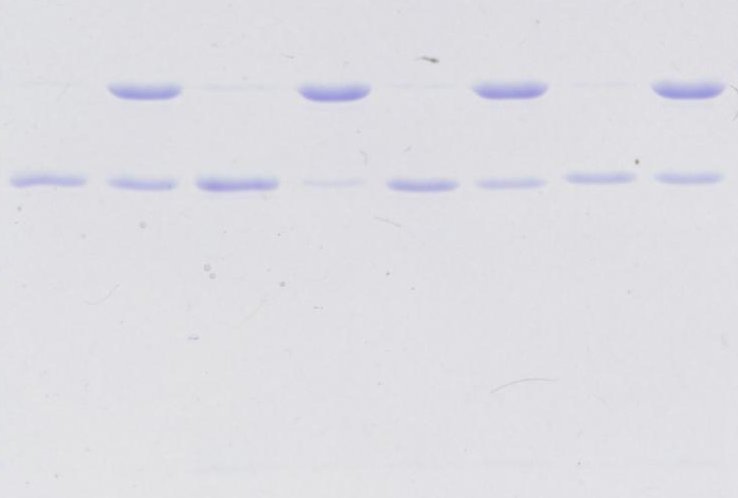
(A) Isothermal titration calorimetry (ITC) measurements showing that Homer1-WT and Homer1-R3E bound to Shank3 with similar affinities. Two hundred and fifty μM Homer1 WT or R3E was titrated to 25 μM Shank3. (B) Differential interference contrast (DIC) and fluorescence images showing Homer1-WT or Homer1-R3E (both iFluor-488 labeled) was concentrated into condensates when mixed with Shank3 and GKAP. (C) Representative SDS-PAGE and quantification data showing the distributions of the GKAP, Shank3, and Homer1 (WT or R3E) recovered in the dilute phase/supernatant (S) and condensed phase/pellet (P) at indicated protein concentrations. N=6 independent batches of sedimentation assays and are presented as mean ± SD, Student’s t-test. NS, not significant. (D and E) DIC/fluorescence images and quantification data showing that actin bundling could be strongly induced by GKAP/Shank3/Homer1-WT condensates, but not by GKAP/Shank3/Homer1-R3E condensates. N=4 independent batches of imaging assays and are presented as mean ± SD, Student’s t-test. ***p<0.001. (F and G) DIC/fluorescence images and quantification data showing that actin bundling could be strongly induced by 6× PSD condensates which were enriched with Homer1-WT, but not with Homer1-R3E. Results were from four independent batches of imaging assays and are presented as mean ± SD, Student’s t-test. ****p<0.0001.
-
Figure 3—source data 1
Original gel image in Figure 3C.
- https://cdn.elifesciences.org/articles/84446/elife-84446-fig3-data1-v2.jpg
Figure 4
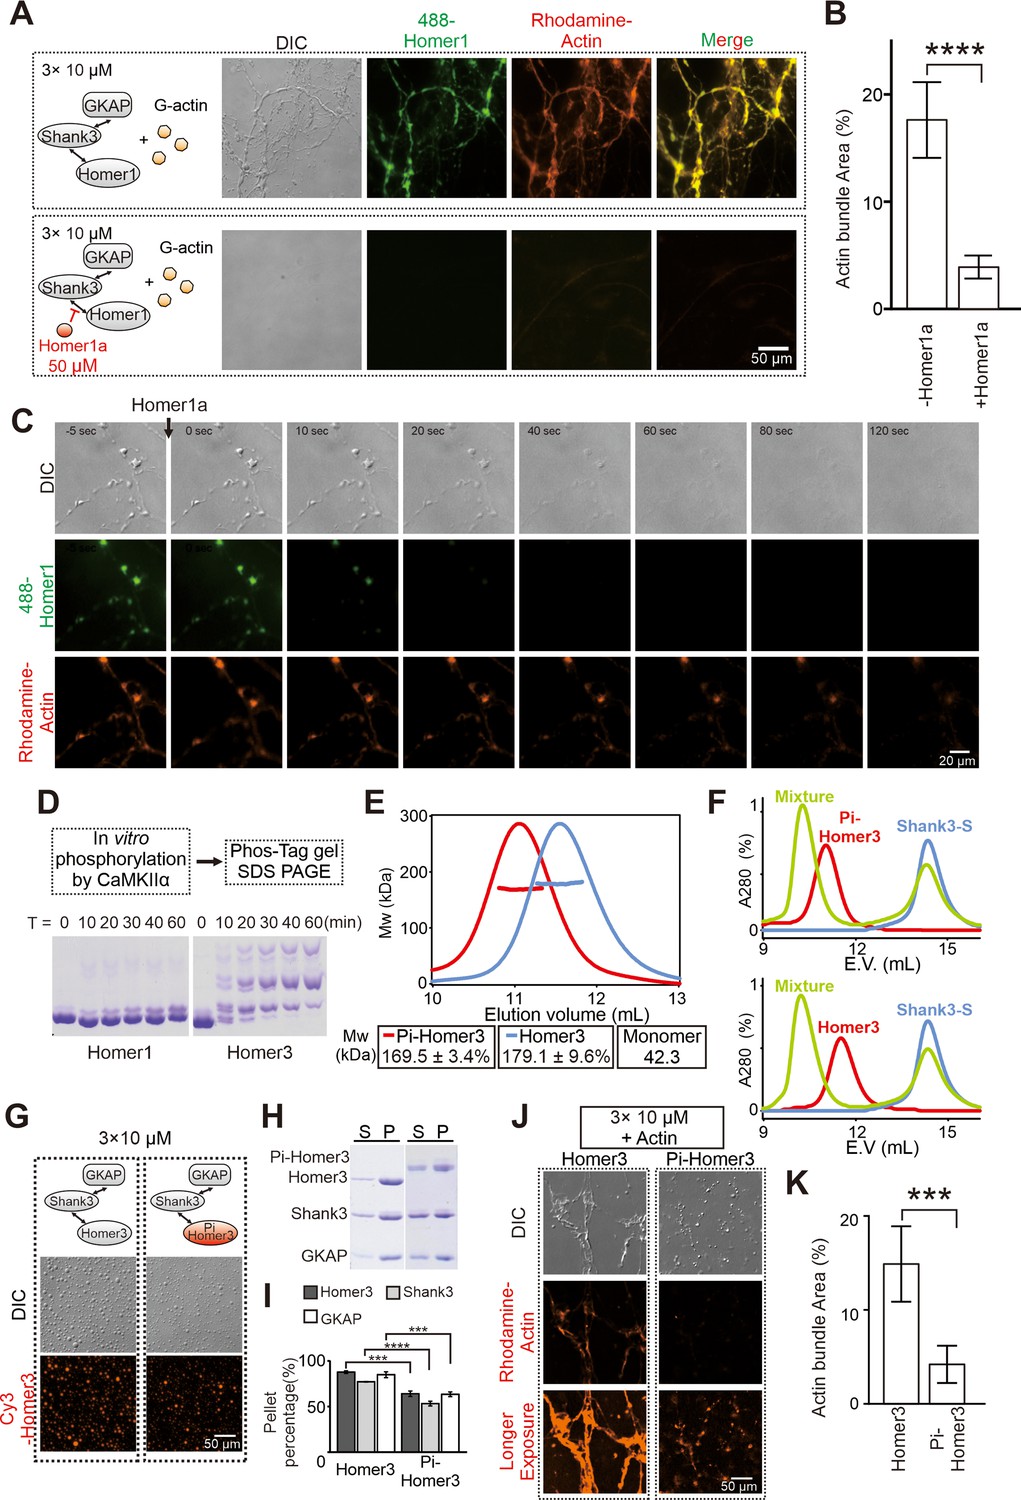
Postsynaptic density (PSD) condensate-mediated actin bundling is regulated by Homer1a and CaMKIIα.
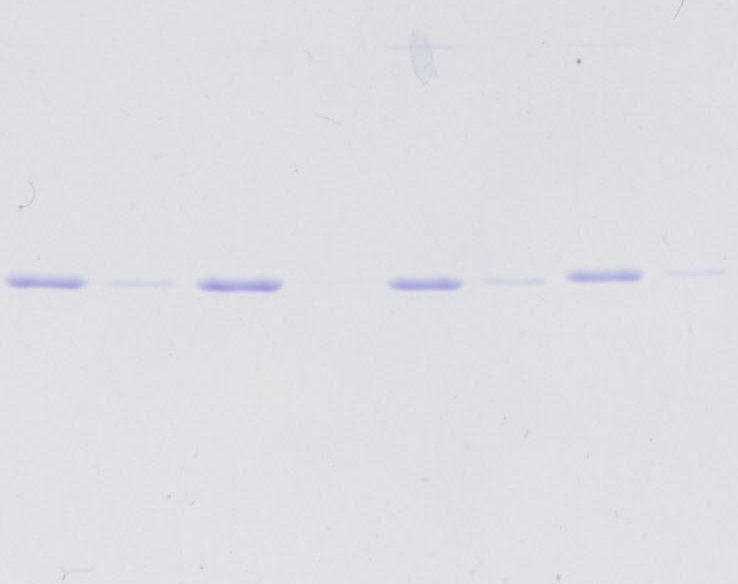
(A and B) Differential interference contrast (DIC)/fluorescence images and quantification data showing that pre-adding Homer1a into GKAP/Shank3/Homer1 condensates prevented actin bundle formation. N=4 independent batches for -Homer1a, and 5 for +Homer1a, data are presented as mean ± SD, Student’s t-test. ****p<0.0001. (C) Time-lapse images showing that adding Homer1a into actin bundles pre-assembled by GKAP/Shank3/Homer1 condensates led to dispersions of both PSD condensates and actin bundles. (D) Phos-Tag couple with SDS-PAGE assay showing that CaMKIIα could phosphorylate Homer3, but not Homer1 in vitro. (E) Fast protein liquid chromatography (FPLC)-SLS analysis showing that phosphorylation of Homer3 did not alter its tetramerization. Homer3 and Pi-Homer3 were assayed in 50 μM. (F) FPLC analysis showing that both Homer3 and Pi-Homer3 (50 μM) could interact and form complex with Shank3-dSAM (100 μM). In this assay, the SAM domain on Shank3 was deleted to prevent the phase separation of Homer3 and Shank3 upon mixing. (G) DIC and fluorescence images showing that Homer3 and Pi-Homer3 (both Cy3 labeled) was concentrated into condensates when mixed with Shank3 and GKAP. (H and I) Representative SDS-PAGE and quantification data showing the distributions of the GKAP, Shank3, and Homer3 (or Pi-Homer3) recovered in the dilute phase/supernatant (S) and condensed phase/pellet (P) at indicated protein concentrations. N=3 independent batches of sedimentation assays and are presented as mean ± SD, Student’s t-test. ***p<0.001, ****p<0.0001. (J and K) DIC/fluorescence images and quantification data showing that actin bundling could be strongly induced by 3× PSD condensates enriched with Homer3, but not Pi-Homer3. Results were from three independent batches of imaging assays and are presented as mean ± SD, Student’s t-test. ***p<0.001.
-
Figure 4—source data 1
Original gel images presented in Figure 4.
- https://cdn.elifesciences.org/articles/84446/elife-84446-fig4-data1-v2.jpg
-
Figure 4—source data 2
Original gel images presented in Figure 4.
- https://cdn.elifesciences.org/articles/84446/elife-84446-fig4-data2-v2.jpg
Figure 5
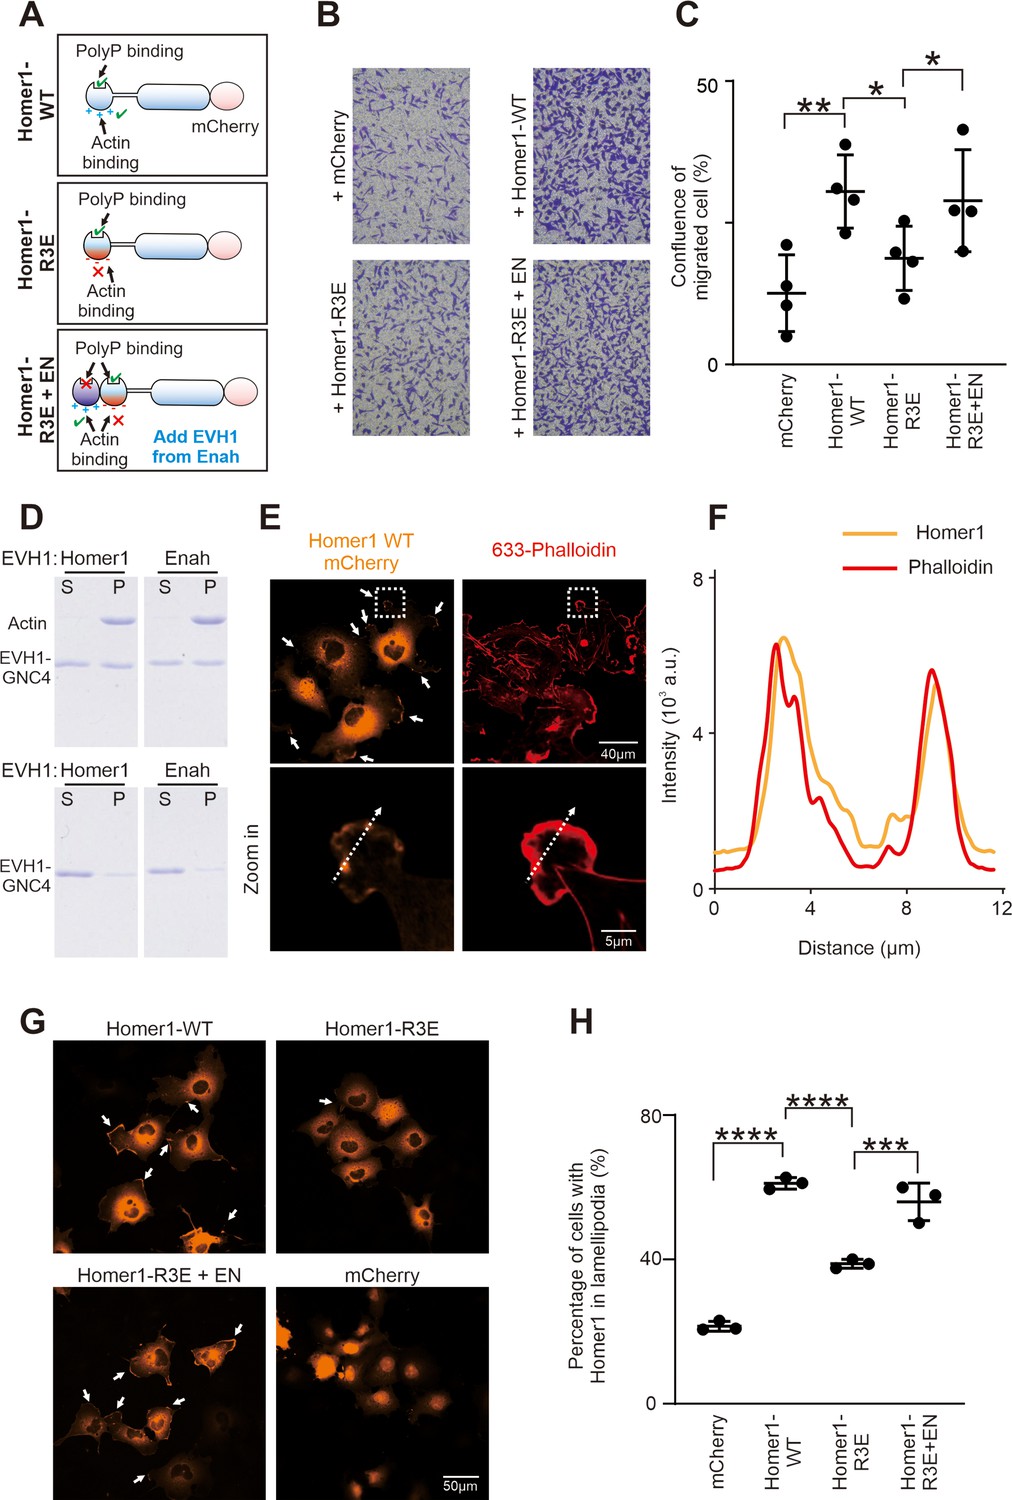
Homer binding to F-actin promotes cell migration.
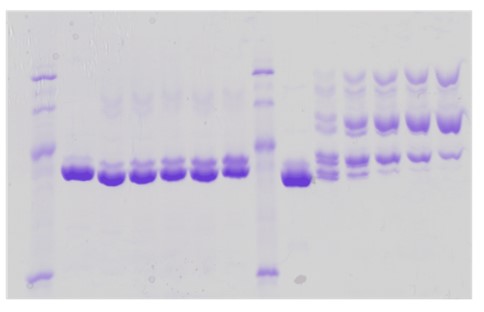
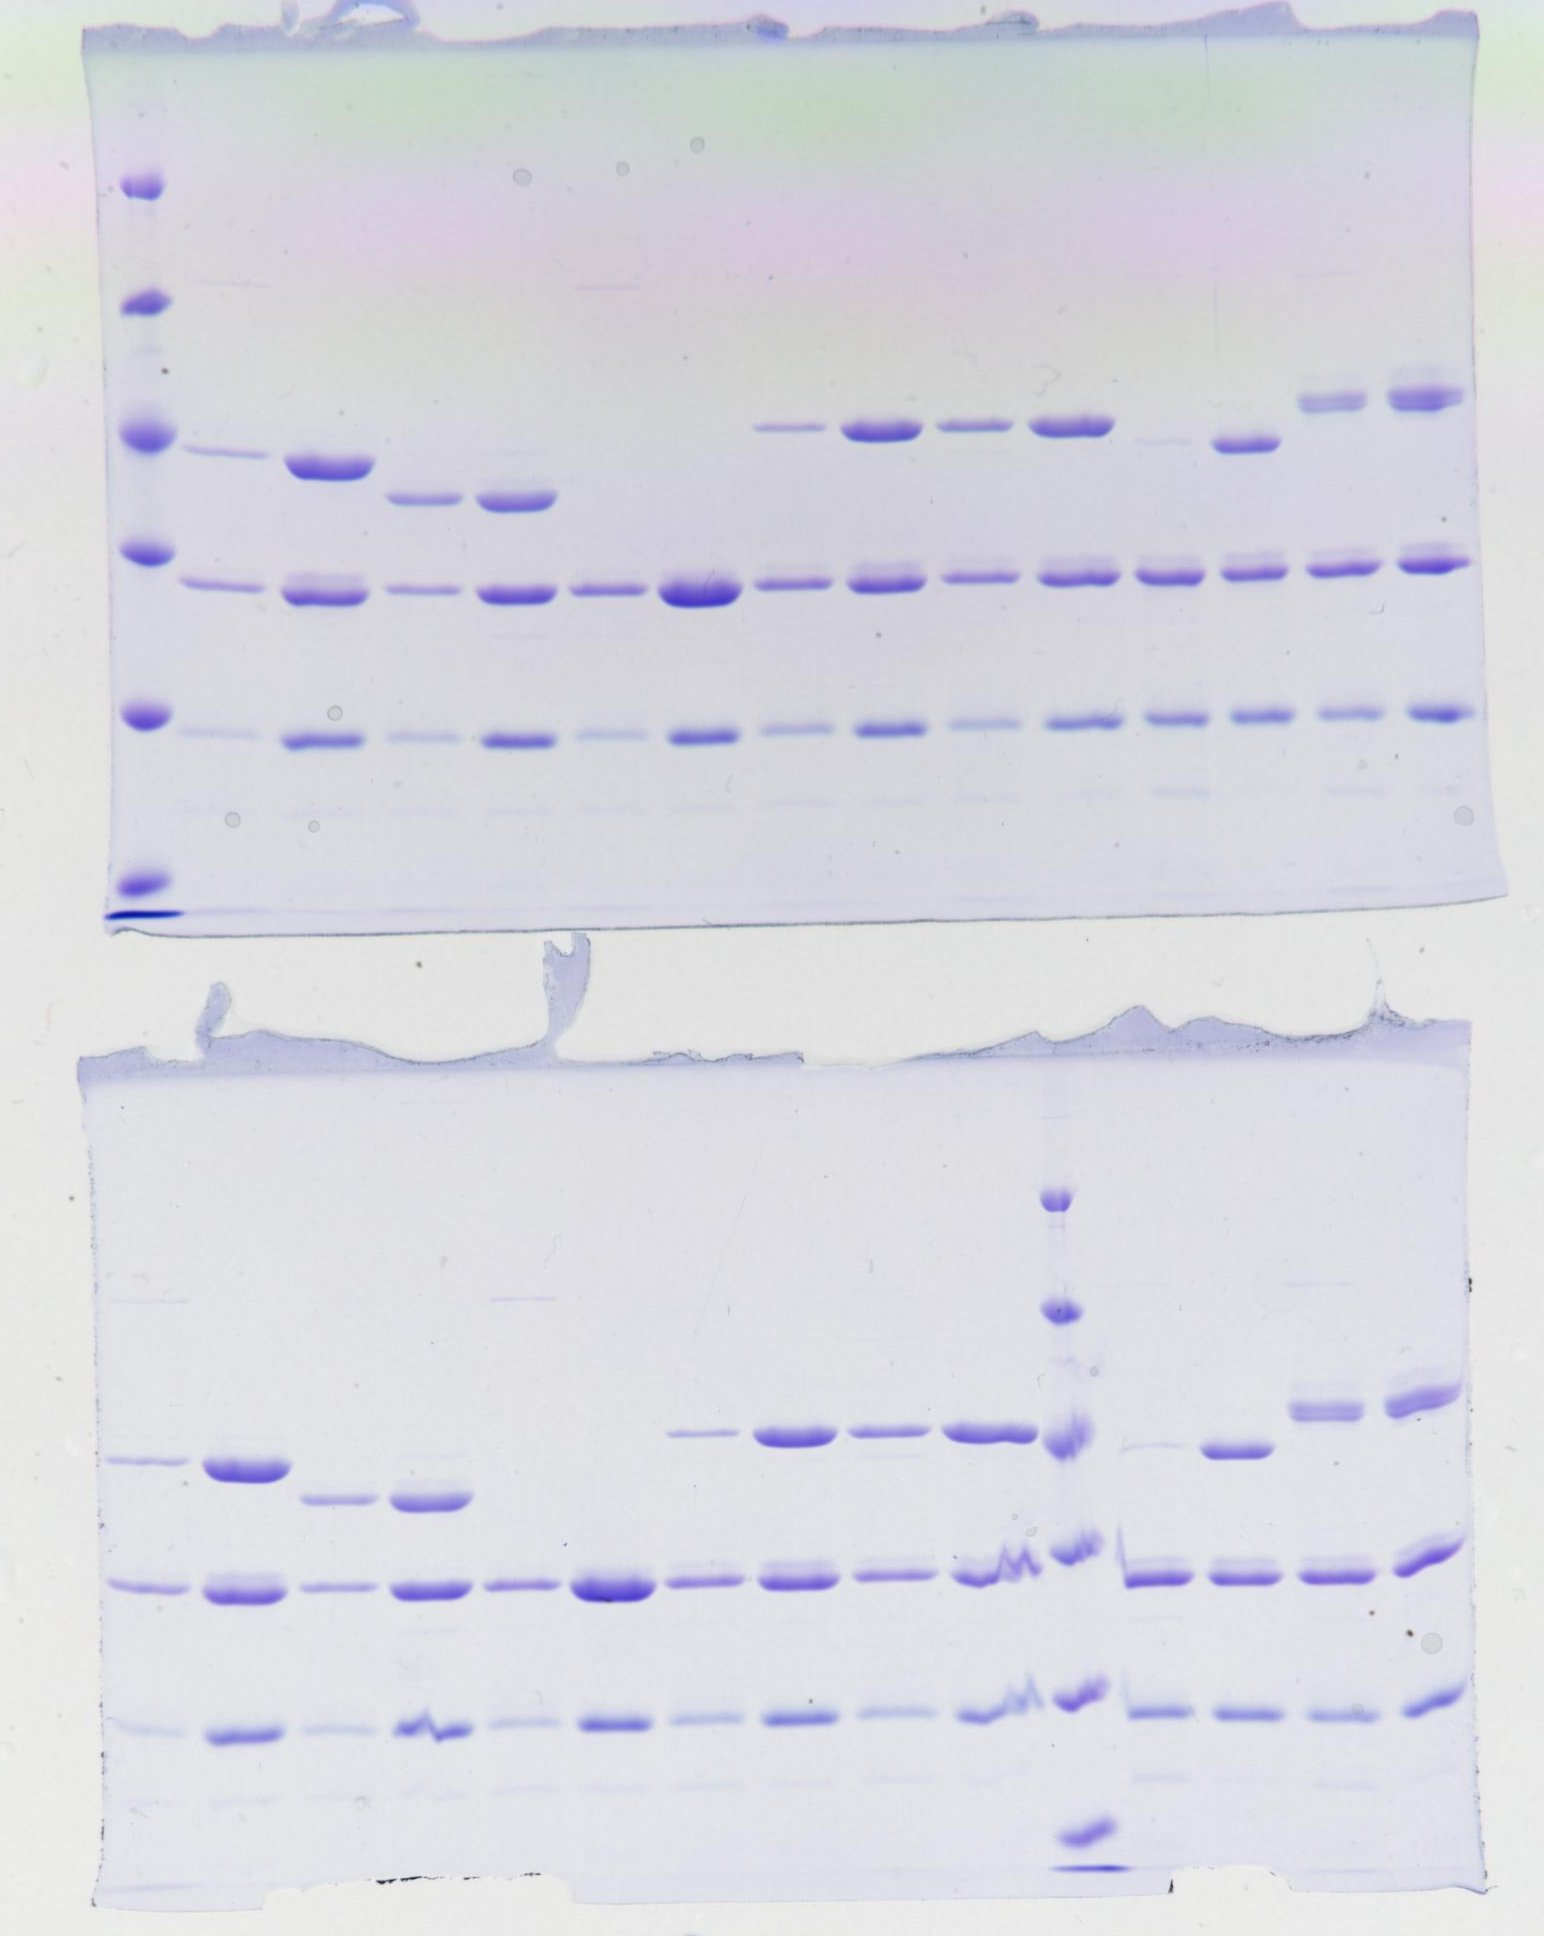
(A) Schematic diagram showing Homer1-WT-mCherry, Homer1-R3E-mCherry, and Homer1-R3E+EN-mCherry constructs designed for cell migration and cellular actin-binding assays. (B) Transwell migration assay measuring the cell migration activities of HeLa cells transfected with mCherry, Homer1-WT-mCherry, Homer1-R3E-mCherry, and Homer1-R3E+EN-mCherry. (C) Quantification of cell migration activities as described in (B). Results were from four independent batches of migration assays and are presented as mean ± SD. **p<0.01, *p<0.05, using one-way ANOVA with Tukey’s multiple comparisons test. (D) SDS-PAGE showing Homer1 EVH1 and Enah EVH1 co-sedimented with F-actin in the high-speed centrifugation-base actin-binding assay. Top row: with actin added; bottom row: without actin added. (E) Representative fluorescence images showing the localizations of Homer1-WT-mCherry in COS-7 cell line. Lamellipodia F-actin bundles were stained by Alexa-633-phalloidin. (F) Line-plots showing fluorescence intensity of Homer1-WT-mCherry and lamellipodia F-actin in a COS-7 cell as indicated in panel E. (G–H) Representative microscopic images and quantification results showing the lamellipodia localization of Homer1-WT-mCherry, Homer1-R3E-mCherry, Homer1-3E+EN-mCherry, and mCherry in COS-7 cells. N=3 independent batches of imaging assay, data are presented as mean ± SD. ***p<0.001, ****p<0.0001, using one-way ANOVA with Tukey’s multiple comparisons test.
-
Figure 5—source data 1
Original gel images presented in Figure 5.
- https://cdn.elifesciences.org/articles/84446/elife-84446-fig5-data1-v2.jpg
-
Figure 5—source data 2
Original gel images presented in Figure 5.
- https://cdn.elifesciences.org/articles/84446/elife-84446-fig5-data2-v2.jpg
Figure 6
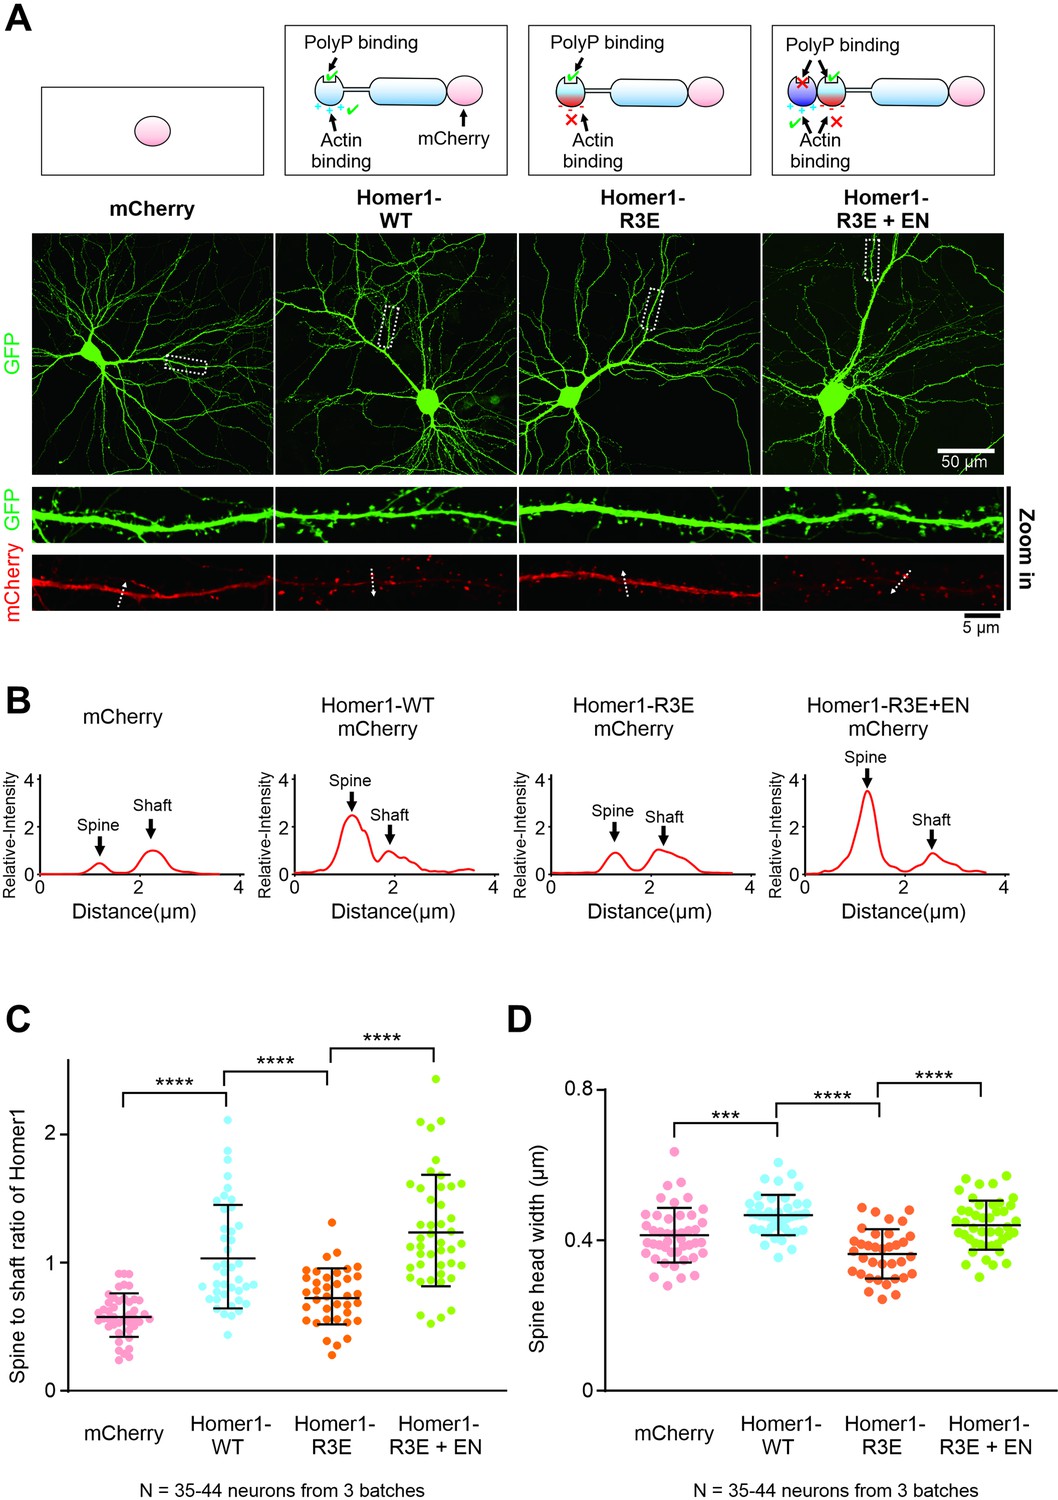
Actin binding is important for the synaptic localization and functions of Homer.
(A) Cultured mice hippocampal neurons transfected with mCherry, Homer1-WT-mCherry, Homer1-R3E-mCherry, and Homer1-R3E+EN-mCherry at 14 days in vitro (DIV). GFP was co-transfected with these constructs as the cell fill. After 7 days of expression, neurons were fixed and mounted for imaging by confocal microscope. (B) The fluorescence profiles of the mCherry constructs across the lines indicated in (A). All fluorescence intensities along the line are normalized to the peak intensity of shaft. (C) Quantification of averaged spine/shaft intensity ratios of mCherry and Homer-mCherry variants in (A) and (B). N represents the cell numbers used in each quantification. Three independent batches of cultures were imaged for each group for quantification. Error bars indicate ± SD. ***p<0.001, ****p<0.0001. One-way ANOVA with Tukey’s multiple comparisons test. (D) Quantification of image data in (A) showing increased spine head width in neurons expressing Homer1-WT-mCherry and Homer1-R3E+EN-mCherry, and decreased spine head width in neurons expressing Homer1-R3E. N represents the cell numbers used in each quantification. Three independent batches of cultures were imaged for each group for quantification. Error bars indicate ± SD. ***p<0.001, ****p<0.0001. One-way ANOVA with Tukey’s multiple comparisons test.
Additional files
-
MDAR checklist
- https://cdn.elifesciences.org/articles/84446/elife-84446-mdarchecklist1-v2.docx
-
Source data 1
The source data contain the raw numeric data for plotting bar graphs presented in the paper.
- https://cdn.elifesciences.org/articles/84446/elife-84446-data1-v2.zip
Download links
A two-part list of links to download the article, or parts of the article, in various formats.
Downloads (link to download the article as PDF)
Open citations (links to open the citations from this article in various online reference manager services)
Cite this article (links to download the citations from this article in formats compatible with various reference manager tools)
Phase separation-mediated actin bundling by the postsynaptic density condensates
eLife 12:e84446.
https://doi.org/10.7554/eLife.84446


