Behavioral dissection of hunger states in Drosophila
- Department of Molecular and Integrative Physiology and Geriatrics Center, Biomedical Sciences and Research Building, University of Michigan, United States
- College of Literature, Science, and the Arts, Biomedical Sciences and Research Building, University of Michigan, United States
- Neuroscience Graduate Program, University of Michigan, University of Michigan, United States
Figures
Figure 1 with 1 supplement
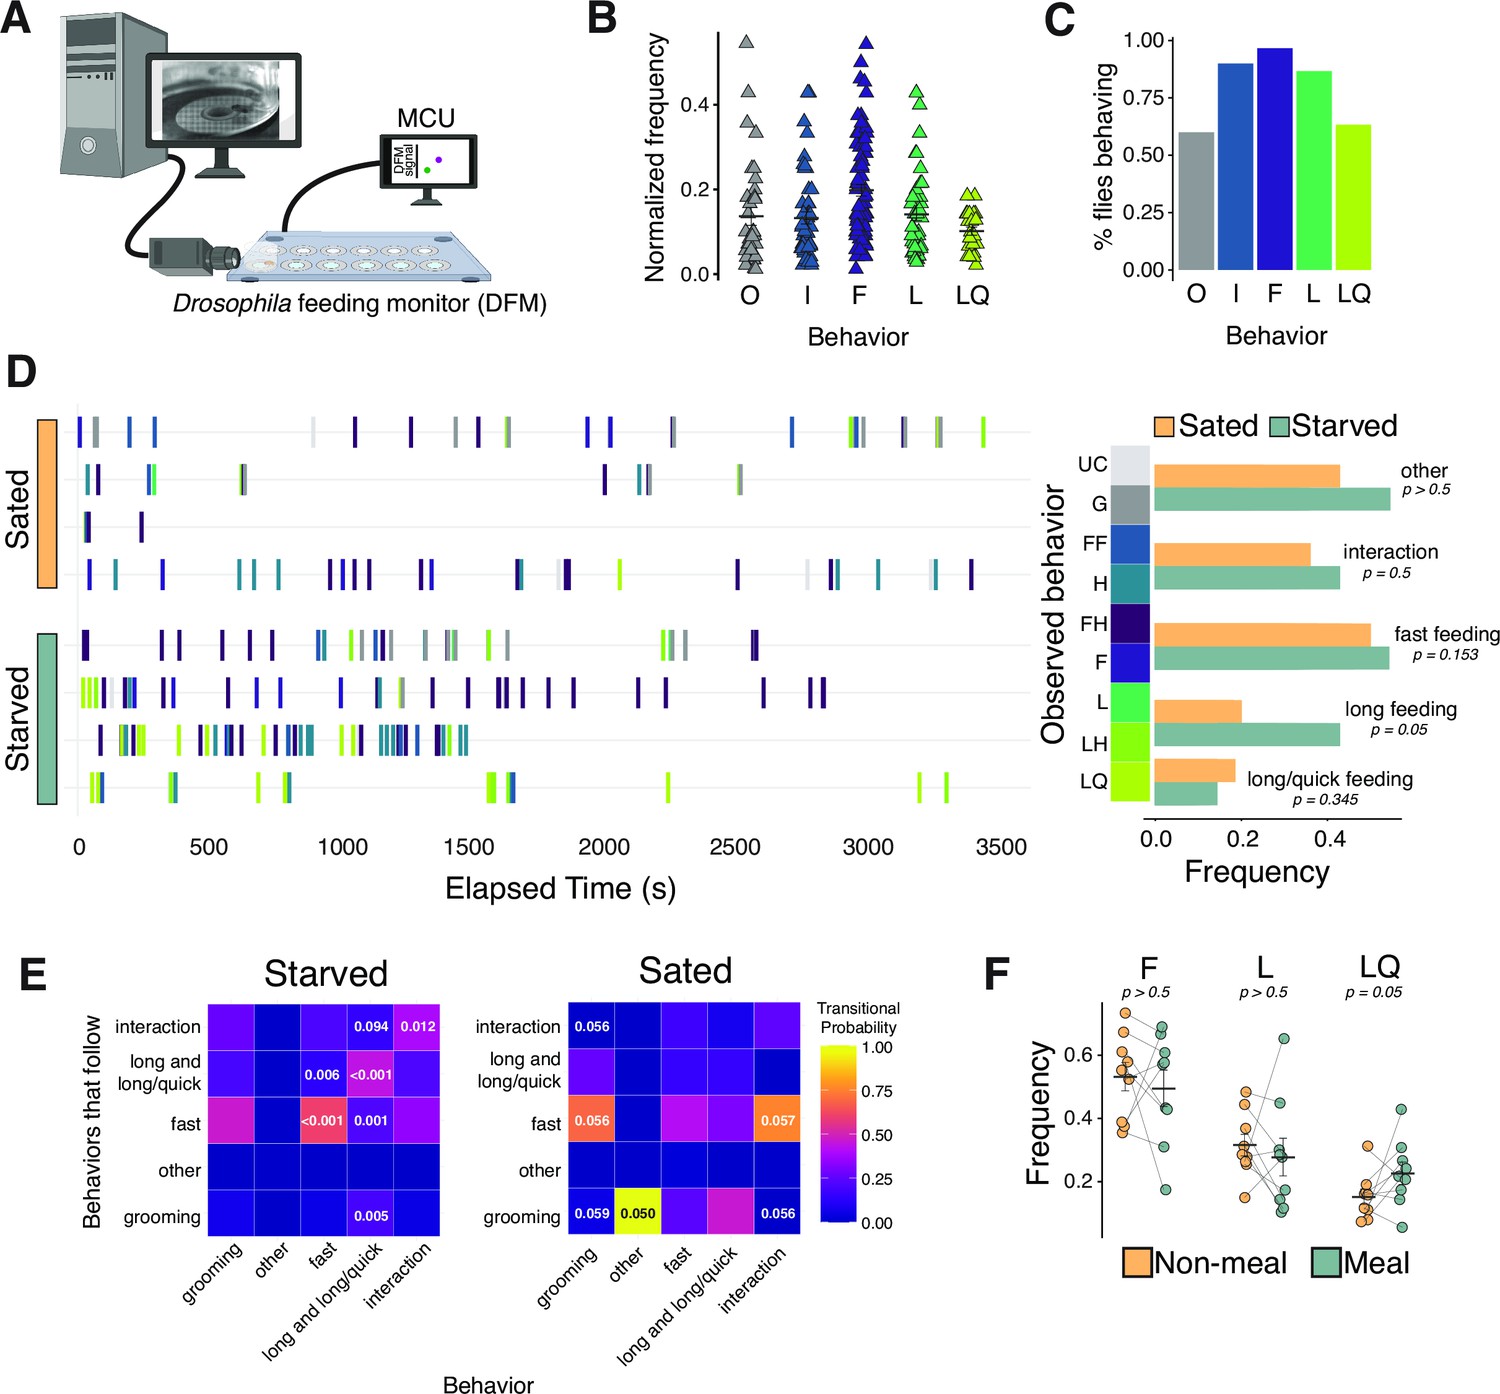
Characterization of feeding micro-behaviors in flies.
(A) Cartoon schematic of setup for filming flies on the Fly Liquid-Food Interaction Counter (FLIC). Frame capture is triggered by interactions of flies with the food source. (B) Frequency of all five main categories of observed feeding micro-behaviors: other (O), interaction (I), fast (F), long (L), long/quick (LQ). Each data point represents the total number of times an event occurred normalized to all observed events for each fly. N=8 flies, 528 events. (C) Percentage of flies from (B) that engaged in each feeding micro-behavior. (D) Representative temporal plots of sated (N=4 flies, 171 events) and starved (N=4 flies, 357 events) feeding micro-behaviors (left panel) and frequency of each behavior (right panel, two-tailed t-tests). Each row in left panel represents one fly, and frequencies are relative to all behaviors (two-tailed t-tests). (E) Heat maps of starved (left) and sated (right) transitional probabilities of observed behaviors from (D) (transitional probabilities are generated by dividing the observed count for each event pair by the total occurrences of the given event. p-Values are determined based on Z-scores, as described in Blumstein and Daniel, 2007). Long events contain both L and LQ events. (F) Frequency of each feeding micro-behavior during meal (7AM/PM-10AM/PM) vs. non-meal-times of day (one-tailed t-tests). N=9 flies, 693 events, frequency is relative to total interactions+feeding events. All error bars represent the mean +/- SEM.
-
Figure 1—source data 1
Excel spreadsheet containing source data used to generate Figures 1B-D.
- https://cdn.elifesciences.org/articles/84537/elife-84537-fig1-data1-v1.xls
Figure 1—figure supplement 1
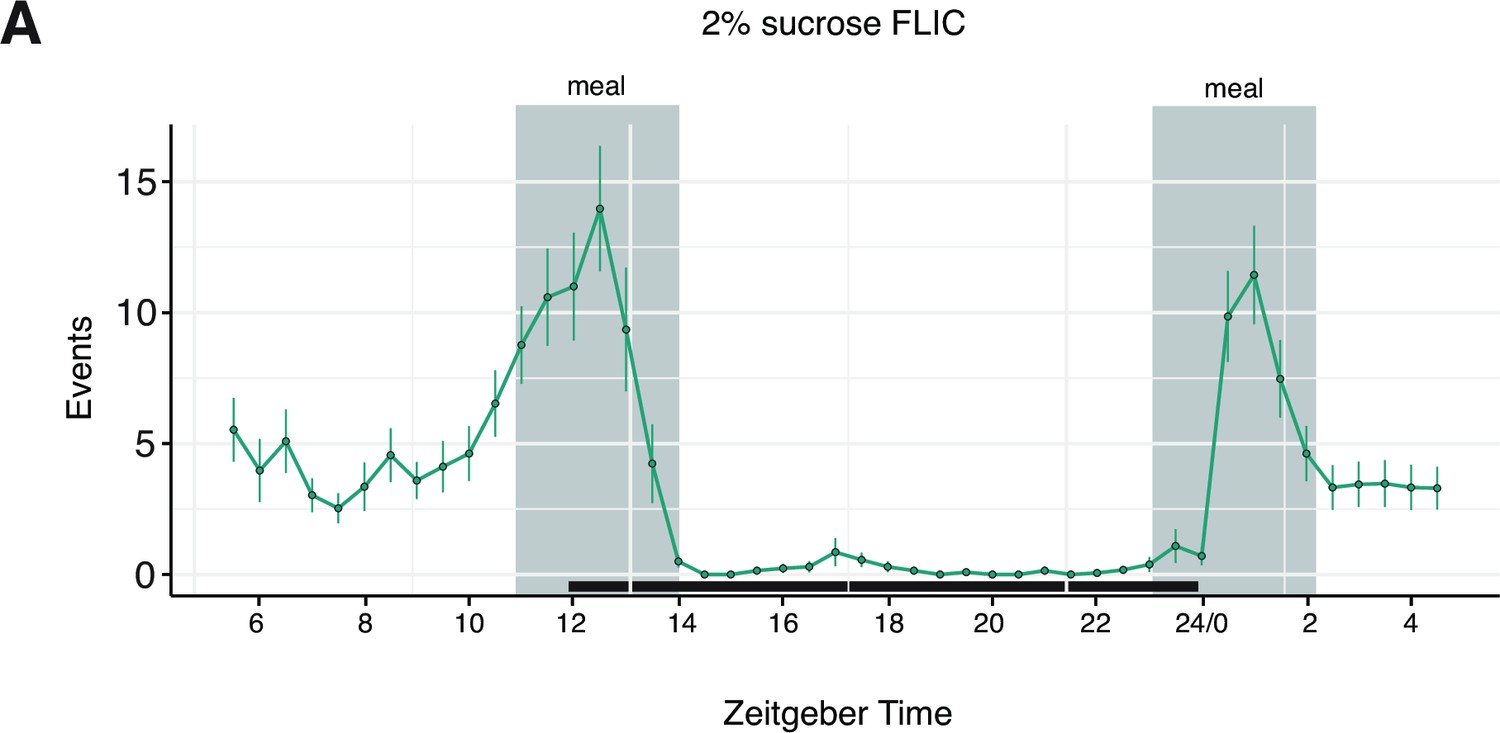
24 hr FLIC recording demonstrating distinct morning and evening feeding peaks.
(A) Representative temporal plot of food interactions on 2% sucrose Fly Liquid-Food Interaction Counter (FLIC) from female Canton-S flies monitored over 24 hr. Each data point represents the binned average number of events from a population of 38 flies in the previous 30 min interval. Shaded regions indicate the times of day designated as ‘meal-times’. Error bars represent the mean +/- SEM.
Figure 2
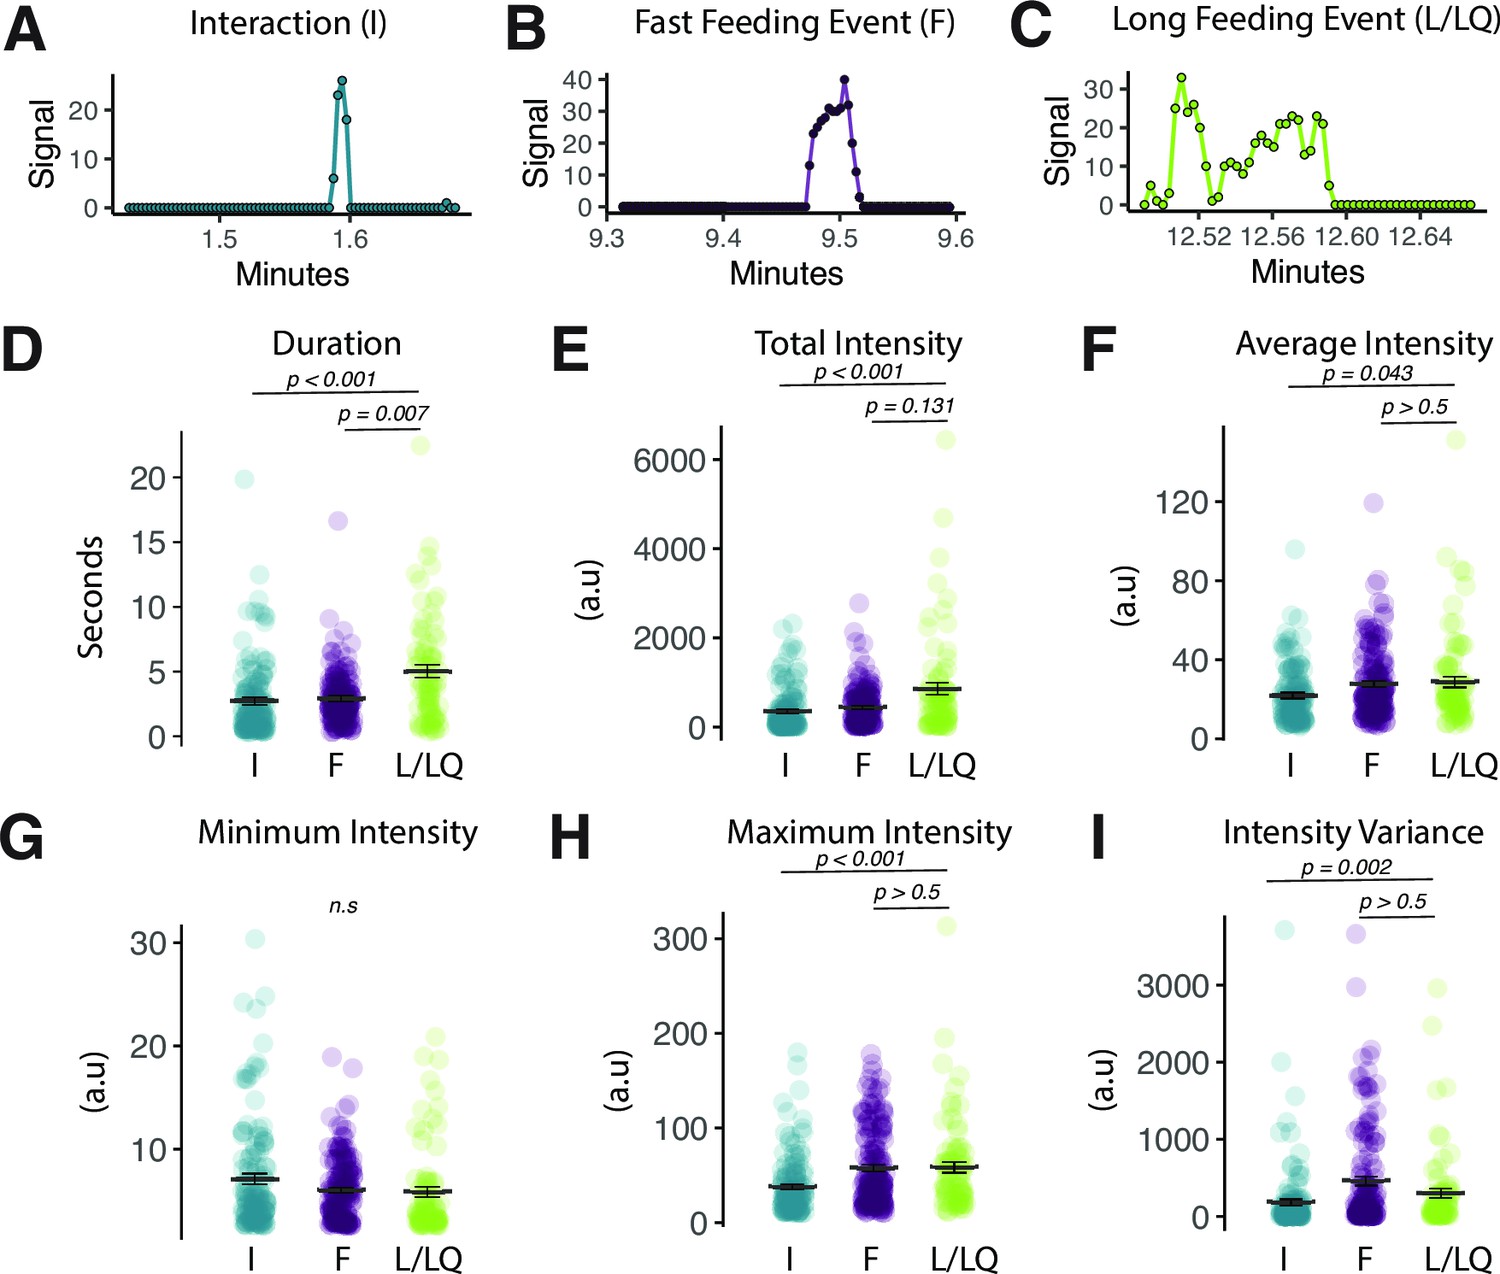
Fly Liquid-Food Interaction Counter (FLIC) signal characteristics distinguish between event types.
(A–C) Representative FLIC signal generated during a visually identified interaction (I), fast feeding (F), or long feeding (L/LQ) event. (D–I) Signal characteristics generated by the FLIC during visually identified I, F, or L/LQ events. Each data point represents one event from one fly (one-way ANOVA with Tukey’s post hoc). All error bars represent the mean +/- SEM.
-
Figure 2—source data 1
Excel spreadsheet containing source data used to generate Figures 2D-I.
- https://cdn.elifesciences.org/articles/84537/elife-84537-fig2-data1-v1.xls
Figure 3 with 1 supplement
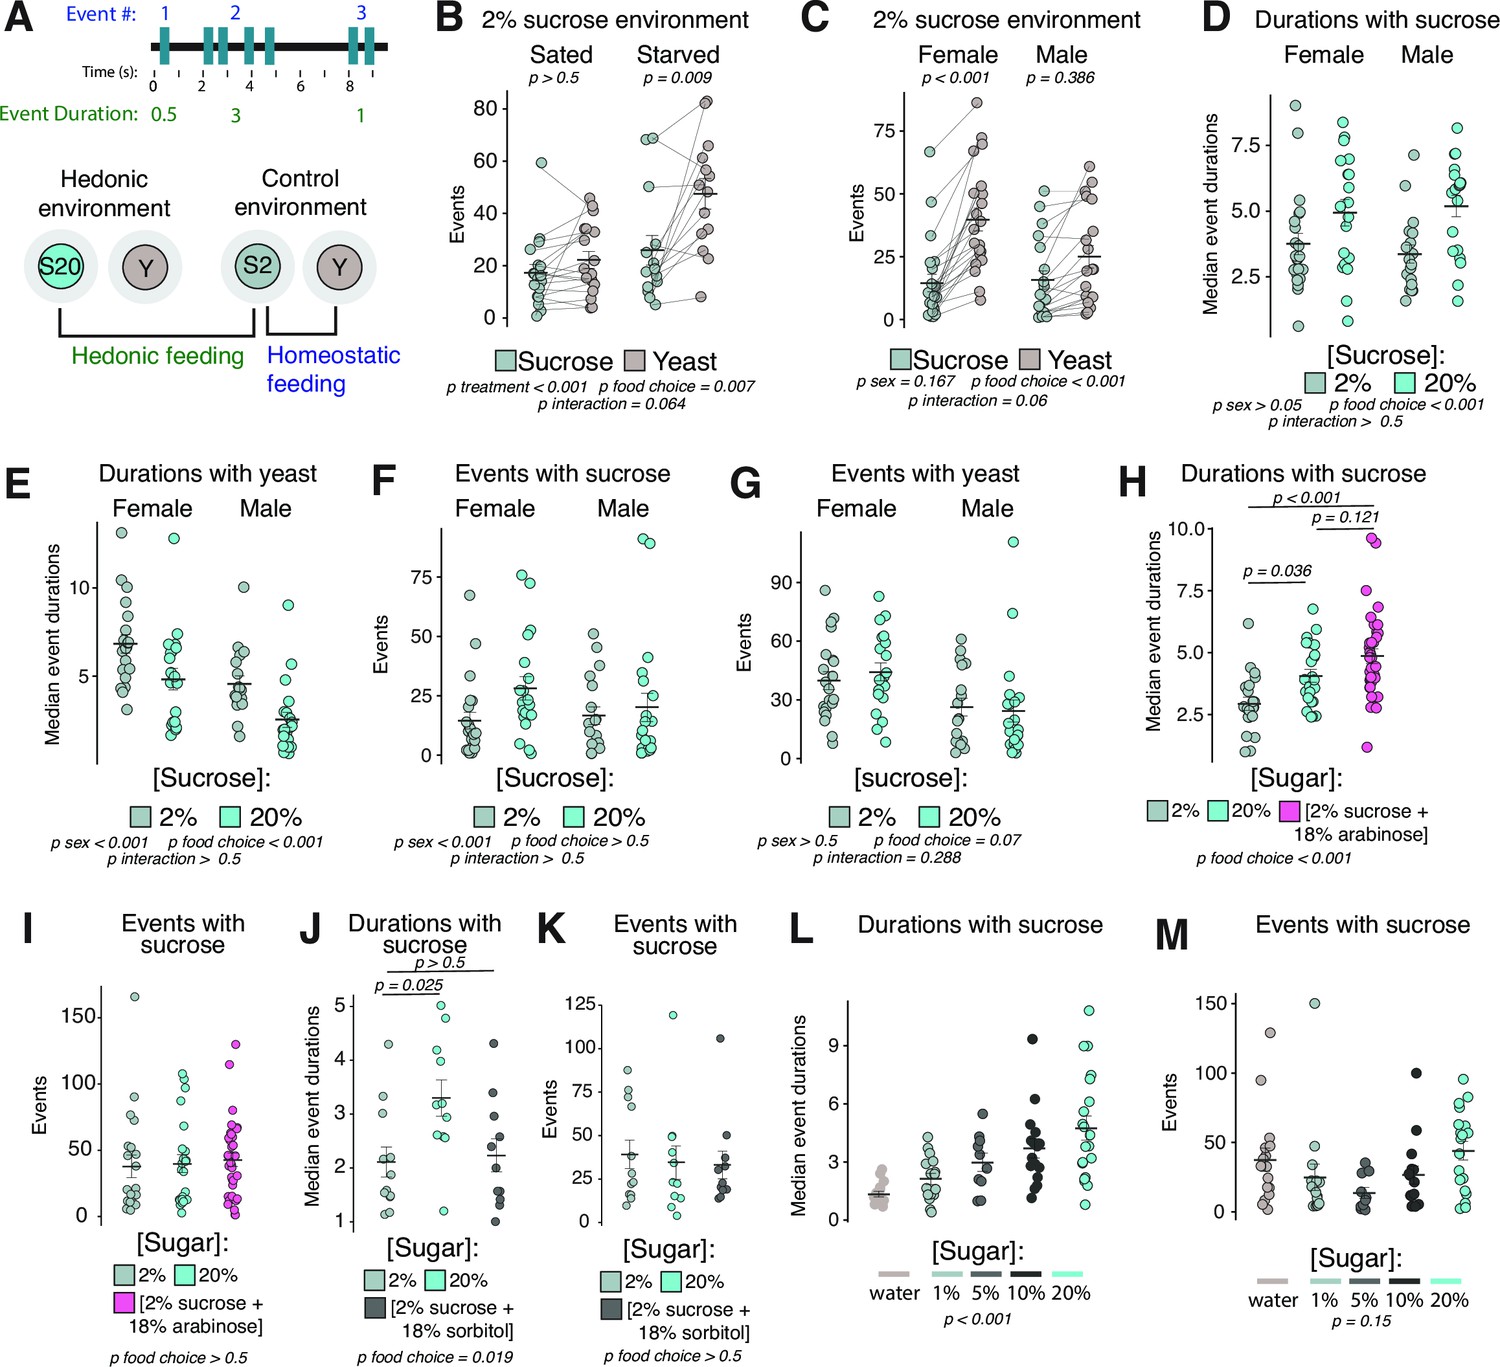
Feeding event durations are increased by hedonic food environments.
(A) Cartoon schematic of event number and event duration (top). Cartoon schematic of hedonic and control food choice environments, and comparisons used to define metrics for homeostatic and hedonic feeding (bottom). (B) Total number of events with sucrose or yeast in the control food choice environment from sated or 24 hr starved female Canton-S flies (two-way ANOVA with Tukey’s post hoc). (C) Total number of events with sucrose or yeast in the control food choice environment from sated female or male Canton-S flies (two-way ANOVA with Tukey’s post hoc). (D–E) Median event durations with sucrose (D) or yeast (E) in the control vs. hedonic food choice environments from sated female and male Canton-S flies (two-way ANOVA). (F–G) Total number of events with sucrose (F) or yeast (G) in the control vs. hedonic food choice environments from sated female and male Canton-S flies (two-way ANOVA). (H–K) Median event durations (H,J) and total number of events (I,K) with sugar in the indicated food choice environments from sated female Canton-S flies (one-way ANOVA with Tukey’s post hoc). (J–K) Median event durations (J) and total number of events (K) with sugar in the indicated food choice environment from sated female Canton-S flies (one-way ANOVA with Tukey’s post hoc). (L–M) Median event durations (L) and total number of events (M) with sucrose in the indicated food choice environments (one-way ANOVA). All error bars represent the mean +/- SEM.
-
Figure 3—source data 1
Excel spreadsheet containing source data used to generate Figures 3B-M and Figure 3 - Figure Supplement 1A-C.
- https://cdn.elifesciences.org/articles/84537/elife-84537-fig3-data1-v1.xls
Figure 3—figure supplement 1
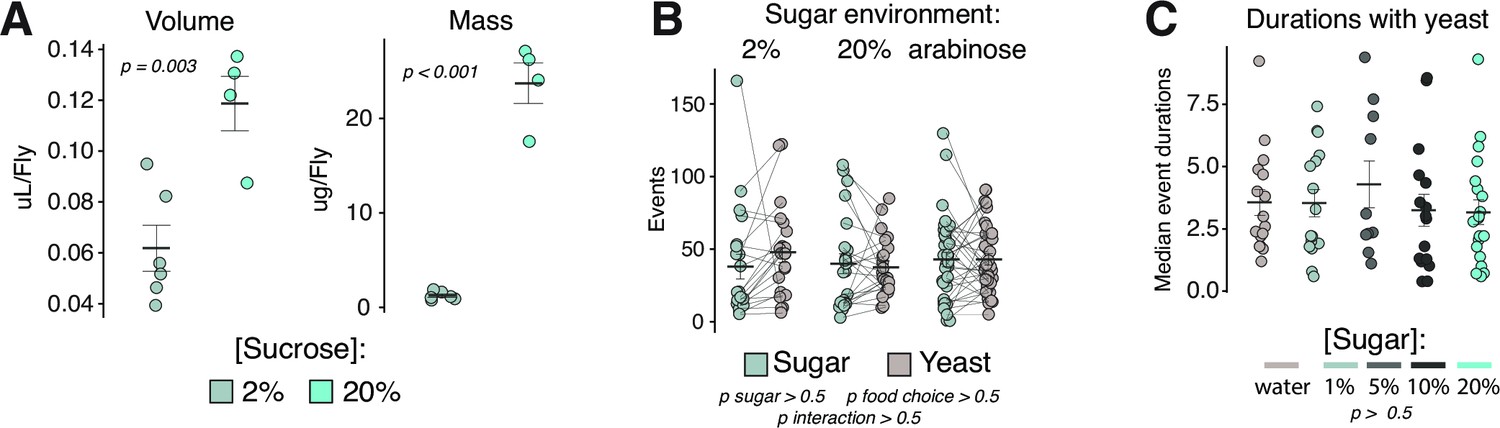
Hedonic food environments do not elicit increases in total number of events or event durations with yeast but do promote increased volumetric intake.
(A) Consumption-excretion (Con-Ex) measurement of volumetric sucrose consumptions (left panel) and total mass consumed (right panel) in the control vs. hedonic food environments from female Canton-S flies (one-way ANOVAs). (B) Total number of events with sugar or yeast in indicated food choice environments from sated female Canton-S flies (two-way ANOVA). (C) Median event durations with yeast in the indicated food choice environments from sated female Canton-S flies (one-way ANOVA). All error bars represent the mean +/- SEM.
Figure 4
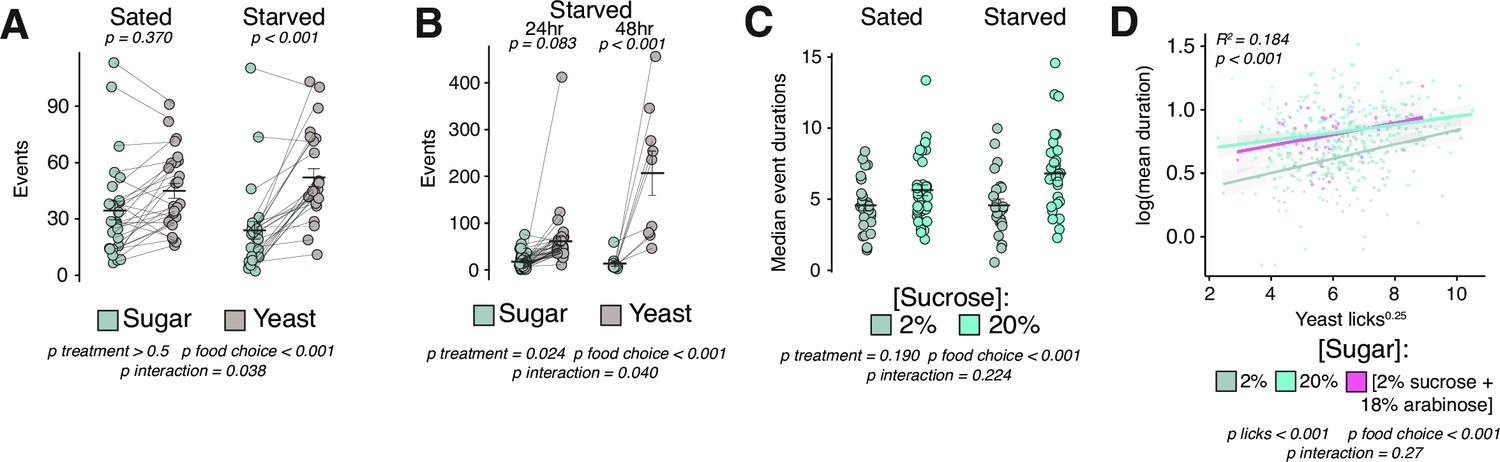
Hedonic feeding is modulated by homeostatic hunger.
(A) Total number of events with sucrose or yeast in the control food choice environment from sated or 24 hr starved female Canton-S flies (two-way ANOVA with Tukey’s post hoc). (B) Total number of events with sucrose or yeast in the control food choice environment from 24 hr vs. 48 hr starved female Canton-S flies (two-way ANOVA with Tukey’s post hoc). (C) Median event durations with sucrose in the control vs. hedonic food environments from sated vs. 24 hr starved female Canton-S flies (two-way ANOVA). (D) Linear regression of interactions with yeast (licks) versus mean event durations with indicated sugar. Each data point represents one fly (yeast licks are expressed as a transformation to the 0.25 power and event durations are expressed as a log transformation to achieve normality, call = lm(SucroseDurations ~YeastLicks*FoodEnvironment), two-way ANOVA, adjusted R2=0.1835). All error bars represent the mean +/- SEM.
-
Figure 4—source data 1
Excel spreadsheet containing source data used to generate Figures 4A-D.
- https://cdn.elifesciences.org/articles/84537/elife-84537-fig4-data1-v1.xls
Figure 5 with 13 supplements
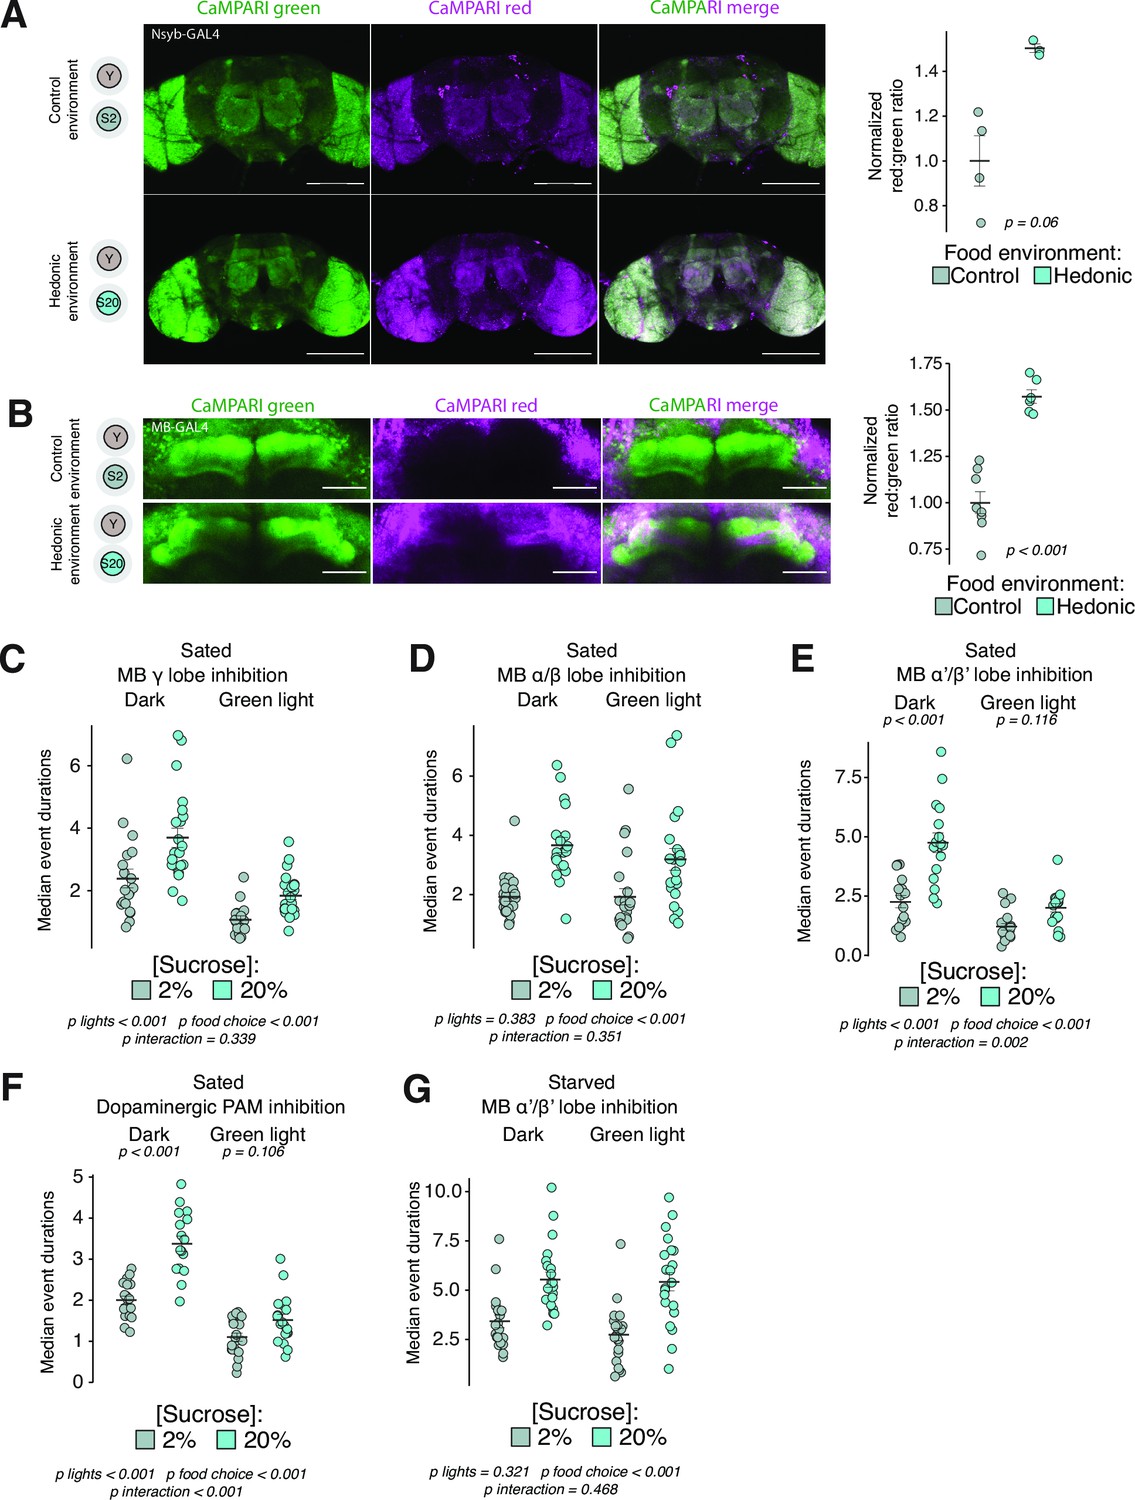
Hedonic hunger requires distinct mushroom body lobes.
(A) Representative maximum intensity projections from brains of flies expressing Nsyb-GAL4>UAS-CaMPARI exposed to control or hedonic food environments, quantified at right (scale bar = 100 µM, two-tailed t-test). (B) Representative maximum intensity projections from brains of flies expressing MB238Y-GAL4>UAS-CaMPARI, quantified at right (scale bar = 10 µM, one-tailed t-test). For both (A) and (B), green represents unconverted CaMPARI and magenta represents converted CaMPARI. (C–E) Median event durations with sucrose in control vs. hedonic food environments from sated female flies expressing UAS-GtACR driven by either (C) MB131B-GAL4 (γ(d);γ(m)), (D) MB008B-GAL4 (α/β(c);α/β(p);α/β(s)), or (E) MB461B-GAL4 (α’/β’(ap);α’β’(m)) (two-way ANOVAs with Tukey’s post hoc). (F) Median event durations with sucrose in control vs. hedonic food environments from sated female flies expressing PAM-GAL4>UAS-GtACR (two-way ANOVA with Tukey’s post hoc). (G) Median event durations with sucrose in control vs. hedonic food environments from 24 hr starved female flies expressing MB461B-GAL4>UAS-GtACR (two-way ANOVA). All error bars represent the mean +/- SEM.
-
Figure 5—source data 1
Excel spreadsheet containing source data used to generate Figures 5A-G and Figure 5 - Figure Supplements 1A-C.
- https://cdn.elifesciences.org/articles/84537/elife-84537-fig5-data1-v1.xls
Figure 5—figure supplement 1
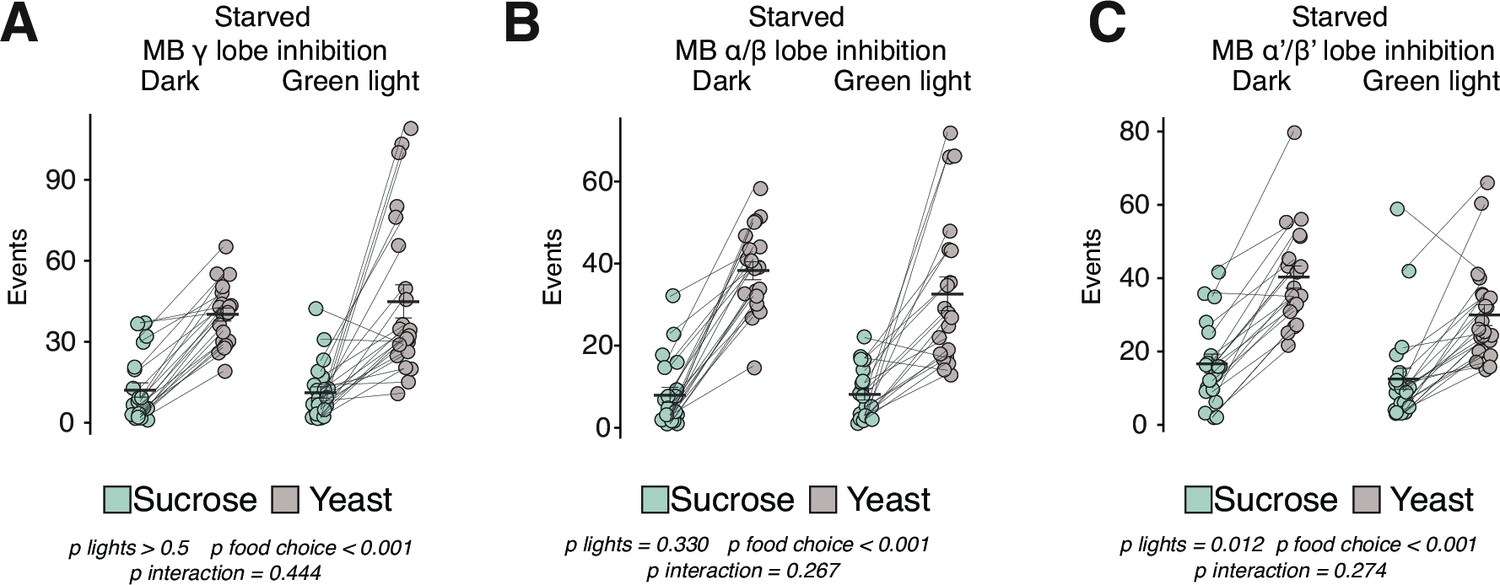
Mushroom body lobes are not required for homeostatic hunger.
(A–C) Total number of events with sucrose or yeast in the control food choice environment from 24 hr starved female flies expressing UAS-GtACR driven by either (A) MB131B-GAL4 (γ(d);γ(m)), (B) MB008B-GAL4 (α/β(c);α/β(p);α/β(s)), or (C) MB461B-GAL4 (α’/β’(ap);α’β’(m)) (two-way ANOVAs). All error bars represent the mean +/- SEM.
Figure 5—video 1
NsybCaMPARI stacks control environment green, related to Figure 5A–B.
Movies of confocal z-stacks through whole brains of flies carrying Nsyb-Gal4>UAS-CaMPARI (Figure 5—videos 1–6) or MB238Y-GAL4>UAS-CaMPARI (Figure 5—videos 7–12) in control or hedonic food environments. Green channels represent unconverted CaMPARI and magenta channels represent photoconverted CaMPARI.
Figure 5—video 2
NsybCaMPARI stacks control environment red.
Figure 5—video 3
NsybCaMPARI stacks control environment merge.
Figure 5—video 4
NsybCaMPARI stacks hedonic environment green.
Figure 5—video 5
NsybCaMPARI stacks hedonic environment red.
Figure 5—video 6
NsybCaMPARI stacks hedonic environment merge.
Figure 5—video 7
MBCaMPARI stacks control environment green.
Figure 5—video 8
MBCaMPARI stacks control environment red.
Figure 5—video 9
MBCaMPARI stacks control environment merge.
Figure 5—video 10
MBCaMPARI stacks hedonic environment green.
Figure 5—video 11
MBCaMPARI stacks hedonic environment red.
Figure 5—video 12
MBCaMPARI stacks hedonic environment merge.
Tables
Table 1
Library of feeding micro-behaviors.
| Main event type | Code | Behavior description | |
|---|---|---|---|
| Other (O) | G | Groom | |
| UC | Unknown contact | ||
| Interaction (I) | IF | Front legs touch food | |
| IH | Hind legs touch food | ||
| Fast feeding (F) | F | Single movement of proboscis into food to feed for 1–3 s | |
| FI | Meets requirements for F and I | ||
| Long feeding (L) | L | Proboscis continuously in food while feeding for >4 s | |
| LI | Meets requirements for L and I | ||
| Long/quick feeding (L) | LQ | Proboscis moves in and out quickly while feeding for >4 s |
Key resources table
| Reagent type (species) or resource | Designation | Source or reference | Identifiers | Additional information |
|---|---|---|---|---|
| Genetic reagent (Drosophila melanogaster) | Canton-S | Bloomington Drosophila Stock Center | ||
| Genetic reagent (Drosophila melanogaster) | UAS-CaMPARI | Bloomington Drosophila Stock Center | BDSC #68762 RRID:BDSC_68762 | |
| Genetic reagent (Drosophila melanogaster) | MB238Y-GAL4 | Bloomington Drosophila Stock Center | BDSC #81009 RRID:BDSC_81009 | |
| Genetic reagent (Drosophila melanogaster) | MB131B-GAL4 | Bloomington Drosophila Stock Center | BDSC #68265 RRID:BDSC_68265 | |
| Genetic reagent (Drosophila melanogaster) | MB008B-GAL4 | Bloomington Drosophila Stock Center | BDSC #68291 RRID:BDSC_68291 | |
| Genetic reagent (Drosophila melanogaster) | MB461B-GAL4 | Bloomington Drosophila Stock Center | BDSC #68327 RRID:BDSC_68327 | |
| Genetic reagent (Drosophila melanogaster) | GMR58E02-GAL4 | Bloomington Drosophila Stock Center | BDSC #41347 RRID:BDSC_41347 | |
| Genetic reagent (Drosophila melanogaster) | LexAop2-CsChrimson;UAS-CaMPARI2;GMR57C10-GAL4 | Bloomington Drosophila Stock Center | BDSC #81089 RRID:BDSC_81089 | |
| Genetic reagent (Drosophila melanogaster) | UAS-GtACR | Other | M. Dus (University of Michigan) | |
| Software, algorithm | RStudio | RStudio | RRID:SCR_000432 | |
| Software, algorithm | Fiji | ImageJ | RRID:SCR_002285 | |
| Software, algorithm | FLIC analysis R code | Flidea | RRID:SCR_018386 | |
| Software, algorithm | DTrack | Other | S. Pletcher (University of Michigan) | |
| Other | FLIC Drosophila Feeding Monitors | Sable Systems | Model DFMV3 | https://www.sablesys.com/products/classic-line/flic_drosophila_behavior_system/ |
| Other | FLIR grasshopper camera | FLIR | GS3-U3-28S5C-C | #88-052 - GS3-U3-28S5C-C 2/3" FLIR Grasshopper3 High Performance USB 3.0 Color Camera |
| Other | Fujinon varifocal lens | Fujinon | MFR #DV3.4x3.8SA-1 | Fujinon 3 MP varifocal lens (3.8–13 mm, 3.4× zoom) |
Additional files
Download links
A two-part list of links to download the article, or parts of the article, in various formats.
Downloads (link to download the article as PDF)
Open citations (links to open the citations from this article in various online reference manager services)
Cite this article (links to download the citations from this article in formats compatible with various reference manager tools)
Behavioral dissection of hunger states in Drosophila
eLife 12:RP84537.
https://doi.org/10.7554/eLife.84537.3


