Comparative single-cell profiling reveals distinct cardiac resident macrophages essential for zebrafish heart regeneration
- Graduate Institute of Life Sciences, National Defense Medical Center, Taiwan
- Institute of Biomedical Sciences, Academia Sinica, Taiwan
- Taiwan International Graduate Program in Molecular Medicine, National Yang Ming Chiao Tung University, Taiwan
- Department of Biological Science & Technology, National Yang Ming Chiao Tung University, Taiwan
- Department and Graduate Institute of Pharmacology, National Taiwan University College of Medicine, Taiwan
Figures
Figure 1 with 1 supplement
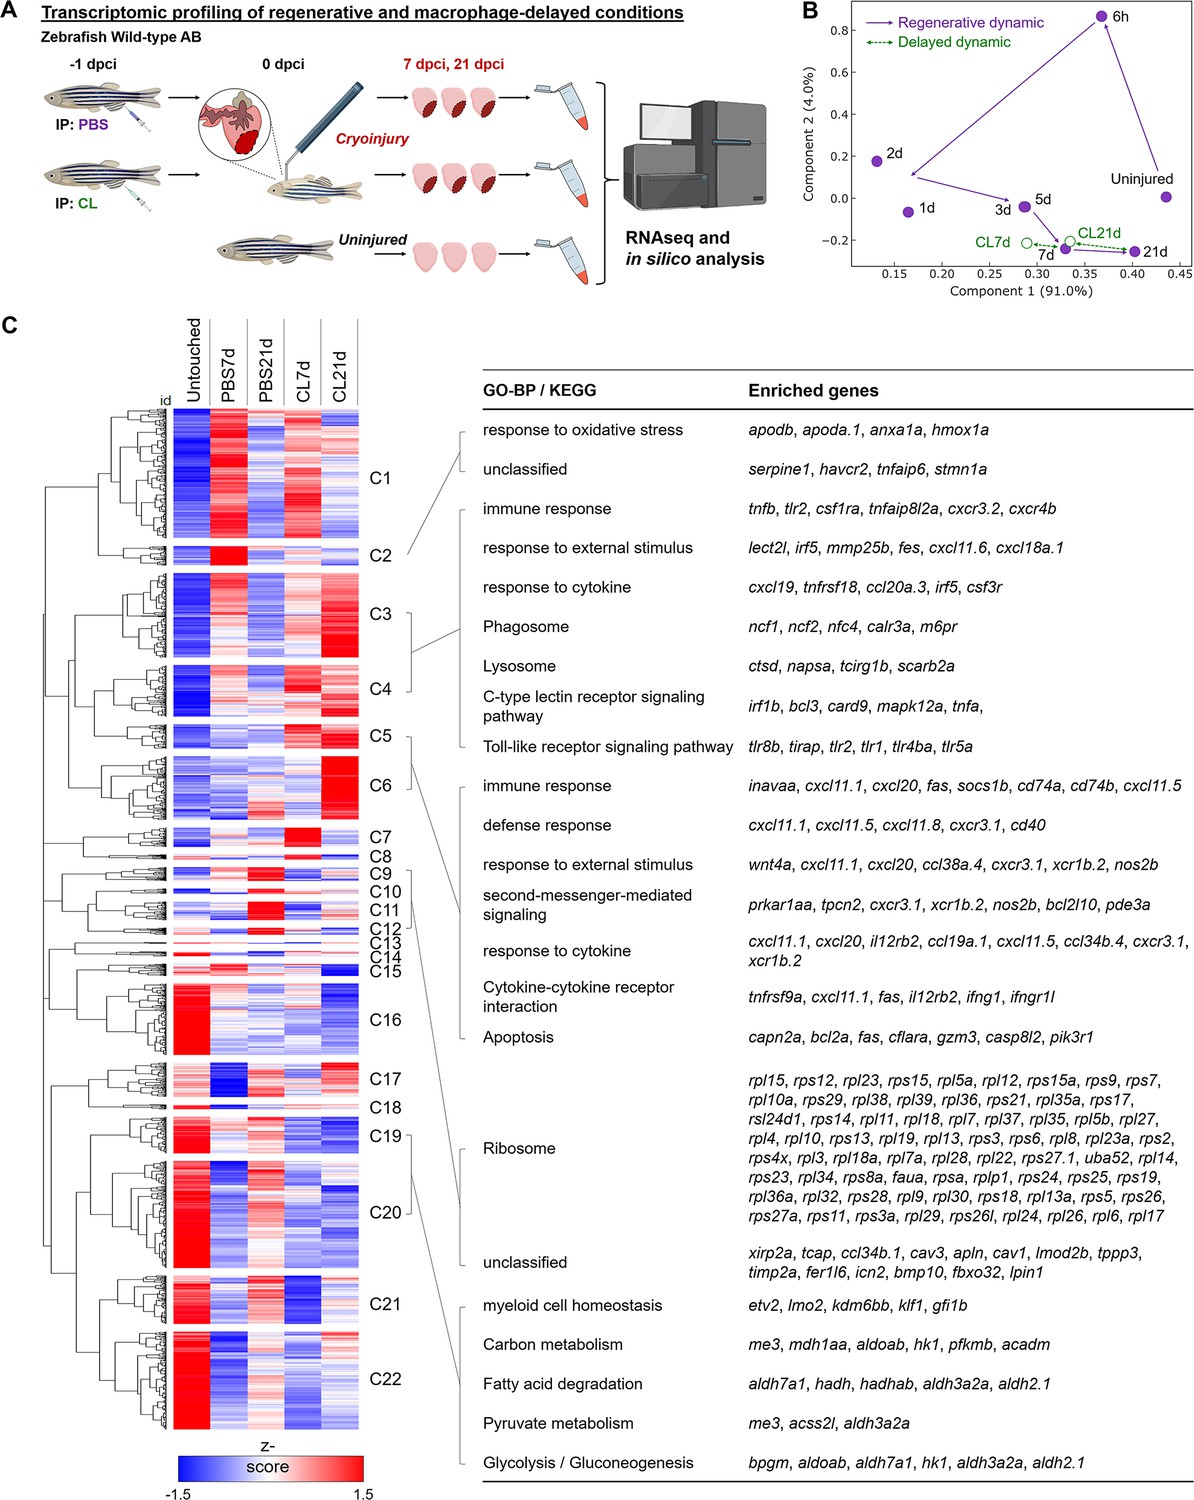
Transcriptional profiling of infarcted hearts under regenerative and macrophage-delayed conditions.
(A) Experimental design. Zebrafish AB_wildtype was IP-injected with PBS or clodronate liposomes (CL) 1 d before cardiac cryoinjury. Injured hearts were collected at 7 and 21 days post cryoinjury (dpci), respectively. Uninjured hearts were collected as the control of the baseline. Total RNA was extracted and analyzed by RNA sequencing (RNAseq). (B) Principal component analysis (PCA) of gene expression in hearts at different time points. The PCA was performed on the FPKM normalized datasets of healthy hearts and injured hearts at 7 and 21 dpci after PBS or CL treatments (PBS7d, PBS21d, CL7d, and CL21d). The datasets of 0 hr, 6 hr, 1d, 2d, 3d, and 5 dpci from the previous study were also included (Lai et al., 2017). Regeneration and delayed dynamics are indicated by purple and green lines, respectively. FPKM, Fragments Per Kilobase of transcript per Million mapped reads. (C) Hierarchical clustering heatmap of the comparatively DEGs under regenerative and macrophage-delayed conditions in zebrafish. The DEGs were selected by NOIseq (q > 0.99) and arranged by hierarchical clustering from cluster 1 (C1) to cluster 22 (C22) (left panel). The value was a z-score from 1.5 as red to –1.5 as blue. BP of GO and KEGG pathways of the DEGs were analyzed by using WebGestalt (right panel). Cluster-enriched genes involved in their predicted biological processes and pathways were listed. The threshold of enriched categories was FDR < 0.05. DEGs, differentially expressed genes; GO, Gene Ontology; BP, biological process; KEGG, Kyoto Encyclopedia of Genes and Genomes; FDR, false discovery rate.
-
Figure 1—source data 1
Full DEGs list from RNAseq data of -1d-CL vs. PBS-control hearts at 7 and 21 days post cryoinjury.
- https://cdn.elifesciences.org/articles/84679/elife-84679-fig1-data1-v2.xlsx
Figure 1—figure supplement 1
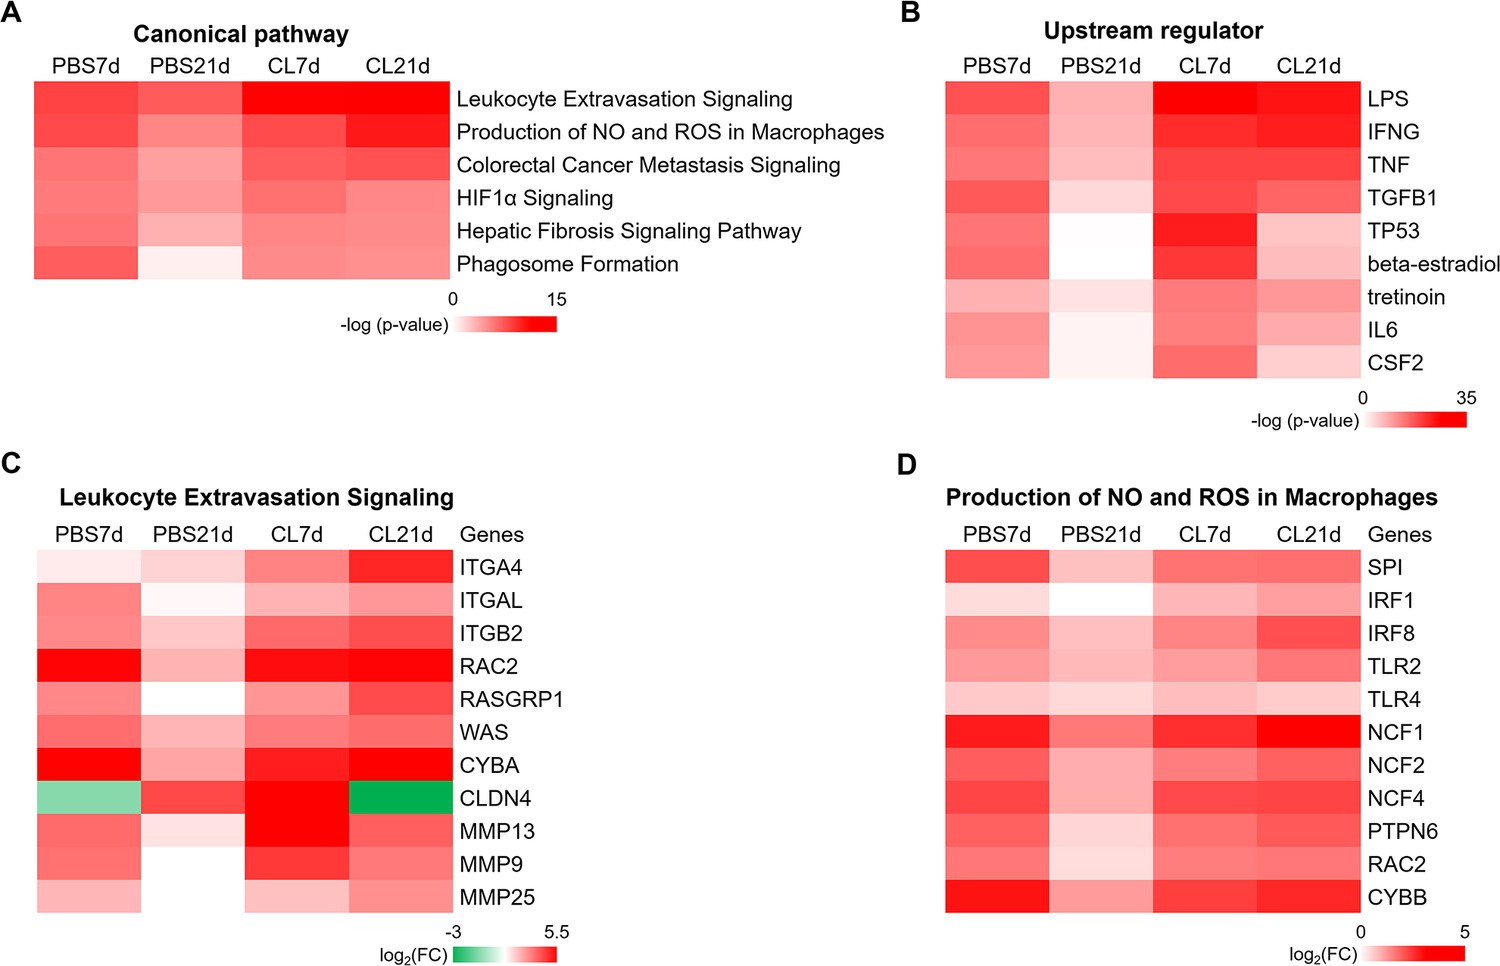
Identification of canonical pathways and upstream regulators under regenerative and macrophage-delayed conditions.
(A, B) Top canonical pathways (A) and upstream regulators (B) in PBS-treated or CL-treated hearts were predicted by Ingenuity Pathway Analysis (IPA). The value is shown as -log(p-value) and the color reflects the degree of enrichment. (C, D) The heatmaps of top DEGs involved in the canonical pathways of Leukocyte Extravasation Signaling (C) and Production of NO and reactive oxygen species (ROS) in Macrophages (D). The value was log2 fold change indicated by color at bottom. DEGs, differentially expressed genes.
Figure 2 with 4 supplements
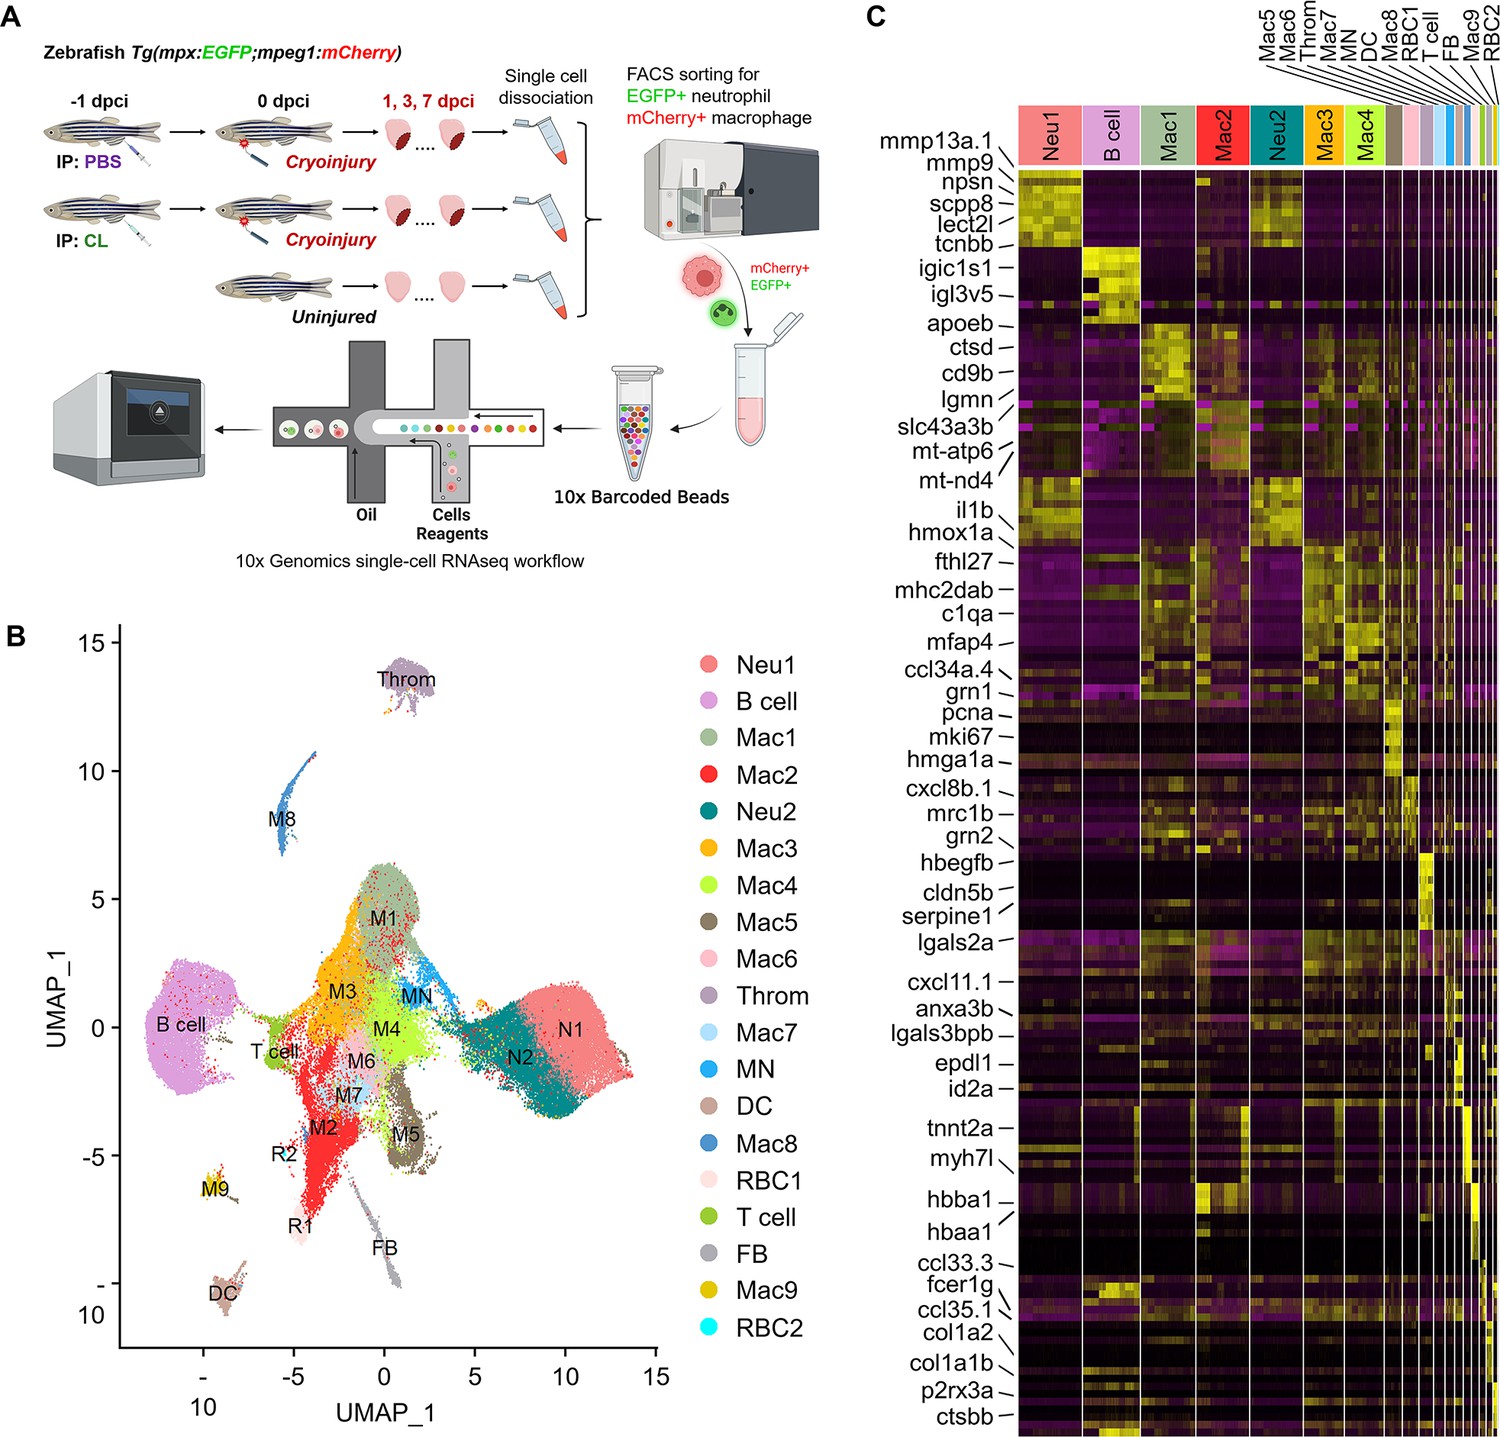
Temporal single-cell analyses revealed heterogeneous macrophages and neutrophils in the infarcted hearts.
(A) Experimental design. Double transgenic Tg(mpx:EGFP;mpeg1:mCherry) zebrafish expressing EGFP in neutrophils and mCherry in macrophages were IP-injected with PBS (regenerative condition) or CL (macrophage-delayed condition) 1 d before cryoinjury (–1 dpci, –1d_CL). Injured hearts were collected and dissociated into single cells at 1, 3, and 7 days post cryoinjury (dpci). Untreated and uninjured hearts were also collected and dissociated. Single cells of each time point were then subjected to a fluorescence-activated cell sorter (FACS) for isolating the mCherry+ and EGFP+ cells. RNA was purified from these cells and barcoded followed by single-cell RNA sequencing (scRNAseq). (B) Uniform Manifold Approximation and Projection (UMAP) of the isolated cells. The isolated cells consisted of nine macrophage clusters, two neutrophil clusters, one hybrid cluster (MN), and other minor populations including B cell, thrombocyte (Throm), dendritic cell (DC), T cell, fibroblast (FB), and two red blood cell (RBC) clusters. (C) Heatmap of top 10 DEGs in 19 clusters of infarcted hearts. Yellow highlights the cluster-enriched genes with gene names listed on the left. DEGs, differentially expressed genes.
-
Figure 2—source data 1
R script of cell cycle regression analysis of scRNAseq data.
- https://cdn.elifesciences.org/articles/84679/elife-84679-fig2-data1-v2.xlsx
-
Figure 2—source data 2
Cluster-enriched genes of each cell cluster from scRNAseq analysis.
- https://cdn.elifesciences.org/articles/84679/elife-84679-fig2-data2-v2.xlsx
Figure 2—figure supplement 1
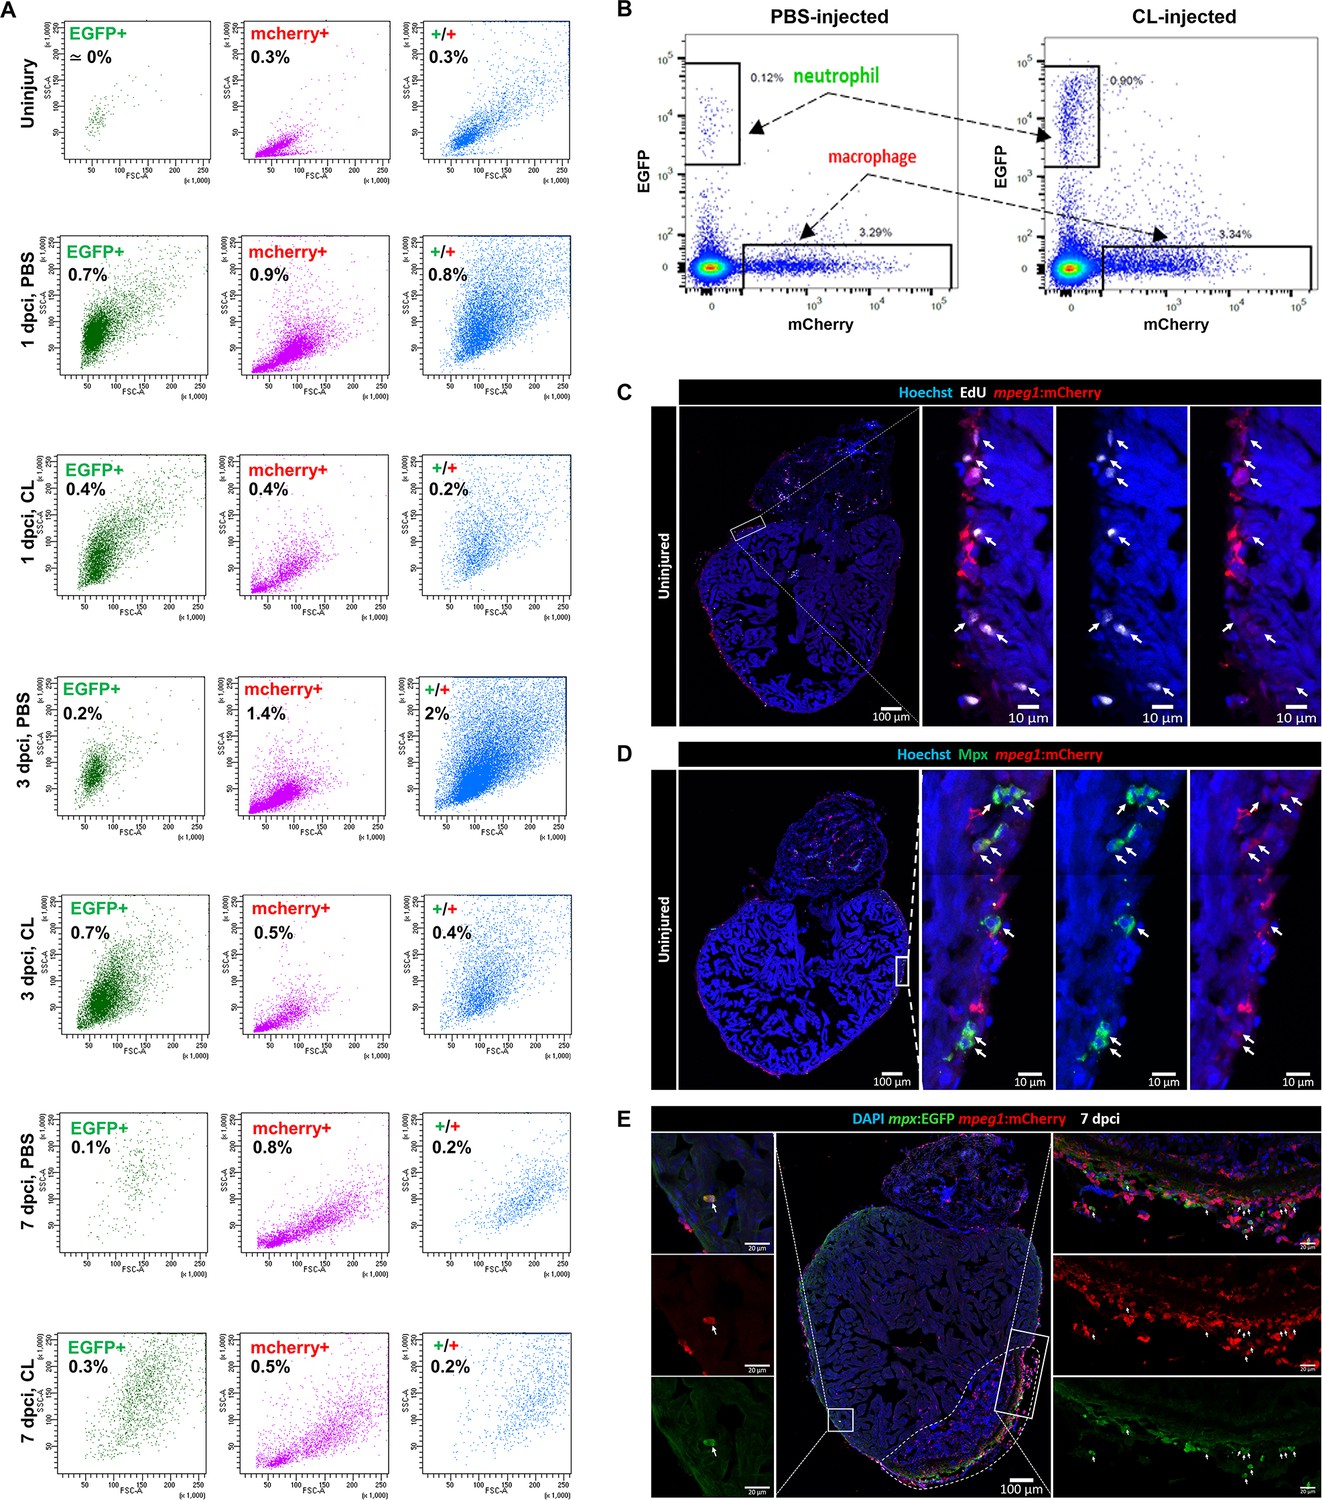
Dynamics of macrophages and neutrophils in zebrafish heart prior and post injury.
(A) Macrophages and neutrophils derived from uninjured and injured hearts under regenerative (PBS) or macrophage-delayed (CL) conditions were analyzed by fluorescence-activated cell sorting (FACS). Cell granularity and size were shown by side scatter (SSC)/forward scatter (FSC) gating. Neutrophils (EGFP+ cells) are shown in green, macrophages (mCherry+ cells) are shown in pink, and double-positive cells are shown in blue. Cell proportion of total input is indicated in each panel. (B) Representative plots of the EGFP and mCherry gating of 7 days post cryoinjury (dpci) PBS and CL sorted macrophages and neutrophils. (C) Examination of steady-state macrophage proliferation locally in hearts by EdU staining. White arrows highlighted the proliferating (EdU+mCherry+ double-positive) cells. (D) Validation of Mpx+ macrophages in uninjured Tg(mpeg1:mCherry) heart cryosection by immunostaining using anti-Mpx antibody. White arrows highlight the Mpx+mCherry+ double-positive cells. (E) Validation of mpx:EGFP+ macrophages on 7 dpci Tg(mpx:EGFP;mpeg1:mCherry) heart cryosection. White arrows highlight the mCherry+EGFP+ double-positive cells.
Figure 2—figure supplement 2
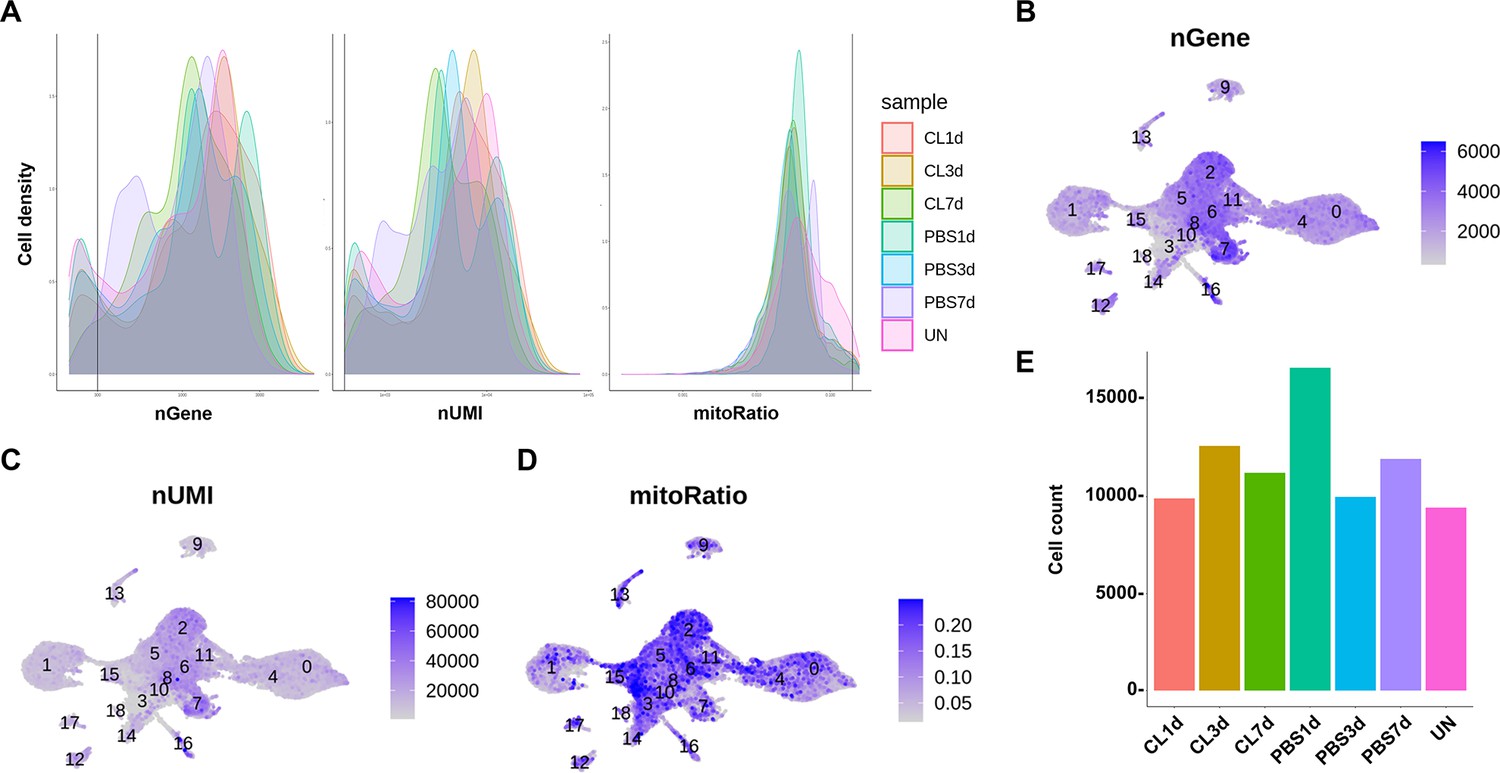
Quality controls for all the scRNAseq datasets by Seurat.
(A) Respective plots of nGene, nUMI, and mitoRatio versus cell density for each time point and condition. (B–D) Uniform Manifold Approximation and Projection (UMAP) plots colored by the counts of nGene (B), nUMI (C), and the percentage of mitoRatio (D). (E) Filtered cell counts after quality control for each time point and condition.
Figure 2—figure supplement 3
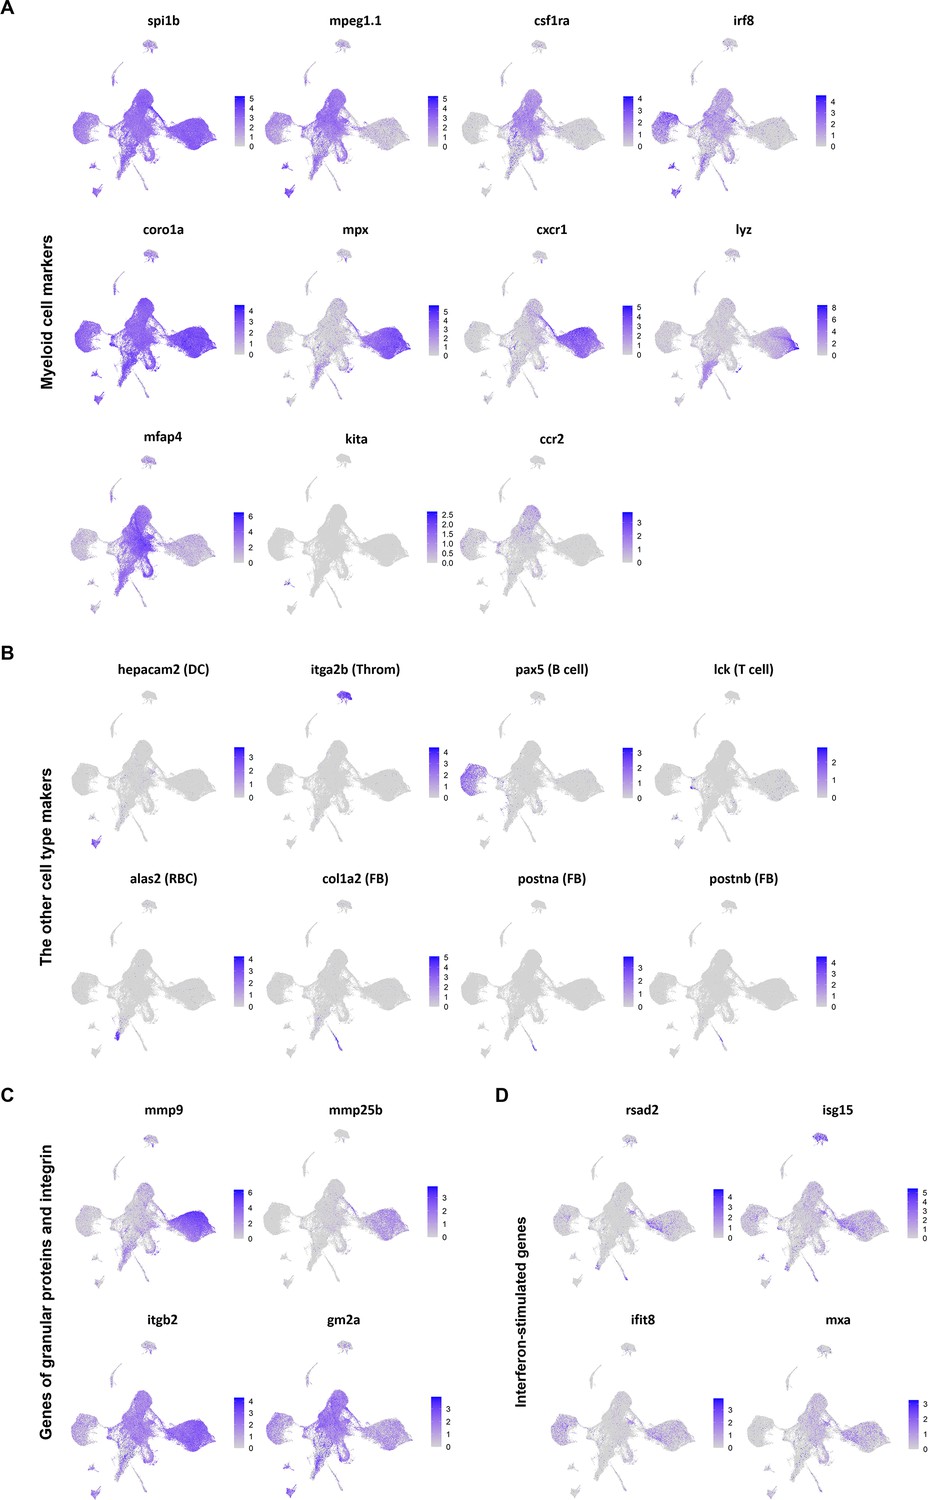
Expression of marker genes visualized on Uniform Manifold Approximation and Projection (UMAP) plots.
(A) UMAP plots of macrophages and neutrophils marker genes. (B) UMAP plots of marker genes of dendritic cells (DC; hepacam2), thrombocytes (Throm; itga2b), B cells (pax5), T cells (lck), red blood cells (RBC; alas2), and fibroblasts (FB; col1a2, postna and postnb). (C) UMAP plots of genes encoded granular proteins and integrin in mature neutrophils. (D) UMAP plots of interferon-stimulated genes (ISGs).
Figure 2—figure supplement 4
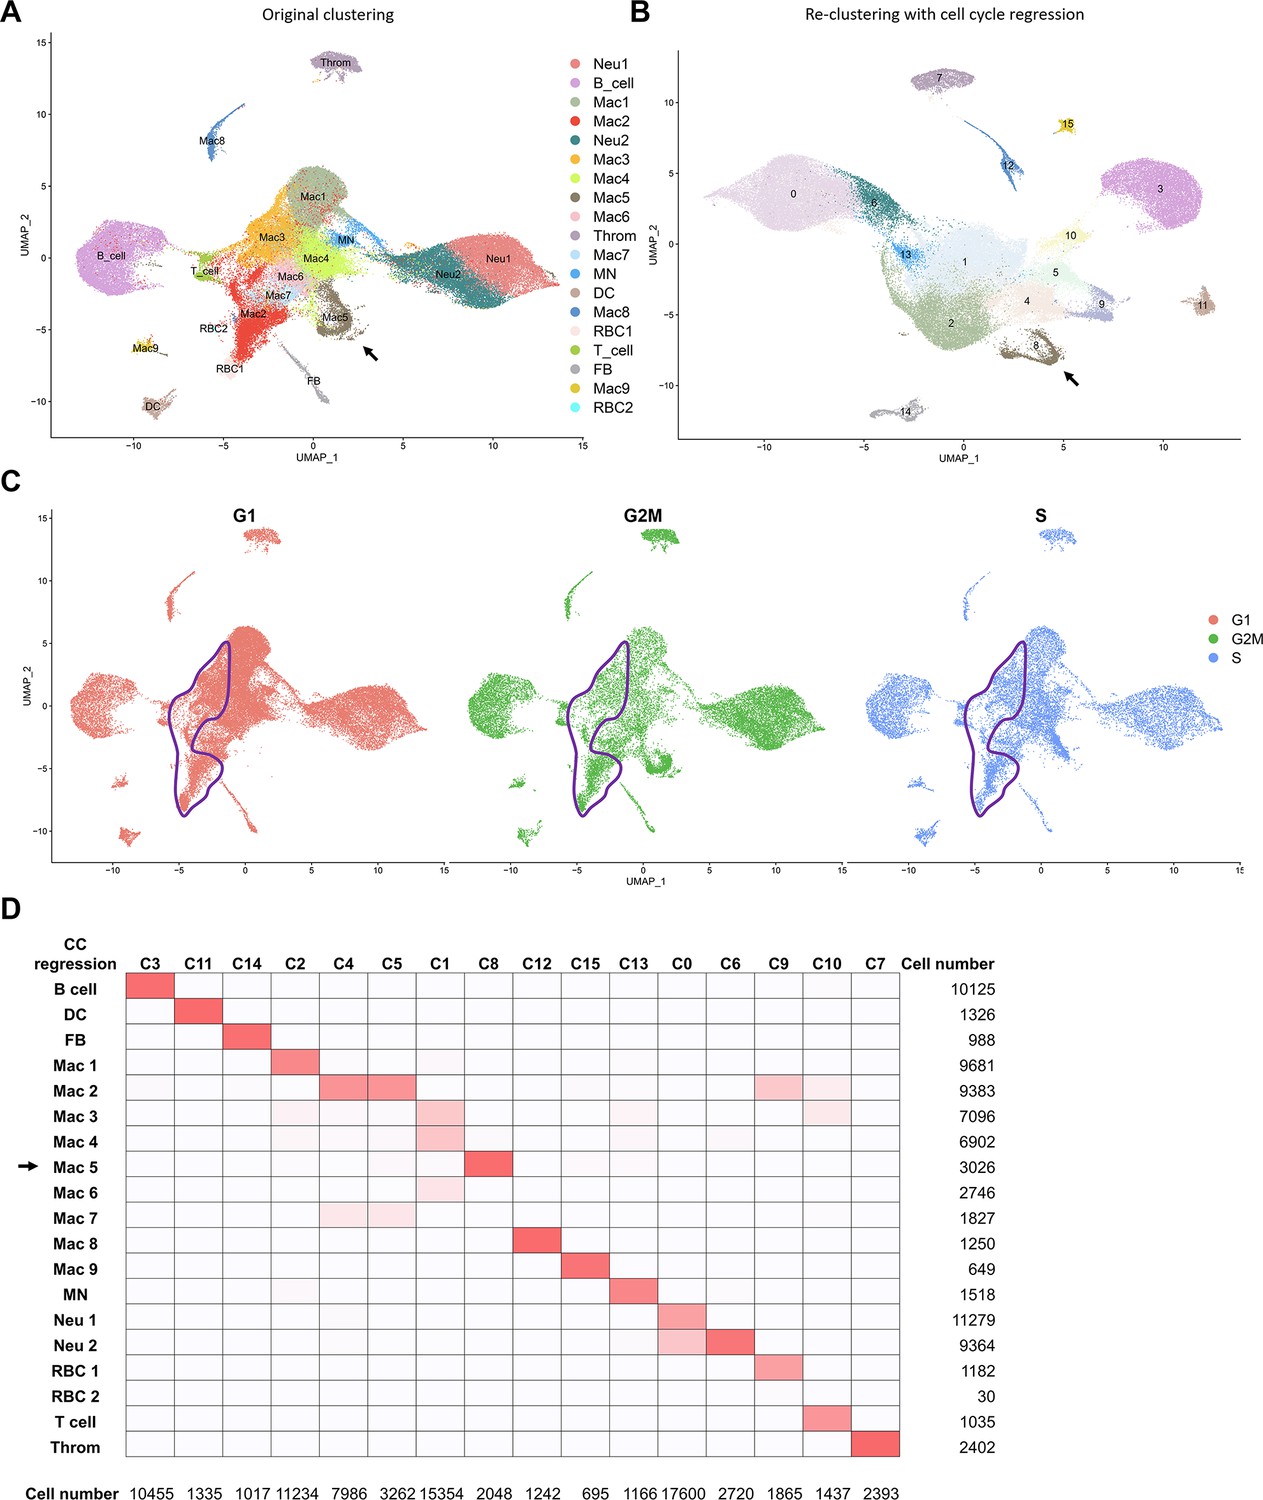
Cell-cycle scoring and regression of cell clusters revealed by scRNAseq.
(A) The original Uniform Manifold Approximation and Projection (UMAP) plots of isolated cells from hearts. Mac 5 is indicated (arrow). (B) The reclustering UMAP plots with cell cycle regression. The cluster 8 (original Mac 5) is indicated (arrow). (C) Cell cycle G1, G2/M, and S phase index are colored in pink, green, and blue, respectively. The major resident macrophages Mac 2 and 3 are delineated by purple lines. (D) Cluster mapping between the original clustering (y-axis) and the re-clustering with cell cycle regression (x-axis). Mac 5 is indicated (arrow).
Figure 3 with 1 supplement
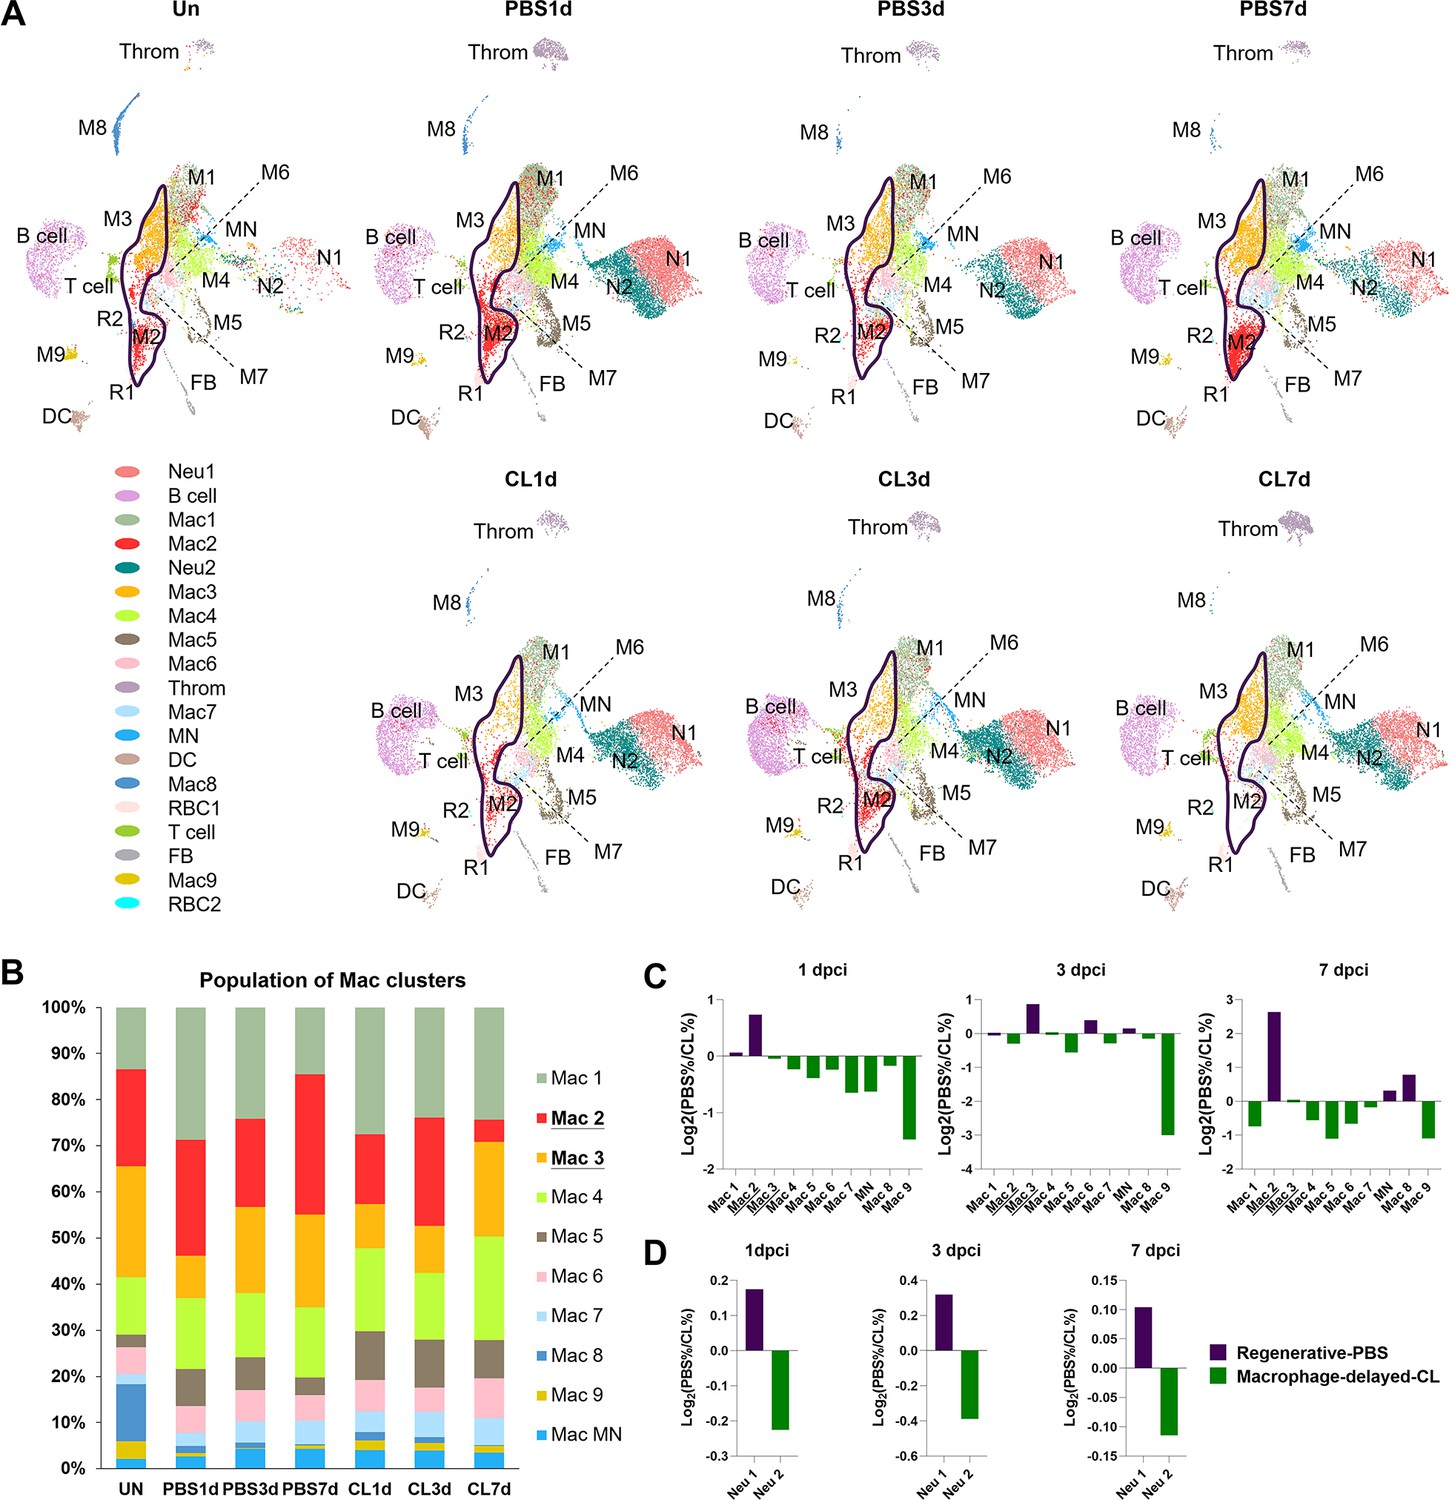
Temporal cell proportion analyses of inflammatory cells identified resident macrophage clusters enriched in regenerative conditions.
Differential proportion analyses of macrophage and neutrophil clusters under regenerative or macrophage-delayed conditions. (A) Split view of Uniform Manifold Approximation and Projection (UMAP) plots of major macrophage (Mac) and neutrophil (Neu) clusters as well as minor inflammatory cell clusters from uninjured (UN) and infarcted hearts under regenerative (PBS) or macrophage-delayed (CL) conditions. Mac 2 and Mac 3 clusters were the major resident macrophages enriched in regenerative conditions (delineated by purple lines), and they either dramatically decreased or barely recovered in non-regenerative conditions. (B) The stacked bar chart shows the percentage of macrophage clusters at each time point and condition. (C, D) Cell proportion analyses identified the regenerative-associated clusters (purple) and macrophage-delayed-associated clusters (green) of macrophages (C) and neutrophils (D). Proportion of each cell clusters under regenerative conditions vs. macrophage-delayed conditions are shown by log2 ratio.
-
Figure 3—source data 1
RNAseq data of injured ventricles of PBS vs. -1d_CL treated zebrafish at 7 and 21 days post cryoinjury.
- https://cdn.elifesciences.org/articles/84679/elife-84679-fig3-data1-v2.xlsx
Figure 3—figure supplement 1
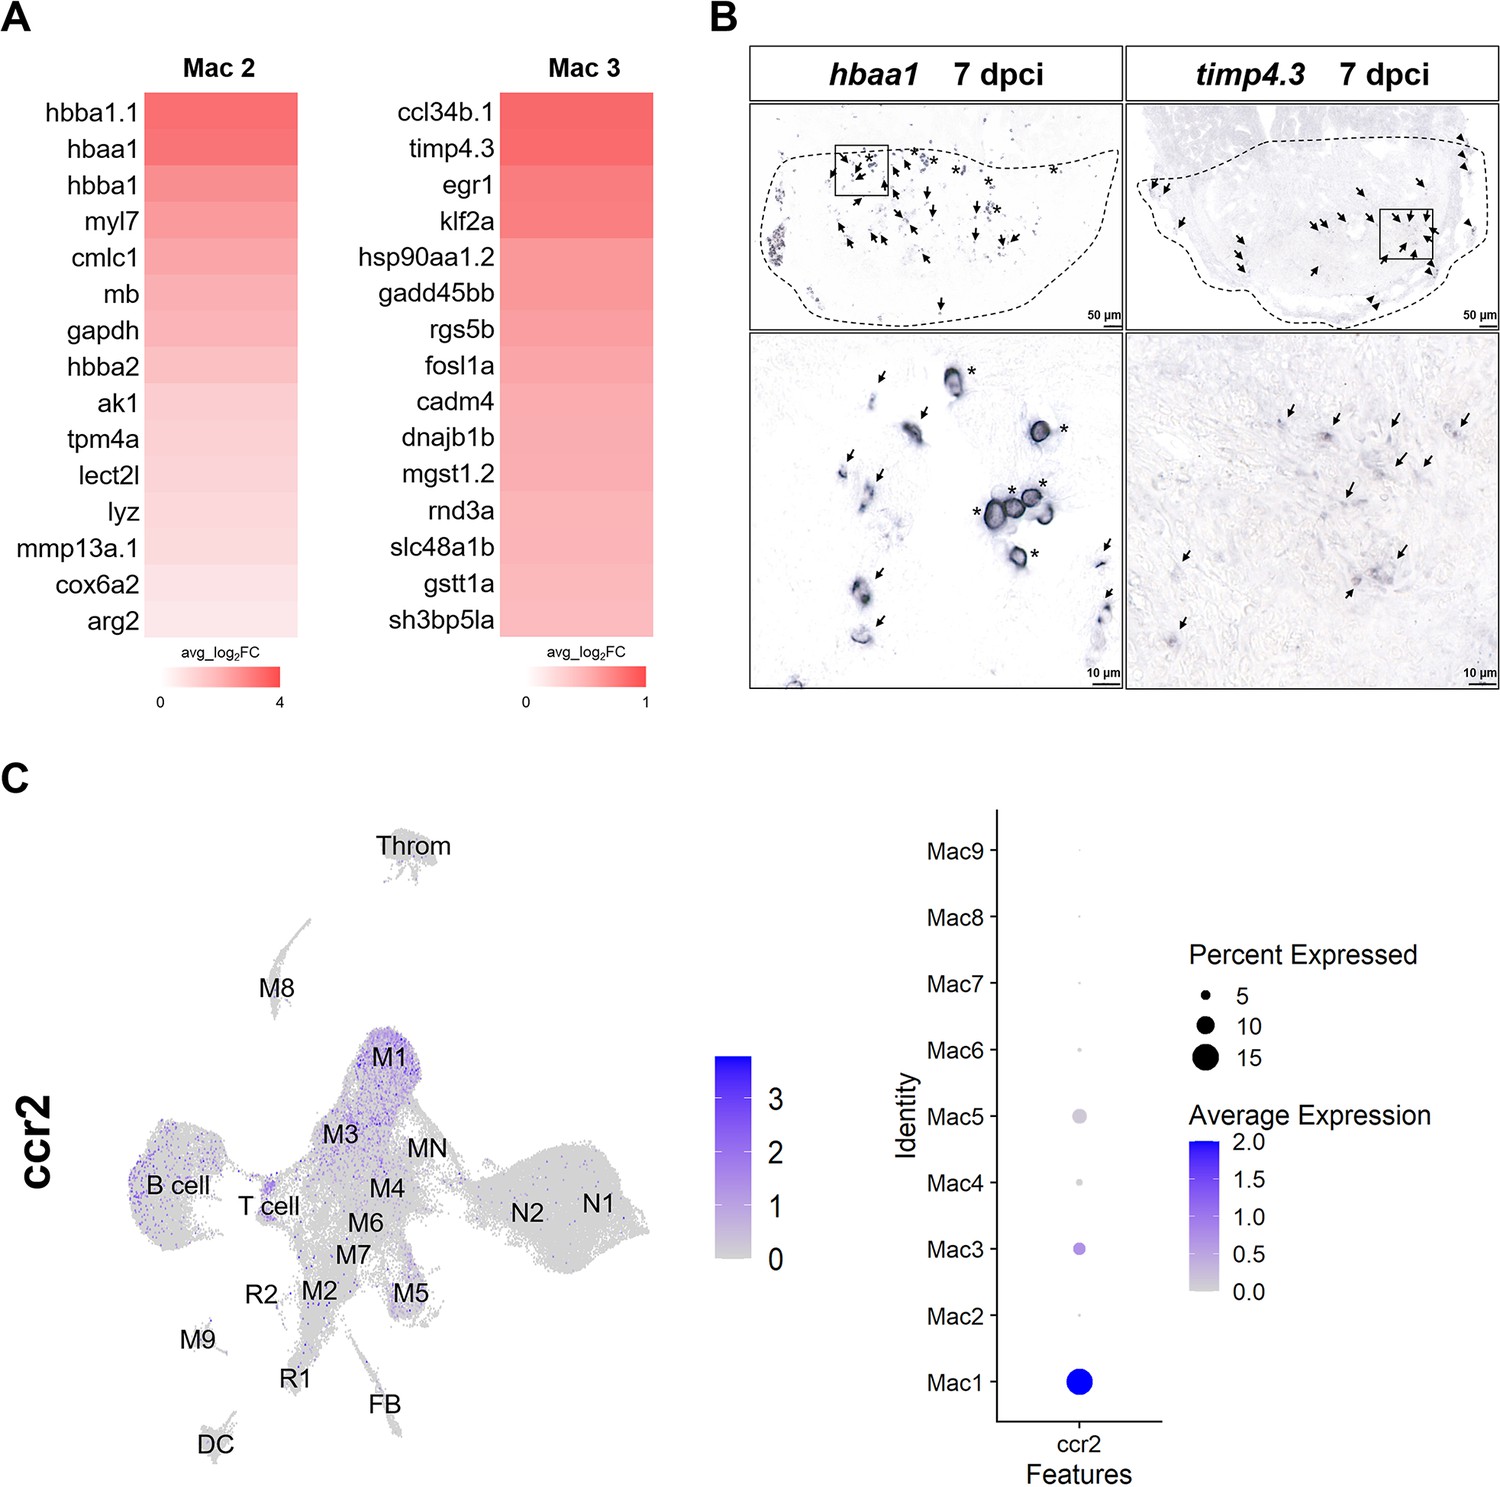
Representative genes expressed in the major resident macrophage clusters Mac 2 and Mac 3 of infarcted heart.
(A) Heatmaps shows the top DEGs enriched in Mac 2 and Mac 3. The color represents the gene expression level in average log2 fold change. (B) Expression of hbaa1 (Mac 2) and timp4.3 (Mac 3) was detected (arrows and arrowheads) by chromogenic in situ hybridization at 7 dpci. hbaa1 was also expressed in RBC (stars in the left lower panel). Dotted lines delineate injury areas (upper panels); scale bars, 50 μm (upper panels) and 10 μm (lower panels). (C) UMAP plot of the monocyte-derived/circulating macrophage marker gene ccr2 (left panel). Dot plot shows the ccr2 expression in different macrophage clusters (right panel). The circle size represents the percentage of macrophages expressing the gene, whereas the color represents the expression level. DEGs, differentially expressed genes; M, macrophage; N, neutrophil; MN, hybrid; Throm, thrombocyte; DC, dendritic cell; FB, fibroblast; R, red blood cell; UMAP, Uniform Manifold Approximation and Projection.
Figure 4 with 1 supplement
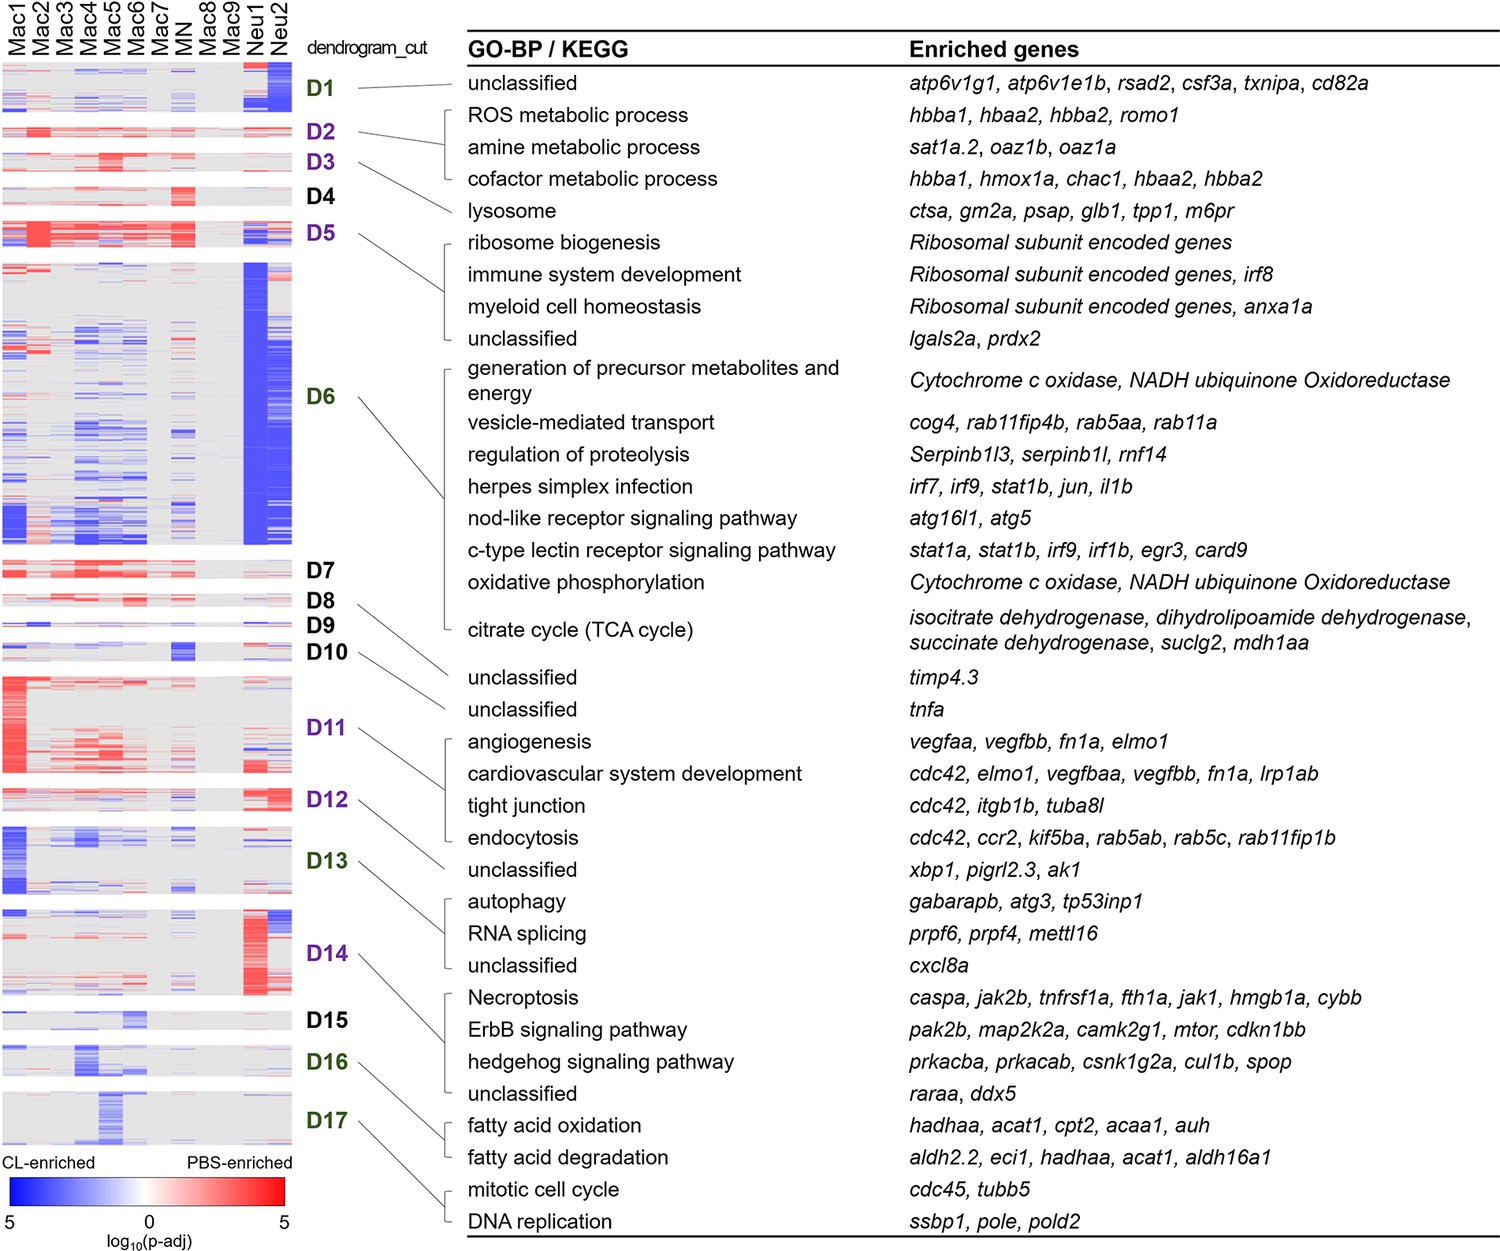
Differential gene expression in respective inflammatory cell clusters toward regenerative vs. macrophage-delayed conditions revealed alternative activation of both macrophages and neutrophils.
Hierarchical clustering of the condition-enriched DEGs between PBS and CL conditions of each macrophage and neutrophil cluster. PBS-enriched and CL-enriched genes are highlighted in red and blue, respectively. D1–D17 represent the dendrogram cut of the hierarchical clustering. BP of GO and KEGG pathways were identified from the DEGs in respective dendrograms. Regenerative and macrophage-delayed associated dendrograms are labeled by purple and green, respectively. DEGs, differentially expressed genes; GO, Gene Ontology; BP, biological process; KEGG, Kyoto Encyclopedia of Genes and Genomes.
-
Figure 4—source data 1
Conditional-enriched genes of each cell cluster from scRNAseq analysis.
- https://cdn.elifesciences.org/articles/84679/elife-84679-fig4-data1-v2.xlsx
Figure 4—figure supplement 1
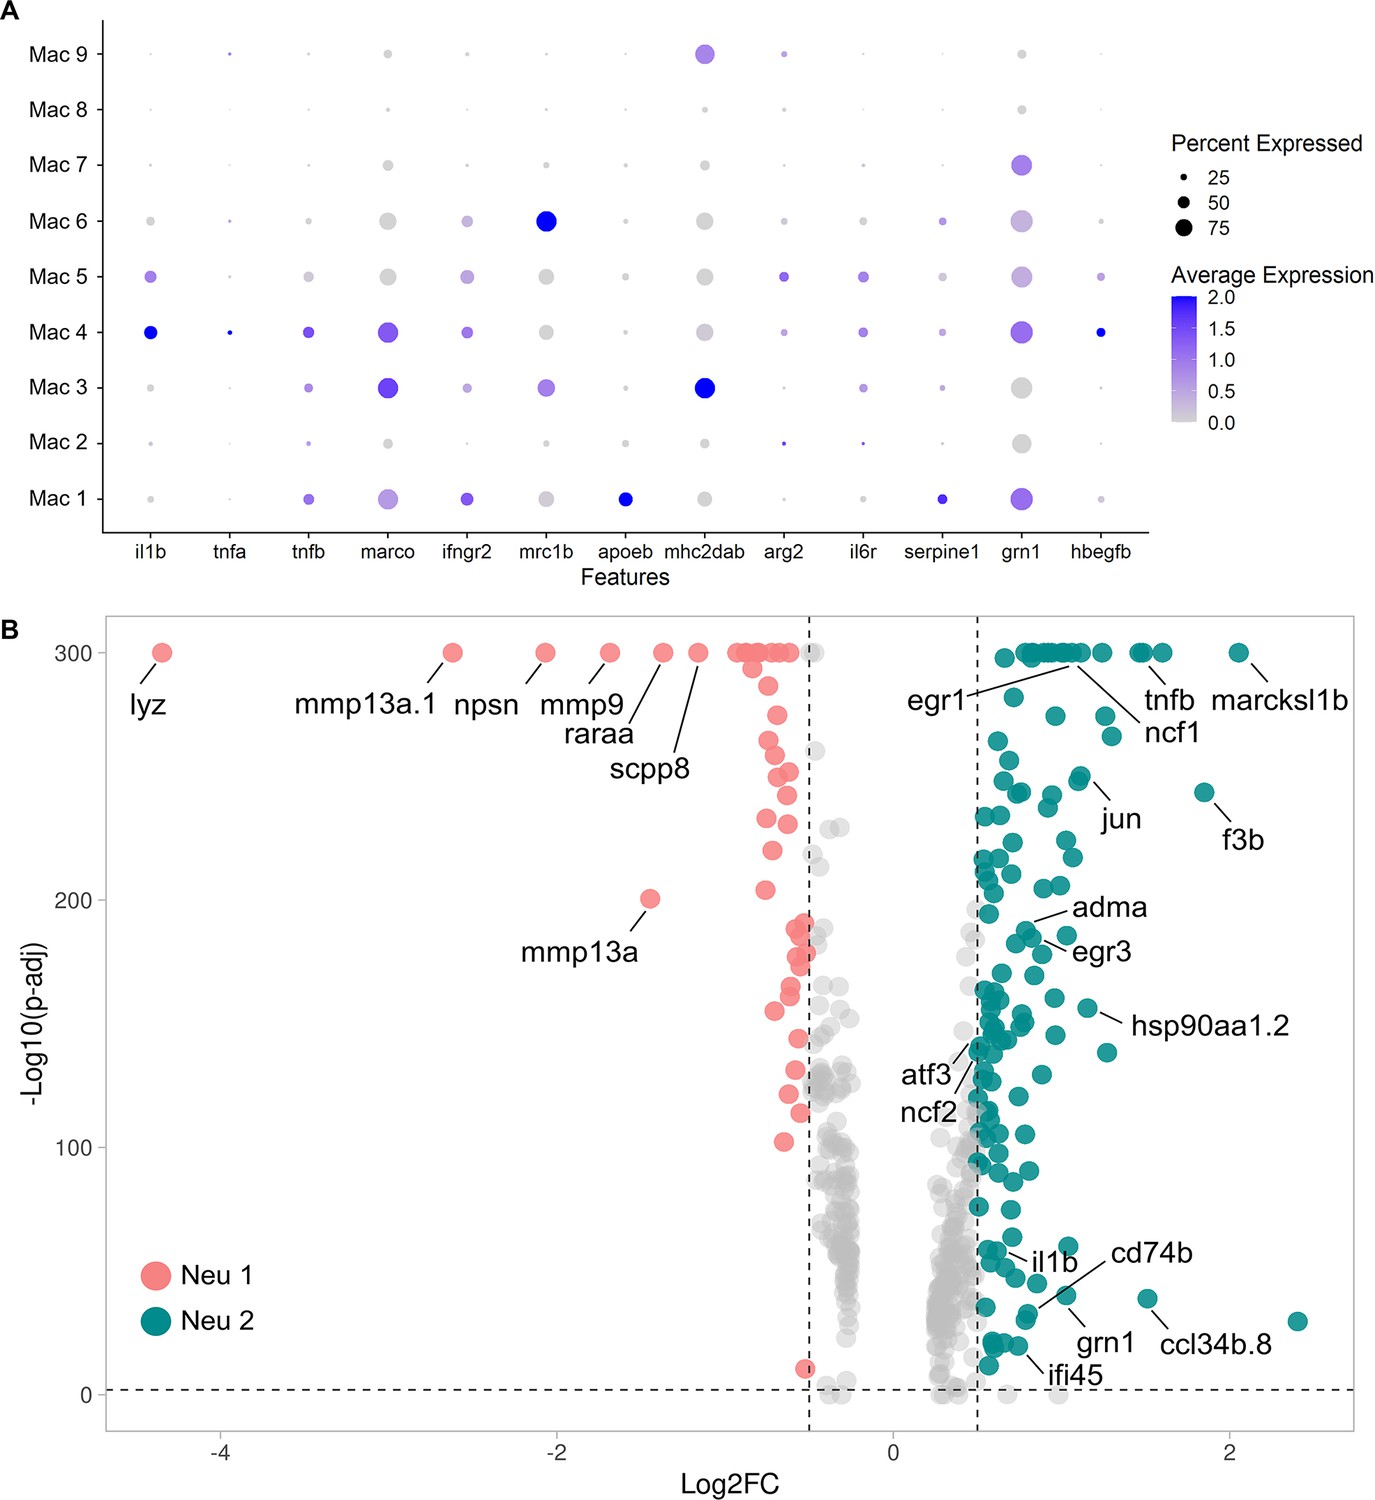
Expression pattern of classical macrophage polarization genes and the alternatively activated genes between Neu 1 and Neu 2.
(A) Dot plot shows the gene expression of common M1 and M2 markers across Mac 1 to Mac 9. The circle size represents the percentage of macrophages expressing the gene, whereas the color represents the expression level. (B) Alternatively, activated genes between Neu 1 and Neu 2 are shown in a Volcano plot.
Figure 5
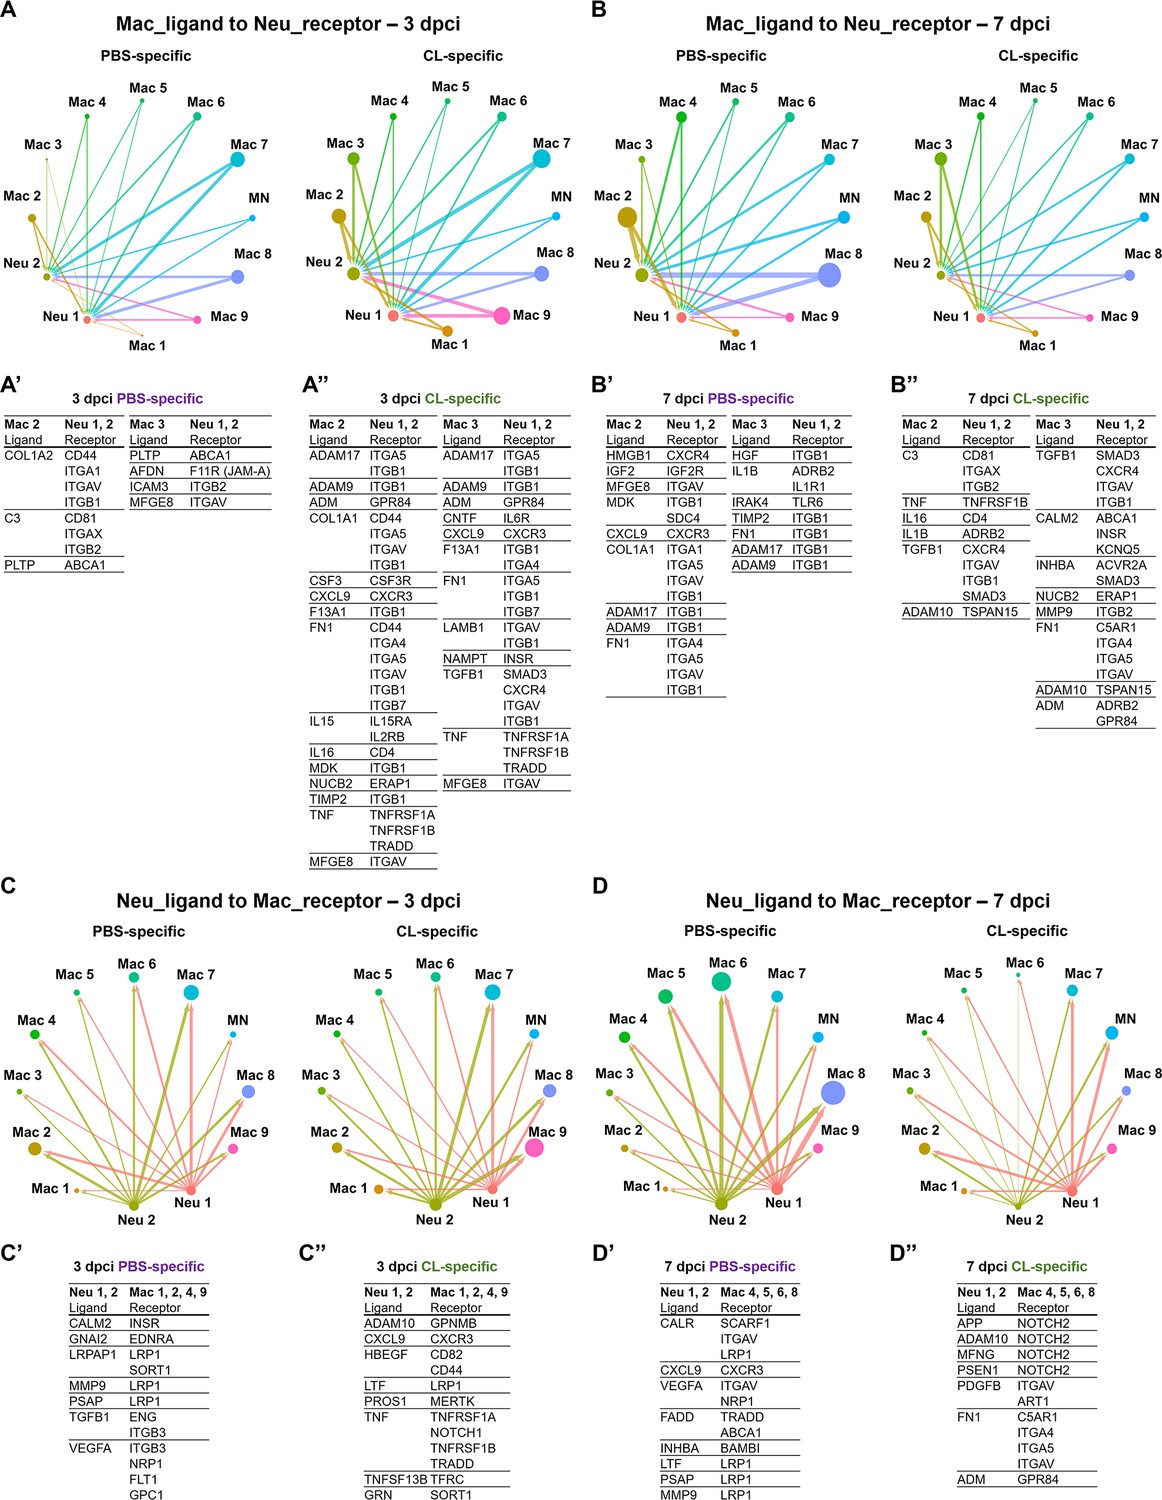
Cell–cell interactions between macrophages and neutrophils are altered in macrophage-delayed conditions.
Crosstalk analyses identify hypothetical cell–cell interactions in macrophage and neutrophil clusters under regenerative (PBS) or macrophage-delayed (CL) conditions. (A, B) Putative interaction maps of macrophage-expressing ligands and neutrophil-expressing receptors among cell clusters at 3 days post cryoinjury (dpci) (A) and 7 dpci (B). Purple and green highlight the ligand–receptor pairs found specifically under PBS- or CL-treated conditions. Direction of arrows indicates the ligands signaling to the receptors in responding clusters. Circle size represents the numbers of ligand/receptor genes. Ligand–receptor pairs of the resident population Mac 2 and 3 to neutrophil clusters at 3 dpci (A’, A’’) and 7 dpci (B’, B’’) are shown. (C, D) Putative interaction maps of neutrophil-expressing ligands and macrophage-expressing receptors between clusters at 3 dpci (C) and 7 dpci (D). Purple and green highlight the ligand–receptor pairs found specifically under PBS- or CL-treated conditions. Direction of arrows indicates the ligands signaling to the receptors in responding clusters. Circle size represents the numbers of ligand/receptor genes. (C’, C’’) Ligand–receptor pairs of Neu 1, 2 to major macrophage responders at 3 dpci. (D’, D’’) Ligand–receptor pairs of Neu 1, 2 to major macrophage responders at 7 dpci.
-
Figure 5—source data 1
Macrophage ligand-to-neutrophil receptor pairs from celluar crosstalk analyses at 3 dpci.
- https://cdn.elifesciences.org/articles/84679/elife-84679-fig5-data1-v2.xlsx
-
Figure 5—source data 2
Macrophage ligand-to-neutrophil receptor pairs from celluar crosstalk analyses at 7 dpci.
- https://cdn.elifesciences.org/articles/84679/elife-84679-fig5-data2-v2.xlsx
-
Figure 5—source data 3
Neutrophil ligand-to-macrophage receptor pairs from celluar crosstalk analyses at 3 dpci.
- https://cdn.elifesciences.org/articles/84679/elife-84679-fig5-data3-v2.xlsx
-
Figure 5—source data 4
Neutrophil ligand-to-macrophage receptor pairs from celluar crosstalk analyses at 7 dpci.
- https://cdn.elifesciences.org/articles/84679/elife-84679-fig5-data4-v2.xlsx
Figure 6
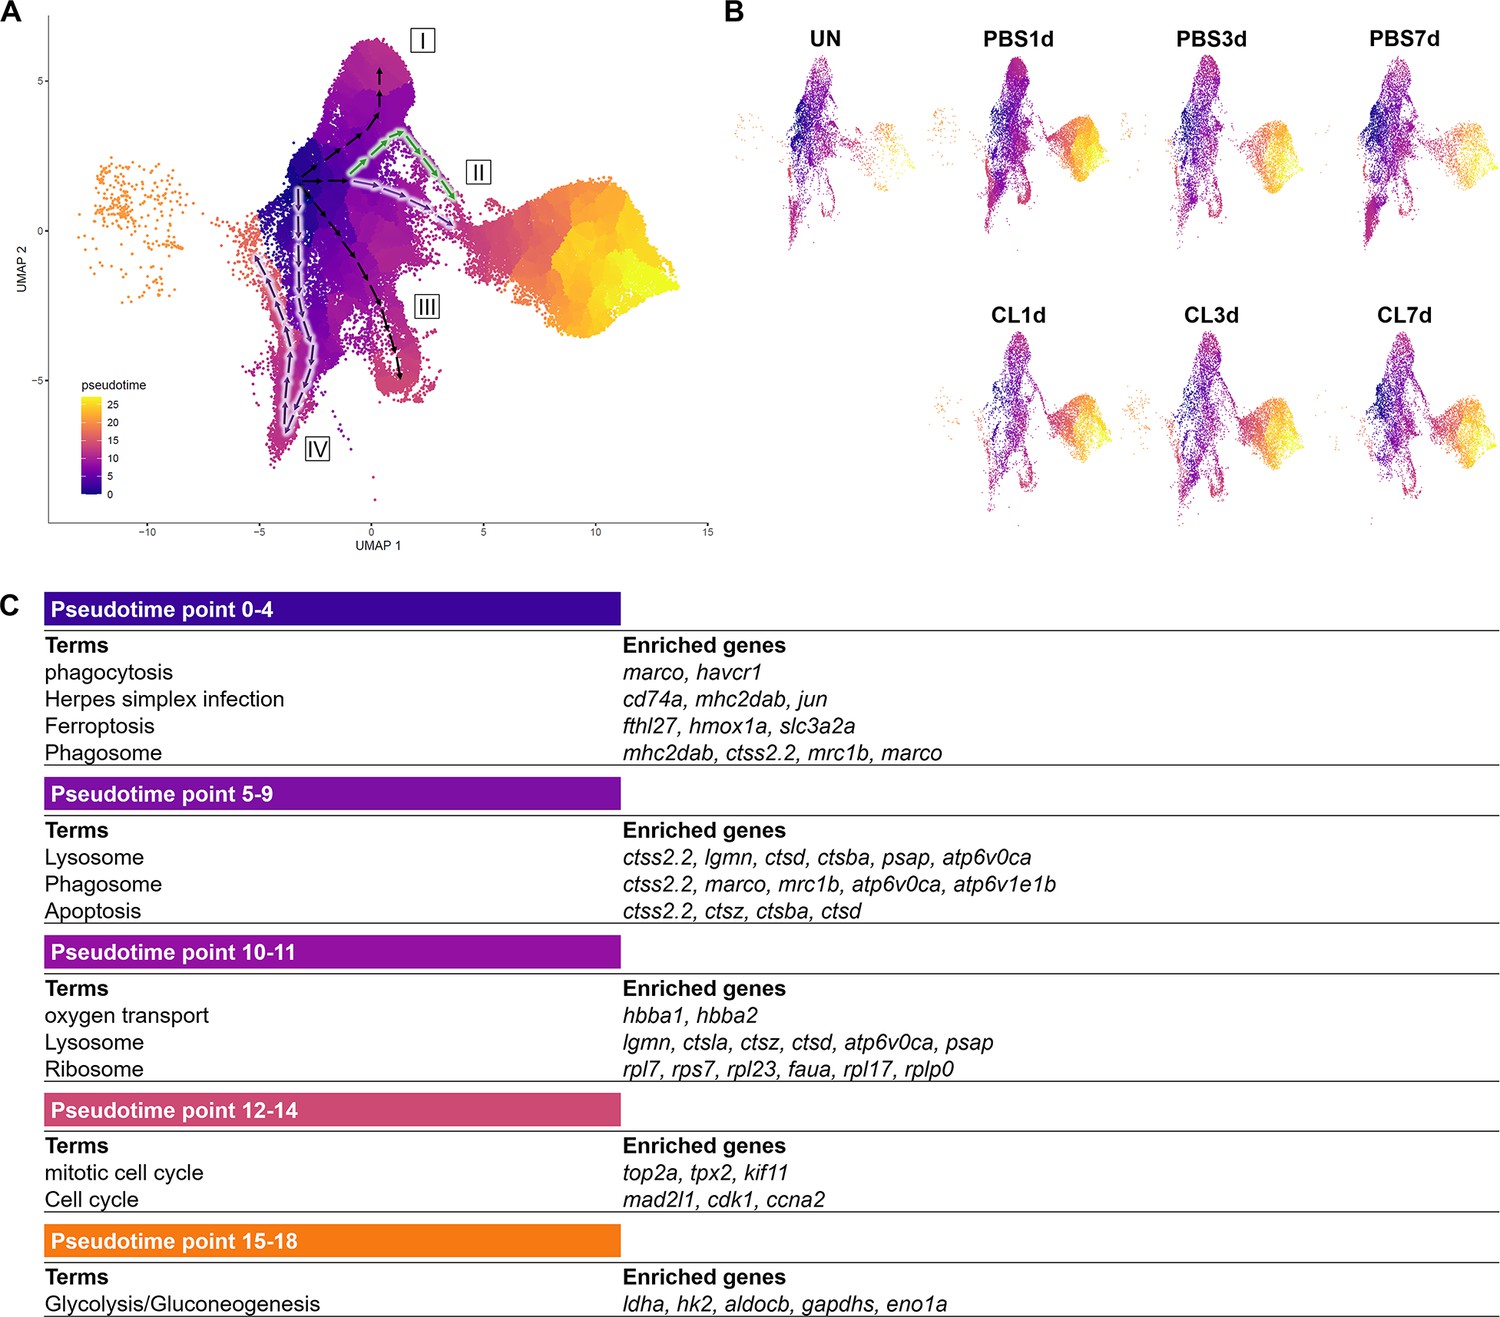
Pseudotemporal trajectory analyses identify distinct progression routes and enriched genes among macrophage and neutrophil subpopulations.
(A) Pseudotemporal trajectory analyses of macrophages and neutrophils in zebrafish heart. Macrophages and neutrophils were subset using Seurat and input in Monocle3. The root of the pseudotime trajectory of macrophages was set based on resident macrophage cluster Mac 3 highly express progenitor genes spi1 and coro1. Cells are colored by dark blue to bright yellow according to the earliest state to the latest state in pseudotime. Arrows indicate the direction of the cell-state transition through the pseudotime. Purple highlights the regenerative-associated direction, whereas green highlights the macrophage-delayed-associated direction. Directions of cell-state transition are indicated by Roman numerals. (B) Pseudotime of macrophages and neutrophils under each time point and condition is shown in the split UMAP plots. (C) GO and KEGG analysis of macrophage DEGs along pseudotime. DEGs, differentially expressed genes; GO, Gene Ontology; BP, biological process; KEGG, Kyoto Encyclopedia of Genes and Genomes; UMAP, Uniform Manifold Approximation and Projection.
-
Figure 6—source data 1
R script of pseudotemporal trajectory analysis.
- https://cdn.elifesciences.org/articles/84679/elife-84679-fig6-data1-v2.xlsx
Figure 7 with 2 supplements
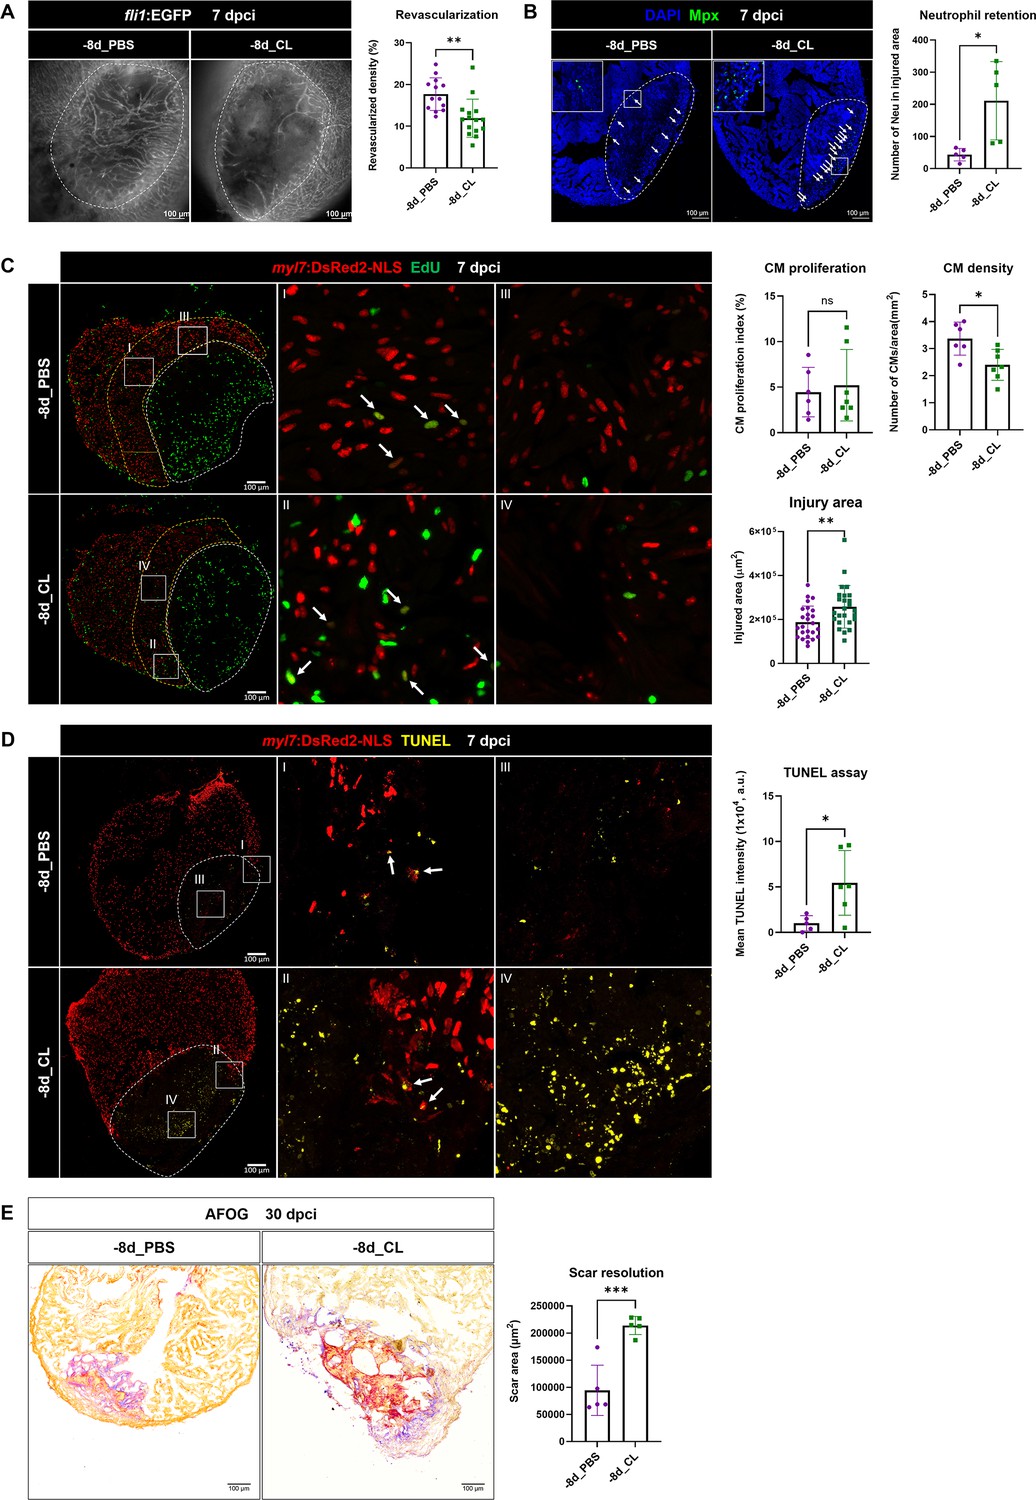
Depletion of resident macrophages compromised heart regeneration.
Functional validation of resident macrophage depletion in cardiac repair. Zebrafish were IP-injected with PBS or CL at 8 d before cardiac injury (–8d_PBS or –8d_CL). (A) Revascularization was evaluated at 7 days post cryoinjury (dpci). Endogenous fli1:EGFP fluorescence depicts the vascular endothelial cells. White dotted lines delineate injury areas; scale bars, 100 μm. Quantification of vessel density by ImageJ is shown in the right panel (n ≥ 13; p=0.0015). (B) Neutrophils in injured areas were examined by Myeloperoxidase (Mpx) immunostaining. White dotted lines delineate injury areas; scale bars, 100 μm. Quantification of neutrophil number in injured areas is listed in the right panel (n = 5; p=0.0359). (C) CM proliferation was assessed by EdU cell proliferation assay at 7 dpci. White dotted lines delineate injury areas; scale bars, 100 μm (left panels). White arrows point out the proliferating CMs (insets I and II). myl7:DsRed-NLS served as the endogenous CM nuclear marker. The shape of CMs became smaller and DsRED fluorescence was weaker in CL-pretreated hearts (–8d_PBS vs. –8d_CL, insets III vs. IV). Quantification of the injured area (n = 25; p=0.0061), along with the CM density (n ≥ 6; p=0.0131) and CM proliferation index (n ≥ 6; p=0.6990) in 200 μm adjacent to the injured area (border zone, delineated by yellow dotted lines) are shown in right panels. (D) TUNEL assay was performed on the same batch of cryosections, which identified the CMs lost in the border zone (insets I and II) at 7 dpci. White arrows point out the TUNEL-positive CMs in the area; scale bars, 100 μm (left panels). More damaged nuclei were found in CL-treated hearts than in PBS controls (inset III and IV). Quantification of TUNEL intensity is listed in the right panel (n ≥ 5; p=0.0269). (E) Scar resolution was evaluated by Acid Fuchsin Orange G (AFOG) staining at 30 dpci. AFOG staining visualized healthy myocardium in orange, fibrin in red, and collagen in blue. Quantification of scar area is shown in the right panel (n = 5; p=0.0006). CL, clodronate liposomes; IP, intraperitoneal; CM, cardiomyocyte. The heart samples under regenerative (–8d_PBS) or resident macrophage-deficient (–8d_CL) conditions are indicated by purple or green, respectively. Student’s t-test was used to assess all comparisons by Prism 9.
-
Figure 7—source data 1
Statistic analyses of neovascularization, neutrophil numbers, CM proliferation and density, scar area of the PBS vs. -8d_CL-treated hearts.
- https://cdn.elifesciences.org/articles/84679/elife-84679-fig7-data1-v2.xlsx
-
Figure 7—source data 2
Statistic analyses of timp4.3 and hbaa expression by qPCR.
- https://cdn.elifesciences.org/articles/84679/elife-84679-fig7-data2-v2.xlsx
-
Figure 7—source data 3
Statistic analyses of neovascularization, neutrophil numbers, CM proliferation and density, scar area of the PBS vs. -1m_CL-treated hearts.
- https://cdn.elifesciences.org/articles/84679/elife-84679-fig7-data3-v2.xlsx
-
Figure 7—source data 4
timp4.3+ resident macrophage depletion in CL vs. PBS control hearts at 8 days after IP injection.
- https://cdn.elifesciences.org/articles/84679/elife-84679-fig7-data4-v2.docx
Figure 7—figure supplement 1
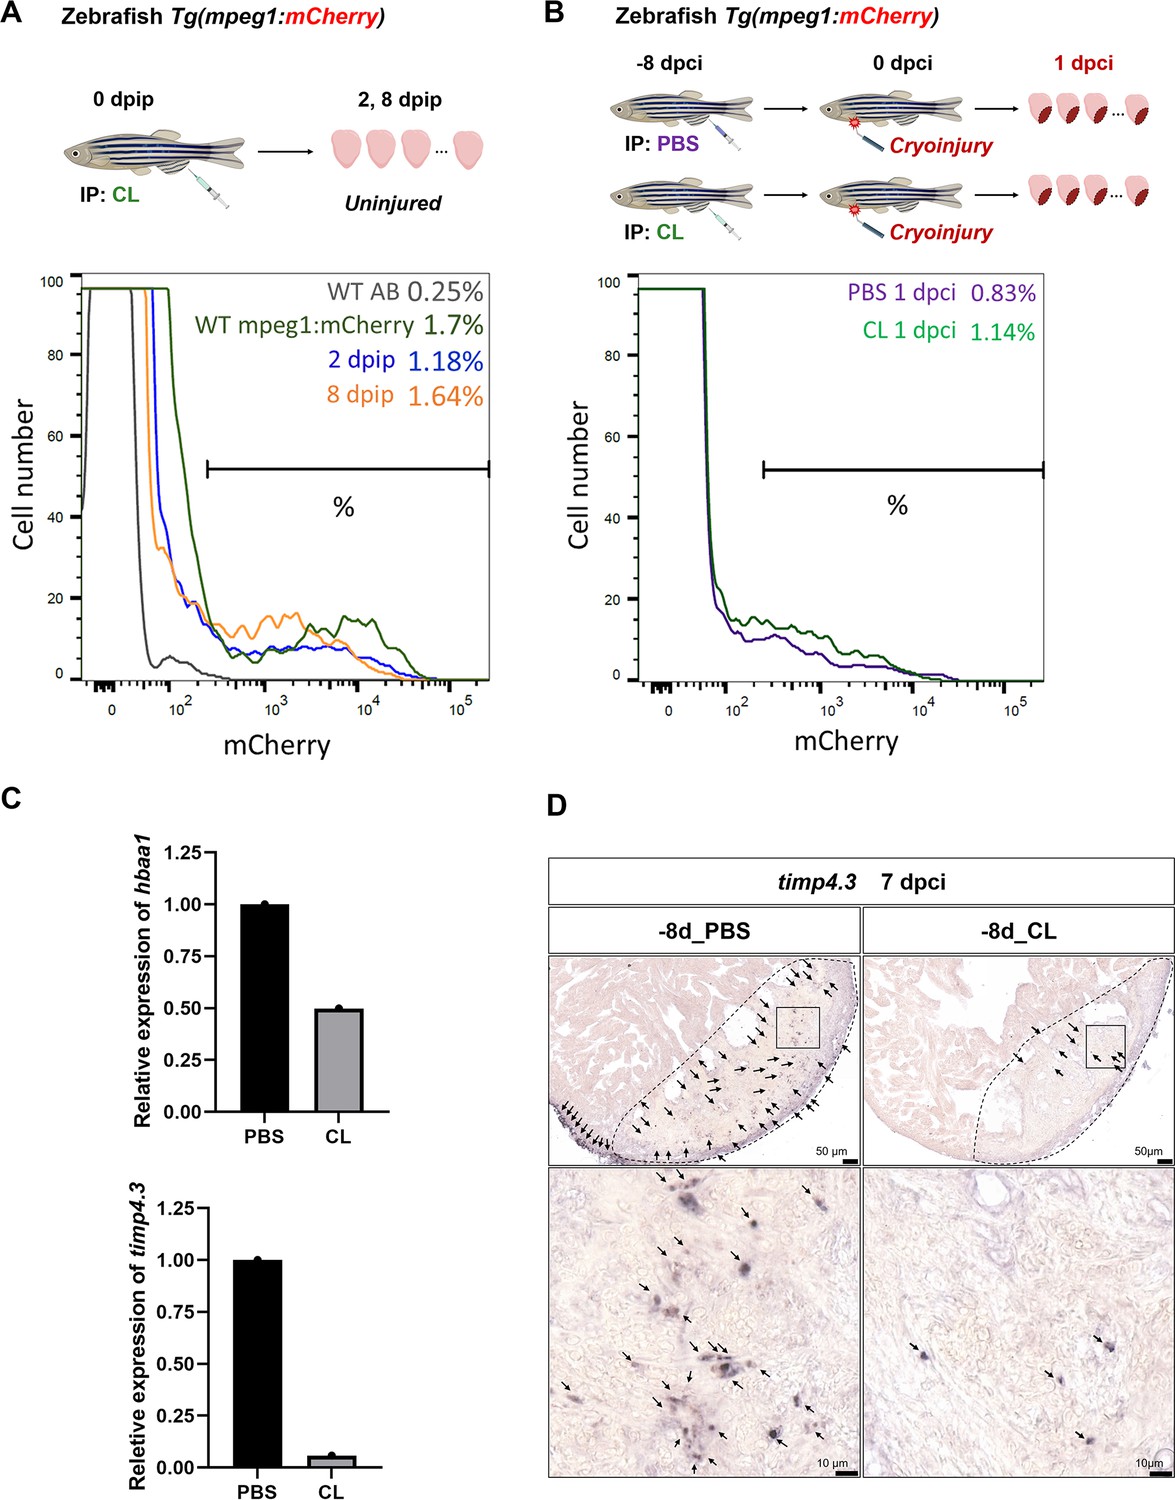
Specific resident macrophage clusters Mac 2 and 3 were non-recoverable after CL-mediated depletion.
(A) Resident macrophage depletion and replenishment. Macrophages resided in the adult Tg(mpeg1:mCherry) fish hearts were examined by flow cytometry at 2- and 8 d post IP injection of PBS or CL (dpip). (B) Tg(mpeg1:mCherry) fish were IP injected with PBS or CL 8 d prior to cryoinjury. Cardiac macrophages (mCherry+) were examined by flow cytometry at 1 dpci. (C) Expression of Mac 2-enriched gene hbaa1 and Mac 3-enriched gene timp4.3 in macrophages isolated from PBS- and CL-treated hearts at 8 dpip (without cryoinjury). The expression was examined by qPCR using eef1a1l1 as the internal control. (D) Expression of timp4.3 was observed in zebrafish hearts (PBS or CL injection at 8 d before cardiac injury, –8d_PBS or –8d_CL; arrows) by chromogenic in situ hybridization at 7 dpci. Dotted lines delineated injury areas (upper panels); scale bars, 50 μm (upper panels) and 10 μm (lower panels). 45–60 ventricles were pooled for sorting of macrophages in FACS, which were subjected to RNA isolation and qPCR. CL, clodronate liposomes; IP, intraperitoneal; dpip, day post intraperitoneal; dpci, day post cryoinjury; DEGs, differentially expressed genes.
Figure 7—figure supplement 2
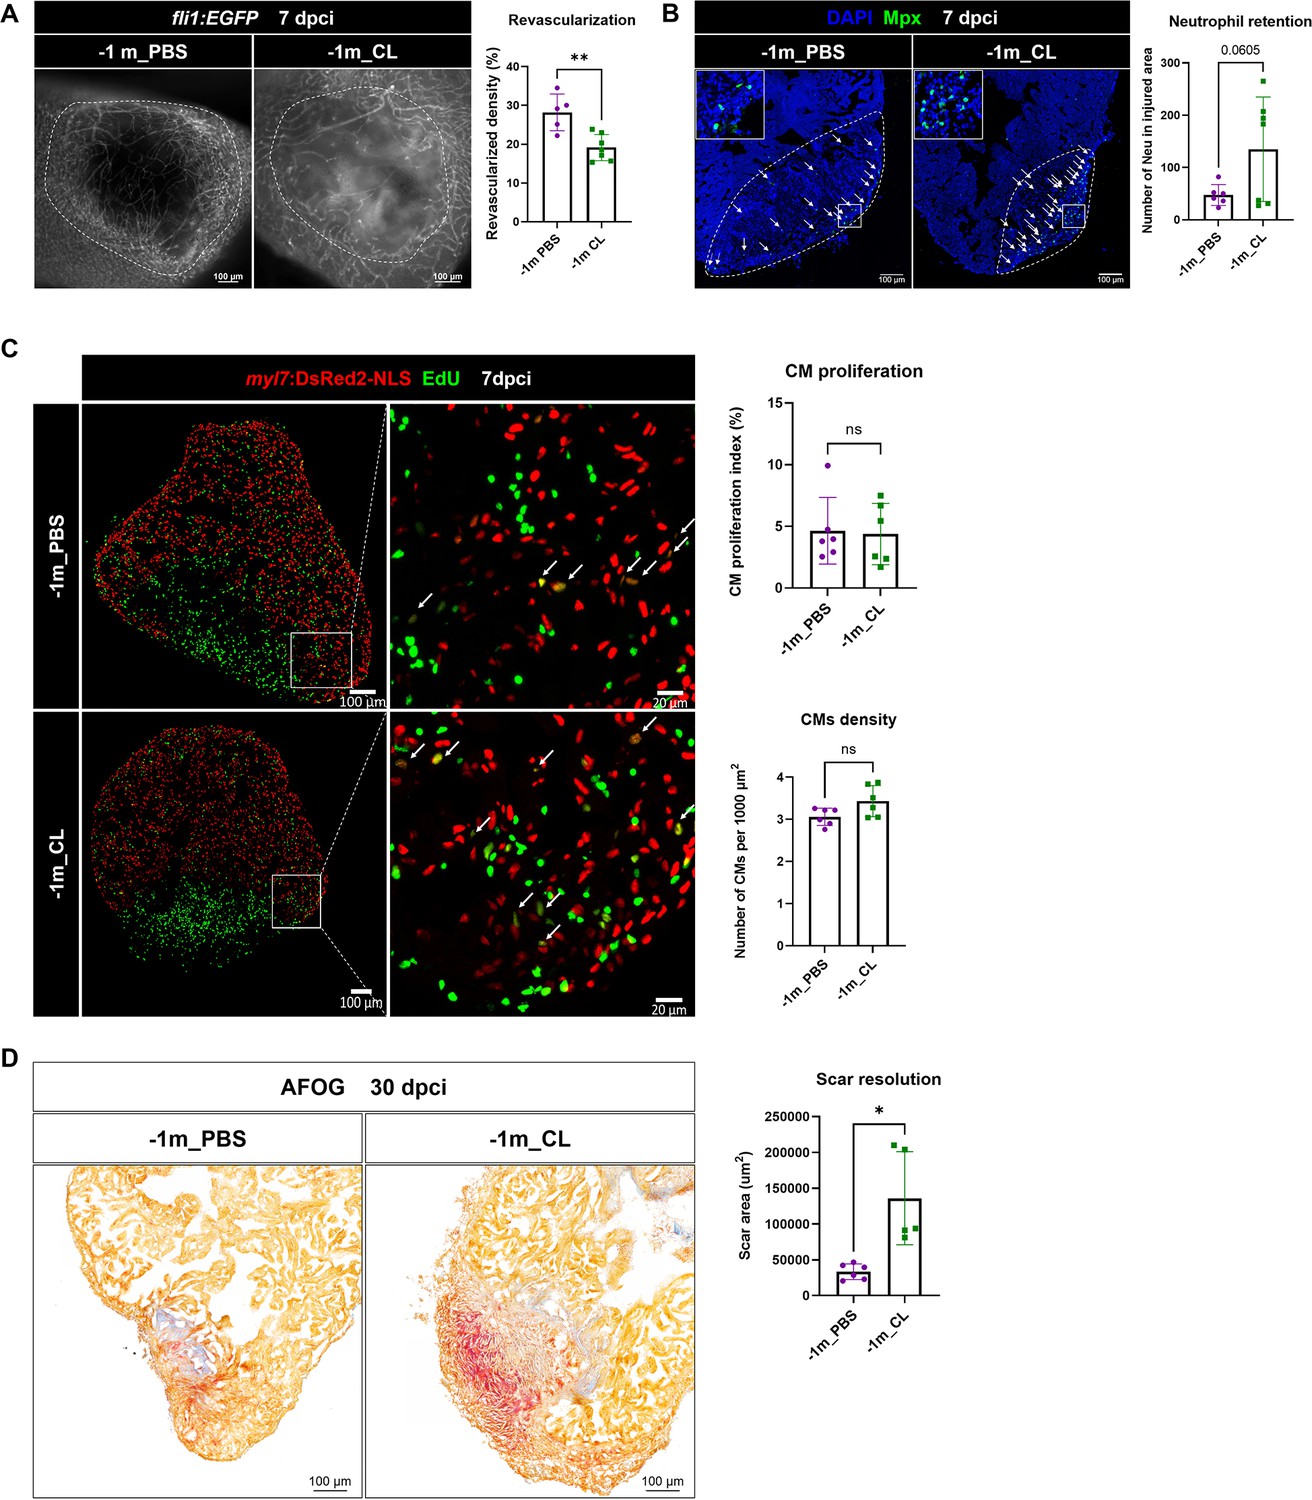
Depletion of resident macrophages led to long-term incompetence of heart regeneration.
Long-term effect of resident macrophage depletion by injecting CL at 1 mo (–1 m_CL) prior cardiac injury. (A) Revascularization was evaluated at 7 days post cryoinjury (dpci). Endogenous fli1:EGFP fluorescence depicts the vascular endothelial cells. White dotted lines delineate injury areas; scale bars, 100 μm. Quantification of vessel density by ImageJ is shown in the right panel (n ≥ 5; p=0.0082). (B) Neutrophils in injured areas at 7 dpci were examined by Myeloperoxidase (Mpx) immunostaining. White dotted lines delineate injury areas; scale bars, 100 μm. Quantification of neutrophil number in injured areas is listed in the right panel (n ≥ 6; p=0.0605). (C) CM proliferation was evaluated by EdU cell proliferation assay at 7 dpci. White arrows point out the proliferating CMs; scale bars, 100 μm (left panels) and 20 μm (middle panels). Quantification of CM density (n = 6; p=0.0562) and CM proliferation index (n = 6; p=0.8609) in 200 μm adjacent to the injured area is shown in the right panels. (D) Scar resolution was evaluated by AFOG staining at 30 dpci. Healthy myocardium, fibrin, and collagen are visualized in orange, red, and blue, respectively. Quantification of scar area is shown in the right panel (n ≥ 5; p=0.0232). CL, clodronate liposomes; IP, intraperitoneal; CM, cardiomyocyte; AFOG, Acid Fuchsin Orange G. The heart samples under regenerative (–1 m_PBS) or resident macrophage-deficient (–1 m_CL) conditions are indicated by purple or green, respectively. Student’s t-test was used to assess all comparisons by Prism 9.
Figure 8
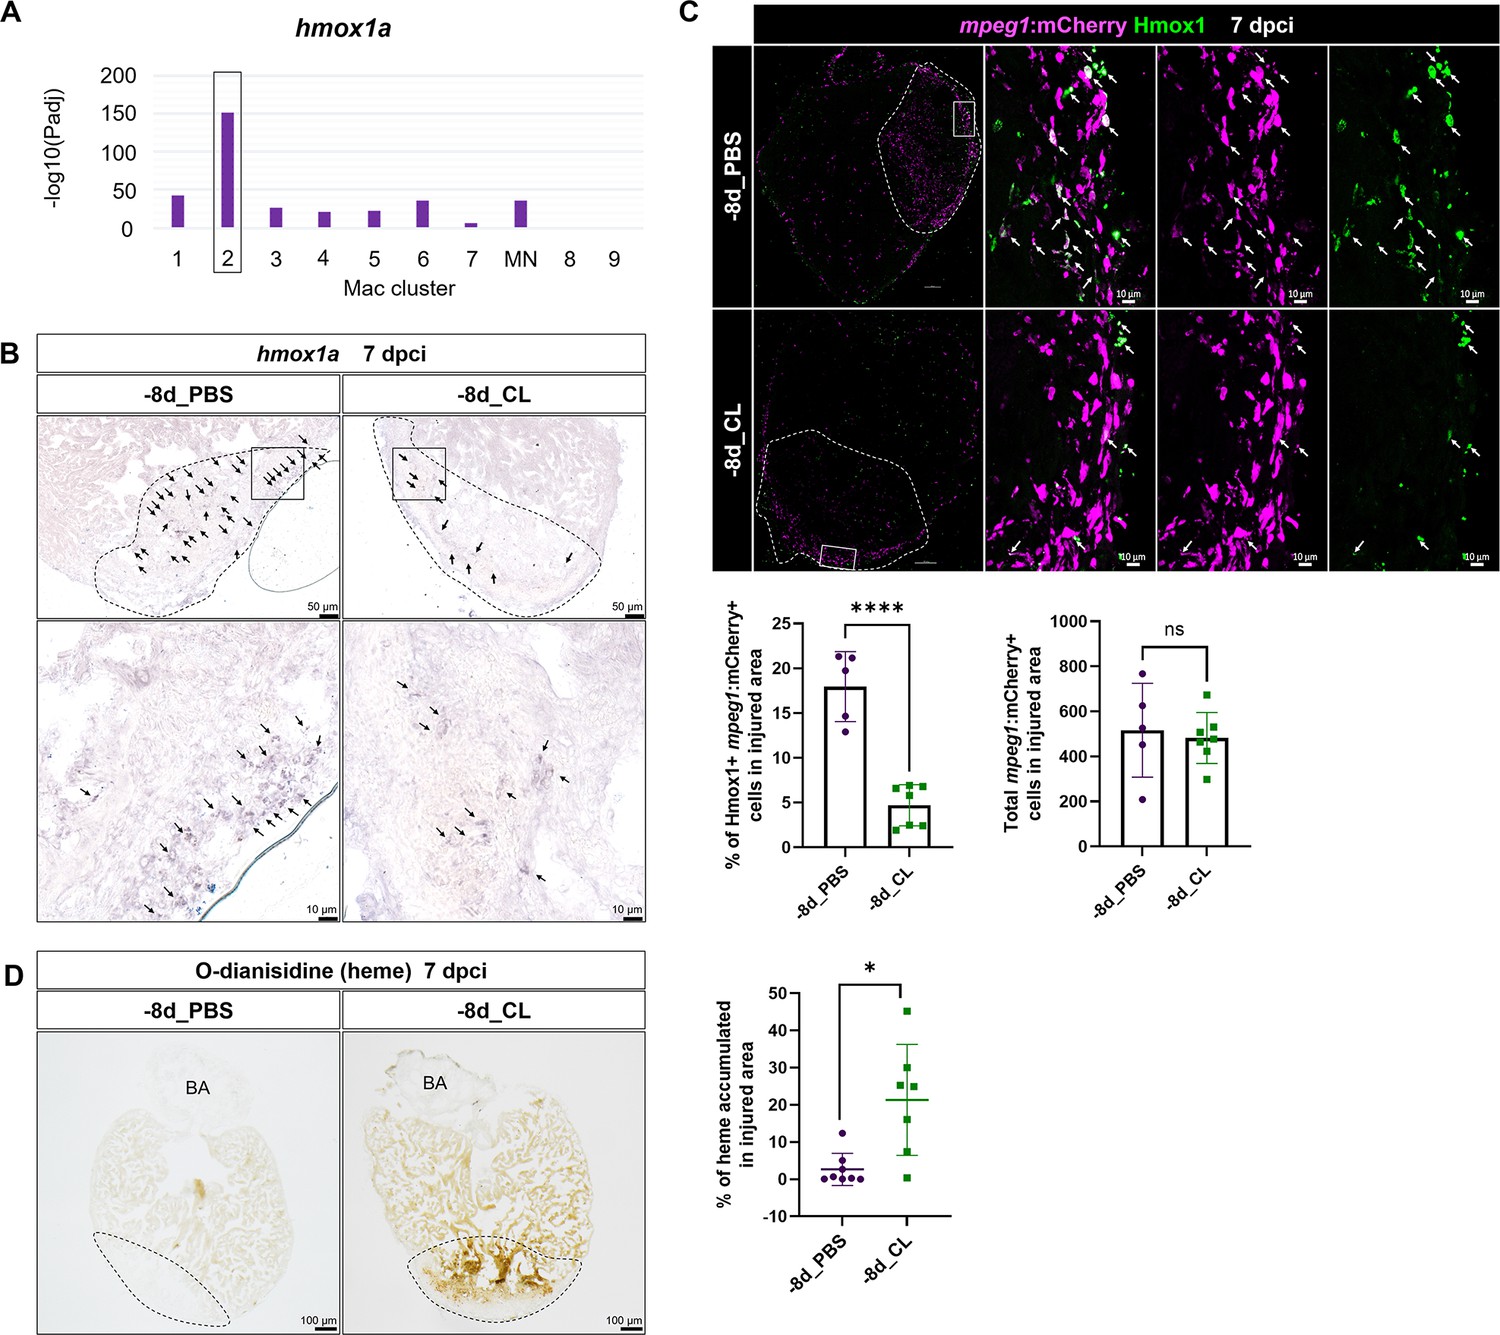
Resident macrophages Mac 2 express hmox1a for heme clearance during cardiac repair.
Reduced hmox1a-expressing macrophages were associated with heme accumulation under resident macrophage-deficient condition. (A) The bar plot indicates the hmox1a enrichments (–log10 adjusted p-value) across macrophage clusters. (B) Expression of hmox1a was detected by in situ hybridization in the regenerative (–8d_PBS) and macrophage-deficient (–8d_CL) hearts at 7 days post cryoinjury (dpci). The dotted lines delineate injury areas; scale bars, 50 μm (upper panels) and 10 μm (lower panels). (C) Hmox1-expressing macrophages (arrows) were examined by immunostaining in the regenerative hearts (–8d_PBS) or resident macrophage-deficient hearts (–8d_CL) at 7 dpci. Quantification of the percentage of Hmox1+/mpeg1:mCherry+ macrophages and the number of total mpeg1:mCherry+ macrophages in injured area are shown in lower panels (left, Hmox1+/mpeg1:mCherry+ macrophages, n ≥ 5; p<0.0001; right, total mpeg1:mCherry+ macrophages, n ≥ 5; p=0.72). White dotted lines delineate injury areas; scale bars, 100 μm (left panels) and 10 μm (right panels). (D) O-dianisidine staining of regenerative hearts (–8d_PBS) and resident macrophage-deficient hearts (–8d_CL) at 7 dpci. The dotted lines delineate injury areas; scale bars, 100 μm. Quantification of staining density by ImageJ is shown in the right panel (n ≥ 7; p=0.0155). The heart samples under regenerative (–8d_PBS) or resident macrophage-deficient (–8d_CL) conditions are indicated by purple or green, respectively. Student’s t-test was used to assess all the comparisons by Prism 9.
-
Figure 8—source data 1
Statistic analyses of Hmox1a+/mpeg1:mCherry+ macrophages and o-dianosidine positive area in -8d-CL vs. PBS control hearts.
- https://cdn.elifesciences.org/articles/84679/elife-84679-fig8-data1-v2.xlsx
Author response image 1
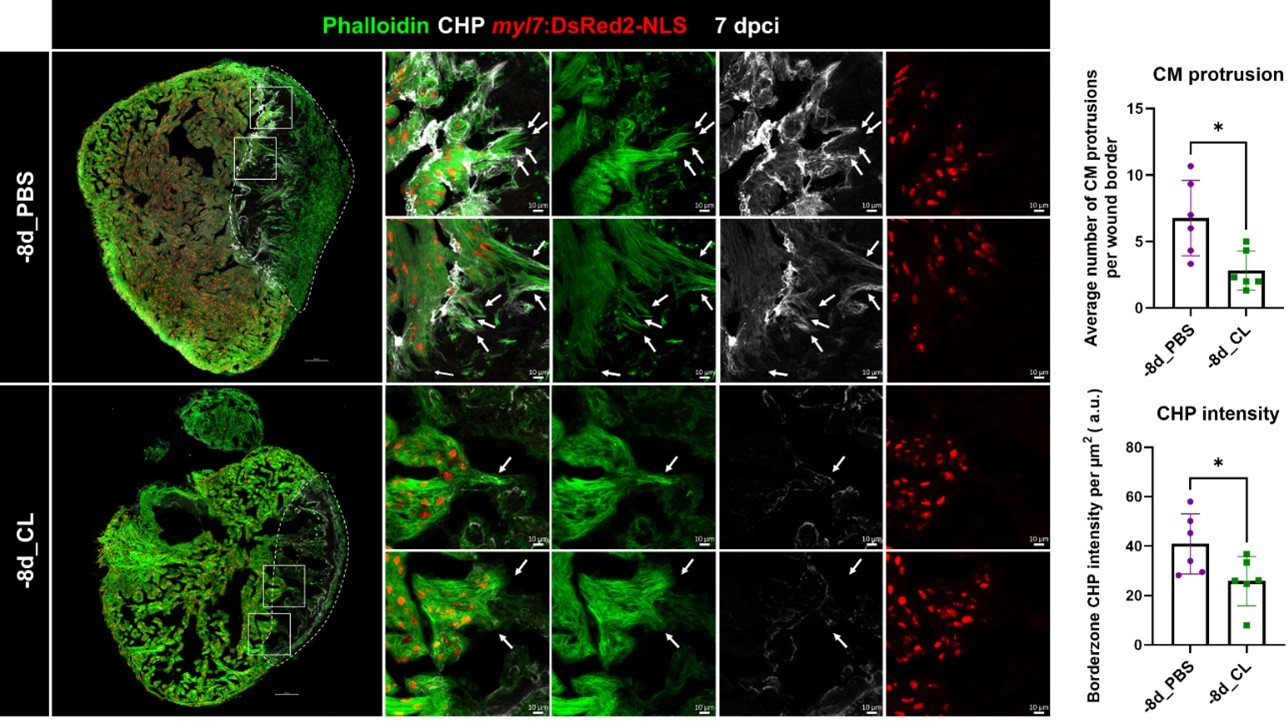
Collagen degradation and CM protrusion were compromised in resident macrophage-deficient hearts.
Denatured collagen and CM protrusions in the injury area were examined at 7 dpci under regenerative (-8d_PBS) or resident macrophage deficient condition (-8d_CL). The denatured collagen was labeled by collagen hybridizing peptide (CHP) staining. CMs were specified by myl7:DsRed2-NLS, while their cellular protrusions were labeled by phalloidin (arrows). White dotted lines delineated injury areas; scale bars, 100 μm (left panels) and 10 μm (right panels). CM, cardiomyocyte; CHP, Collagen Hybridizing Peptide. Quantification of CM protrusion (p=0.0128) and border zone CHP density (p=0.0411) was shown in the right panels. The heart samples under regenerative (-8d_PBS) or resident macrophage-deficient (-8d_CL) conditions are indicated by purple or green, respectively. The student’s t-test was used to assess all comparisons by Prism 9.
Author response image 2
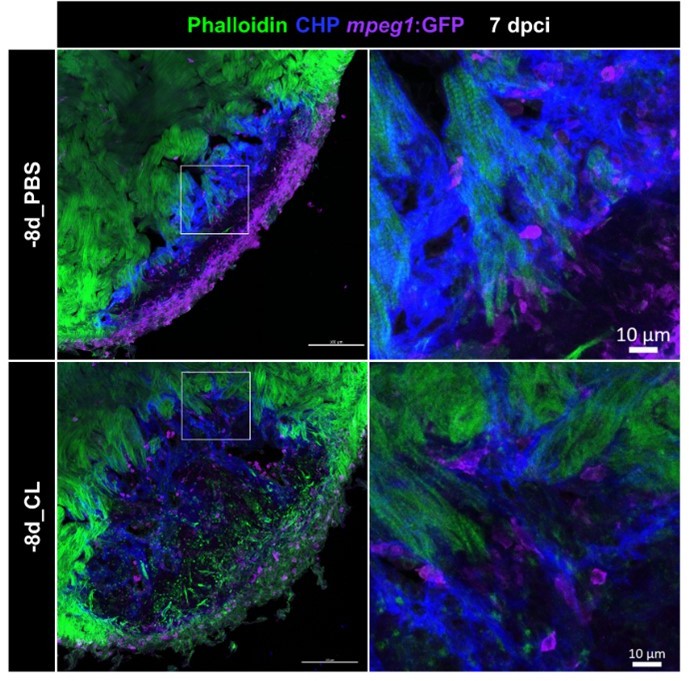
Resident macrophage-deficient hearts showed altered macrophage distribution and CM protrusion defects.
Immunostaining of phalloidin, CHP and GFP for thick sections from 7-dpci hearts of Tg(mpeg1:GFP) under regenerative (-8d_PBS) or resident macrophage-deficient condition (-8d_CL). CM protrusion was depicted by phalloidin, colored in green, the degrading collagens were observed by CHP staining, colored in blue, and macrophages were colored in magenta; scale bars: 100 μm. The insets highlight the macrophage distribution with degraded collagen surrounding CM protrusion; scale bars: 10 μm. CM, cardiomyocyte; CHP, Collagen Hybridizing Peptide. The thickness of the sections: 20 μm.
Author response image 3
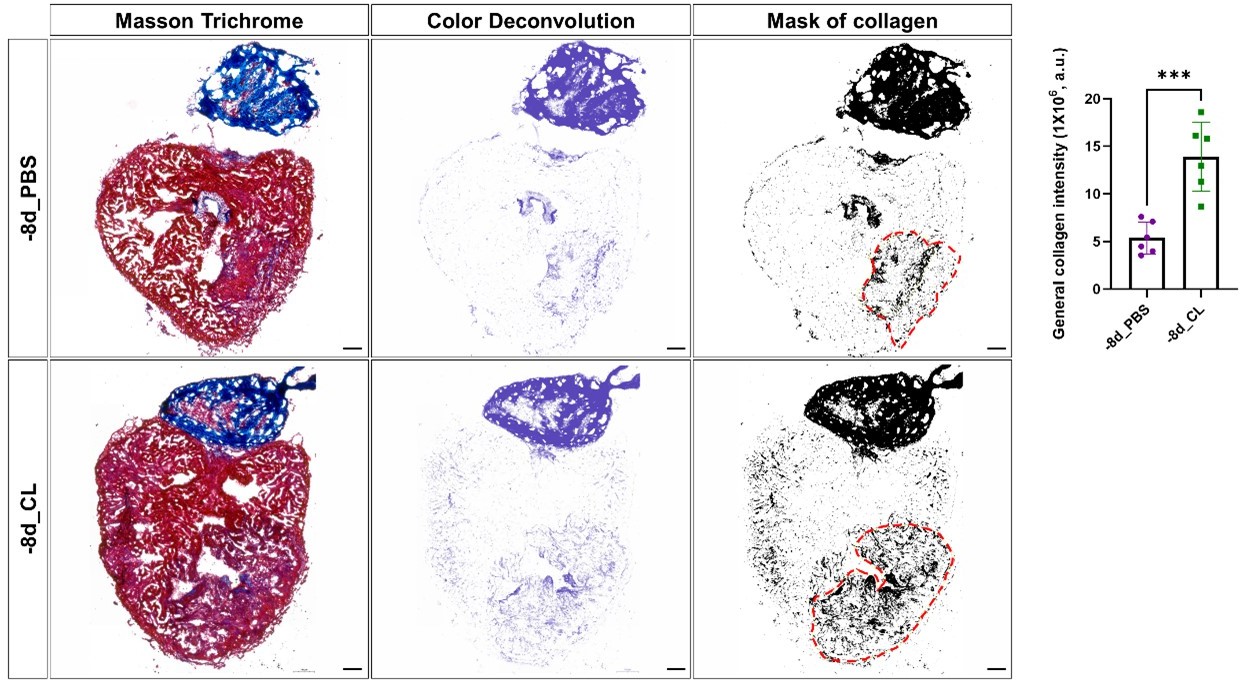
Comparison of total collagen deposition between regenerative hearts and resident-macrophage deficient hearts.
Quantification of total collagen of Masson Trichrome stain by ImageJ. Masson Trichrome was performed on the same slides of each heart after the CHP staining. The collagen stain was visualized by color deconvolution provided in ImageJ and was shown alongside the original image. Mask of collagen was obtained by setting a threshold in ImageJ and the collagen intensity in the injured area was calculated. The dotted lines delineated injury areas; scale bars: 100 μm. Quantification was shown in the right panel (p=0.0004). The heart samples under regenerative (-8d_PBS) or resident macrophage-deficient (-8d_CL) conditions are indicated by purple or green, respectively. The student’s t-test was used to assess the comparison by Prism 9. CHP, Collagen Hybridizing Peptide.
Author response image 4
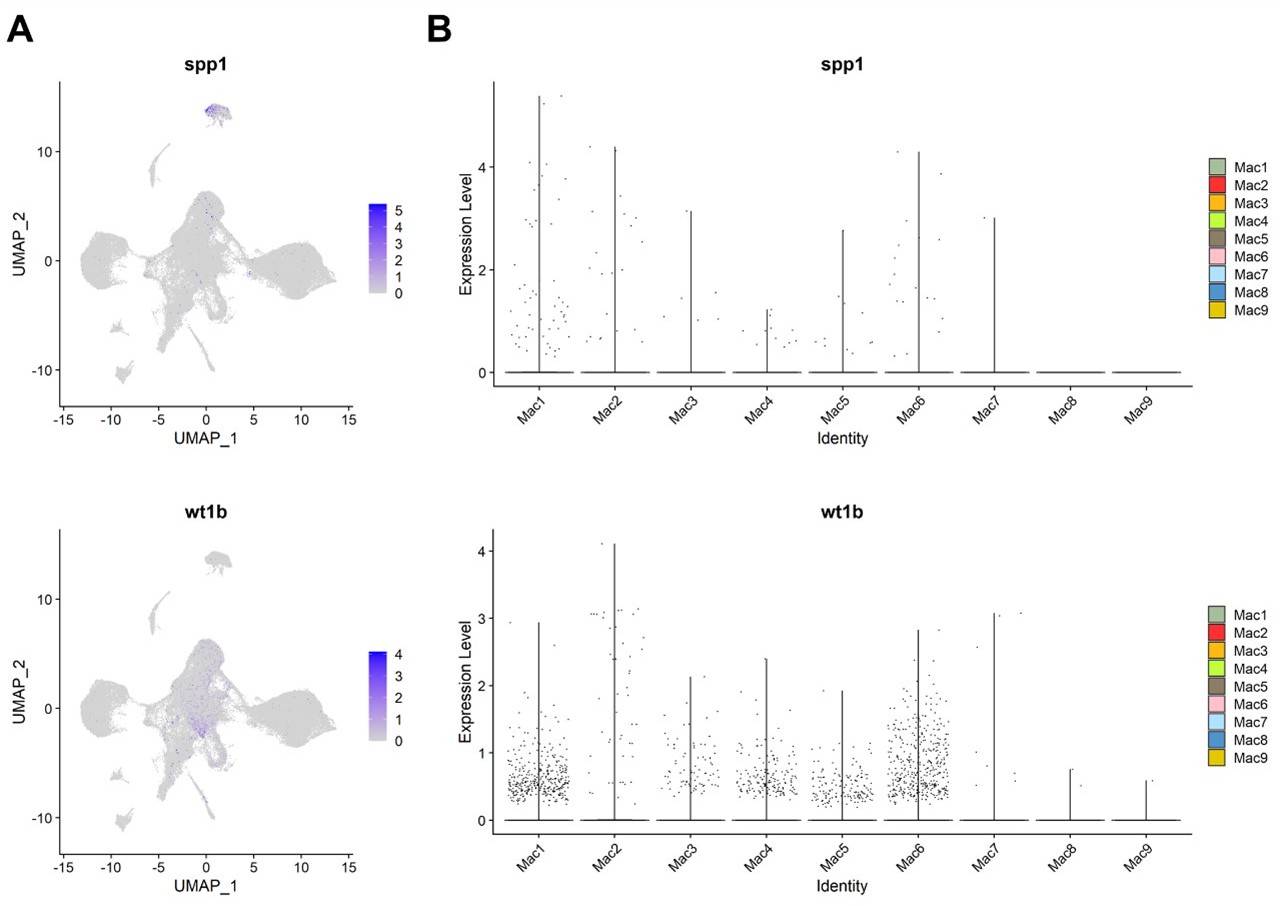
Expression of spp1 and wt1b among inflammatory cells in zebrafish hearts.
(A) UMAPs and (B) violin plots of spp1 and wt1b expression among inflammatory cell clusters.
Tables
Table 1
Biological process (BP) of Gene Ontology (GO) and Kyoto Encyclopedia of Genes and Genomes (KEGG) pathways for differentially enriched genes in each inflammatory cell clusters.
| Cluster | GO-BP term | Enriched genes | KEGG | Enriched genes |
|---|---|---|---|---|
| Mac 1 | Vesicle-mediated transport cation transport | havcr1, marco, igf2r | Endocytosis | igf2r |
| Proton transmembrane transporter | Ferroptosis | Heme metabolism (hmox1a) | ||
| (atp6v0ca, atp6v1e1b) | ||||
| Solute carrier family (slc2a6, slc30a1a) | ||||
| Mac 2 | Oxygen transport | Hemoglobins (hb genes), myoglobin (mb) | Unclassified | Heme metabolism (hmox1a) |
| Hydrogen peroxide metabolic process | Hemoglobins (hb genes) | |||
| Mac 3 | Immune system process | cd74a, csf1ra | Ferroptosis | Heme metabolism (hmox1a) |
| regulation of cell differentiation | lgals2a, spi1a | Apoptosis | Pro-apoptotic gene (pmaip1) | |
| Unclassified | timp4.3 | |||
| Mac 4 | Response to oxidative stress | prdx2, anxa1a | Citrate cycle (TCA cycle) | TCA cycle-related genes |
| (suclg1, suclg2, mdh1aa, sdha, dlst) | ||||
| Response to wounding | cxcl8a, lgals2a | |||
| Mac 5 | Mitotic cell cycle | cdk1, top2a | DNA replication | pcna |
| Mac 6, 7 | Response to oxidative stress | anxa1a, prdx2, park7, hmox1a | Cardiac muscle contraction | Cytochrome c oxidase involved |
| in oxidative phosphorylation | ||||
| Immune system development | Neutrophil transmigration (anxa1a, cx43) | Ribosome | ||
| Leukocyte differentiation (ak2) | ||||
| Mac 8 | Mitochondrion organization | NADH dehydrogenase (ndufs1, ndufs8a) | Cardiac muscle contraction | tnnt2a, myh7l |
| Ubiquinol-cytochrome c reductase | ||||
| (uqcr10, uqcrc2b) | ||||
| Mitochondrial transport | vdac2, uqcrc2a, cyc1 | Glycolysis/gluconeogenesis | aldoab, pdha1a | |
| Muscle structure development | pgam2, desma, csrp3 | Fatty acid degradation | acadvl, acsl1b | |
| Heart development | fabp3, myl7, nppa | |||
| Mac 9 | Regulation of cell differentiation | irf8, jun, myd88 | Endocytosis | cxcr4a, cxcr4b, spg21, eps15 |
| Cellular macromolecule localization | cd74a, cd74b | Toll-like receptor signaling pathway | Toll-like receptors (tlr3, tlr8b, tlr9) | |
| Interferon-induced genes (irf5, irf7) | ||||
| MN | Immune response | Inflammation-related genes (tnfb, irak3) | Mitophagy | Autophagy-involved genes (gabarapa, gabarapb, gabarapl2, calcoco2) |
| Response to cytokine | Cytokines and receptors | NOD-like receptor signaling pathway | Interferon-induced genes (stat1b, irf1b) | |
| (cxcl11.1, cxcl20, tnfrsf18, ccr9a) | ||||
| C-type lectin receptor signaling pathway | Fc receptor (fcer1g), | |||
| adaptor protein of PRR (card9) | ||||
| Ferroptosis | hmox1a | |||
| Neu 1 | Unclassified | sat1a.2, raraa | Ribosome | rplp0, rpsa, rpl15 |
| Neu 2 | Immune response | ccl34b.8, tnfb | Phagosome | nfc1, nfc2 |
| antigen processing and presentation | cd74a, cd74b | Lysosome | ctss2.2, ctsba, tcirg1b | |
| Cellular response to nitrogen starvation | map1lc3b, gabarapl2, gabarapb | NOD-like receptor signaling pathway | il1b, inflammasome related gene | |
| (jun, txnipa) | ||||
| atp metabolic process | pgam1a, pkma | Glycolysis/gluconeogenesis | pkma, pgam1a, aldocb | |
| C-type lectin receptor signaling pathway | egr3, il1b, irf1b | |||
| Mitophagy | gabarapl2, atf4a, gabarapb | |||
| Salmonella infection | il1b, tlr5b, fosab |
Key resources table
| Reagent type (species) or resource | Designation | Source or reference | Identifiers | Additional information |
|---|---|---|---|---|
| Strain, strain background (Danio rerio, AB) | Tg(mpeg1.4:mCherry-F)ump2 | PMID:24567393 | N/A | |
| Strain, strain background (D. rerio, AB) | TgBAC(mpx:GFP)i114 | PMID:16926288 | N/A | |
| Strain, strain background (D. rerio, AB) | Tg(–5.1myl7:DsRed2-NLS)f2Tg | PMID:12464178 | N/A | |
| Strain, strain background (D. rerio, AB) | Tg(fli1a:EGFP)y1 | PMID:12167406 | N/A | |
| Antibody | Anti-Mpx (rabbit polyclonal) | GeneTex | Cat# GTX128379; RRID:AB_2885768 | IF (1:500) |
| Antibody | Anti-mCherry (chicken polyclonal) | Abcam | Cat# ab205402; RRID:AB_2722769 | IF (1:250) |
| Antibody | Anti-HMOX1 (rabbit polyclonal) | Aviva | Cat# ARP45222_P050; RRID:AB_2046270 | IF (1:100) |
| Antibody | Anti-Digoxigenin Fab fragments antibody, AP conjugated (sheep polyclonal) | Roche | Cat# 11093274910; RRID:AB_514497 | ISH (1:1000) |
| Sequence-based reagent | hbaa1_F | This paper | qPCR primer | AAGCCCTCGCCAGAATGC |
| Sequence-based reagent | hbaa1_R | This paper | qPCR primer | ACCCATGATAGTCTTTCCGTGC |
| Sequence-based reagent | timp4.3_F | This paper | qPCR primer | GCAGAGACGCGGAGGTGAAG |
| Sequence-based reagent | timp4.3_R | This paper | qPCR primer | CGGGACCACAGCTACAAGCC |
| Sequence-based reagent | eef1a1l1_F | PMID:32359472 | qPCR primer | CTGGAGGCCAGCTCAAAC |
| Sequence-based reagent | eef1a1l1_R | PMID:32359472 | qPCR primer | ATCAAGAAGAGTAGTACCGCTAGCATTAC |
| Sequence-based reagent | hbaa1_F | This paper | ISH primer | ACGCAGCGATGAGTCTCT |
| Sequence-based reagent | hbaa1_R | This paper | ISH primer | CATGCATGAGTTGTTAAGAGTG |
| Sequence-based reagent | timp4.3_F | This paper | ISH primer | CAGACACGAAGGACATGC |
| Sequence-based reagent | timp4.3_R | This paper | ISH primer | CACCGAATGTATGTGTTTATTAAC |
| Sequence-based reagent | hmox1a_F | This paper | ISH primer | TCAGAGCATTCGAGTTCAAC |
| Sequence-based reagent | hmox1a_R | This paper | ISH primer | ACAGTTTATTAATCTTGCATTTACACAG |
| Commercial assay or kit | Click-iT EdU Cell Proliferation Kit for Imaging, Alexa Fluor 647 dye | Thermo Fisher | Cat# C10340 | |
| Commercial assay or kit | In Situ Cell Death Detection Kit, TMR red | Sigma-Aldrich | Cat# 12156792910 | |
| Commercial assay or kit | miRNeasy micro Kit | QIAGEN | Cat# 217084 | |
| Commercial assay or kit | Chromium single cell 3’ Reagent kits v3 | 10x Genomics | N/A | |
| Commercial assay or kit | NBT/BCIP stock solution | Roche | Cat# 11681451001 | ISH (1:50) |
| Chemical compound, drug | Clodronate liposome | Liposoma | Cat# C-005 | 10 μl per fish |
| Chemical compound, drug | DIG RNA labeling mix | Roche | Cat# 11277073910 | ISH |
| Software, algorithm | NOIseq | PMID:26184878 | RRID:SCR_003002 | |
| Software, algorithm | WebGestalt | PMID:15980575 | RRID: SCR_006786 | |
| Software, algorithm | CellRanger | 10x Genomics | RRID: SCR_023221 | |
| Software, algorithm | Seurat | PMID:29608179 | RRID: SCR_007322 | |
| Software, algorithm | Monocle3 | PMID:30787437 | RRID: SCR_018685 | |
| Software, algorithm | Ligand-Receptor Interaction Network Analysis | PMID:26198319 | N/A | |
| Software, algorithm | Cytoscape | PMID:14597658 | RRID: SCR_003032 |
Additional files
Download links
A two-part list of links to download the article, or parts of the article, in various formats.
Downloads (link to download the article as PDF)
Open citations (links to open the citations from this article in various online reference manager services)
Cite this article (links to download the citations from this article in formats compatible with various reference manager tools)
Comparative single-cell profiling reveals distinct cardiac resident macrophages essential for zebrafish heart regeneration
eLife 12:e84679.
https://doi.org/10.7554/eLife.84679


