Cell cycle-specific loading of condensin I is regulated by the N-terminal tail of its kleisin subunit
- Chromosome Dynamics Laboratory, RIKEN, Japan
- Division of Biological Sciences, Graduate School of Science, Nagoya University, Japan
Figures
Figure 1 with 2 supplements
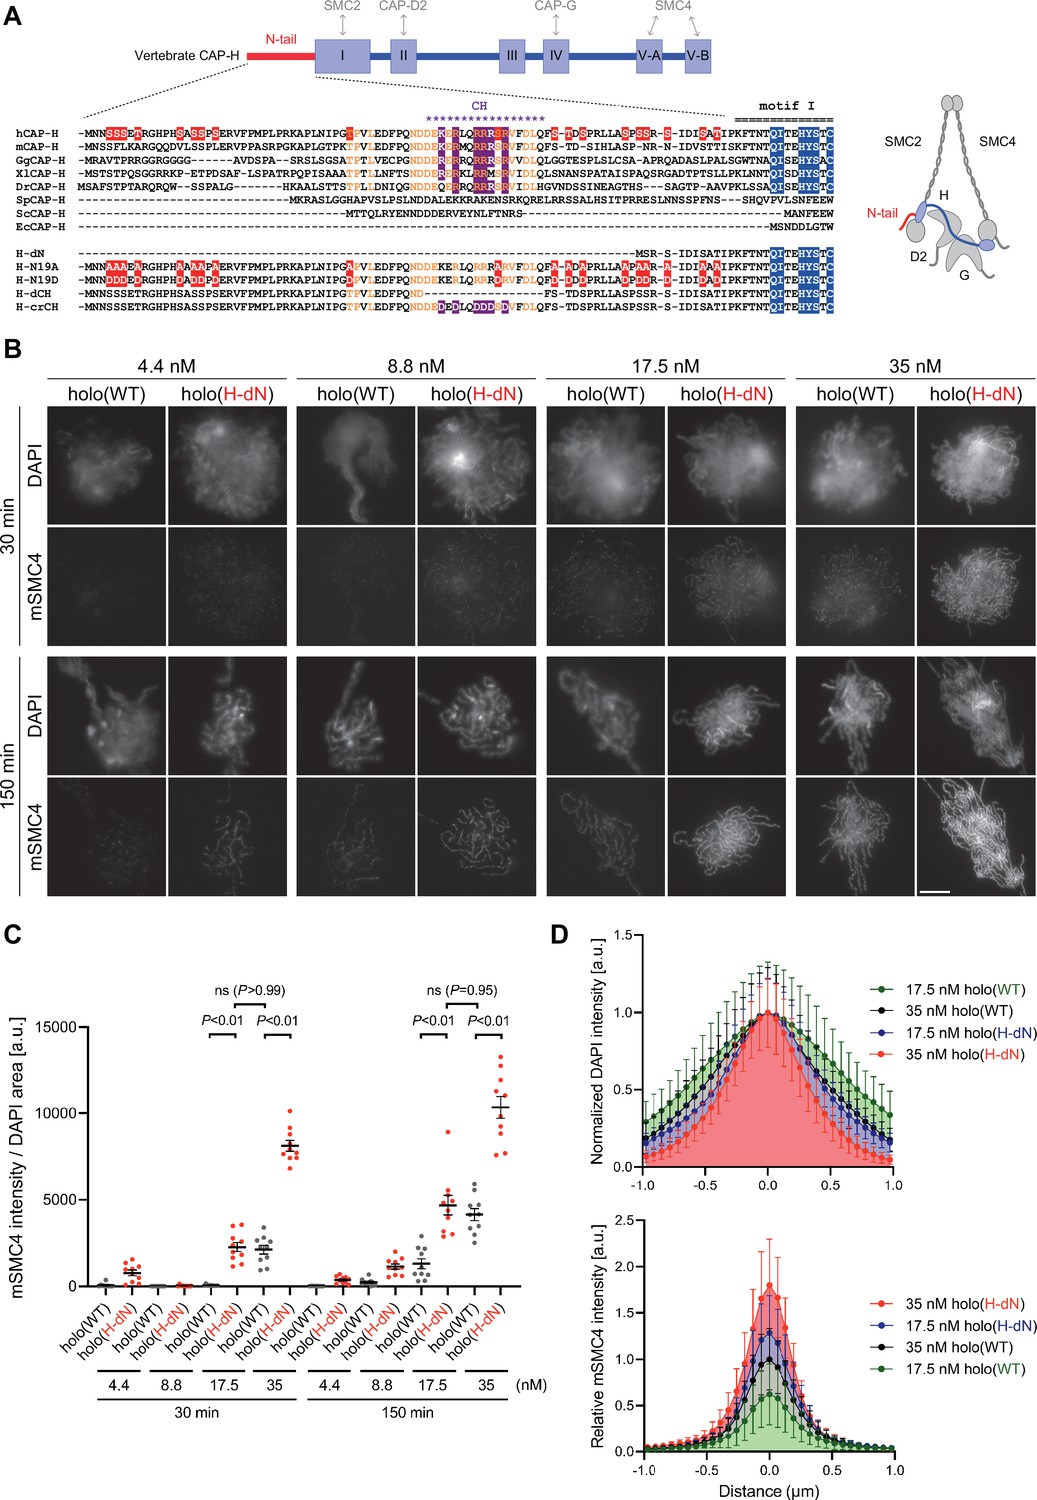
Deletion of the CAP-H N-tail accelerates condensin I loading and mitotic chromosome assembly.
(A) Domain organization of vertebrate CAP-H and sequence alignments of the CAP-H N-tail in eukaryotes (left). Shown in the upper half is an alignment of the CAP-H orthologs (Homo sapiens: hCAP-H, Mus musculus: mCAP-H, Gallus gallus: GgCAP-H, Xenopus laevis: XlCAP-H, Danio rerio: DrCAP-H, Schizosaccharomyces pombe: SpCAP-H, Saccharomyces cerevisiae: ScCAP-H, and Encephalitozoon cuniculi: EcCAP-H). Six mutants tested in the current study (H-dN, H-N19A, H-N19D, H-dCH, and H-crCH) are shown in the bottom half. Conserved amino-acid residues were shown in yellow (N-tail) or blue (motif I). The helix motif predicted using Jpred4 (http://www.compbio.dundee.ac.uk/jpred/) is indicated by ‘CH’ (for the conserved helix). The N19A/N19D and crCH mutation sites were shown in red and purple, respectively. Also shown in a schematic diagram of the architecture of vertebrate condensin I (right). (B) Add-back assay with holo(WT) and holo(H-dN). Mouse sperm nuclei were incubated with condensin-depleted M-HSS that had been supplemented with holo(WT) or holo(H-dN) at concentrations of 4.4, 8.8, 17.5, and 35 nM. After 30 and 150 min, the reaction mixtures were fixed and processed for immunofluorescence labeling with an antibody against mSMC4. DNA was counterstained with DAPI. Shown here is a representative image from over 10 chromosome clusters examined per condition. Scale bar, 10 μm. (C) Quantification of the intensity of mSMC4 per DNA area in the experiment shown in (B) (n = 10 clusters of chromosomes). The error bars represent the mean ± standard error of the mean (SEM). The p values were assessed by Tukey’s multiple comparison test after obtaining a significant difference with two-way analysis of variance (ANOVA). (D) Line profiles of mitotic chromosomes observed at 150 min shown in the experiment shown in (B). Signal intensities of DAPI (top) and mSMC4 (bottom) from chromosomes assembled by holo(WT) or holo(H-dN) at 17.5 or 35 nM were measured along with the lines drawn perpendicular to chromosome axes (n = 20). The mean and standard deviation (SD) were normalized individually to the DAPI intensities (arbitrary unit [a.u.]) at the center of chromosome axes (distance = 0 μm) (top). Intensities of mSMC4 signals were normalized relative to the value from holo(WT) at 35 nM (bottom). The error bars represent the mean ± SD.
-
Figure 1—source data 1
Microsoft excel of non-normalized data corresponding to Figure 1C.
- https://cdn.elifesciences.org/articles/84694/elife-84694-fig1-data1-v2.xlsx
-
Figure 1—source data 2
Microsoft excel of non-normalized data corresponding to Figure 1D.
- https://cdn.elifesciences.org/articles/84694/elife-84694-fig1-data2-v2.xlsx
Figure 1—figure supplement 1
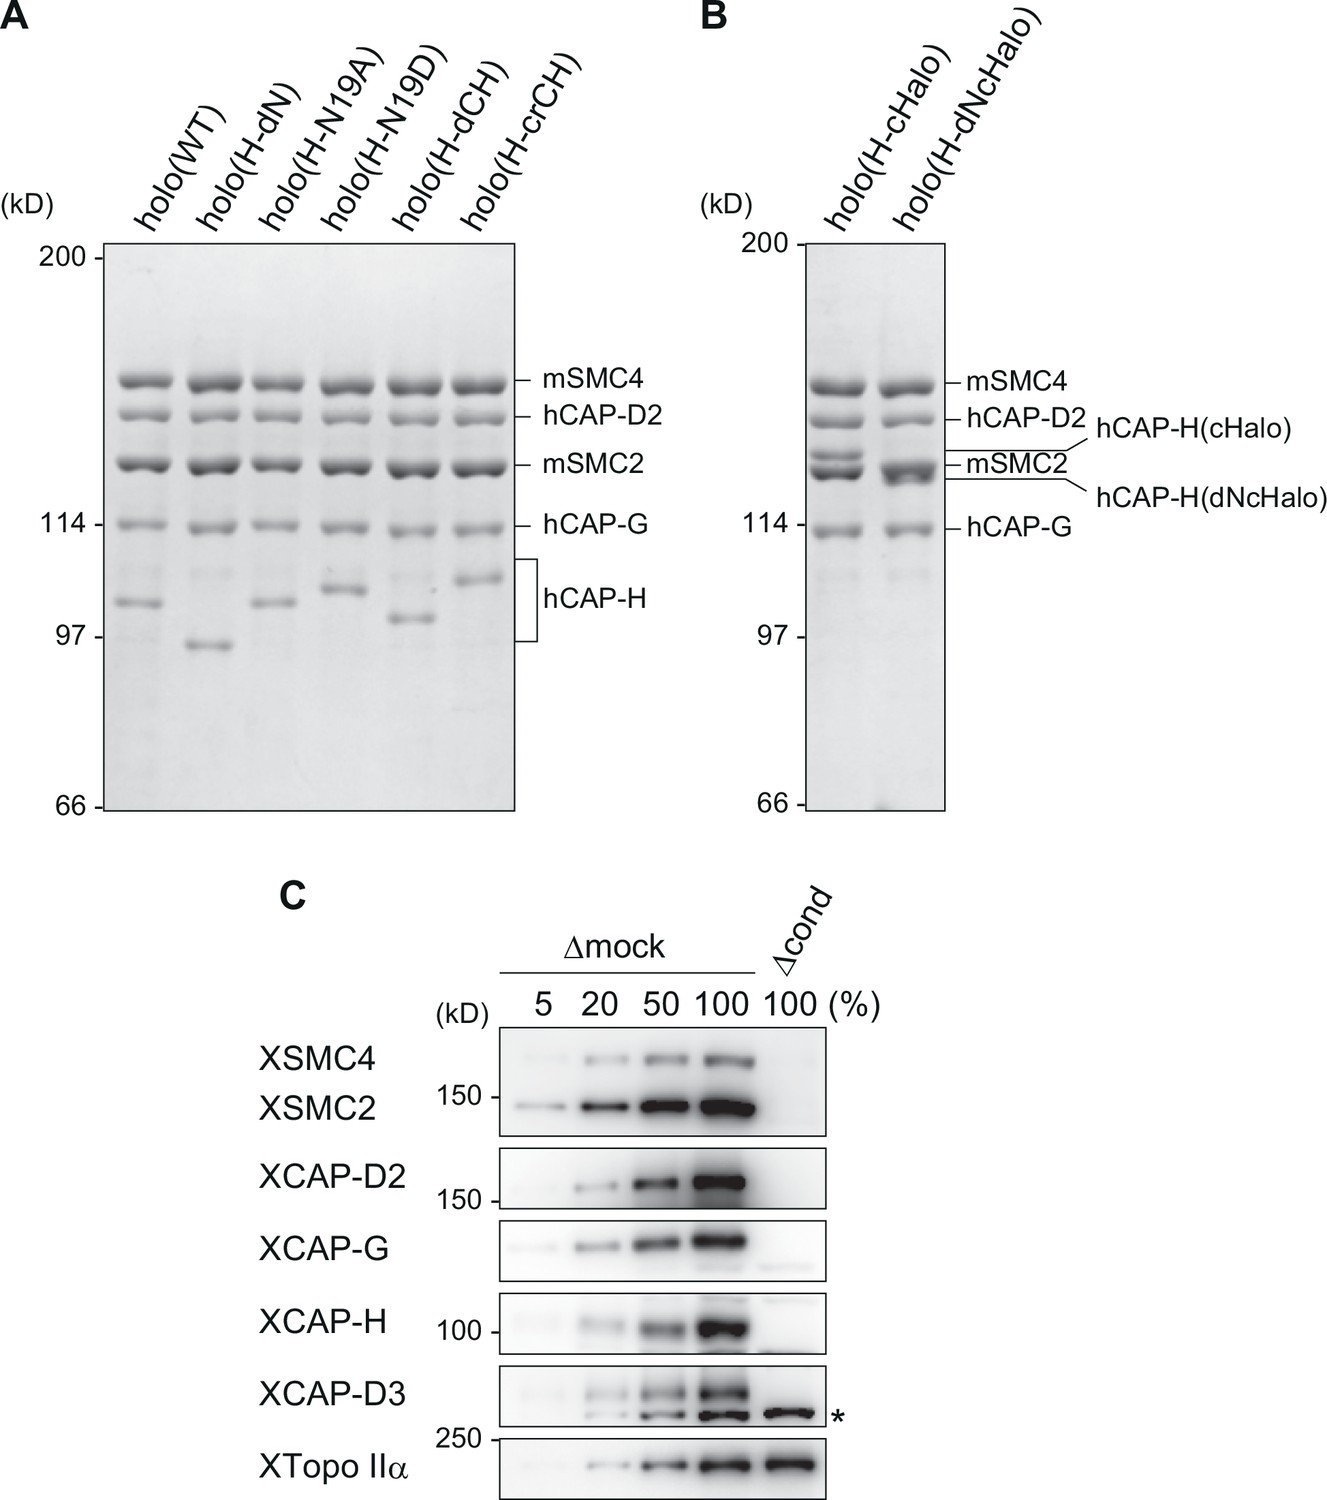
Recombinant condensin I complexes and immunodepletion.
(A) The wild-type and mutant condensin I complexes used in the current study. The recombinant complexes were purified from insect cells and subjected to sodium dodecyl sulfate–polyacrylamide gel electrophoresis (SDS–PAGE). The gel was stained with Coomassie brilliant blue (CBB). (B) HaloTag–condensin I complexes used in the loop extrusion assay. The recombinant complexes were purified from insect cells and subjected to SDS–PAGE before being fluorescently labeled. The gel was stained with CBB. (C) Immunodepletion of endogenous condensins from Xenopus egg M-HSS. Endogenous condensin subunits were depleted from the M-HSS using Dynabeads Protein A coupled with control IgG (Δmock) or a mixture of antibodies against the subunits of condensins I and II (Δcond). To estimate the efficiency of depletion, the Δcond extract (100%) was compared with different amounts of the Δmock extract (5%, 20%, 50%, and 100%) by immunoblotting using the antibodies indicated. Endogenous topo IIα (XTopo IIα) was used as a loading control. The asterisk indicates a non-specific band.
-
Figure 1—figure supplement 1—source data 1
Raw data uncropped gel corresponding to Figure 1—figure supplement 1A, B.
- https://cdn.elifesciences.org/articles/84694/elife-84694-fig1-figsupp1-data1-v2.zip
-
Figure 1—figure supplement 1—source data 2
Microsoft excel of DNA constructs used in this study.
- https://cdn.elifesciences.org/articles/84694/elife-84694-fig1-figsupp1-data2-v2.xlsx
-
Figure 1—figure supplement 1—source data 3
Raw data uncropped blots corresponding to Figure 1—figure supplement 1C.
- https://cdn.elifesciences.org/articles/84694/elife-84694-fig1-figsupp1-data3-v2.zip
Figure 1—figure supplement 2
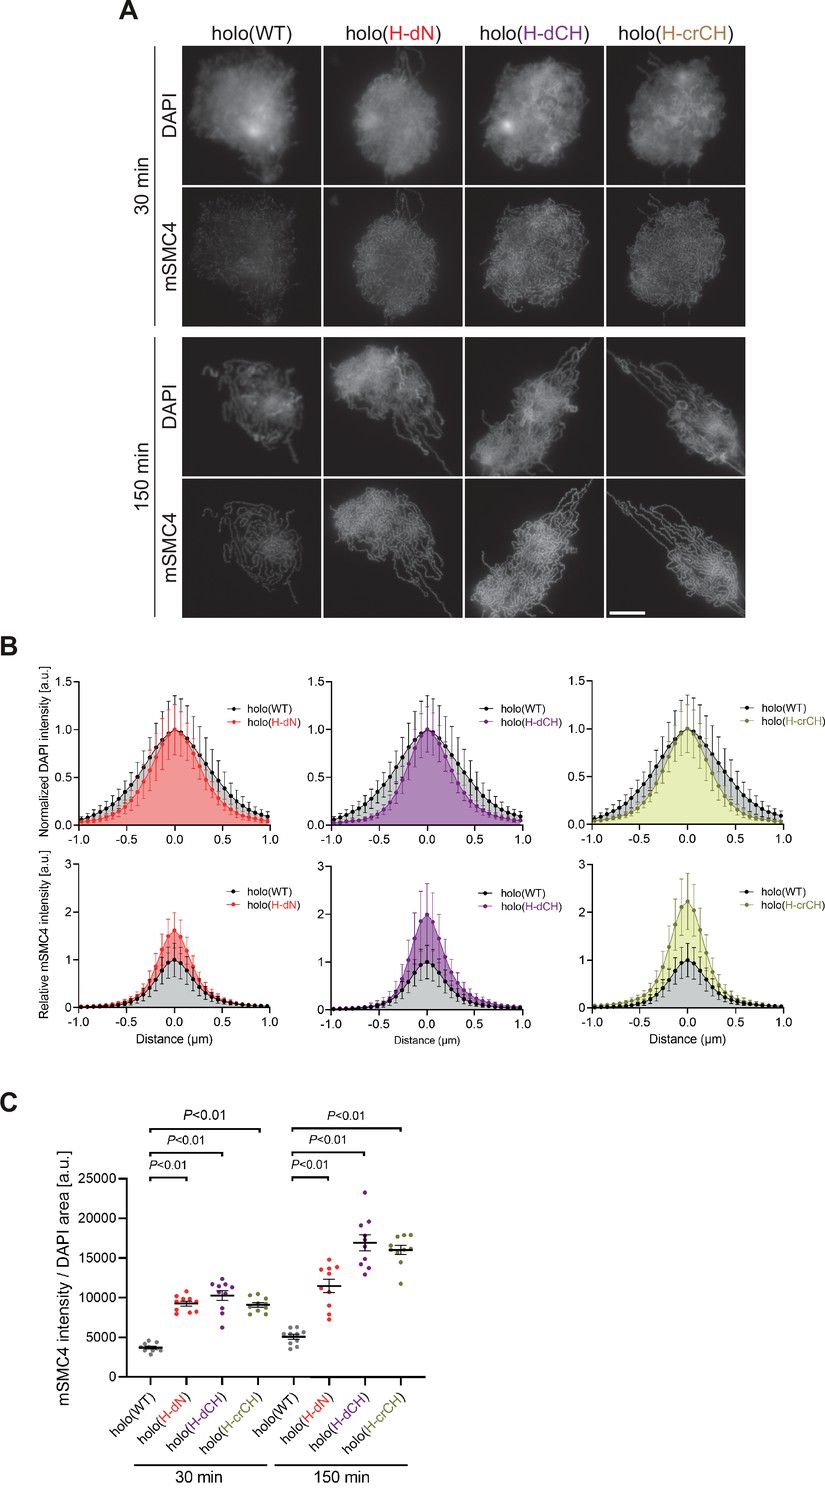
Deletion of and mutations in the conserved helix accelerates condensin I loading and mitotic chromosome assembly.
(A) Mouse sperm nuclei were incubated with condensin-depleted M-HSS that had been supplemented with holo(WT), holo(H-dN) holo(H-dCH), or holo(H-crCH) at a final concentration of 35 nM. After 30 and 150 min, the reaction mixtures were fixed and processed for immunofluorescence labeling with an antibody against mSMC4. DNA was counterstained with DAPI. Shown here is a representative image from over 10 chromosome clusters examined per condition. Scale bar, 10 μm. (B) Line profiles of mitotic chromosomes observed at 150 min in the experiment shown in (A). Signal intensities of DAPI (top) and mSMC4 (bottom) from the chromosomes assembled with holo(WT) (black), holo(H-dN) (red), holo(H-dCH) (purple), or holo(H-crCH) (yellow) were measured along with the lines drawn perpendicular to chromosome axes (n = 20). The error bars represent the mean ± standard deviation (SD). The mean and SD were normalized individually to the DAPI intensities (arbitrary unit [a.u.]) at the center of chromosome axes (distance = 0 μm) within each set. Intensities of mSMC4 signals from holo(H-dN), holo(H-dCH), and holo(H-crCH) were normalized relative to the value from holo(WT). A dataset from a single representative experiment out of two repeats is shown. (C) Quantification of the intensity of mSMC4 per DNA area in the experiment shown in (A) (n = 10 clusters of chromosomes). The error bars represent the mean ± standard error of the mean (SEM). The p values were assessed by Tukey’s multiple comparison test after obtaining a significant difference with one-way analysis of variance (ANOVA) at each time point. A dataset from a single representative experiment out of two repeats is shown.
-
Figure 1—figure supplement 2—source data 1
Microsoft excel of non-normalized data corresponding to Figure 1—figure supplement 2B.
- https://cdn.elifesciences.org/articles/84694/elife-84694-fig1-figsupp2-data1-v2.xlsx
-
Figure 1—figure supplement 2—source data 2
Microsoft excel of non-normalized data corresponding to Figure 1—figure supplement 2C.
- https://cdn.elifesciences.org/articles/84694/elife-84694-fig1-figsupp2-data2-v2.xlsx
Figure 2 with 1 supplement
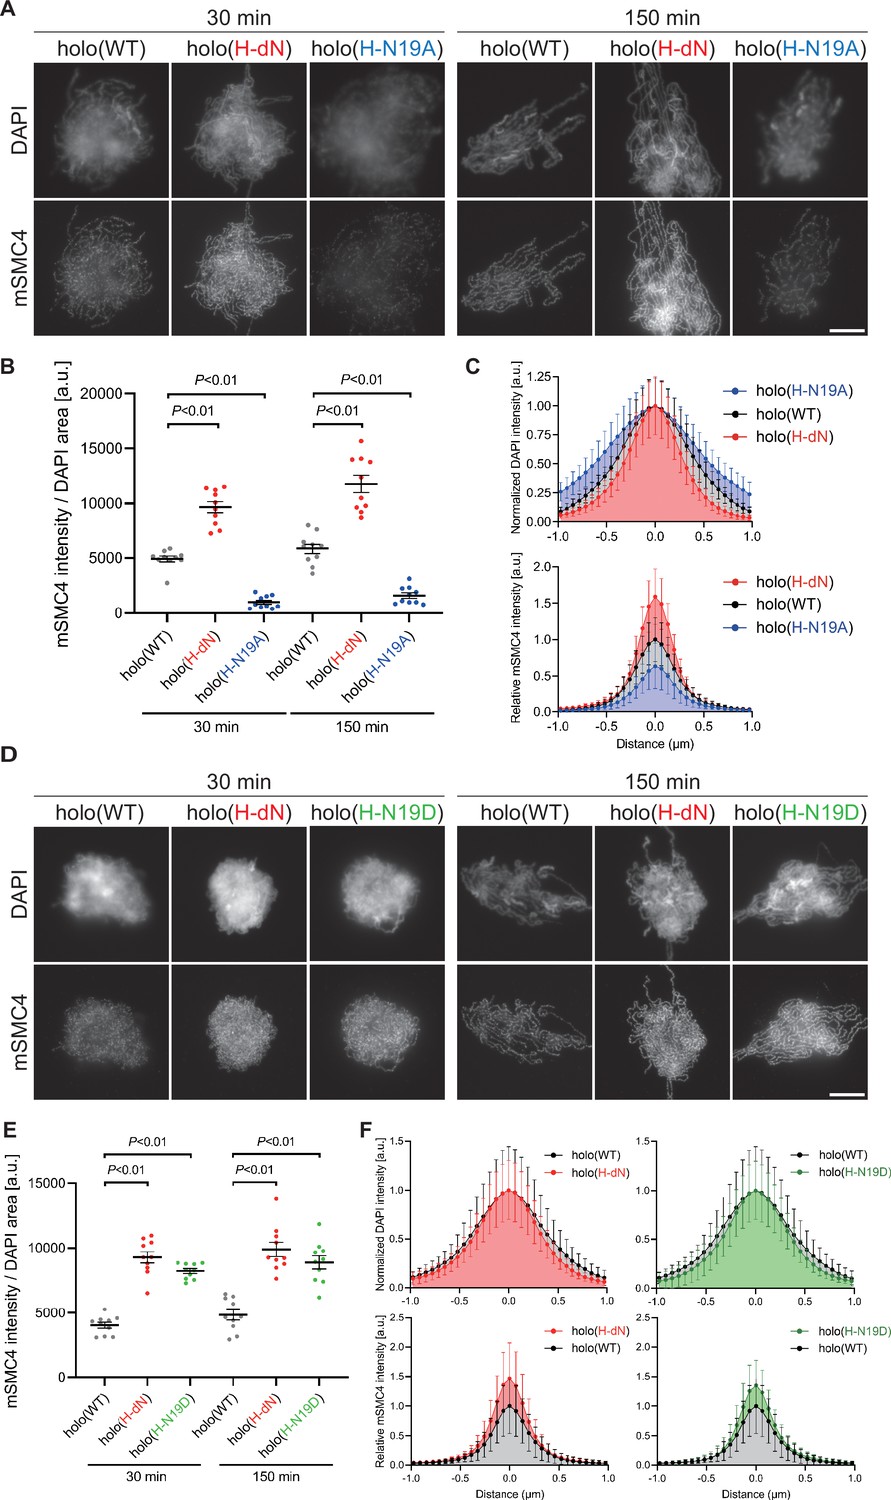
Phosphorylation-deficient and phosphorylation-mimetic mutations of the CAP-H N-tail decelerate and accelerate condensin I loading, respectively.
(A) Mouse sperm nuclei were incubated with condensin-depleted M-HSS that had been supplemented with holo(WT), holo(H-dN), or holo(H-N19A) at a final concentration of 35 nM. After 30 and 150 min, the reaction mixtures were fixed and processed for immunofluorescence labeling with an antibody against mSMC4. DNA was counterstained with DAPI. Shown here is a representative image from over 10 chromosome clusters examined per condition. Scale bar, 10 μm. (B) Quantification of the intensity of mSMC4 per the DAPI area in the experiment shown in (A) (n = 10 clusters of chromosomes). The error bars represent the mean ± standard error of the mean (SEM). The p values were assessed by Tukey’s multiple comparison test after obtaining a significant difference with one-way analysis of variance (ANOVA) at each time point. A dataset from a single representative experiment out of more than three repeats is shown. (C) Line profiles of mitotic chromosomes observed at 150 min in the experiment shown in (A). Signal intensities of DAPI (top) and mSMC4 (bottom) of the chromosomes assembled with holo(WT) (black), holo(H-dN) (red), or holo(H-N19A) (blue) were measured along with the lines drawn perpendicular to chromosome axes (n = 20). The mean and standard deviation were normalized individually to the DAPI intensities (arbitrary unit [a.u.]) at the center of chromosome axes (distance = 0 μm) within each set. Intensities of mSMC4 signals from holo(H-dN) and holo(H-N19A) were normalized relative to the value from holo(WT). A dataset from a single representative experiment out of more than three repeats is shown. (D) Add-back assay using holo(WT), holo(H-dN), and holo(H-N19D) at a final concentration of 35 nM was performed as described in (A). Shown here is a representative image from over 10 chromosome clusters examined per condition. Scale bar, 10 μm. (E) Quantification of the intensity of mSMC4 per the DAPI area in the experiment shown in (D) (n = 10 clusters of chromosomes). The error bars represent the mean ± SEM. The p values were assessed by Tukey’s multiple comparison test after obtaining a significant difference with one-way ANOVA at each time point. A dataset from a single representative experiment out of more than three repeats for holo(WT) and holo(H-dN) and two repeats for holo(H-N19D) is shown. (F) Line profiles of mitotic chromosomes assembled observed at 150 min in the experiment shown in (D). The signal intensities of DAPI (top) and mSMC4 (bottom) of the chromosomes assembled with holo(WT) (black), holo(H-dN) (red), or holo(H-N19D) (green) were measured and plotted as described in (C) (n = 20). A dataset from a single representative experiment out of more than three repeats for holo(WT) and holo(H-dN) and two repeats for holo(H-N19D) is shown.
-
Figure 2—source data 1
Microsoft excel of non-normalized data corresponding to Figure 2B.
- https://cdn.elifesciences.org/articles/84694/elife-84694-fig2-data1-v2.xlsx
-
Figure 2—source data 2
Microsoft excel of non-normalized data corresponding to Figure 2C.
- https://cdn.elifesciences.org/articles/84694/elife-84694-fig2-data2-v2.xlsx
-
Figure 2—source data 3
Microsoft excel of non-normalized data corresponding to Figure 2E.
- https://cdn.elifesciences.org/articles/84694/elife-84694-fig2-data3-v2.xlsx
-
Figure 2—source data 4
Microsoft excel of non-normalized data corresponding to Figure 2F.
- https://cdn.elifesciences.org/articles/84694/elife-84694-fig2-data4-v2.xlsx
Figure 2—figure supplement 1
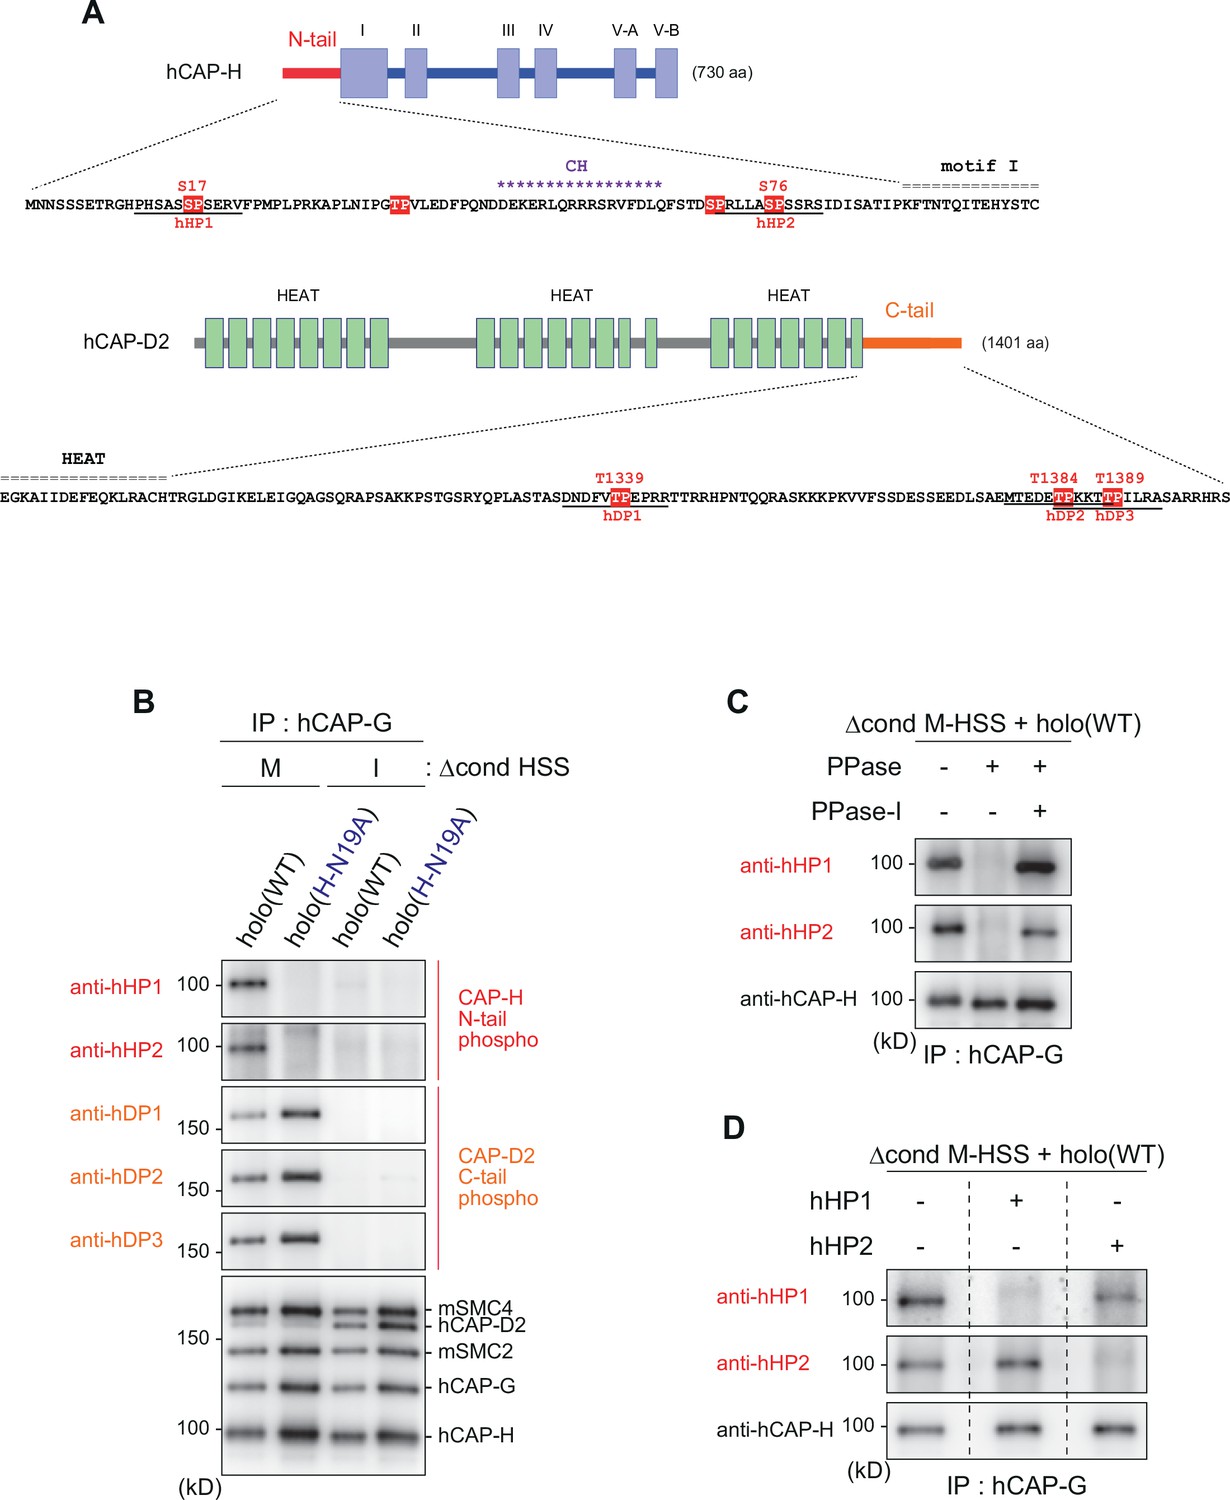
Mitosis-specific phosphorylation of condensinI subunits.
(A) Schematic diagrams of hCAP-H and hCAP-D2. The hCAP-H N-tail has four SP/TP sites whereas the hCAP-D2 C-tail has three TP sites. Peptide sequences used to prepare phospho-specific antibodies are underlined (hHP1 and hHP2 for hCAP-H; hDP1, hDP2, and hDP3 for hCAP-D2). (B) Detection of phosphoepitopes in Xenopus egg extracts. Holo(WT) or holo(H-N19A) was added to Δcond M-HSS or I-HSS at a final concentration of 35 nM and incubated at 22°C for 150 min. The condensin complexes were immunoprecipitated and analyzed by immunoblotting using the antibodies indicated. (C) Phosphatase treatment of the recombinant condensin I complex. Holo(WT) was preincubated with Δcond M-HSS and immunoprecipitated as described in (B). Bead-bound fractions were treated with λ protein phosphatase (PPase) in the presence or absence of phosphatase inhibitors (PPase-I) and analyzed by immunoblotting using the antibodies indicated. (D) Phophopeptide competition assay. Holo(WT) was preincubated with Δcond M-HSS, immunoprecipitated and subjected to immunoblotting as described in (B). The membranes were triplicated and probed with anti-hHP1 in the presence of no competing peptide, hHP1 or hHP2. Another set of triplicated membranes was probed with anti-hHP2 in the presence of no competing peptide, hHP1 or hHP2.
-
Figure 2—figure supplement 1—source data 1
Raw data uncropped blots corresponding to Figure 2—figure supplement 1B.
- https://cdn.elifesciences.org/articles/84694/elife-84694-fig2-figsupp1-data1-v2.zip
-
Figure 2—figure supplement 1—source data 2
Raw data uncropped blots corresponding to Figure 2—figure supplement 1C.
- https://cdn.elifesciences.org/articles/84694/elife-84694-fig2-figsupp1-data2-v2.zip
-
Figure 2—figure supplement 1—source data 3
Raw data uncropped blots corresponding to Figure 2—figure supplement 1D.
- https://cdn.elifesciences.org/articles/84694/elife-84694-fig2-figsupp1-data3-v2.zip
Figure 3 with 1 supplement
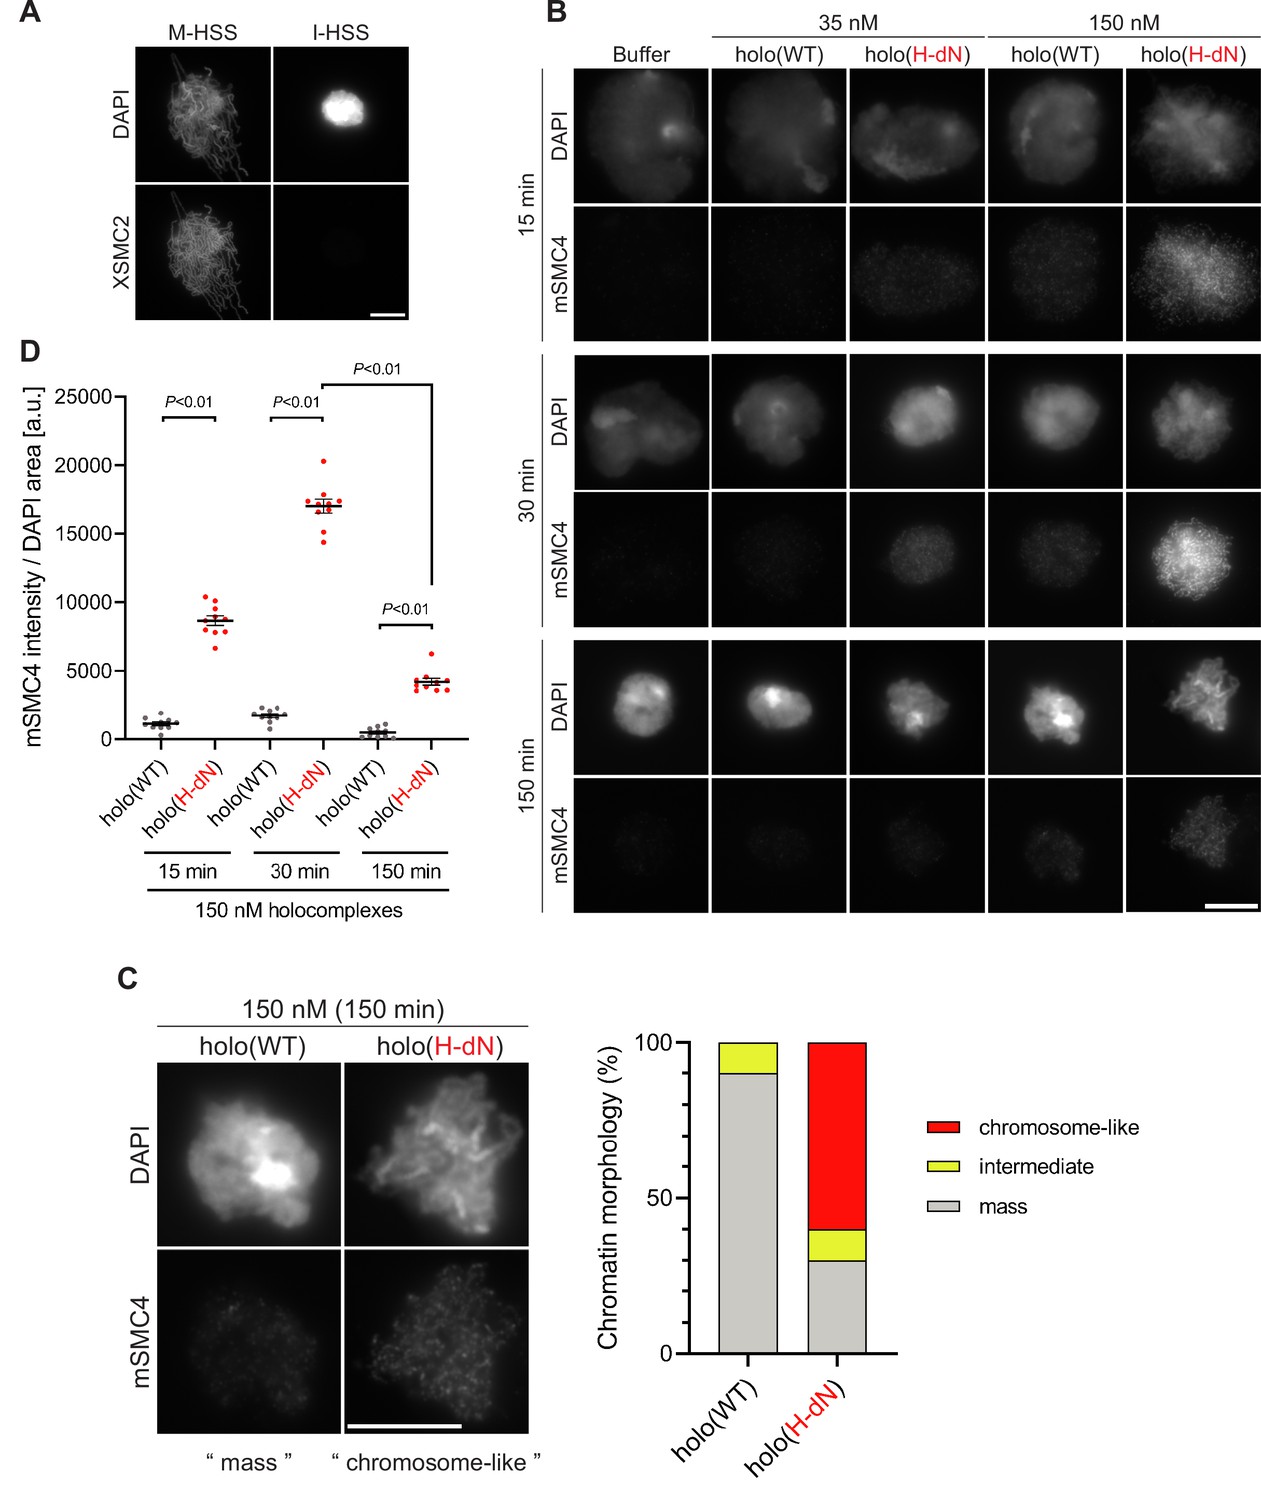
Deletion of the CAP-H N-tail enables condensin I to assemble mitotic chromosome-like structures even in interphase extracts.
(A) Mouse sperm nuclei were incubated with M-HSS (left) and I-HSS (right) for 150 min, and the reaction mixtures were fixed and processed for immunofluorescence labeling with an antibody against XSMC2 (bottom). DNA was counterstained with DAPI (top). Scale bar, 10 μm. (B) Mouse sperm nuclei were incubated with condensin-depleted I-HSS that had been supplemented with a control buffer, holo(WT), or holo(H-dN) at a final concentration of 35 or 150 nM. After 15, 30, and 150 min, the reaction mixtures were fixed and processed for immunofluorescence labeling with an antibody against mSMC4. DNA was counterstained with DAPI. Shown here is a representative image from over 10 chromosome clusters examined per condition. Scale bar, 10 μm. (C) Blow-up images of a chromatin ‘mass’ assembled with 150 nM holo(WT) at 150 min and a cluster of mitotic ‘chromosome-like’ structures assembled with 150 nM holo(H-dN) at 150 min in the experiment shown in (B). Frequencies of the chromosomal phenotypes observed under the two conditions, which include ‘intermediate’ structures, are plotted on the right (n = 10 for each condition). Scale bar, 10 μm. (D) Quantification of mSMC4 intensities on interphase chromatin when added holo(WT) or holo(H-dN) at 150 nM. The graph shows the intensity of mSMC4 per the DAPI area (n = 10 masses of chromatin) shown in (B). The error bars represent the mean ± standard error of the mean (SEM). The p values were assessed by Tukey’s multiple comparison test after obtaining a significant difference with two-way analysis of variance (ANOVA). A dataset from a single representative experiment out of three repeats is shown. Another set of the reproduced result was also shown in Figure 3—figure supplement 1.
-
Figure 3—source data 1
Microsoft excel of non-normalized data corresponding to Figure 3D.
- https://cdn.elifesciences.org/articles/84694/elife-84694-fig3-data1-v2.xlsx
Figure 3—figure supplement 1
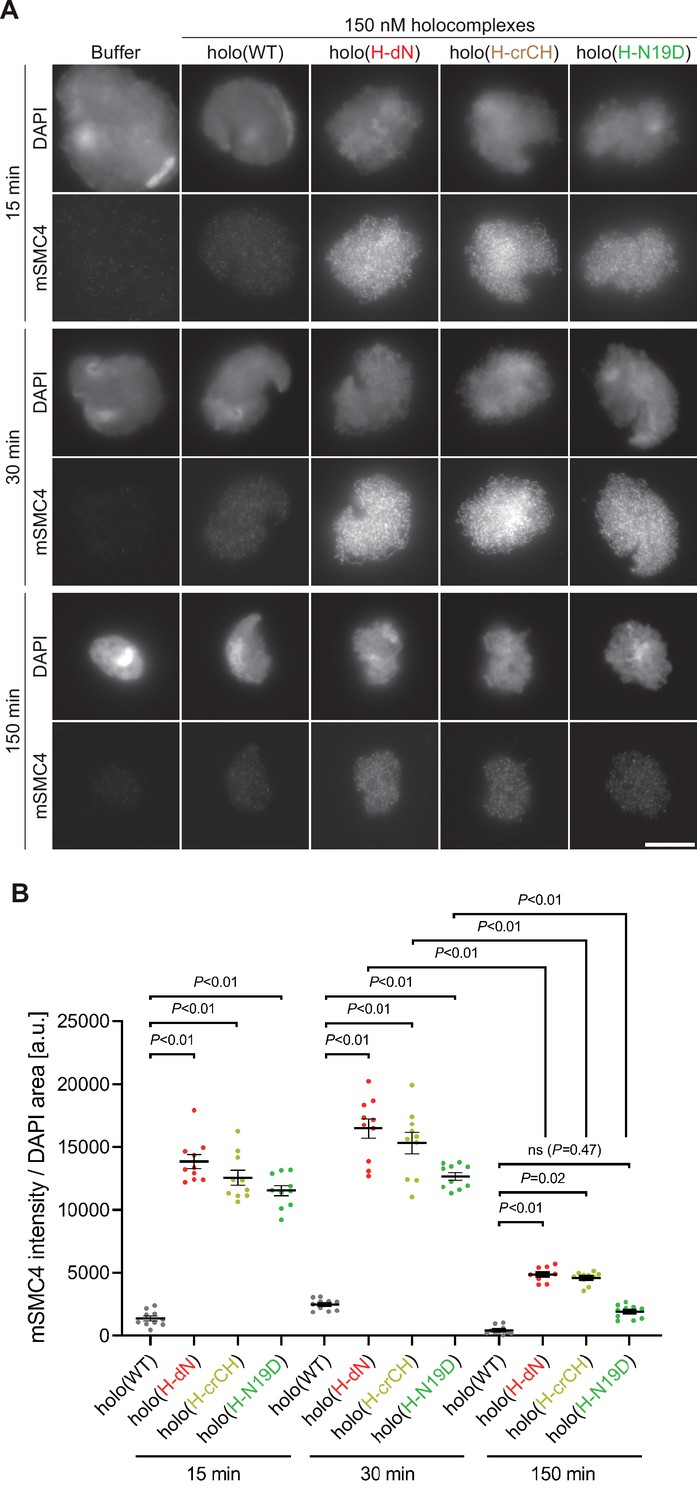
Deletion of and mutations in the conserved helix enables condensin I to assemble mitotic chromosome-like structures even in interphase extracts.
(A) Mouse sperm nuclei were incubated with condensin-depleted I-HSS that had been supplemented with holo(WT), holo(H-dN), holo(H-crCH), or holo(H-N19D) at a final concentration of 150 nM. After 15, 30, and 150 min, the reaction mixtures were fixed and processed for immunofluorescence labeling with an antibody against mSMC4. DNA was counterstained with DAPI. Shown here is a representative image from over 10 chromosome clusters examined per condition. Scale bar, 10 μm. (B) Quantification of the intensity of mSMC4 per DAPI area in the experiment shown in (A) (n = 10 clusters of chromosomes). The error bars represent the mean ± standard error of the mean (SEM). The p values were assessed by Tukey’s multiple comparison test after obtaining a significant difference with two-way analysis of variance (ANOVA).
-
Figure 3—figure supplement 1—source data 1
Microsoft excel of non-normalized data corresponding to Figure 3—figure supplement 1B.
- https://cdn.elifesciences.org/articles/84694/elife-84694-fig3-figsupp1-data1-v2.xlsx
Figure 4 with 1 supplement
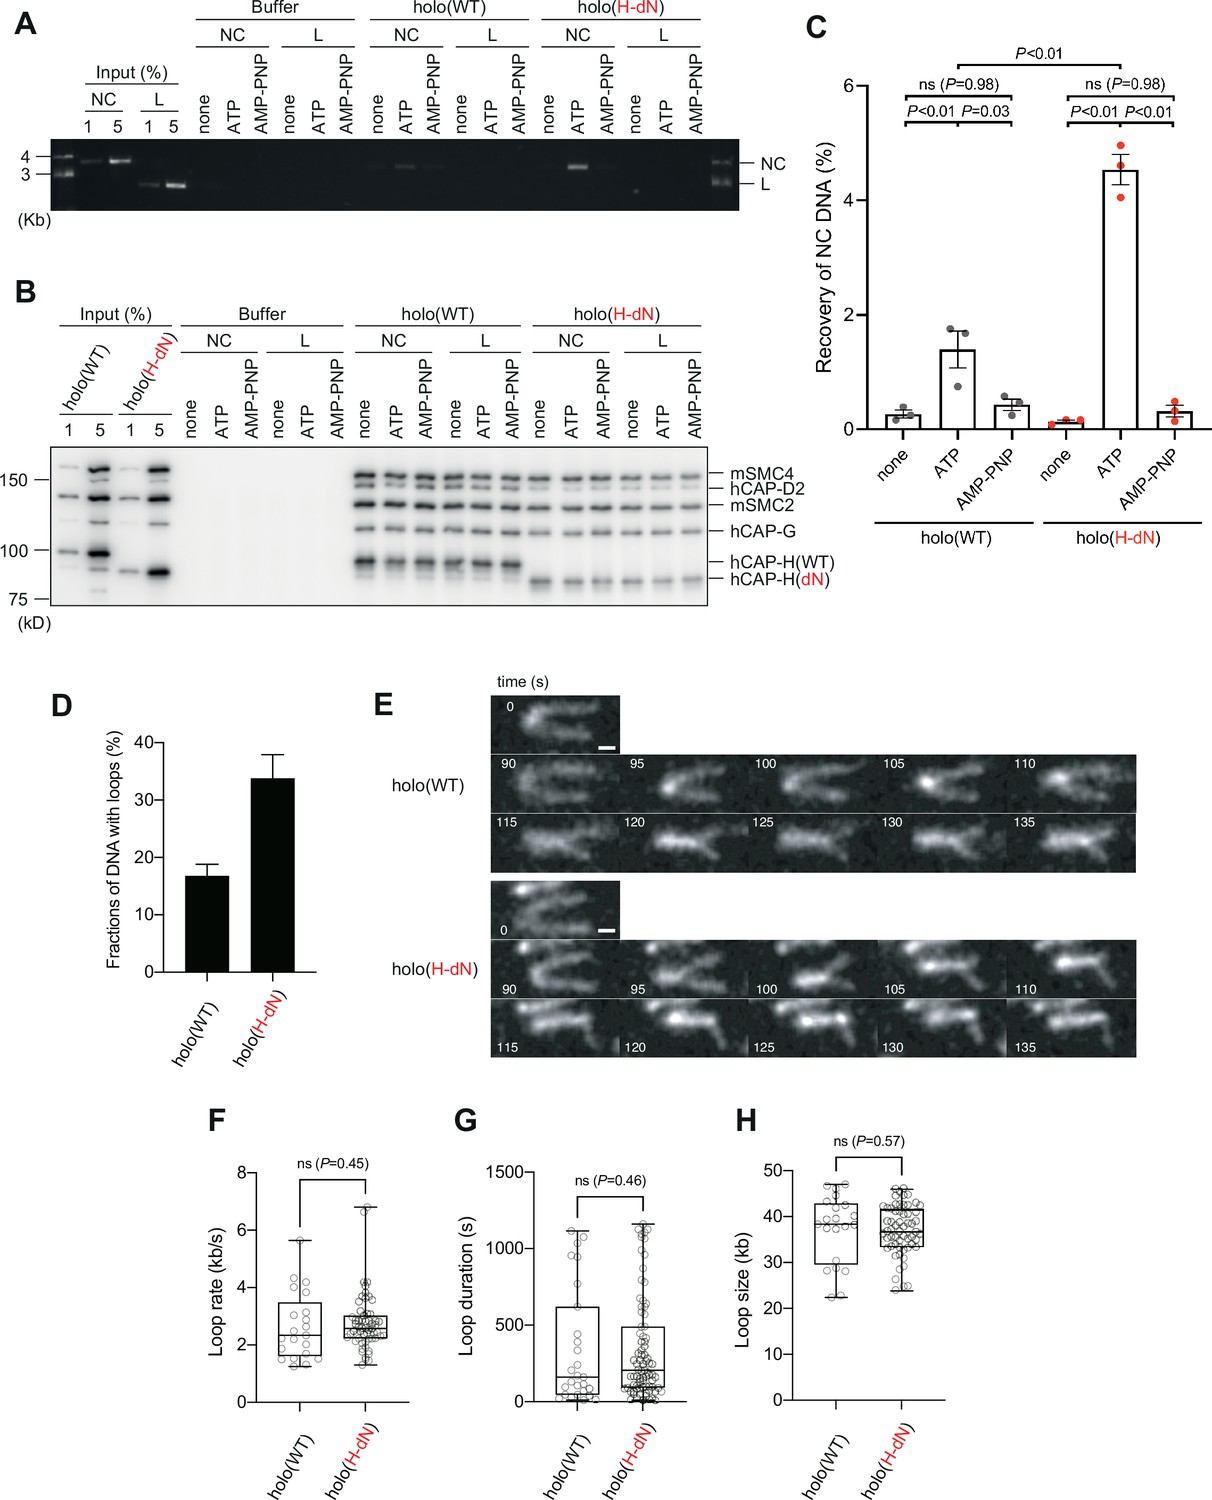
Deletion of the CAP-H N-tail enhances topological loading onto circular DNA and increases the frequency of loop formation in vitro.
(A–C) Topological loading assay. (A) Loading reactions onto nicked circular DNA (NC) or linearized DNA (L) were set up with a control buffer, holo(WT) or holo(H-dN) in the absence of nucleotides (none) or the presence of ATP or AMP-PNP. DNAs recovered on beads after a high-salt wash were analyzed by agarose gel electrophoresis. (B) Confirmation of the efficiency of immunoprecipitation in the experiment shown in (A). Using the one-tenth volume of the recovered samples, immunoblotting analysis was performed with the antibodies indicated. (C) Quantification of the recovery of NC DNA in the experiments shown in (A). The error bars represent the mean ± standard error of the mean (SEM) from three independent experiments. The p values were assessed by Tukey’s multiple comparison test after obtaining a significant difference with two-way analysis of variance (ANOVA). (D–H) Loop extrusion assay. The error bars represent mean ± SEM. The p values shown in (F)–(H) were assessed by a two-tailed Mann–Whitney U-test. (D) Frequency of DNA loop formation by holo(WT) or holo(H-dN) (n = 3, ≥53 DNAs per condition). (E) Time-lapse images of DNA loop extrusion events by holo(WT) and holo(H-dN). DNA was stained with Sytox Orange. Scale bar, 1 μm. (F) Loop extrusion rate by holo(WT) or holo(H-dN) in the same experiment as in (E) (from three independent experiments, n = 21 and 59 for holo(WT) and holo(H-dN), respectively). (G) Duration time to maintain DNA loops by holo(WT) or holo(H-dN) in the same experiment as in (E) (from three independent experiments, n = 27 and 81 for holo(WT) and holo(H-dN), respectively). (H) Loop size produced by holo(WT) or holo(H-dN) in the same experiment as in (E) (from three independent experiments, n = 21 and 59 for holo(WT) and holo(H-dN), respectively).
-
Figure 4—source data 1
Raw data uncropped gel corresponding to Figure 4A.
- https://cdn.elifesciences.org/articles/84694/elife-84694-fig4-data1-v2.zip
-
Figure 4—source data 2
Raw data uncropped blots corresponding to Figure 4B.
- https://cdn.elifesciences.org/articles/84694/elife-84694-fig4-data2-v2.zip
-
Figure 4—source data 3
Quantitative data from three independent experiments corresponding to Figure 4C.
- https://cdn.elifesciences.org/articles/84694/elife-84694-fig4-data3-v2.xlsx
-
Figure 4—source data 4
Microsoft excel of quantitative data corresponding to Figure 4D, F, G and H.
- https://cdn.elifesciences.org/articles/84694/elife-84694-fig4-data4-v2.xlsx
Figure 4—figure supplement 1
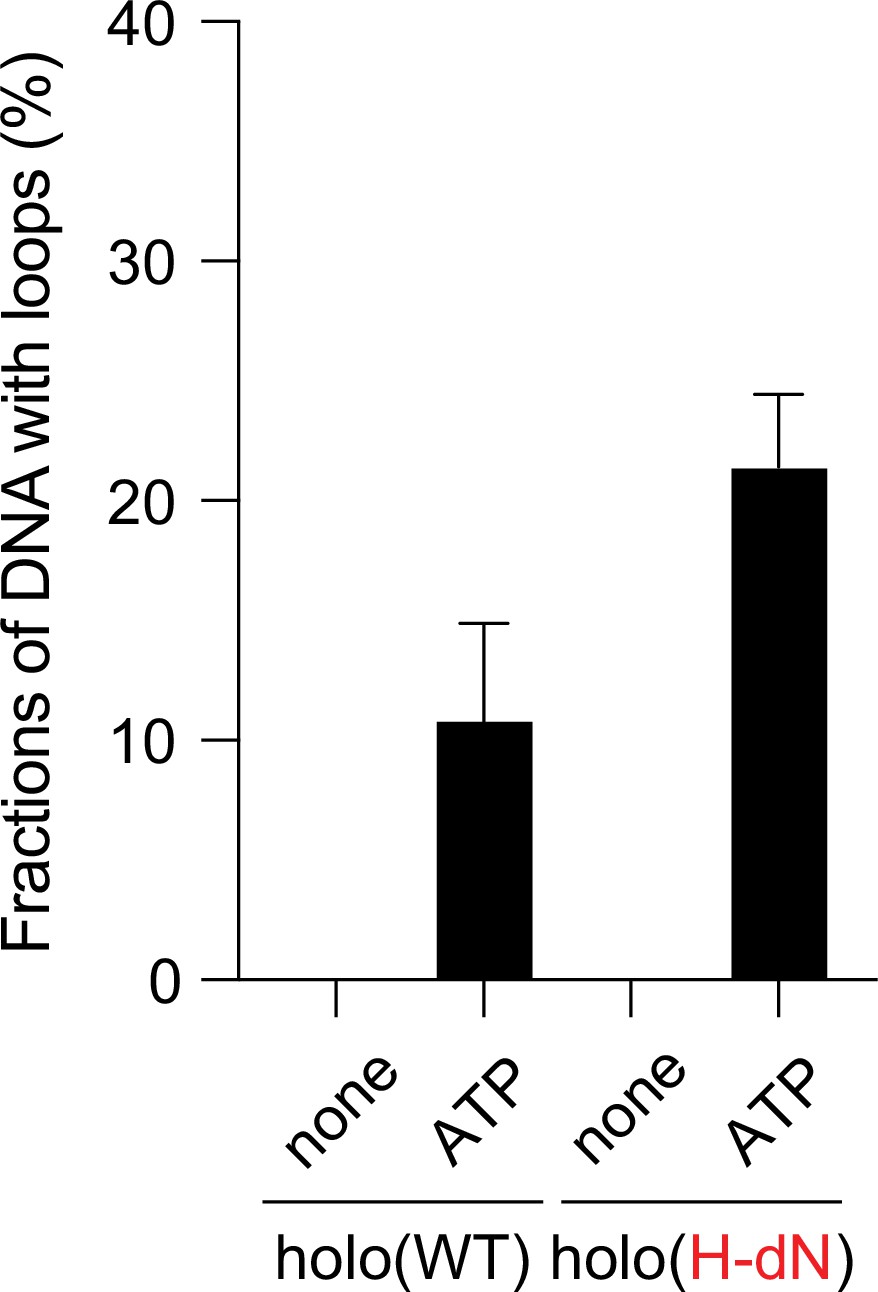
ATP dependency of the loop extrusion activities.
Frequency of DNA loop formation by holo(WT) or holo(H-dN) in the presence or absence of ATP (n = 3; ≥57 DNAs per condition). The error bars represent mean ± standard error of the mean (SEM). No loop formation was observed in the absence of ATP in either case.
-
Figure 4—figure supplement 1—source data 1
Microsoft excel of quantitative data corresponding to Figure 4—figure supplement 1.
- https://cdn.elifesciences.org/articles/84694/elife-84694-fig4-figsupp1-data1-v2.xlsx
Figure 5
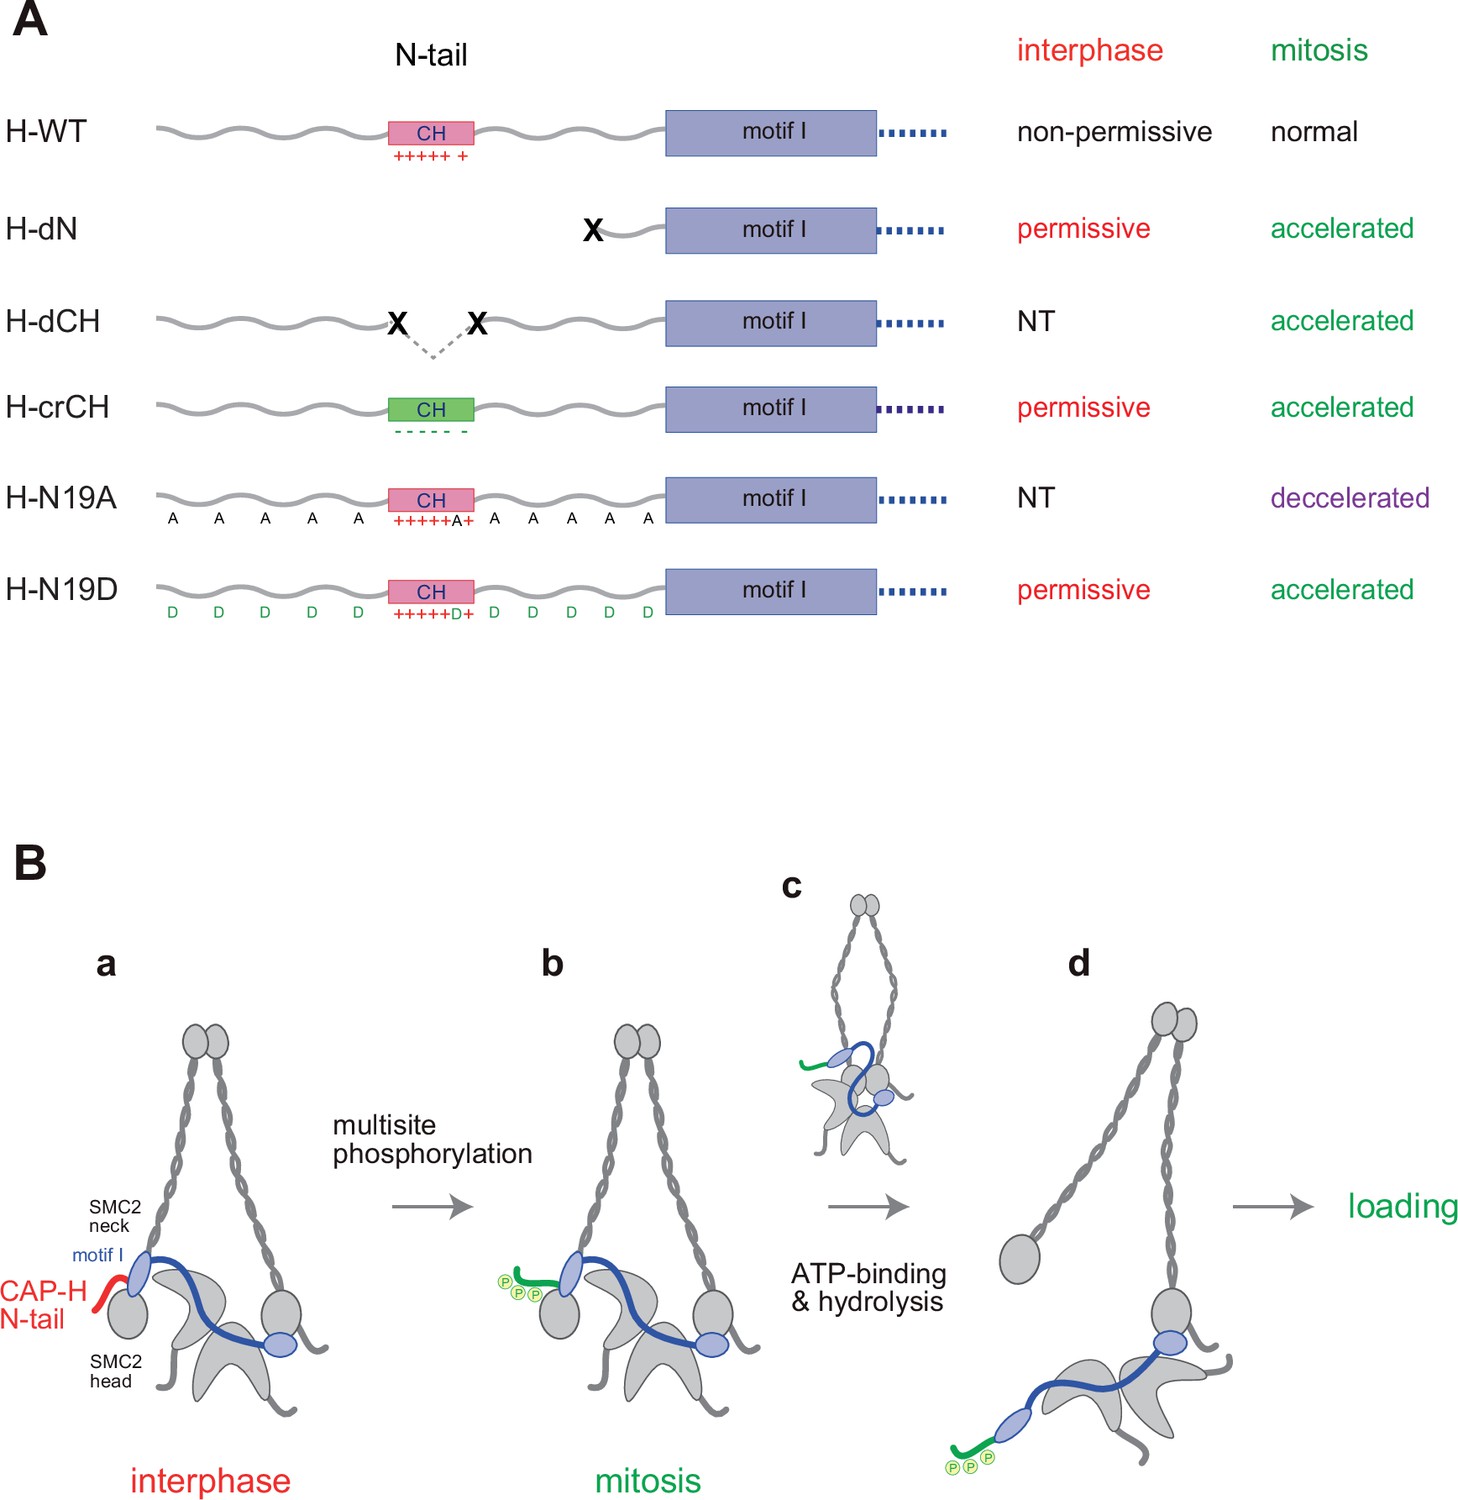
Regulation of condensin I by the N-tail of its kleisin subunit.
(A) Summary of the mutant complexes tested in the current study. NT: not tested. (B) Model of cell cycle regulation of condensin I loading. The SMC2-kleisin gate is closed when the CAP-H motif I binds to the SMC2 neck (a). In our model, this binding is stabilized by the CAP-H N-tail, thereby preventing its untimely opening during interphase. The conserved helix located in the middle of the N-tail contributes to this stabilization, possibly through direct interaction with the SMC2 head or neck. Upon mitotic entry, multisite phosphorylation of the N-tail relaxes this stabilization (b). ATP binding and hydrolysis by the SMC subunits trigger the opening of the DNA entry gate, thereby enabling condensin I to load onto chromosomes (c, d). Thus, the kleisin N-tail of vertebrate condensin I could act as a ‘gatekeeper’ of the SMC2-kleisin gate.
Tables
Key resources table
| Reagent type (species) or resource | Designation | Source or reference | Identifiers | Additional information |
|---|---|---|---|---|
| Cell line (Spodoptera frugiperda) | Sf9 insect cells | Thermo Fisher Scientific | 12659017 | |
| Cell line (Spodoptera frugiperda) | Sf9 insect cells | Thermo Fisher Scientific | B825-01 | |
| Cell line (Trichoplusia ni) | High Five insect cells | Thermo Fisher Scientific | B85502 | |
| Strain, strain background (Escherichia coli) | MAX Efficiency DH10bac Competent Cells | Thermo Fisher Scientific | 10361012 | |
| Biological sample (Xenopus laevis) | Xenopus laevis eggs | Hamamatsu Seibutsu-Kyozai | RRID:NXR_0031 | Female, adult frogs |
| Biological sample (Mus musculus) | Mus musculus sperm nuclei | Mus musculus cauda epididymis (BALB/c×C57BL/6J)F1; Shintomi et al., 2017 | N/A | Male, adult mice |
| Antibody | anti-XSMC4 (rabbit polyclonal) | Hirano and Mitchison, 1994 | In-house: AfR8L | WB (2 μg/ml) |
| Antibody | anti-XSMC2 (rabbit polyclonal) | Hirano and Mitchison, 1994 | In-house: AfR9-6 | WB (1 μg/ml) |
| Antibody | anti-XSMC2 (rabbit polyclonal, biotin-labeled) | Hirano and Mitchison, 1994 | In-house: AfR9 | IF (1 μg/ml) |
| Antibody | anti-XCAP-D2 (rabbit polyclonal) | Hirano et al., 1997 | In-house: AfR16L | WB (1 μg/ml) |
| Antibody | anti-XCAP-G (rabbit polyclonal) | Hirano et al., 1997 | In-house: AfR11-3L | WB (1 μg/ml) |
| Antibody | anti-XCAP-H (rabbit polyclonal) | Hirano et al., 1997 | In-house: AfR18 | WB (0.7 μg/ml) |
| Antibody | anti-XCAP-D3 (rabbit polyclonal) | Ono et al., 2003 | In-house: AfR196-2L | WB (1 μg/ml) |
| Antibody | anti-mSMC4 (rabbit polyclonal) | Lee et al., 2011 | In-house: AfR326-3L | WB (1 μg/ml); IF (1 μg/ml) |
| Antibody | anti-mSMC2 (rabbit polyclonal) | Lee et al., 2011 | In-house: AfR329-4L | WB (1 μg/ml) |
| Antibody | anti-hCAP-D2 (rabbit polyclonal) | Kimura et al., 2001 | In-house: AfR51-3 | WB (1 μg/ml) |
| Antibody | anti-hCAP-G (rabbit polyclonal) | Kimura et al., 2001 | In-house: AfR55-4 | WB (1 μg/ml); IP (refer to Materials and methods) |
| Antibody | anti-hCAP-H (rabbit polyclonal) | Kimura et al., 2001 | In-house: AfR57-4 | WB (1 μg/ml) |
| Antibody | anti-XTopo IIa (rabbit antiserum) | Hirano and Mitchison, 1993 | In-house: αC1-6 | WB (1/2000) |
| Antibody | anti-hCAP-H pS17 (hHP1) (rabbit polyclonal) | This paper; custom ordered from SIGMA Genosys | In-house: AfR464-3P | WB (1 μg/ml) |
| Antibody | anti-hCAP-H pS76 (hHP2) (rabbit polyclonal) | This paper; custom ordered from SIGMA Genosys | In-house: AfR470-3P | WB (1 μg/ml) |
| Antibody | anti-hCAP-D2 pT1339 (hDP1) (rabbit polyclonal) | This paper | In-house: AfR173-4P | WB (1 μg/ml) |
| Antibody | anti-hCAP-D2 pT1384 (hDP2) (rabbit polyclonal) | This paper | In-house: AfR175-4P | WB (1 μg/ml) |
| Antibody | anti-hCAP-D2 pT1389 (hDP3) (rabbit polyclonal) | This paper | In-house: AfR177-4P | WB (1 μg/ml) |
| Antibody | Alexa Fluor 568-conjugated anti-rabbit IgG | Thermo Fisher Scientific | A11036 [RRID: AB_10563566] | IF (1/500) |
| Antibody | Horseradish peroxidase-conjugated anti-rabbit IgG | Vector Laboratories | PI-1000 [RRID: AB_2336198] | WB (1/10,000) |
| Peptide, recombinant protein | hHP1 | This paper; custom ordered from SIGMA Genosys | [C]PHSASpSPSERV | |
| Peptide, recombinant protein | hHP2 | This paper; custom ordered from SIGMA Genosys | [C]PRLLApSPSSRS | |
| Peptide, recombinant protein | Precission Protease | Cytiva | 27-0843-01 | Used in purification of recombinant condensin I; Kinoshita et al., 2022 |
| Peptide, recombinant protein | Benzonase nuclease | Novagen | 71205 | Used in purification of recombinant condensin I; Kinoshita et al., 2022 |
| Peptide, recombinant protein | λ Protein Phosphatase | New England Biolabs | P0753S | |
| Peptide, recombinant protein | Nt.BspQI nicking endonuclease | New England Biolabs | R0644S | |
| Peptide, recombinant protein | EcoRI restriction enzyme | TaKaRa Bio | 1040A | |
| Peptide, recombinant protein | Serotropin (PMSG) | ASKA Pharmaceutical Co, Ltd | Used in preparation of HSS; Shintomi and Hirano, 2018 | |
| Peptide, recombinant protein | Gonatropin (HCG) | ASKA Pharmaceutical Co, Ltd | Used in preparation of HSS; Shintomi and Hirano, 2018 | |
| Recombinant DNA reagent | pUC19 | Genbank: L9137 | RRID: Addgene_50005 | |
| Recombinant DNA reagent | λDNA | New England Biolabs | N3011S | |
| Sequence-based reagent | hCAP-H (CH) deletion-F | This paper | Forward primer | GAACGACTTCTCTACCGACTCTCCC |
| Sequence-based reagent | hCAP-H (CH) deletion-R | This paper | Reverse primer | GTAGAGAAGTCGTTCTGAGGGAAGTC |
| Sequence-based reagent | hCAP-H (WT and dN) forward | This paper | Forward primer | GAAGCGCGCGGAATTCGCCA |
| Sequence-based reagent | hCAP-H (WT) reverse | This paper | Reverse primer | GAAGTACAGGTCCTCAGTGGTAGGTT CCAGGTCGCCCTGCCTAACTAA |
| Sequence-based reagent | hCAP-H (dN) reverse | This paper | Reverse primer | GAAGTACAGGTCCTCAGTGGTAGGTT CCAGGTCGCCCTGCCTGACTAA |
| Sequence-based reagent | HaloTag forward | This paper | Forward primer | GAGGACCTGTACTTCCAGTCTGACAAC GACATGGCCGAAATCGGAACT |
| Sequence-based reagent | HaloTag reverse | This paper | Reverse primer | AGCGGCCGCGACTAGTTTATC CGCTGATTTCCAGGGTA |
| Commercial assay or kit | PrimeSTAR Mutagenesis Basal Kit | TaKaRa Bio | R046A | |
| Commercial assay or kit | In-Fusion HD Cloning Kit | TaKaRa Bio | 639650 | |
| Commercial assay or kit | Nucleobond PC100 | MACHERREY-NAGEL GmbH & Co KG | 740573.100 | |
| Chemical compound, drug | Cytochalasin D | Sigma-Aldrich | C8273 | Used in preparation of HSS; Shintomi and Hirano, 2018 |
| Chemical compound, drug | ATP | Sigma-Aldrich | A2383 | |
| Chemical compound, drug | AMP-PNP | Jena Bioscience | NU-407 | |
| Software, algorithm | UNICORN7 | Cytiva | ||
| Software, algorithm | Prism 8 | GraphPad | ||
| Software, algorithm | Olympus cellSens Dimensions | Olympus | ||
| Software, algorithm | Excel | Microsoft | ||
| Software, algorithm | Photoshop | Adobe | ||
| Software, algorithm | ImageJ | https://imagej.nih.gov/ij | ||
| Other | Immobilon Western Chemiluminescent HRP Substrate | Millipore | WBKLS500 | Used detection of immunoblots |
| Other | Alexa Fluor 488-conjugated streptavidin | Thermo Fisher Scientific | S11223 | IF (1/500) |
| Other | Streptavidin | Merck | S4762 | 1 mg/ml (Loop extrusion assay) |
| Other | HaloTag Alexa Fluor 488 Ligand | Promega | G1001 | |
| Other | PD-10 column | Cytiva | 17-0851-01 | |
| Other | Dynabeads Protein A | Thermo Fisher Scientific | 10002D | For immunodepletion with HSS and immunoprecipitation in topological loading assay |
| Other | rProtein A Sepharose Fast Flow | Cytiva | 17-1279-01 | For immunoprecipitation with HSS |
| Other | Glutathione Sepharose 4B | Cytiva | 17075601 | Used in purification of recombinant condensin I; Kinoshita et al., 2022 |
| Other | HiTrap Q HP 1 ml | Cytiva | 17115301 | Used in purification of recombinant condensin I; Kinoshita et al., 2022 |
| Other | Amicon Ultra-15 | Millipore | UFC905024 | Used in ultrafiltration of purified condensin I; Kinoshita et al., 2022 |
| Other | DAPI | Roche | 10236276001 | IF (2 μg/ml) |
| Other | GelRed | Biotium | 41003 | |
| Other | Sytox Orange | Thermo Fisher Scientific | S11368 |
Additional files
Download links
A two-part list of links to download the article, or parts of the article, in various formats.
Downloads (link to download the article as PDF)
Open citations (links to open the citations from this article in various online reference manager services)
Cite this article (links to download the citations from this article in formats compatible with various reference manager tools)
Cell cycle-specific loading of condensin I is regulated by the N-terminal tail of its kleisin subunit
eLife 11:e84694.
https://doi.org/10.7554/eLife.84694


