A toxin-mediated policing system in Bacillus optimizes division of labor via penalizing cheater-like nonproducers
- Jiangsu Provincial Key Lab of Solid Organic Waste Utilization, Jiangsu Collaborative Innovation Center of Solid Organic Wastes, Nanjing Agricultural University, China
- State Key Laboratory of Efficient Utilization of Arid and Semi-arid Arable Land in Northern China, Institute of Agricultural Resources and Regional Planning, Chinese Academy of Agricultura Sciences, China
- National Engineering Research Center for Efficient Utilization of Soil and Fertilizer Resources, College of Resources and Environment, Shandong Agricultural University, China
Figures
Figure 1 with 1 supplement

Expression of ECM production and BAs biosynthesis/immunity were located in the same subpopulation.
Fluorescence emission patterns of double-labeled strains. Colony cells of different double-labeled strains were visualized using CLSM to monitor the distribution of fluorescence signals from different reporters. Peps-mCherry and PtapA-mCherry were used to indicate cells expressing extracellular polysaccharides (EPS) and TasA fibers production, respectively; PbnaF-gfp and PbnaAB-gfp were used to indicate cells expressing BAs synthesis and self-immunity, respectively. The bar represents 5 μm.
Figure 1—figure supplement 1
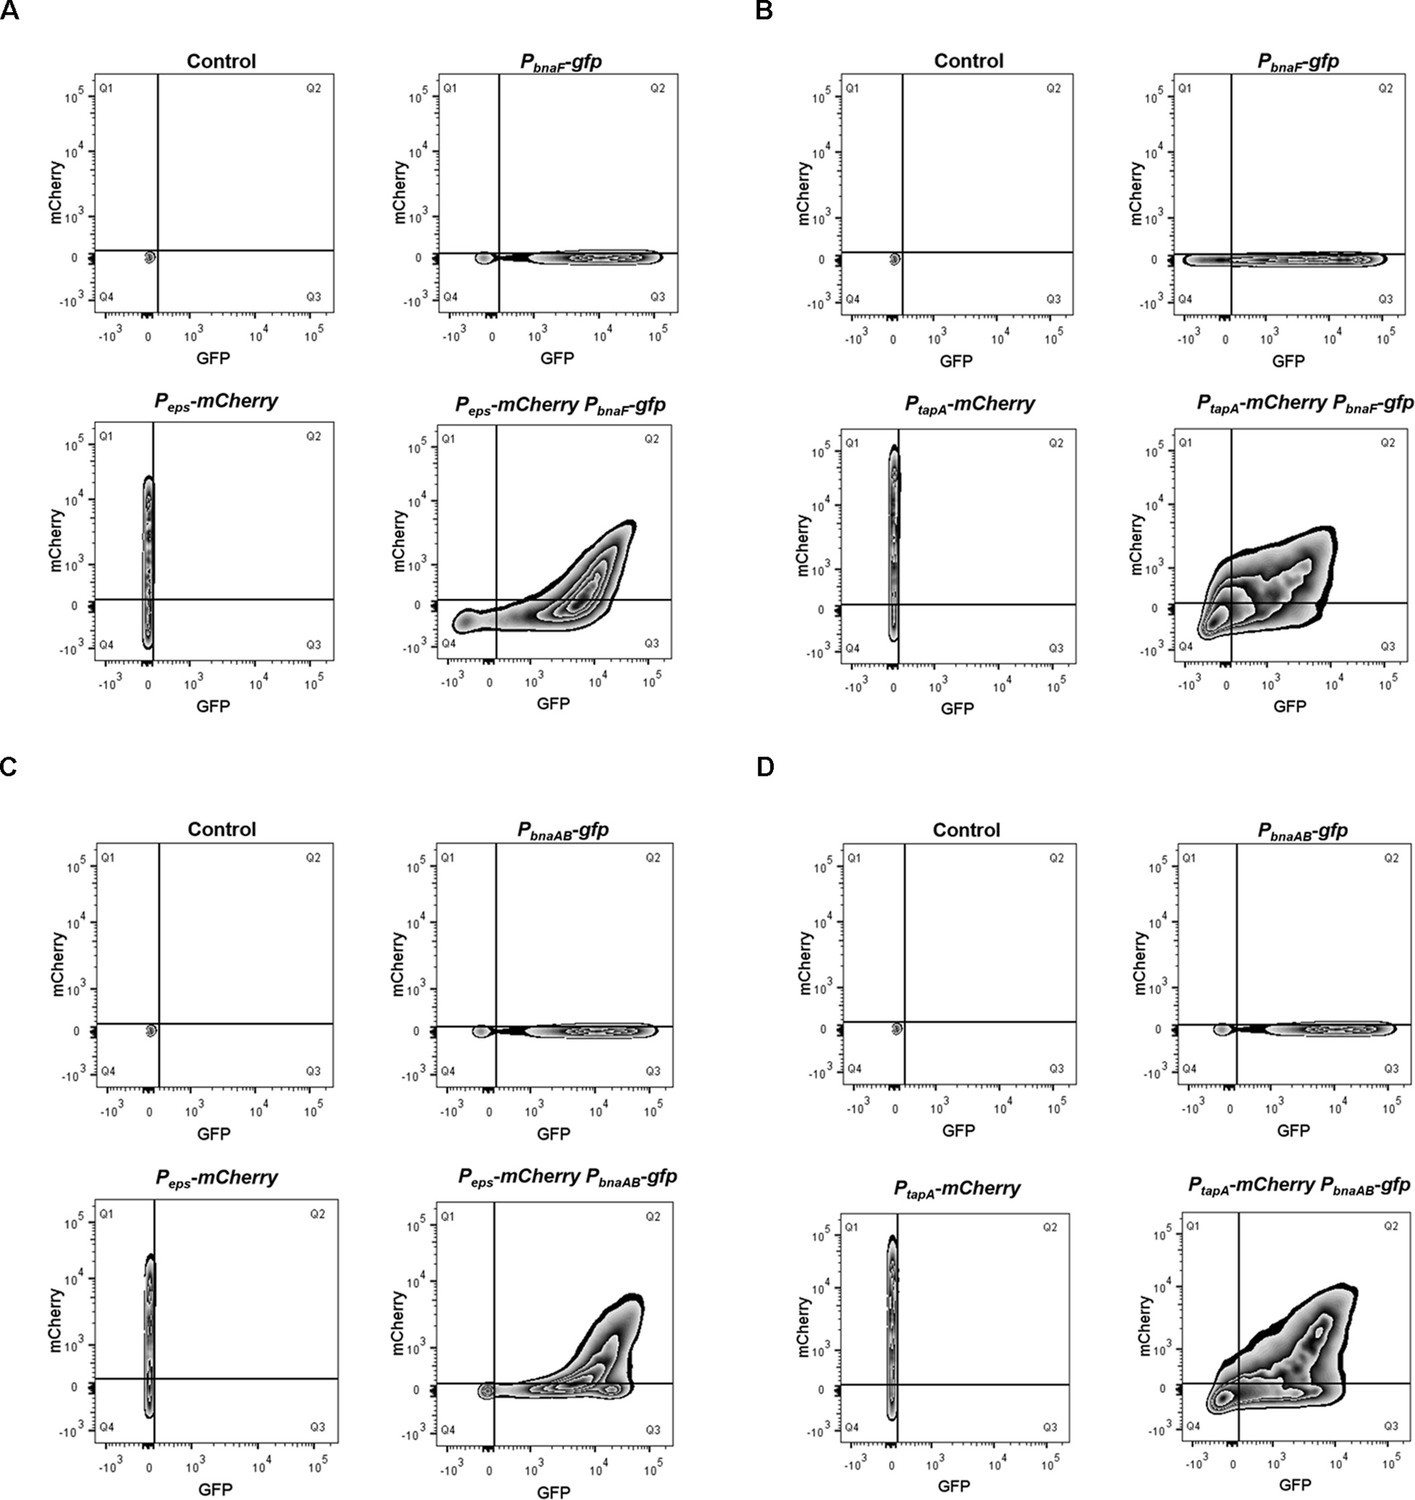
Quantification of fluorescence emission patterns of double-labeled strains.
(A) Flow cytometry monitoring the subfractions of extracellular polysaccharides (EPS)-producing cells (Peps-mCherry) and BAs-producing cells (PbnaF-gfp). Peps-mCherry: strain harboring only the Peps-mCherry reporter. PbnaF-gfp: strain harboring only the PbnaF-gfp reporter. Peps-mCherry PbnaF-gfp: double-labeled strain Peps-mCherry PbnaF-gfp. (B) Flow cytometry monitoring the subfractions of TasA-producing cells (PtapA-mCherry) and BAs-producing cells (PbnaF-gfp). PtapA-mCherry: strain harboring only the PtapA-mCherry reporter. PbnaF-gfp: strain harboring only the PbnaF-gfp reporter. PtapA-mCherry PbnaF-gfp: double-labeled strain PtapA-mCherry PbnaF-gfp. (C) Flow cytometry monitoring the subfractions of EPS-producing cells (Peps-mCherry) and immune cells (PbnaAB-gfp). Peps-mCherry: strain harboring only the Peps-mCherry reporter. PbnaAB-gfp: strain harboring only the PbnaAB-gfp reporter. Peps-mCherry PbnaAB-gfp: double-labeled strain Peps-mCherry PbnaAB-gfp. (D) Flow cytometry monitoring the subfractions of TasA-producing cells (PtapA-mCherry) and immune cells (PbnaAB-gfp). PtapA-mCherry: strain harboring only the PtapA-mCherry reporter. PbnaAB-gfp: strain harboring only the PbnaAB-gfp reporter. PtapA-mCherry PbnaAB-gfp: double-labeled strain PtapA-mCherry PbnaAB-gfp. Fluorescence intensity for the GFP channel is presented on the x-axis, and for the mCherry channel is presented on the y-axis. Control: wild-type strain expressing no fluorescence protein. The total cell number observed for each strain was 20,000.
Figure 2 with 5 supplements
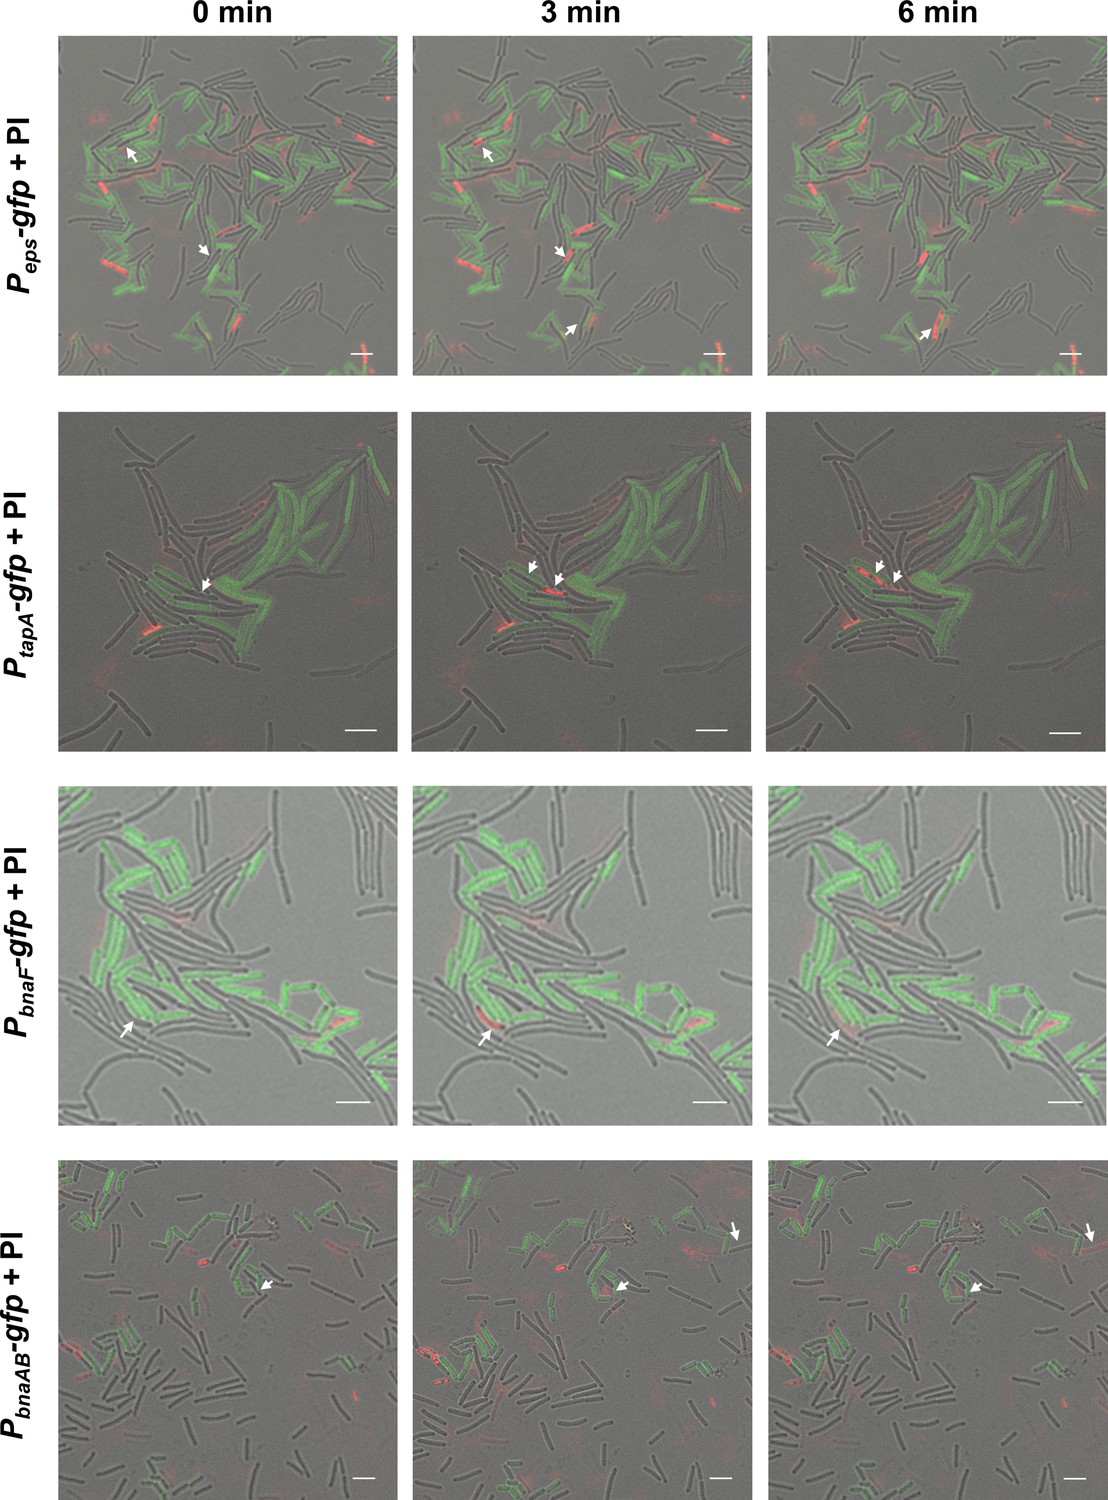
ECM and BAs producing subpopulations eliminated the nonproducing cheaters.
The time-lapse experiment for observing the source and distribution of dead cells. Colony cells of different gfp-labeled strains were stained with propidium iodide (PI, a red-fluorescent dye for labeling dead cells) for 15 min, and then visualized by a CLSM to monitor the distribution of fluorescence signal from reporters and the PI dye. ‘0 min’ represents the time point at which cells are alive as shown by the arrow, ‘3 min’ or ‘6 min’ is the time point afterward, and the cells at the arrow die or even break apart. Peps-gfp and PtapA-gfp were used to indicate cells expressing extracellular polysaccharides (EPS) and TasA fibers production, respectively; PbnaF-gfp and PbnaAB-gfp were used to indicate cells expressing BAs synthesis and self-immunity, respectively. The total number of cells is 198 for strain SQR9-Peps-gfp, 71 for strain SQR9-PtasA-gfp, 88 for strain SQR9-PbnaF-gfp, and 162 for strain SQR9-PbnaAB-gfp. The bar represents 5 μm.
Figure 2—figure supplement 1
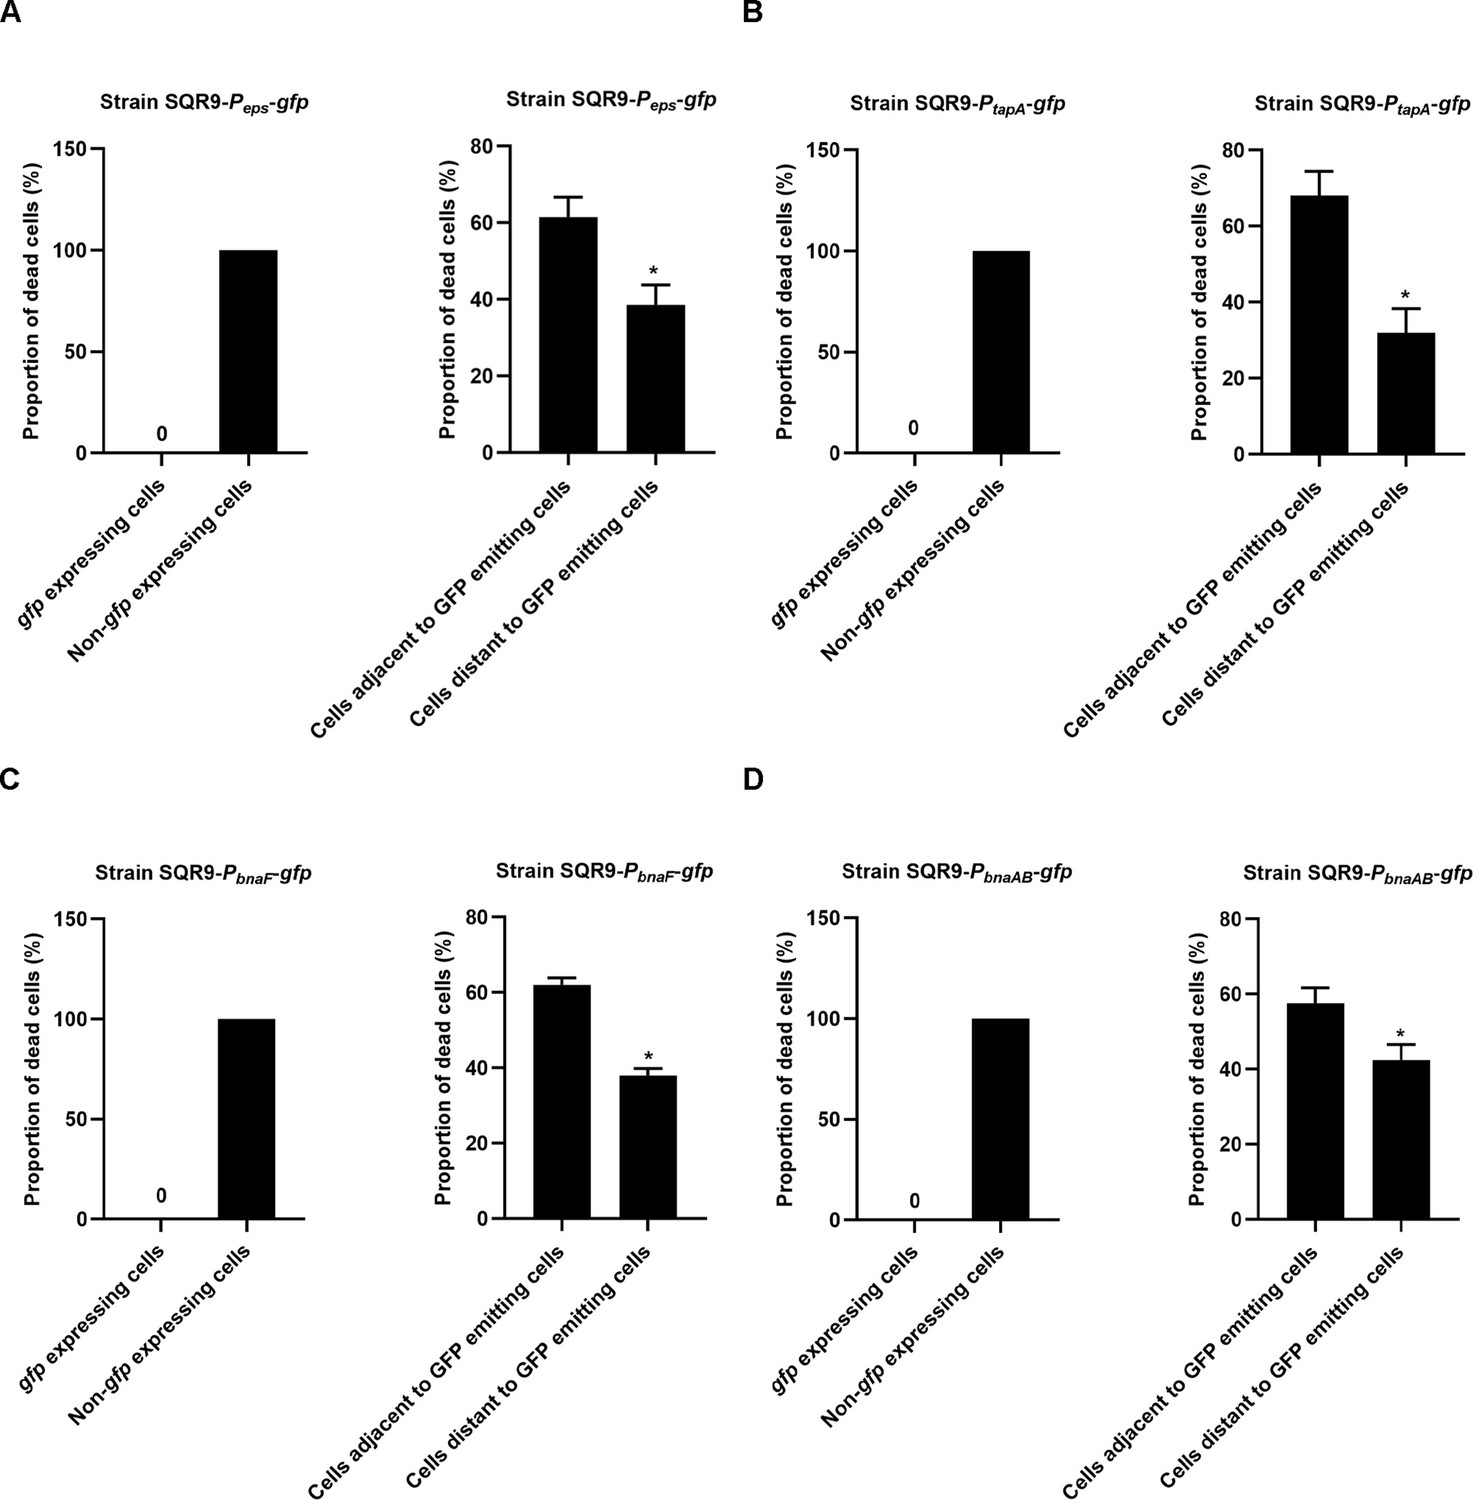
Quantification of the source and location of dead cells newly appeared during 3 hr observation.
The statistical objects were newly emerged dead cells during 3 hr observation. Proportion of dead cells that originated from gfp or non-gfp expressing cells are shown on the left panel, proportion of dead cells around cells that emit (or do not emit) GFP is showed on right panel of each figure. (A) is the proportion of dead cells in biofilm formed by strain SQR9-Peps-gfp. (B) is the proportion of dead cells in biofilm formed by strain SQR9-PtapA-gfp. (C) is the proportion of dead cells in biofilm formed by strain SQR9-PbnaF-gfp. (D) is the proportion of dead cells in biofilm formed by strain SQR9-PbnaAB-gfp. Data are means and standard deviations from three biological replicates, and columns with * are statistically different according to Student’s t-test (p<0.05).
Figure 2—video 1
Dynamic observation of extracellular polysaccharides (EPS)-producing cells and dead cells in B. velezensis SQR9 community during biofilm formation.
Colony cells of SQR9-Peps-gfp was stained with propidium iodide (PI, a red-fluorescent dye for labeling dead cell) for 15 min, and then visualized by a CLSM to monitor the distribution of fluorescence signal from the reporter and the PI dye. The video iconsists of pictures obtained during 3 hr after treatment (each picture retains 2 s). The bar represents 5 μm.
Figure 2—video 2
Dynamic observation of TasA fibers-producing cells and dead cells in B. velezensis SQR9 community during biofilm formation.
Colony cells of SQR9-PtapA-gfp was stained with PI for 15 min, and then visualized by a CLSM to monitor the distribution of fluorescence signal from the reporter and the PI dye. The video consists of pictures obtained during 3 hr after treatment (each picture retains 2 s). The bar represents 5 μm.
Figure 2—video 3
Dynamic observation of BAs-producing cells and dead cells in B. velezensis SQR9 community during biofilm formation.
Colony cells of SQR9-PbnaF-gfp was stained with PI for 15 min, and then visualized by a CLSM to monitor the distribution of fluorescence signal from the reporter and the PI dye. The video consists of pictures obtained during 3 hr after treatment (each picture retains 2 s). The bar represents 5 μm.
Figure 2—video 4
Dynamic observation of BAs-immunity cells and dead cells in B. velezensis SQR9 community during biofilm formation.
Colony cells of SQR9-PbnaAB-gfp was stained with PI for 15 min, and then visualized by a CLSM to monitor the distribution of fluorescence signal from reporter and the PI dye. The video consists of pictures obtained during 3 hr after treatment (each picture retains 2 s). The bar represents 5 μm.
Figure 3 with 2 supplements
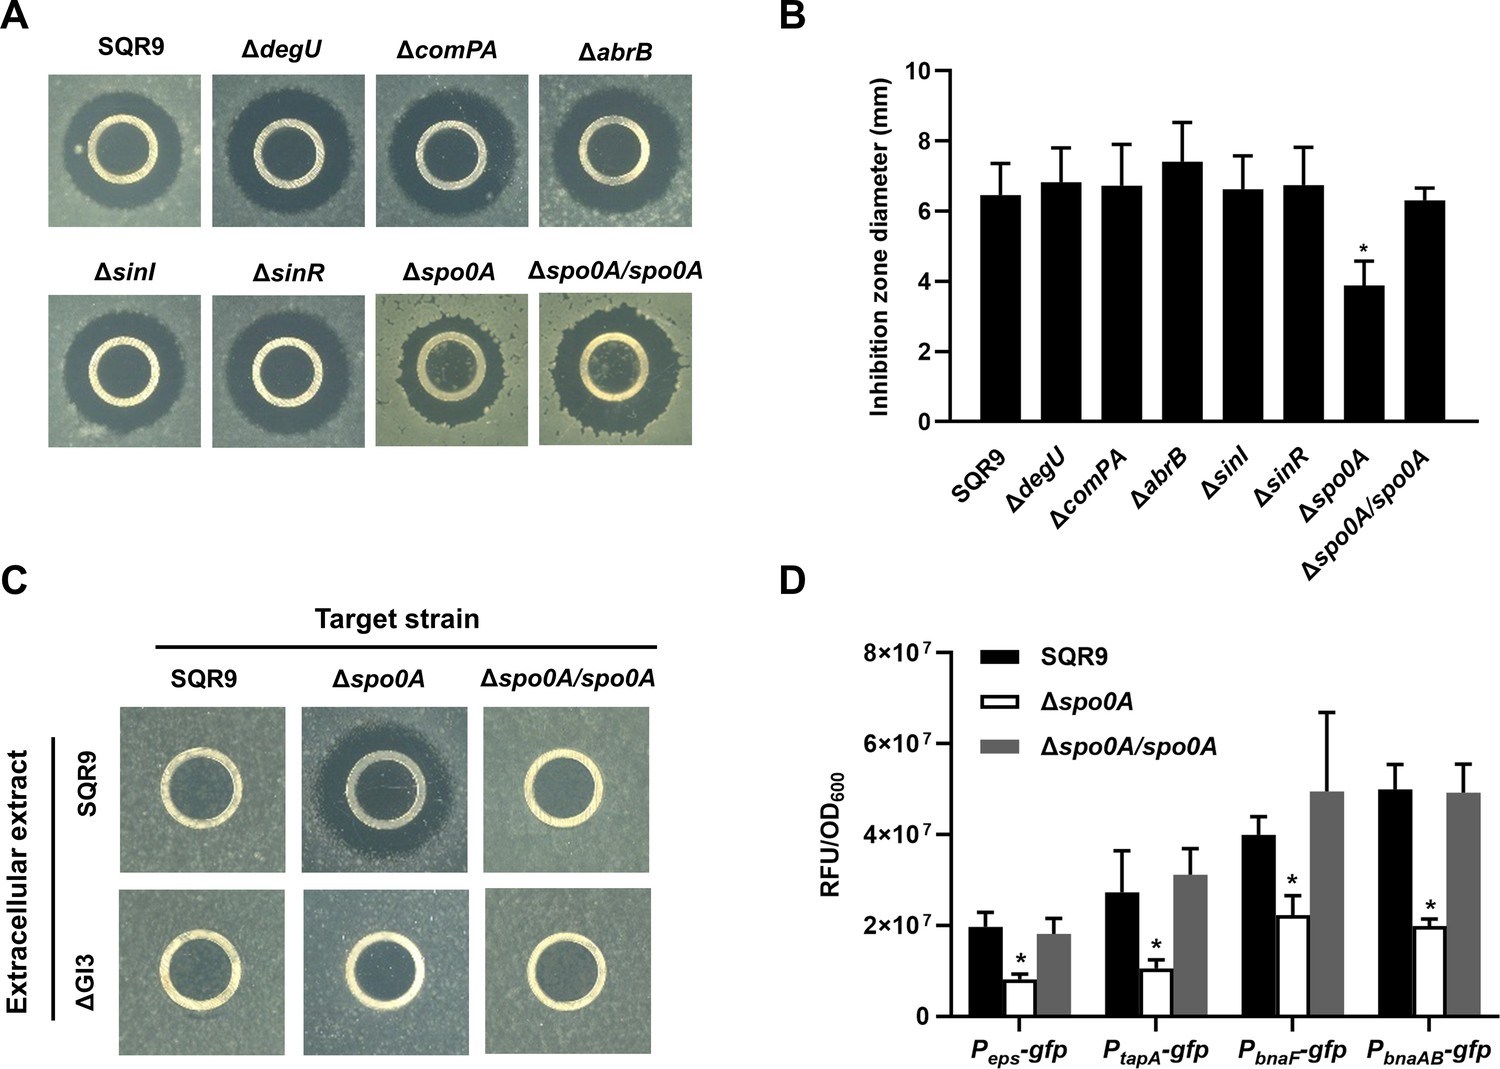
Spo0A is the co-regulator for triggering ECM production and BAs synthesis/immunity.
(A) Oxford cup assay. Inhibition of the lawn of B. velezensis FZB42 by the BAs extract of wild-type SQR9, its different mutants altered in ECM production, and complementary strain Δspo0A/spo0A. (B) Quantification of inhibition zone. Diameter of the inhibition zones is observed in (A). (C) Oxford cup assay. Sensitivity of wild-type SQR9, Δspo0A, and Δspo0A/spo0A (as the lawn) to the extracellular extract of SQR9 and its mutant ΔGI3 that disable BAs synthesis. (D) Quantification of fluorescence in liquid culture. The expression level of eps, tapA, bnaF, and bnaAB in wild-type SQR9, Δspo0A, and Δspo0A/spo0A, as monitored by using gfp reporters fused to the corresponding promoters. Data are means and standard deviations from three biological replicates. * indicates a significant difference with the Control (SQR9) column as analyzed by Student’s t-test (p<0.05).
-
Figure 3—source data 1
Related to Figure 3B.
- https://cdn.elifesciences.org/articles/84743/elife-84743-fig3-data1-v2.xlsx
-
Figure 3—source data 2
Related to Figure 3D.
- https://cdn.elifesciences.org/articles/84743/elife-84743-fig3-data2-v2.xlsx
Figure 3—figure supplement 1
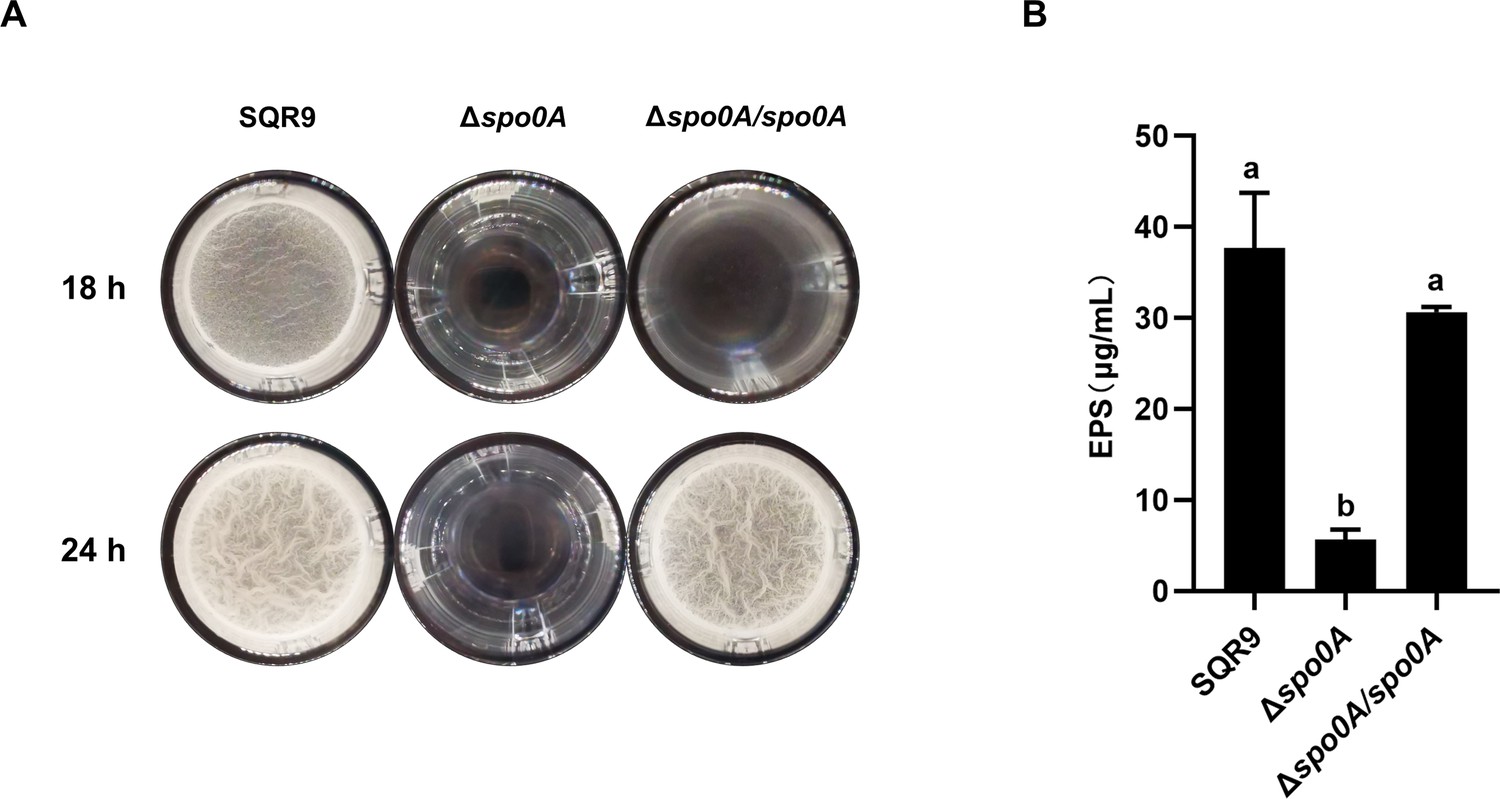
The biofilm formation and EPS production were seriously impaired in Δspo0A.
Pellicle formation (A) and extracellular polysaccharides (EPS) production (B) by wild-type SQR9, Δspo0A, and Δspo0A/spo0A. Columns with different letters are statistically different according to the Duncan’s multiple range test (n=3, p<0.05).
Figure 3—figure supplement 2
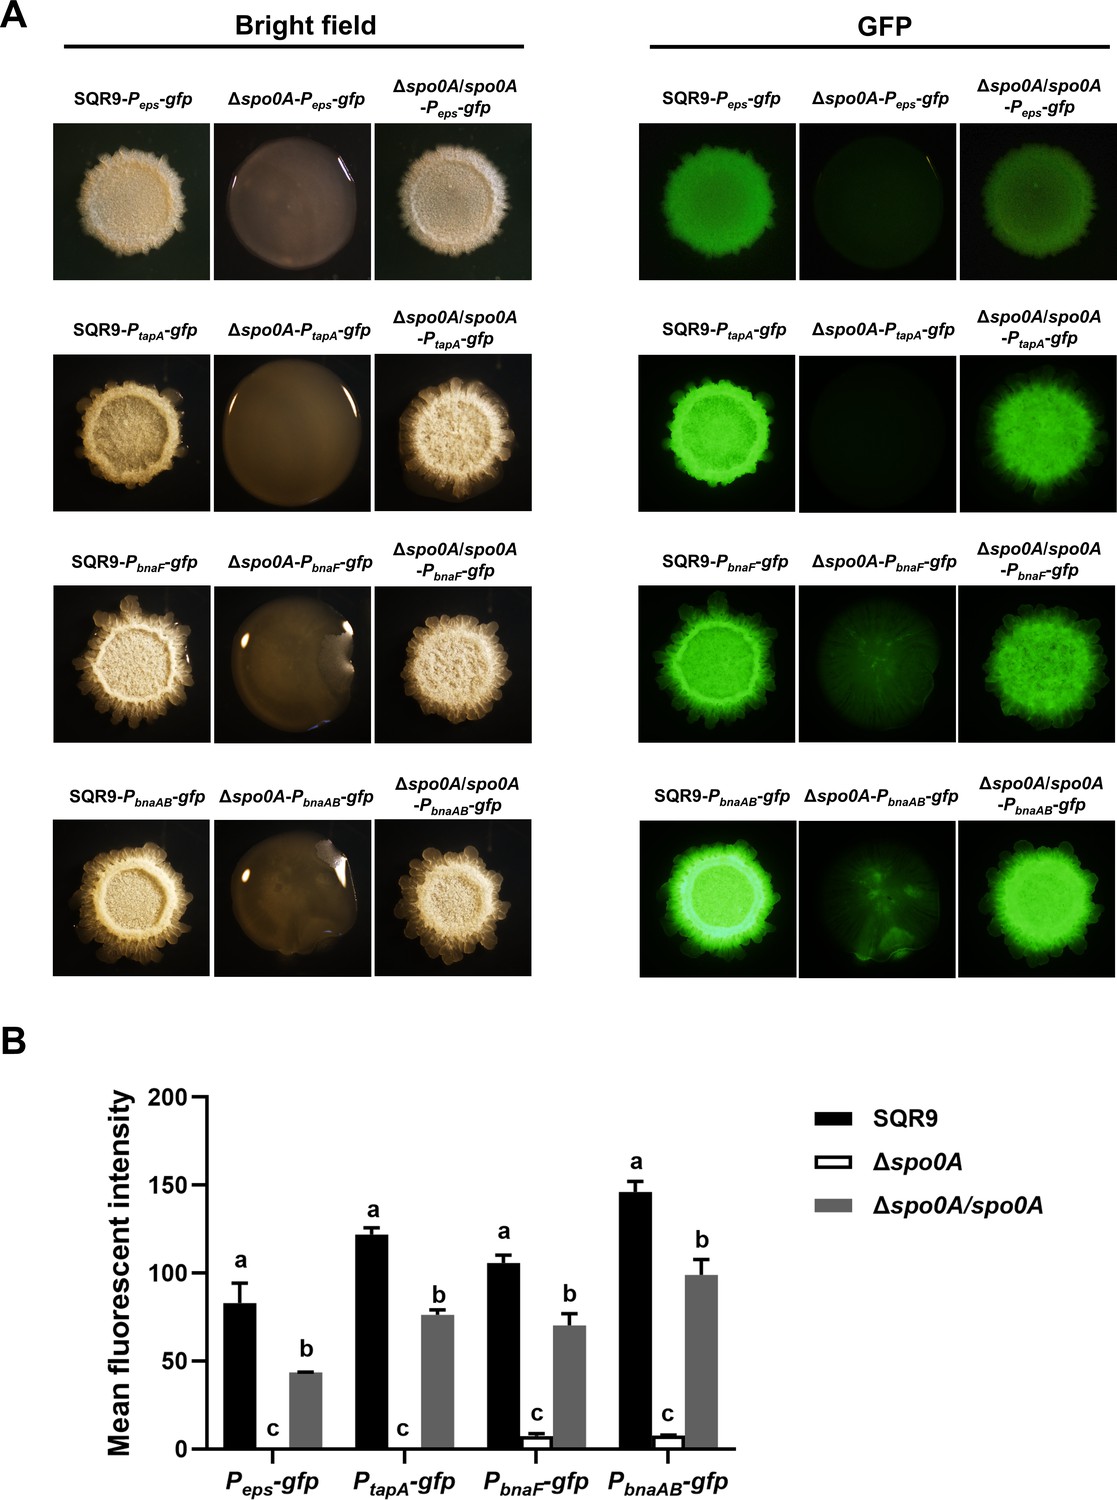
Expression level of eps, tapA, bnaF, and bnaAB in the colony cells of wild-type SQR9, Δspo0A, and Δspo0A/spo0A, as monitored by using gfp reporters fused to the corresponding promoters.
(A) Colony fluorescence. Colonies were observed under both bright field and GFP channels, to monitor the fluorescence of Peps-gfp, PtapA-gfp, PbnaF-gfp, and PbnaAB-gfp reporters in different strains. The bar represents 1 mm. (B) Quantification of colony fluorescence. The mean fluorescent intensity of different gfp reporters as observed in (A). Data are means and standard deviations from three biological replicates. Columns with different letters in the same group are statistically different according to the Duncan’s multiple range test (p<0.05).
Figure 4 with 5 supplements
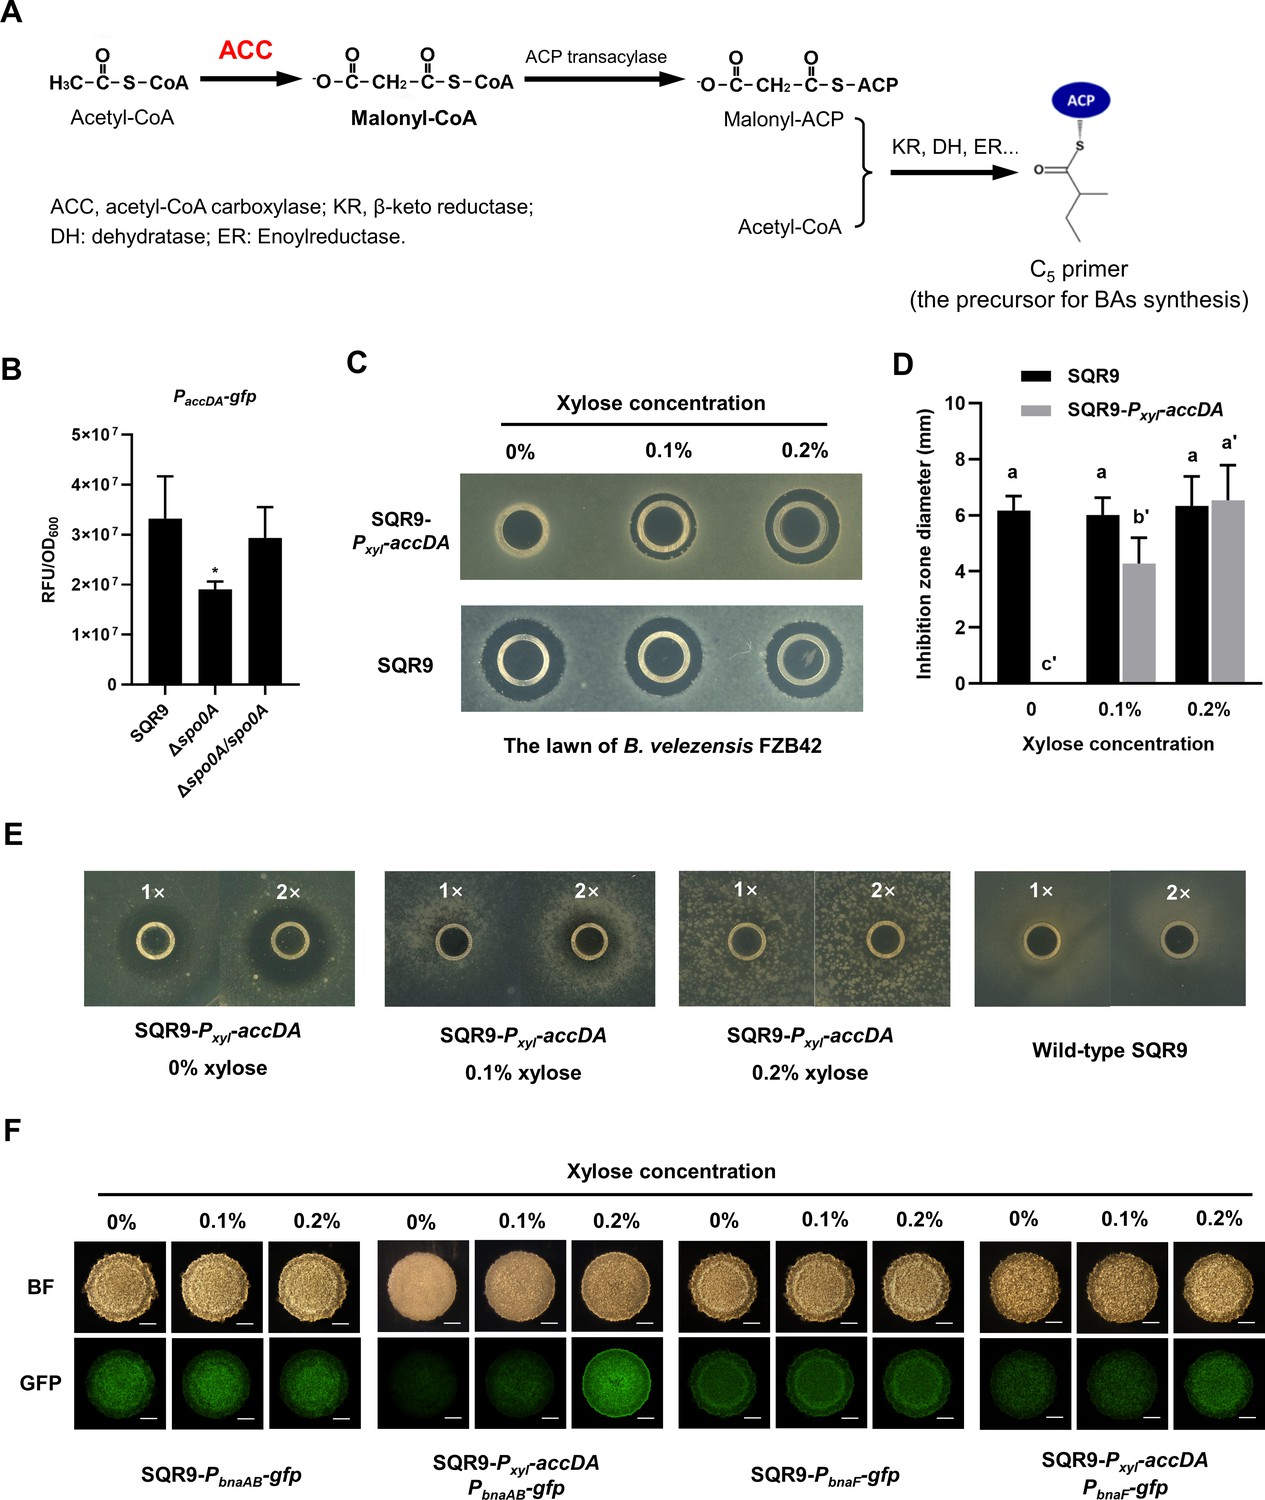
Spo0A activates ACC for BAs synthesis and self-immunity.
(A) Involvement of ACC in the biosynthesis of BAs in B. velezensis SQR9. ACC catalyzes acetyl-CoA to generate malonyl-CoA, which is transformed to malonyl-ACP under the catalyzation of ACP transacylase; then malonyl-ACP and acetyl-CoA are aggregated into a C5 primer, the precursor for BAs synthesis. (B) Quantification of fluorescence in liquid culture. The expression level of accDA in wild-type SQR9, Δspo0A, and Δspo0A/spo0A, as monitored by using the PaccDA-gfp reporter. (C) Oxford cup assay. Inhibition of the lawn of B. velezensis FZB42 by the BAs extract of wild-type SQR9 and SQR9-Pxyl-accDA, with the addition of different concentrations of xylose (0%, 0.1%, and 0.2%). (D) Quantification of inhibition zone. Diameter of the inhibition zones is observed in (C). (E) Oxford cup assay. Sensitivity of wild-type SQR9 and SQR9-Pxyl-accDA (as the lawn) to the BAs extract of SQR9 (100 μL (1x) or 200 μL (2x)), with the addition of different concentrations of xylose (0%, 0.1%, and 0.2%). (F) Colony fluorescence. Expression of bnaF and bnaAB in the colony cells of wild-type SQR9 and SQR9-Pxyl-accDA, with the addition of different concentrations of xylose (0%, 0.1%, and 0.2%). Colonies were observed under both bright fields (BF in the figure) and GFP channel, to monitor the fluorescence of PbnaF-gfp and PbnaAB-gfp reporters in different strains. The bar represents 1 mm. Data are means and standard deviations from three biological replicates. * in (B) indicates a significant difference (p<0.05) with the Control (SQR9) column as analyzed by Student’s t-test; columns with different letters in (D) are statistically different according to Duncan’s multiple range test (‘a’ for wild-type SQR9 under different concentrations of xylose and ‘a'’ for SQR9-Pxyl-accDA; p<0.05).
-
Figure 4—source data 1
Related to Figure 4B.
- https://cdn.elifesciences.org/articles/84743/elife-84743-fig4-data1-v2.xlsx
-
Figure 4—source data 2
Related to Figure 4D.
- https://cdn.elifesciences.org/articles/84743/elife-84743-fig4-data2-v2.xlsx
Figure 4—figure supplement 1
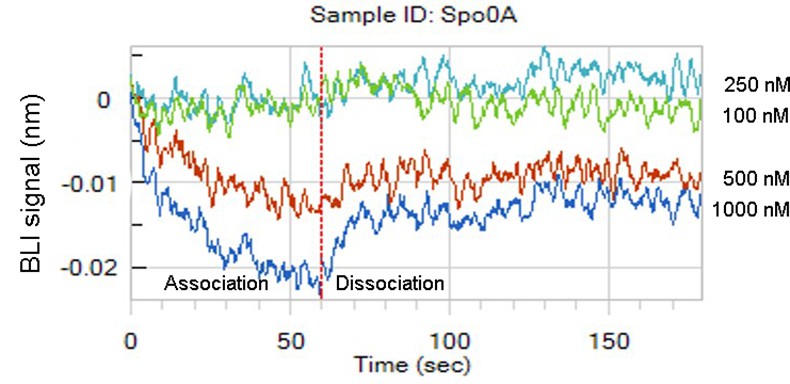
Interaction between the purified protein Spo0A and the promoter of bnaF (PbnaF) as determined by Biolayer interferometry data (BLI).
Different concentrations of Spo0A (100, 250, 500, and 1000 nM) were chosen to test interaction with PbnaF.
Figure 4—figure supplement 2
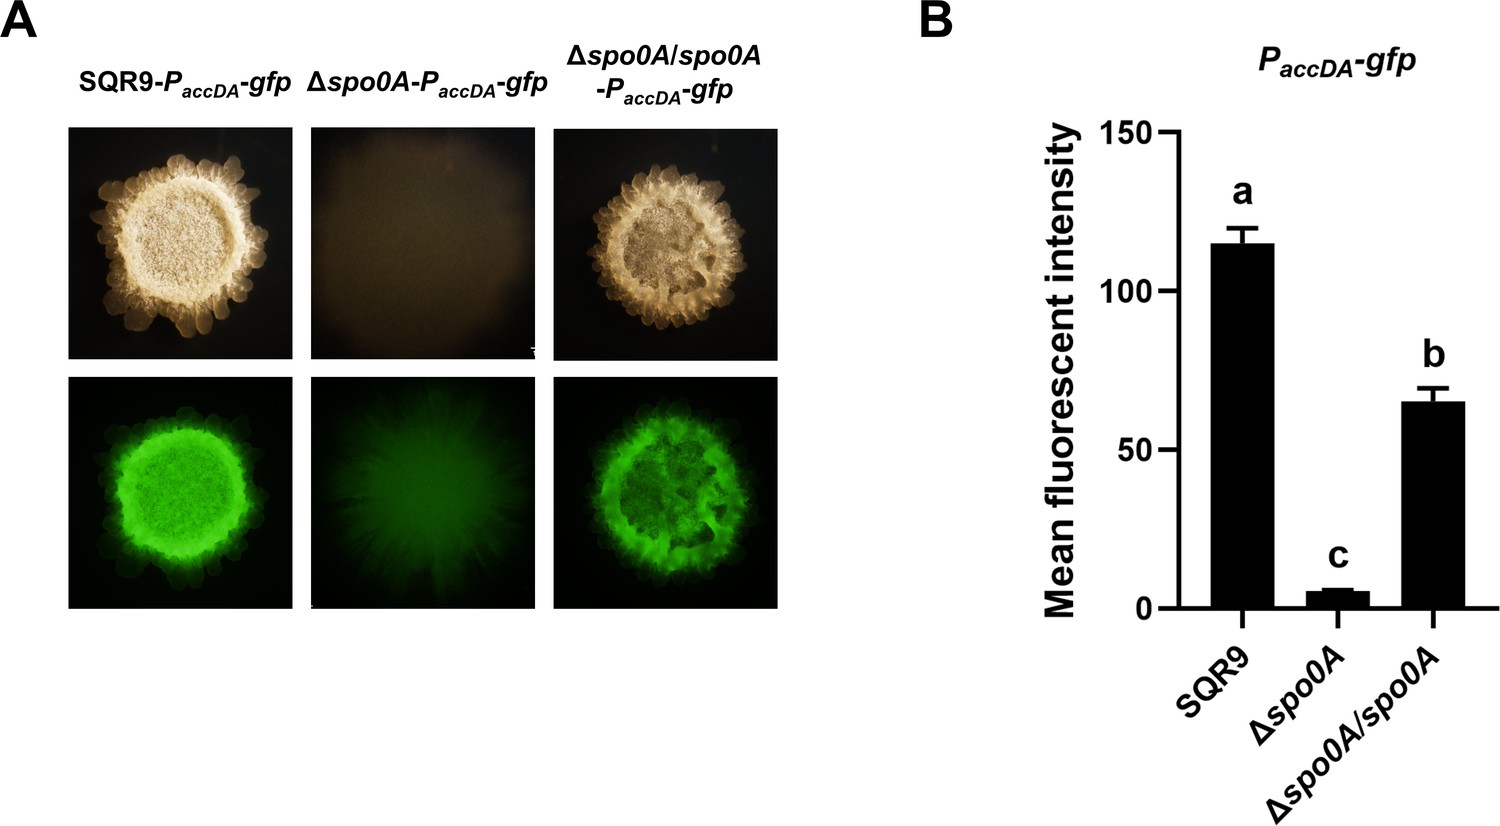
Expression of accDA in the colony cells of wild-type SQR9, Δspo0A, and Δspo0A/spo0A, as monitored by using gfp reporters fused to the promoter of accDA.
(A) Colony fluorescence. Colonies were observed under both bright field and GFP channel, to monitor the fluorescence of PaccDA-gfp in different strains. The bar represents 1 mm. (B) Quantification of colony fluorescence. The mean fluorescent intensity of different gfp reporters is observed in (A). Data are means and standard deviations from three biological replicates. Columns with different letters are statistically different according to the Duncan’s multiple range test (p<0.05).
Figure 4—figure supplement 3
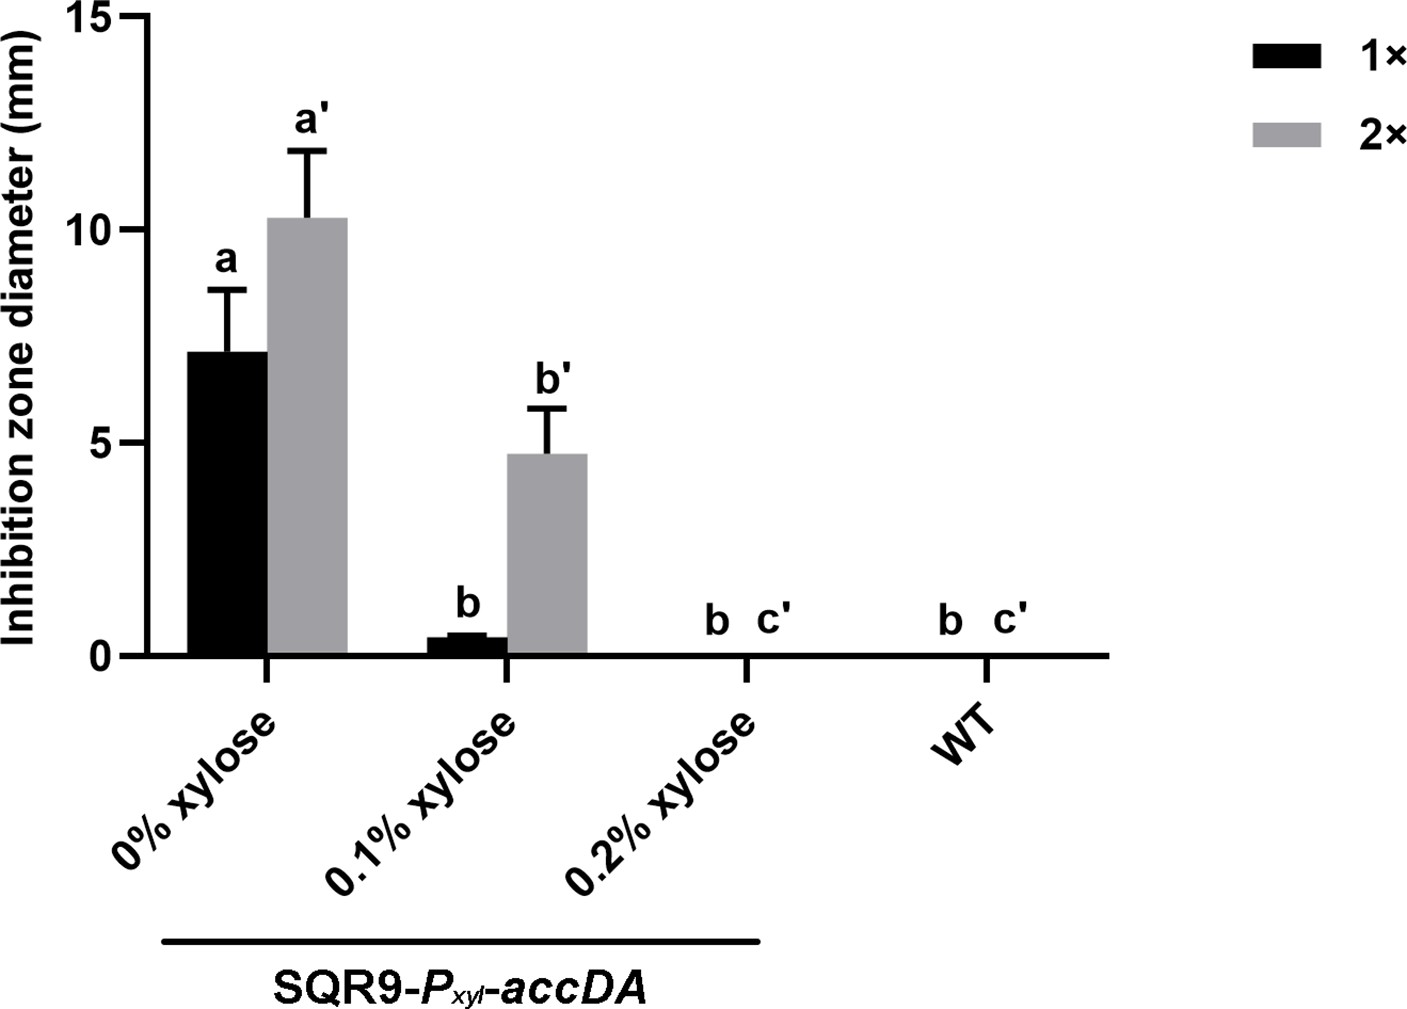
Quantification of the inhibition zone is shown in Figure 4E.
Sensitivity of wild-type SQR9 and SQR9-Pxyl-accDA (as the lawn) to the BAs extract of SQR9 (100 μL (1x) or 200 μL (2x)), with the addition of different concentrations of xylose (0%, 0.1%, and 0.2%). ‘0% xylose,’ ‘0.1% xylose,’ and ‘0.2% xylose’ presented on the x-axis represents a different amount of xylose applied to the liquid culture of strain SQR9-Pxyl-accDA. Data are means and standard deviations from three biological replicates. Columns with different letters are statistically different according to the Duncan’s multiple range test (p<0.05) (‘a’ for 1 × BAs extract of SQR9 and ‘a’” for 2 × BAs extract of SQR9).
Figure 4—figure supplement 4
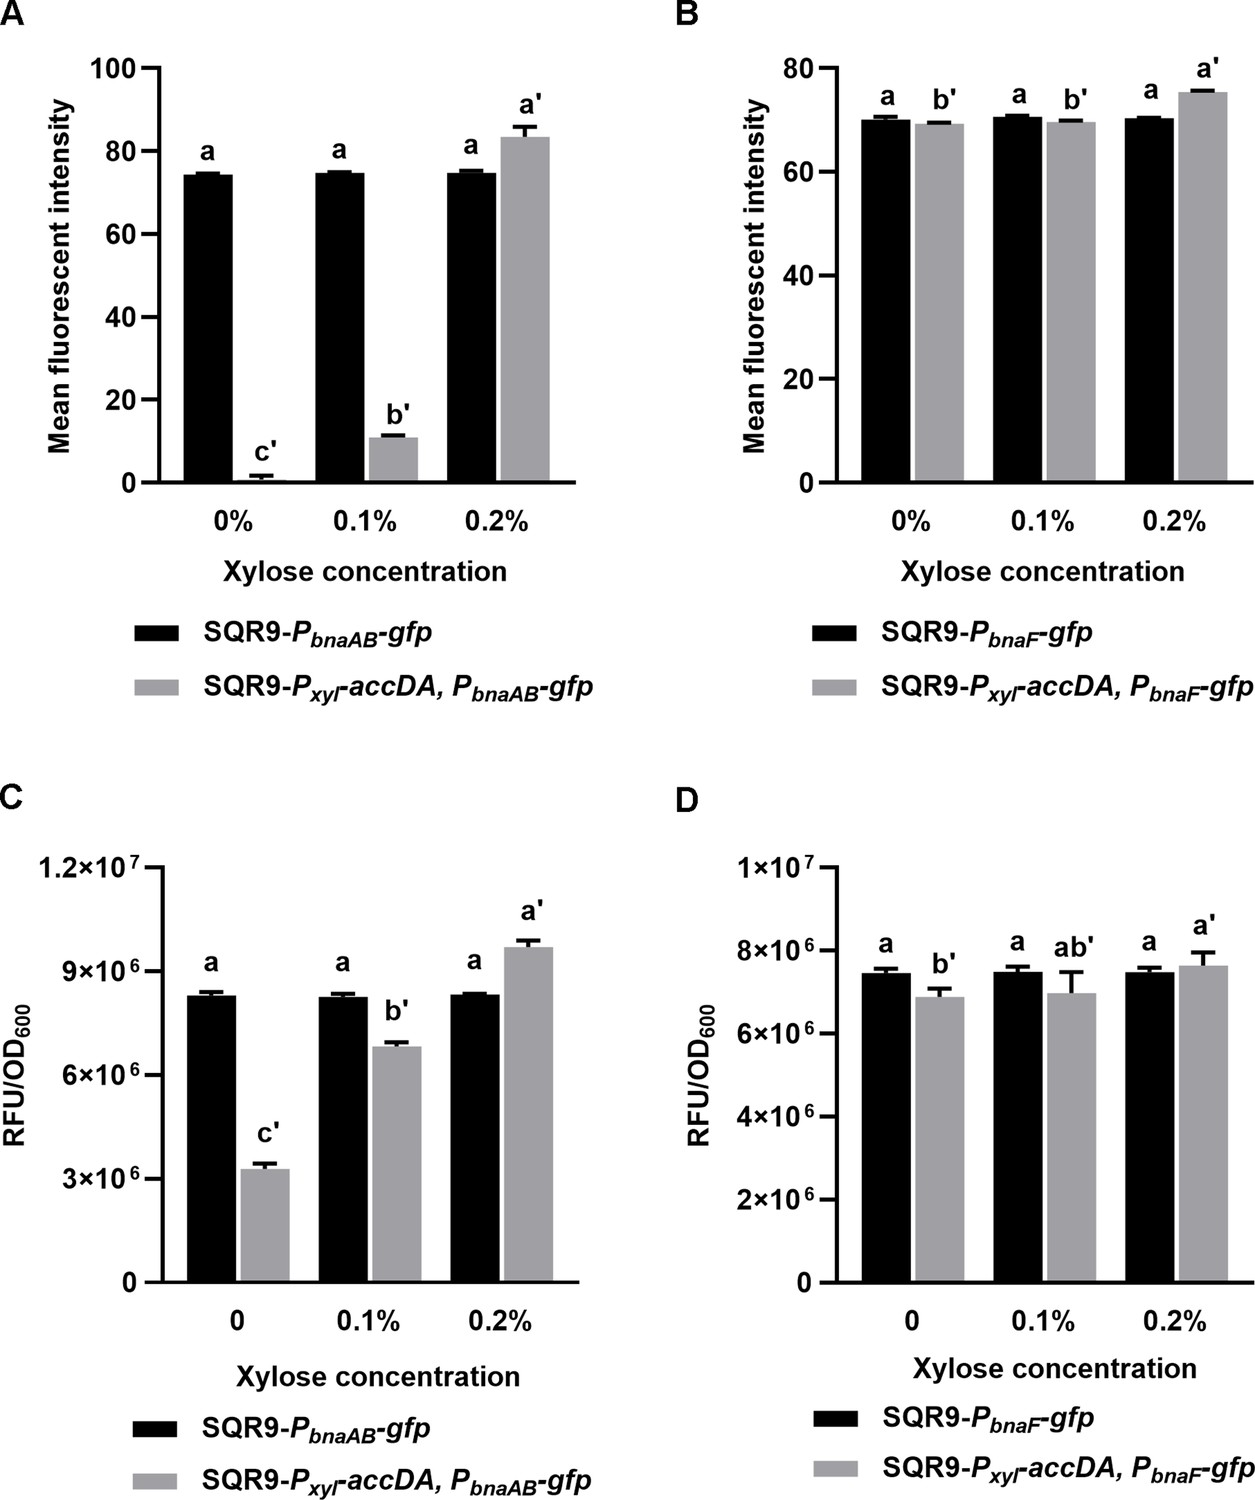
Quantification of bnaAB and bnaF in strain SQR9 and SQR9-Pxyl-accDA.
Expression level of bnaAB (A, C) and bnaF (B, D) in the wild-type SQR9 and SQR9-Pxyl-accDA, with the addition of different concentrations of xylose (0%, 0.1%, and 0.2%). (AB) Quantification of colony fluorescence. The mean fluorescent intensity of different gfp reporters corresponds to the colonies shown in Figure 4F. (CD) Quantification of liquid culture fluorescence. The expression level of bnaAB (C) or bnaF (D) in wild-type SQR9 and SQR9-Pxyl-accDA treated with different amounts of xylose. Data are means and standard deviations from three biological replicates. Columns with different letters are statistically different according to the Duncan’s multiple range test (‘a’ for SQR9-PbnaAB-gfp or SQR9-PbnaF-gfp under different concentrations of xylose, and ‘a'’ for SQR9-Pxyl-accDA, PbnaAB-gfp or SQR9-Pxyl-accDA, PbnaF-gfp; p<0.05).
Figure 4—figure supplement 5
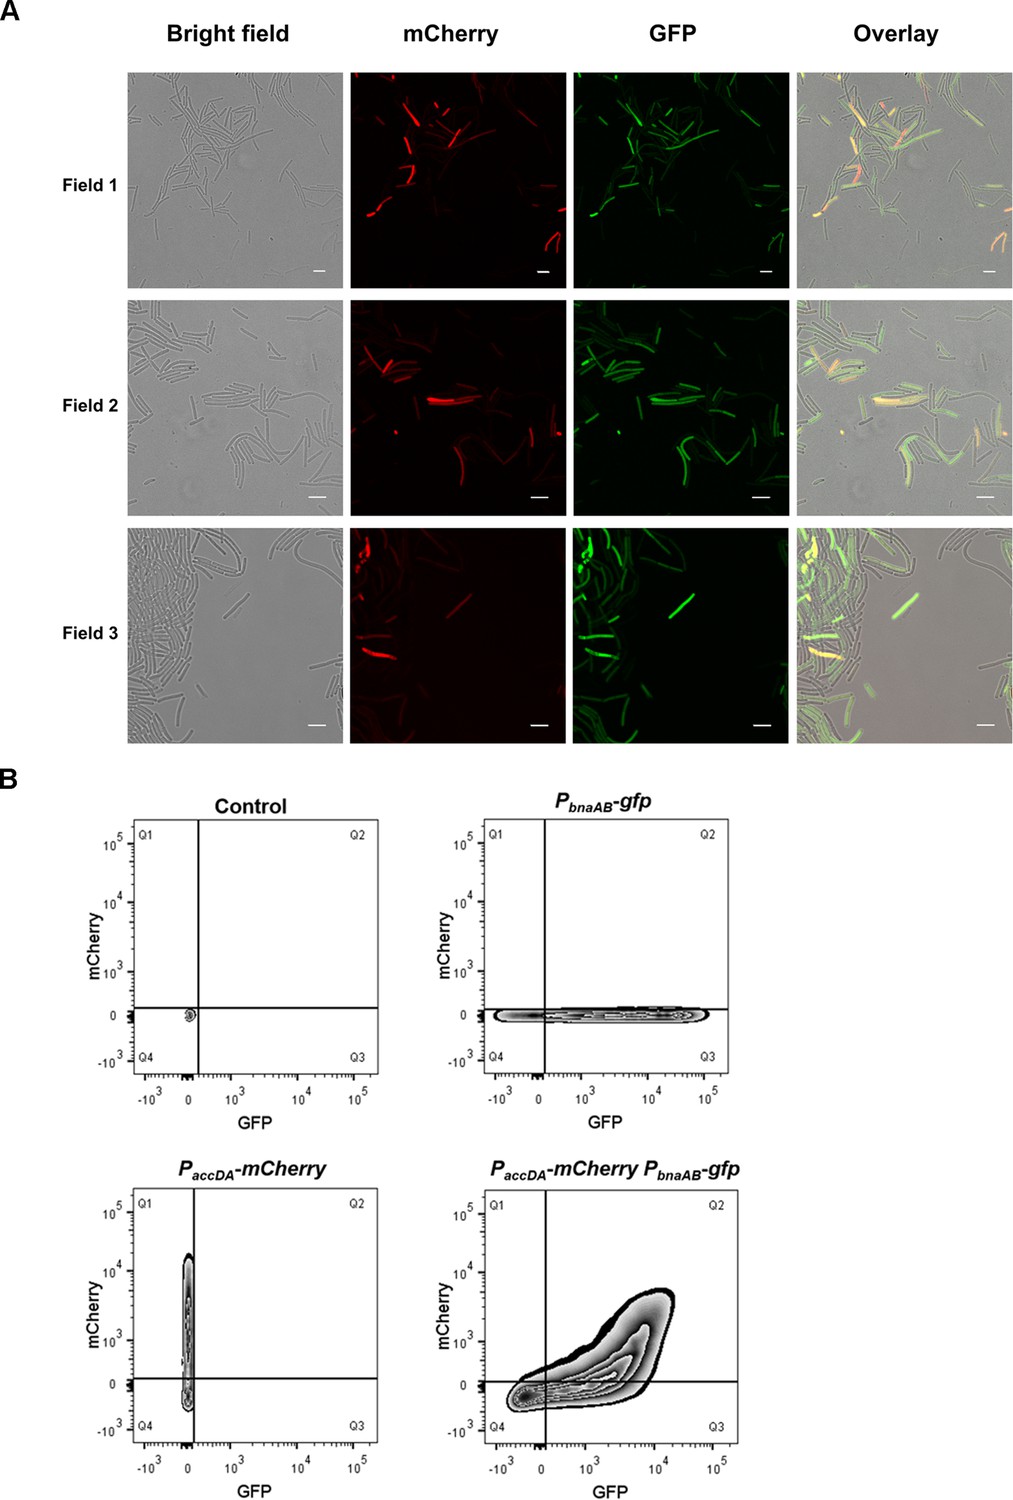
Production of ACC and BAs immunity were located in the same subpopulation.
(A) Fluorescence emission patterns of double-labeled strains. Colony cells of different double-labeled strains were visualized using a CLSM to monitor the distribution of fluorescence signal from different reporters. PaccDA-mCherry and PbnaAB-gfp were used to indicate cells expressing ACC and BAs self-immunity, respectively. The bar represents 5 μm. (B) Quantification of fluorescence emission patterns of this double-labeled strain. Flow cytometry monitoring the subfractions of ACC-producing cells (PaccDA-mCherry) and immune cells (PbnaAB-gfp). PaccDA-mCherry: strain harboring only the PaccDA-mCherry reporter. PbnaAB-gfp: strain harboring only the PbnaAB-gfp reporter. PaccDA-mCherry PbnaAB-gfp: double-labeled strain PaccDA-mCherry PbnaAB-gfp. Fluorescence intensity for the GFP channel is presented on the x-axis, and for the mCherry channel is presented on the y-axis. Control: wild-type strain expressing no fluorescence protein. The total cell number observed for each strain was 20,000.
Figure 5 with 4 supplements
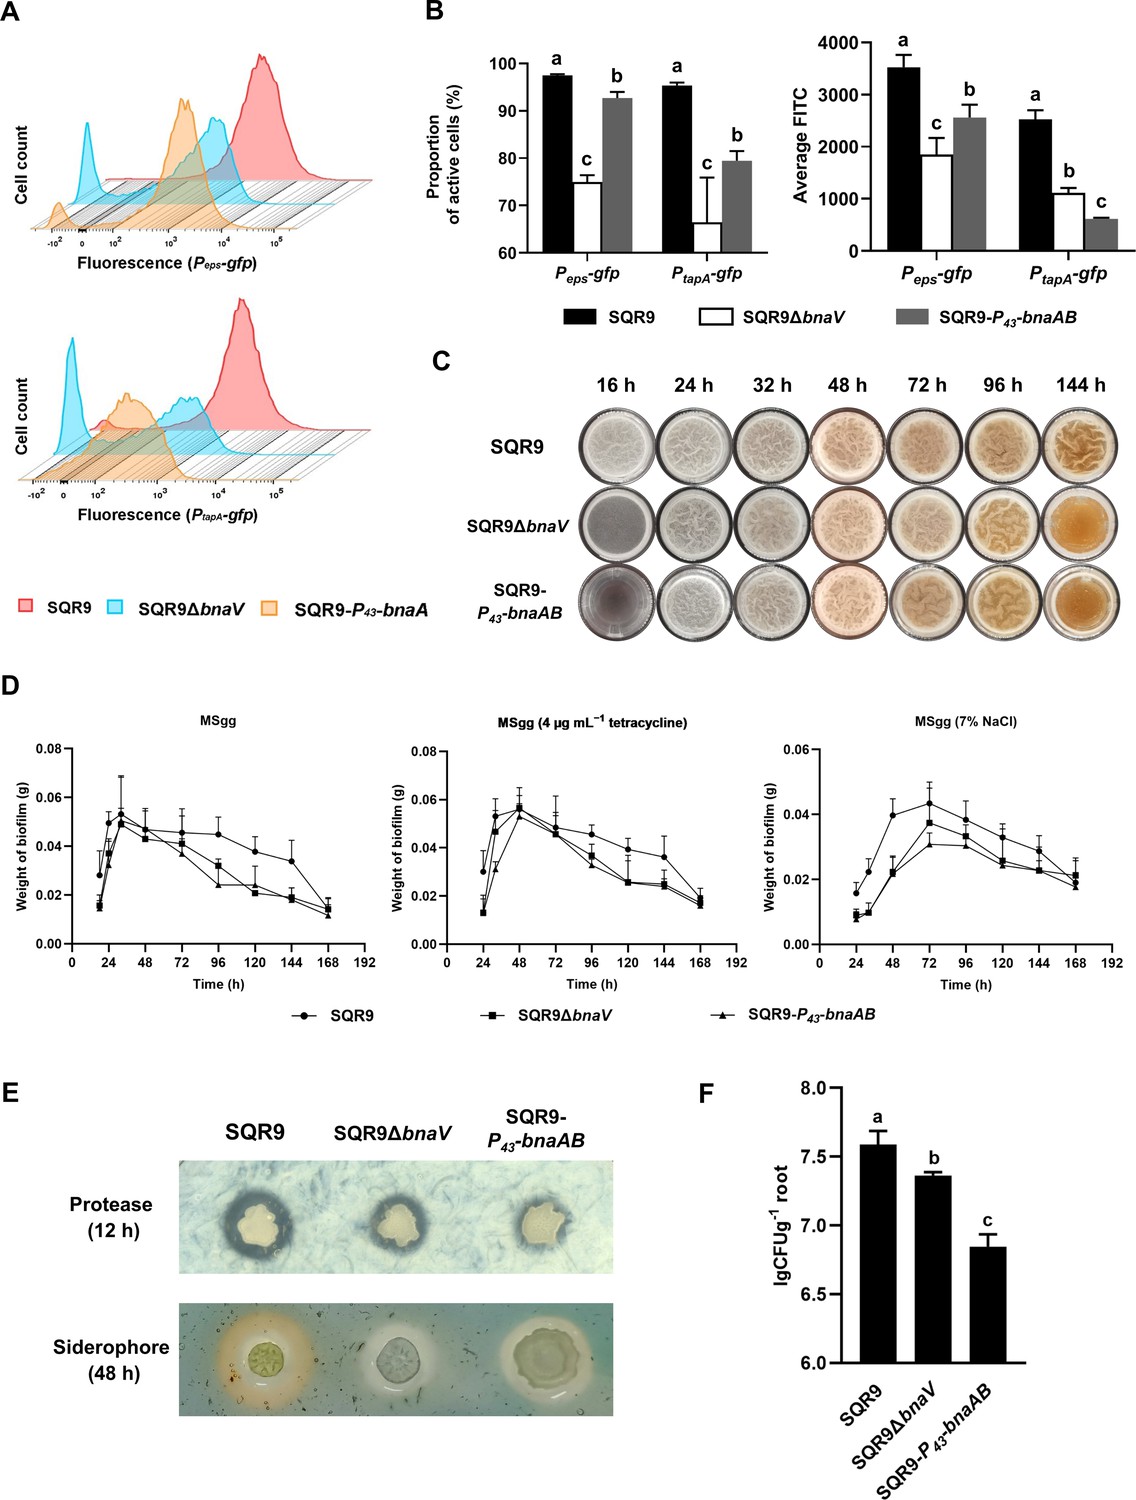
The co-regulation policing system optimizes the division of labor and enhances population fitness.
(A) Flow cytometry monitoring the expression of Peps-gfp and PtapA-gfp reporters in wild-type SQR9, SQR9ΔbnaV, and SQR9-P43-bnaAB. (B) Quantification of (A). The proportion of the active cells (%) and average FITC in wild-type SQR9, SQR9ΔbnaV, and SQR9-P43-bnaAB, as monitored by Peps-gfp and PtapA-gfp reporters using flow cytometry. (C) Pellicle morphology. Pellicle formation dynamics of wild-type SQR9, SQR9ΔbnaV, and SQR9-P43-bnaAB in MSgg medium. (D) Quantification of pellicles. Pellicle weight dynamics of wild-type SQR9, SQR9ΔbnaV, and SQR9-P43-bnaAB in MSgg medium under normal (corresponds to (C)) or stressed conditions (H2O2, tetracycline, or 7% NaCl). (E) Qualitative analysis of protease or siderophore yield. Production of proteases and siderophore by wild-type SQR9, SQR9ΔbnaV, and SQR9-P43-bnaAB colonies. (F) Root colonization assay. Comparison of root colonization of wild-type SQR9, SQR9ΔbnaV, and SQR9-P43-bnaAB. Data are means and standard deviations from three biological replicates; columns with different letters are significantly different according to Duncan’s multiple range tests, p<0.05.
-
Figure 5—source data 1
Related to Figure 5B.
- https://cdn.elifesciences.org/articles/84743/elife-84743-fig5-data1-v2.xlsx
-
Figure 5—source data 2
Related to Figure 5D.
- https://cdn.elifesciences.org/articles/84743/elife-84743-fig5-data2-v2.xlsx
-
Figure 5—source data 3
Related to Figure 5F.
- https://cdn.elifesciences.org/articles/84743/elife-84743-fig5-data3-v2.xlsx
Figure 5—figure supplement 1
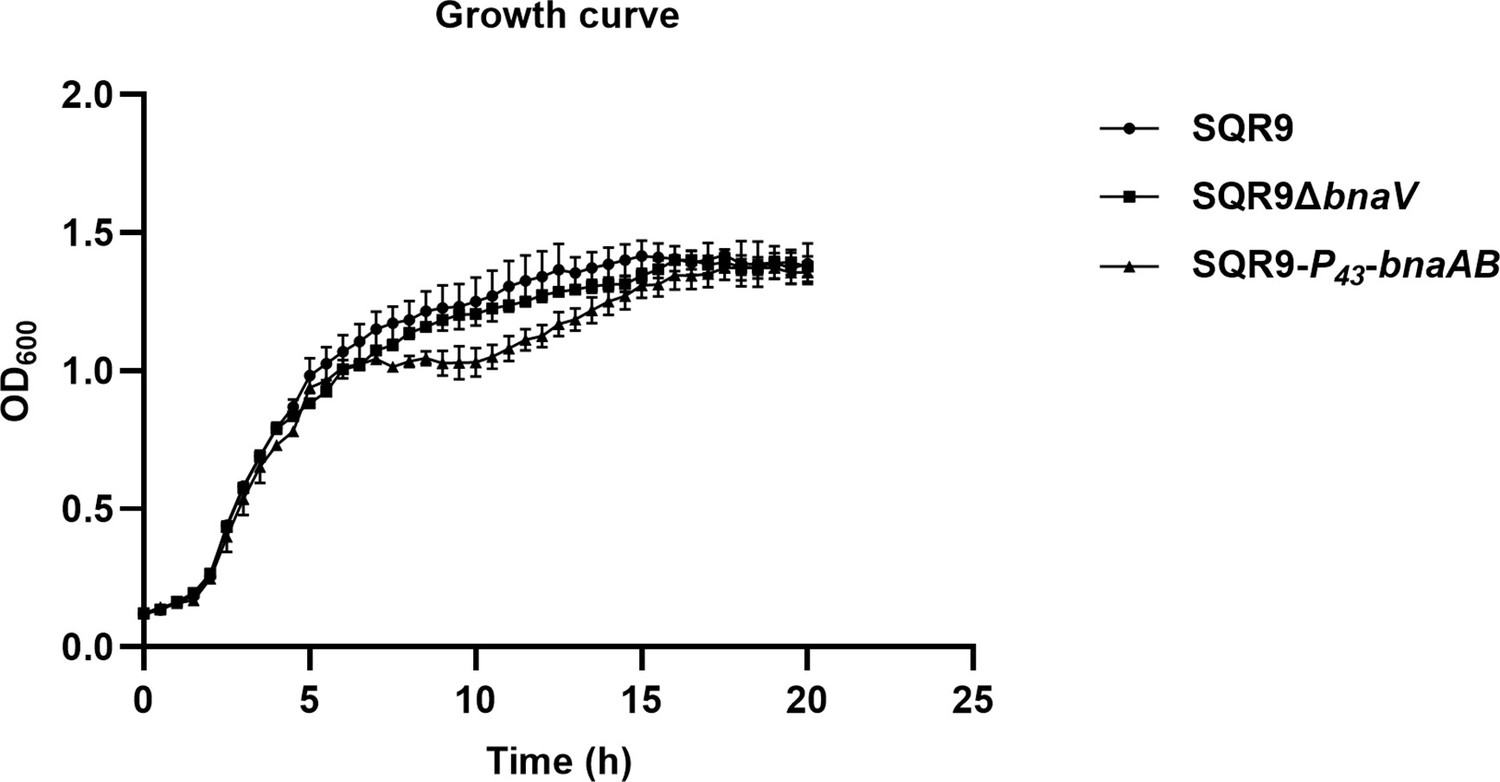
Growth curves of wild-type SQR9, SQR9ΔbnaV, and SQR9-P43-bnaAB.
Figure 5—figure supplement 2
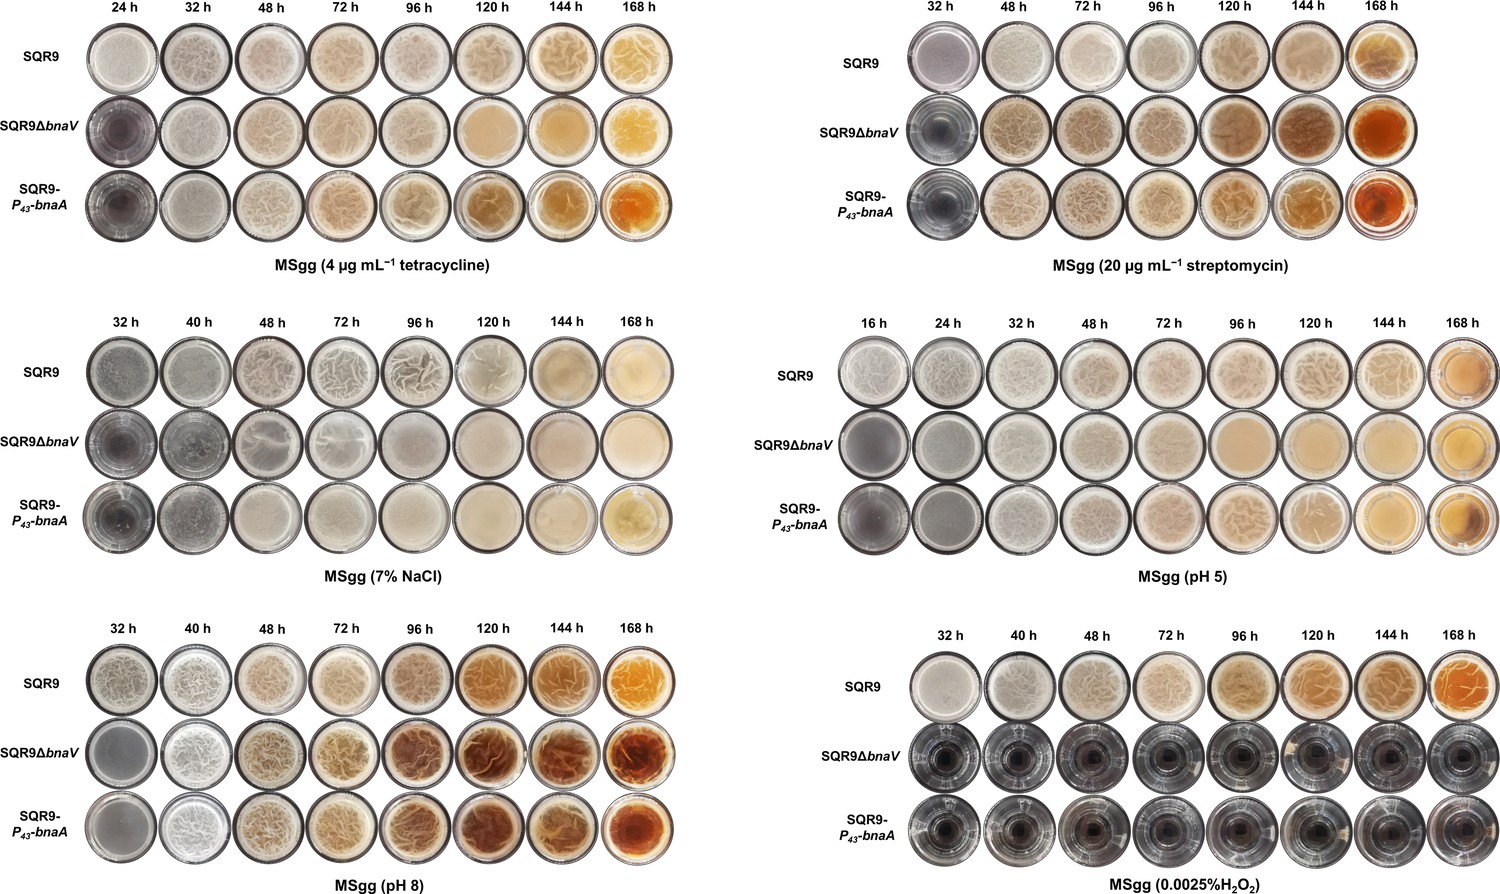
Pellicle morphology.
Dynamic pellicle formation of wild-type SQR9, SQR9ΔbnaV, and SQR9-P43-bnaAB in MSgg medium under different stressed conditions.
Figure 5—figure supplement 3
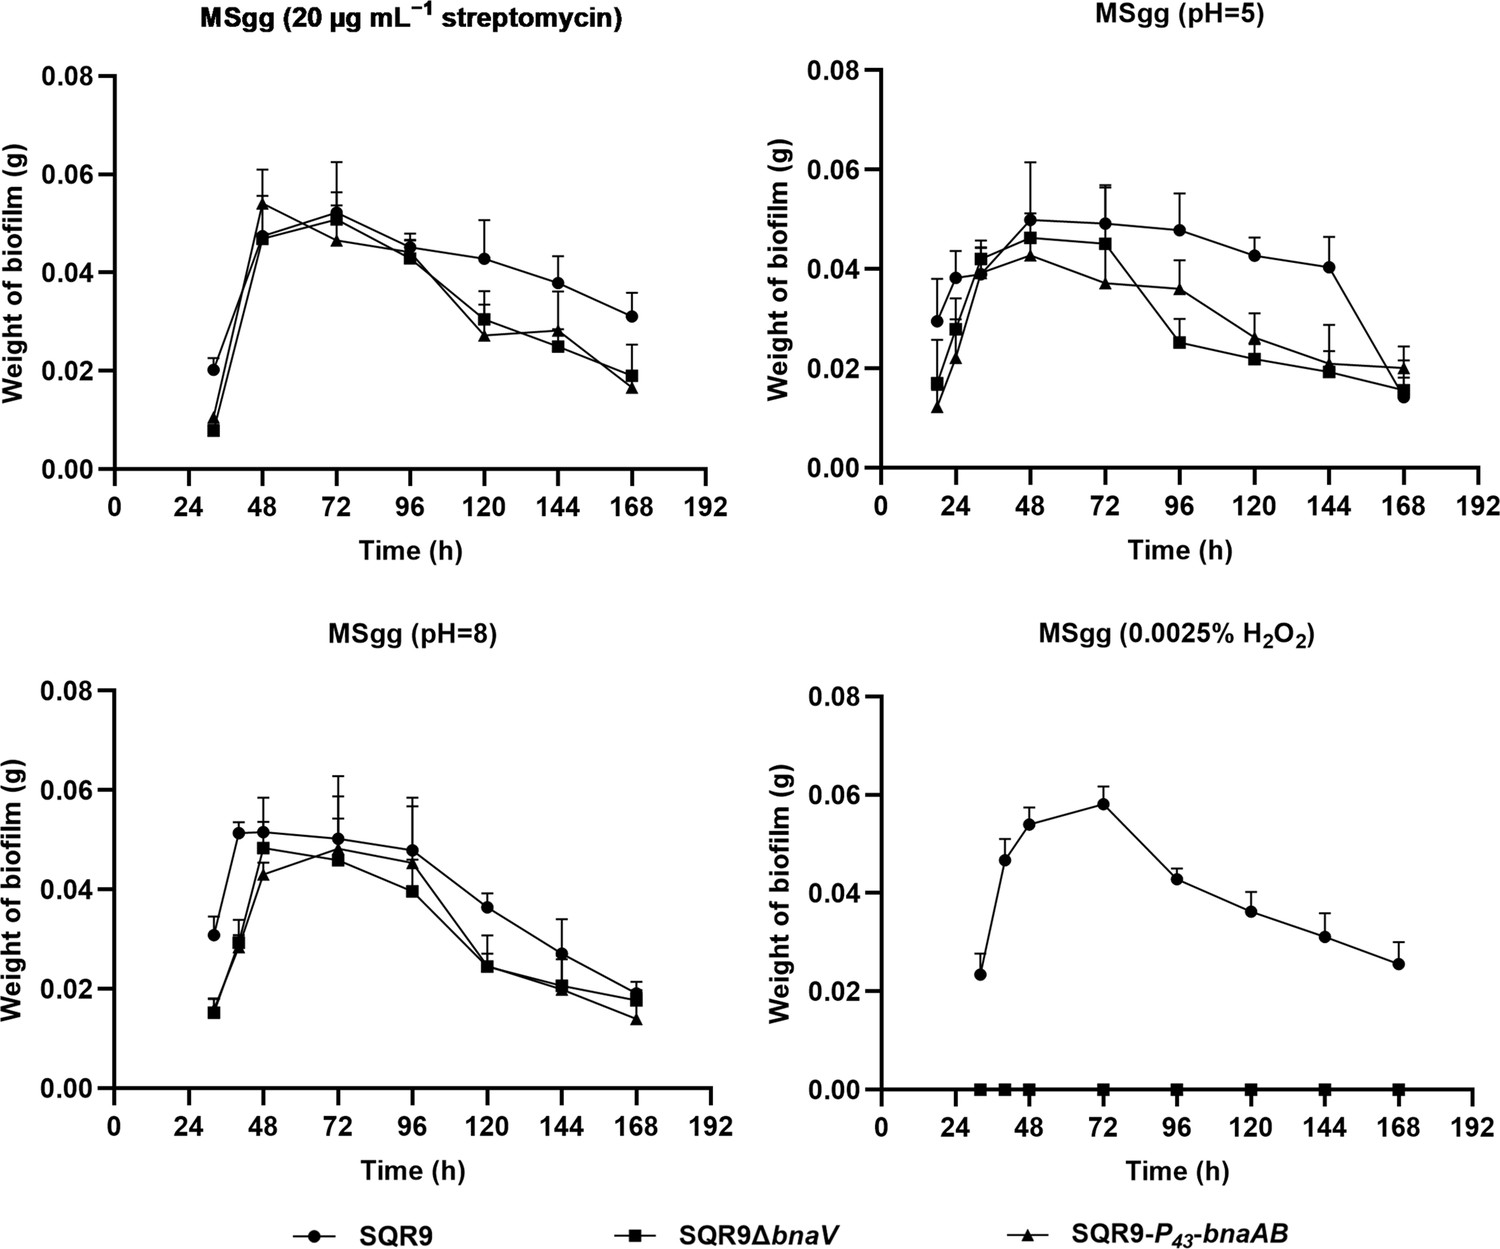
Quantification of pellicles.
Dynamic pellicle weight of wild-type SQR9, SQR9ΔbnaV, and SQR9-P43-bnaAB in MSgg medium under different stressed conditions.
Figure 5—figure supplement 4
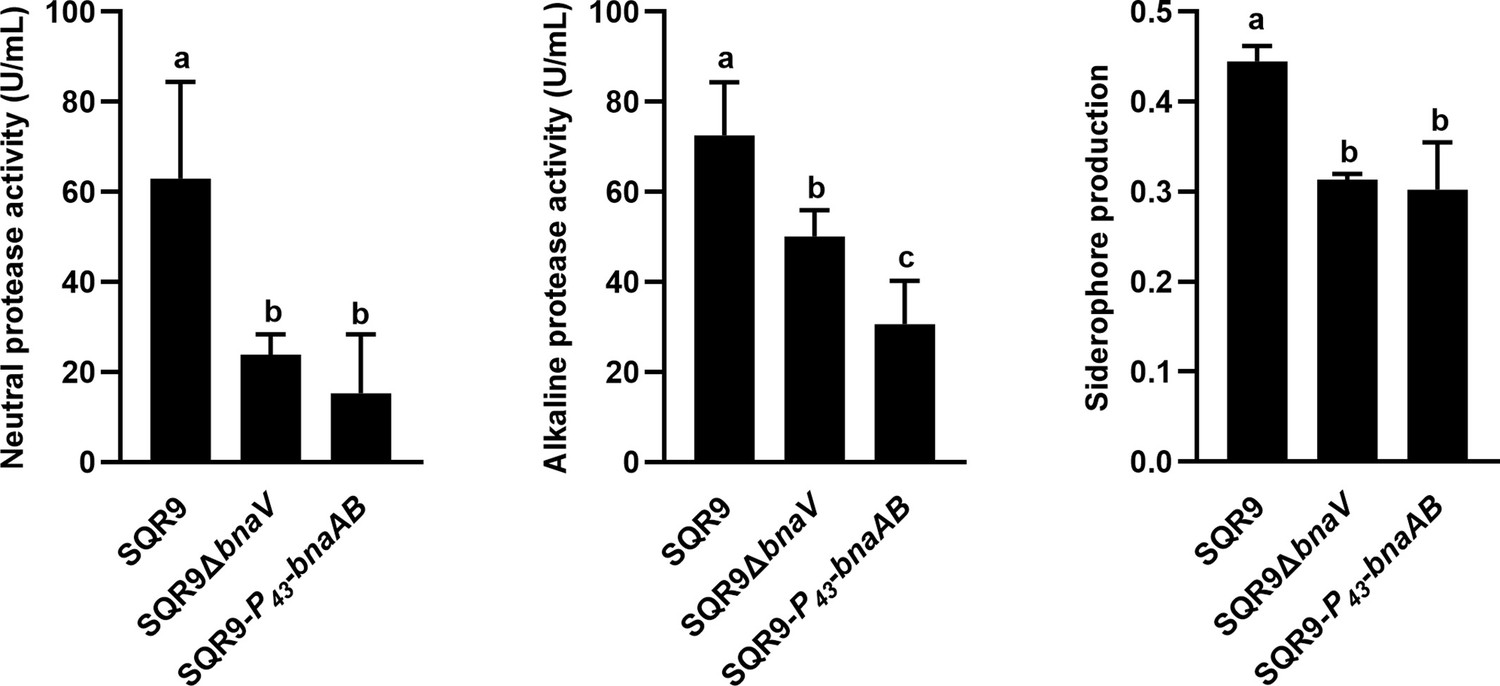
Quantification of neutral/alkaline protease activity and siderophore production by wild-type SQR9, SQR9ΔbnaV, and SQR9-P43-bnaAB.
Columns with different letters are statistically different according to the Duncan’s multiple range test (n=3, p<0.05).
Figure 6
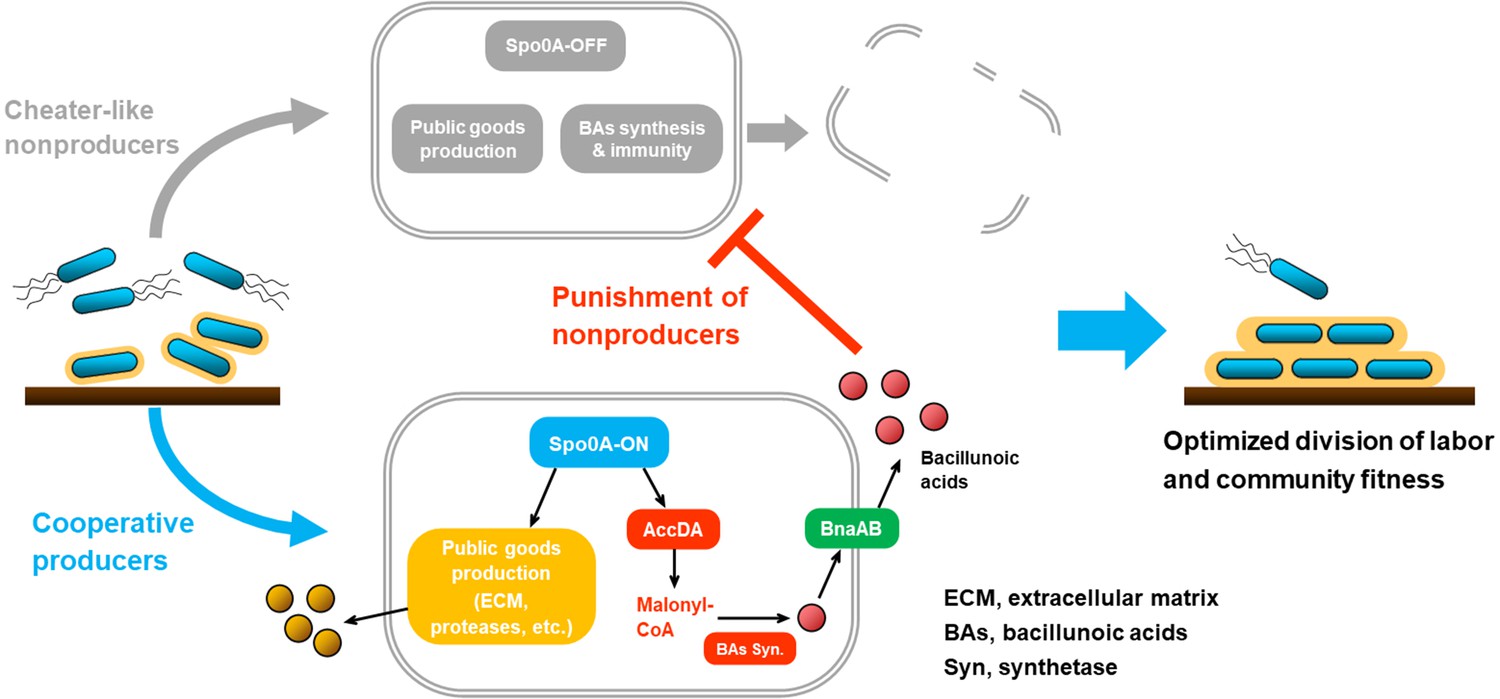
A working model and ecological significance of the co-regulation policing system in B. velezensis.
In certain conditions (e.g. environmental or self-produced clues, surface attachments, etc.), Bacillus cells can differentiate into Spo0A-ON (~moderate phosphorylated) and Spo0A-OFF (unphosphorylated) subpopulations. The Spo0A-ON subpopulation is cooperators that produce public goods for the community, such as ECM or proteases; simultaneously they express AccDA to produce malonyl-CoA as the precursor for BAs biosynthesis, and the endogenous autotoxin activates immunity-required transporter BnaAB to pump them out. Comparatively, the Spo0A-OFF subpopulation is cheat-like individuals that are silenced in public goods secretion, which are also disabled in malonyl-CoA production and BAs biosynthesis/self-immunity. Consequently, the cooperators-produced BAs can effectively eliminate the cheater-like nonproducers, thereby optimizing the division of labor and enhancing population fitness.
Author response image 1
Tables
Key resources table
| Reagent type (species) or resource | Designation | Source or reference | Identifiers | Additional information |
|---|---|---|---|---|
| Strain, strain background (Bacillus velezensis) | SQR9 | Lab strain | CGMCC accession No. 5808 | |
| Strain, strain background (Bacillus velezensis) | FZB42 | Chen et al., 2007 | BGSC accession no. 10A6 | |
| Strain, strain background (Escherichia coli) | Top 10 | Invitrogen | Host for plasmids | |
| Strain, strain background (Escherichia coli) | BL21 (DE3) | Invitrogen | For recombinant protein expression | |
| Recombinant DNA reagent | pNW33n (plasmid) | Zhou et al., 2018 | B. subtilis-E. coli shuttle vector | |
| Gene (Bacillus velezensis) | spo0A | GenBank | V529_25300 | |
| Gene (Bacillus velezensis) | bnaA | GenBank | V529_06410 | |
| Gene (Bacillus velezensis) | bnaB | GenBank | V529_06420 | |
| Gene (Bacillus velezensis) | bnaV | GenBank | V529_06620 | |
| Software, algorithm | FlowJo V10 | FlowJo V10 | ||
| Software, algorithm | SPSS | SPSS | ||
| Other | Propidium iodide | Invitrogen | L7012 | (20 mM) |
Additional files
-
Supplementary file 1
Strains, plasmids, and primers used in this study.
(a) List of strains and plasmids used in this study. (b) List of primers used in this study.
- https://cdn.elifesciences.org/articles/84743/elife-84743-supp1-v2.docx
-
MDAR checklist
- https://cdn.elifesciences.org/articles/84743/elife-84743-mdarchecklist1-v2.docx
Download links
A two-part list of links to download the article, or parts of the article, in various formats.
Downloads (link to download the article as PDF)
Open citations (links to open the citations from this article in various online reference manager services)
Cite this article (links to download the citations from this article in formats compatible with various reference manager tools)
A toxin-mediated policing system in Bacillus optimizes division of labor via penalizing cheater-like nonproducers
eLife 12:e84743.
https://doi.org/10.7554/eLife.84743


