Development of frequency tuning shaped by spatial cue reliability in the barn owl’s auditory midbrain
- Dominick P Purpura Department of Neuroscience, Albert Einstein College of Medicine, United States
Figures
Figure 1 with 1 supplement
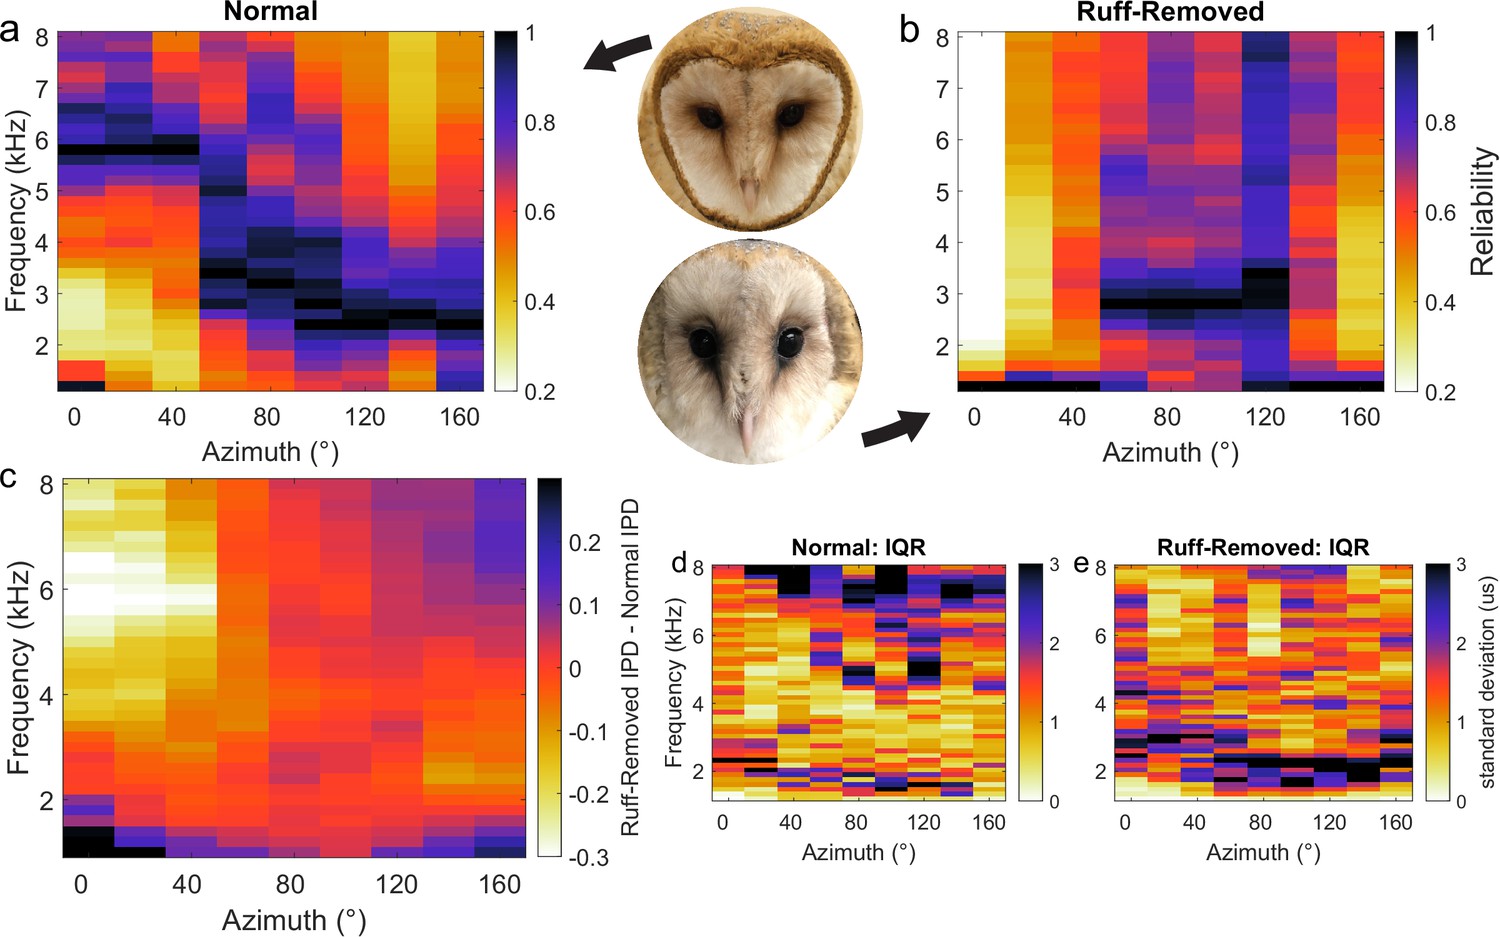
Head-related transfer function (HRTF)-based interaural phase difference (IPD) reliability in owls with and without facial ruff.
Target and masker broadband sounds across varying azimuth locations were convolved with HRTFs from owls before and after facial ruff removal, then summed. IPD reliability (s.d.–1) was computed across frequencies and normalized for each location, then averaged across owls (see ‘Methods’) before (a) and after (b) the facial ruff removal (right hemifield shown). The difference between normal and ruff-removed IPDs indicates a substantial decrease in reliability for frequencies above 4 kHz at frontal locations (c). HRTF data from von Campenhausen and Wagner, 2006.
Figure 1—figure supplement 1
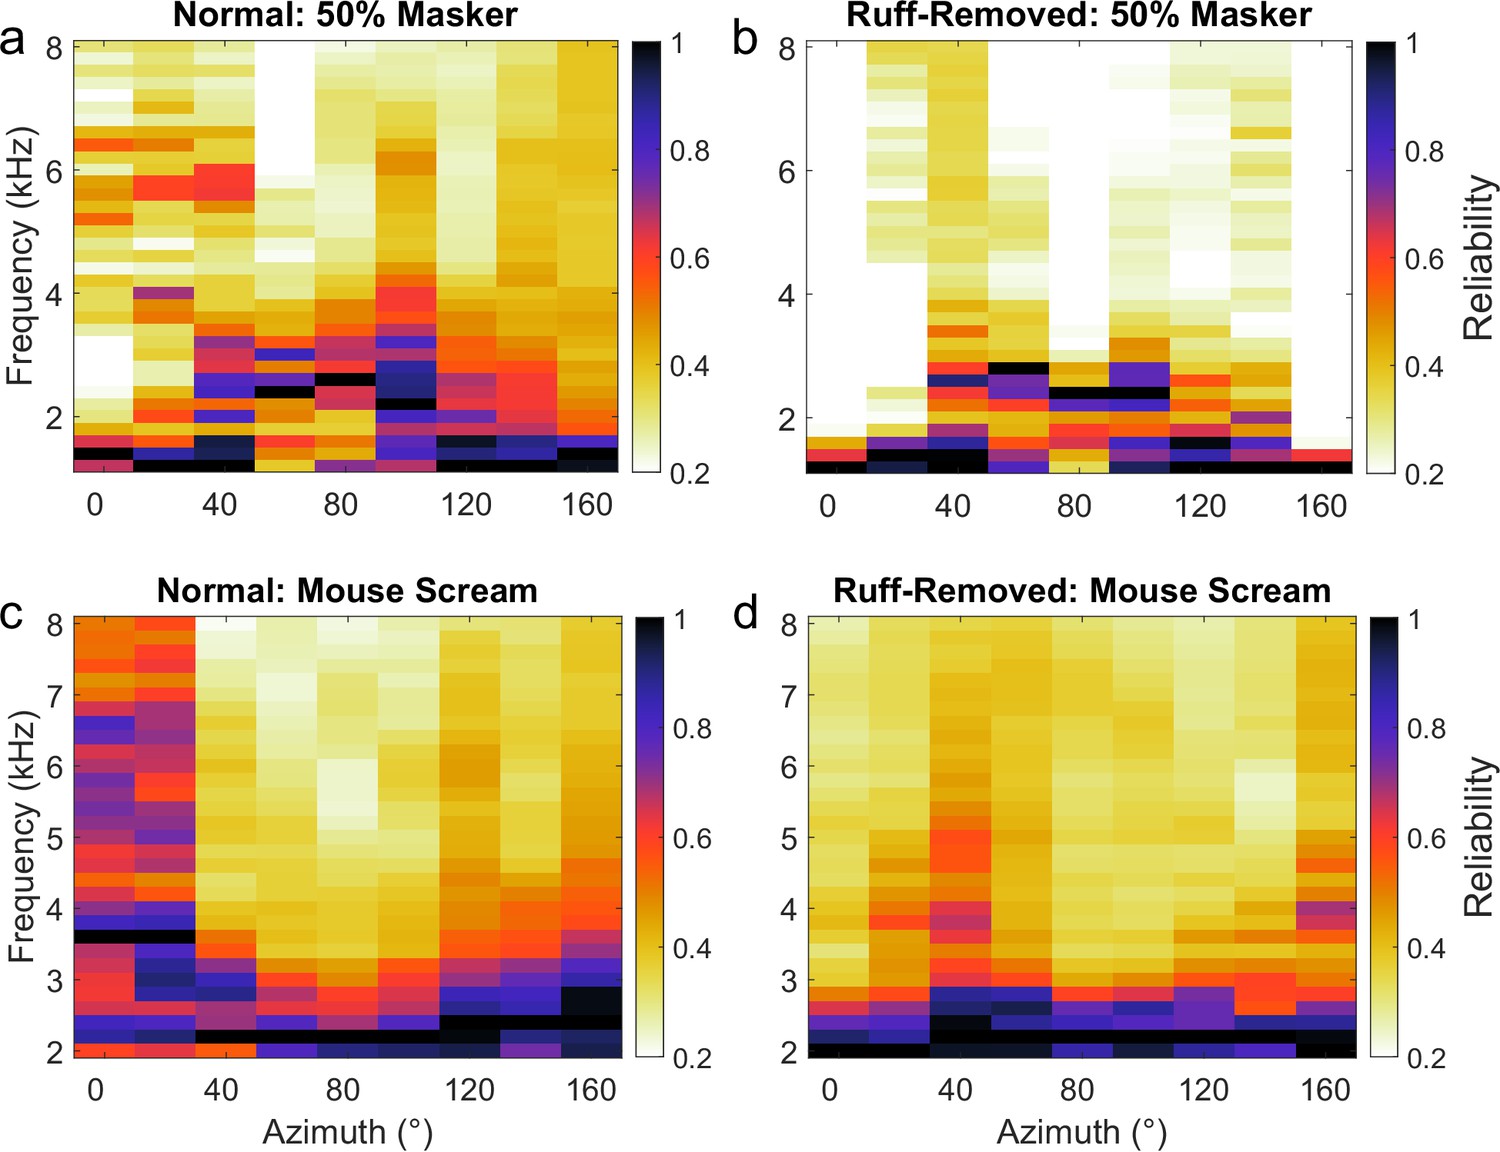
Interaural phase difference (IPD) reliability across acoustical contexts.
Same analysis as Figure 1, using alternative stimuli to produce IPD reliability. (a, b) Muted condition, where maskers were 50% the amplitude of targets, both broadband. (c, d) Natural sound condition, where target and maskers were 100 ms excerpts from prey vocalizations (see ‘Methods’). (a) and (c) used HRTFs from normal owls, while (b) and (d) used head-related transfer functions (HRTFs) from ruff-removed owls.
Figure 2
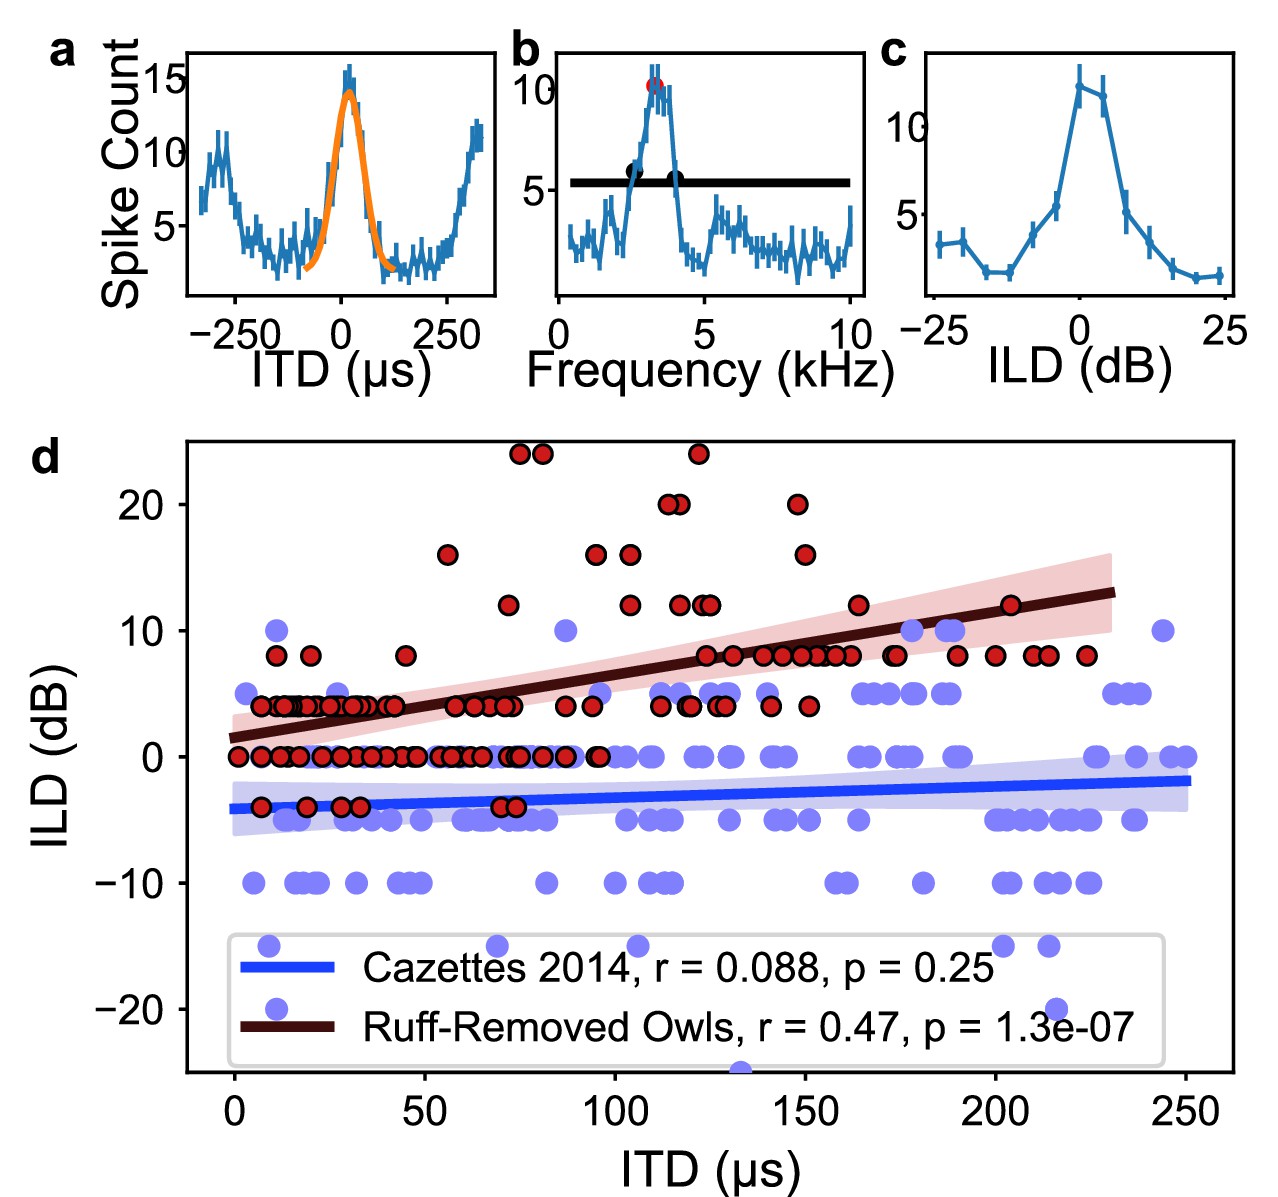
Inferior colliculus (ICx) neural responses in the ruff-removed barn owl.
(a) Example interaural time difference (ITD) tuning curve. Yellow curve represents Gaussian fit to main peak, with the maximum of this curve termed best ITD. (b) Example frequency tuning curve. Black line indicates half-height used for determining half-width, low- and high-frequency bounds (black dots). Best frequency corresponds to the mean of the frequency bounds (red dot). (c) Example interaural level difference (ILD) tuning curve. (d) Best ILD plotted as a function of best ITD of neurons from ruff-removed (red dots) and normal owls (blue dots, from Cazettes et al., 2014). While there is no correlation between ITD and ILD tuning in normal owls (blue line), there is a correlation in ruff-removed owls (red line).
Figure 3 with 2 supplements
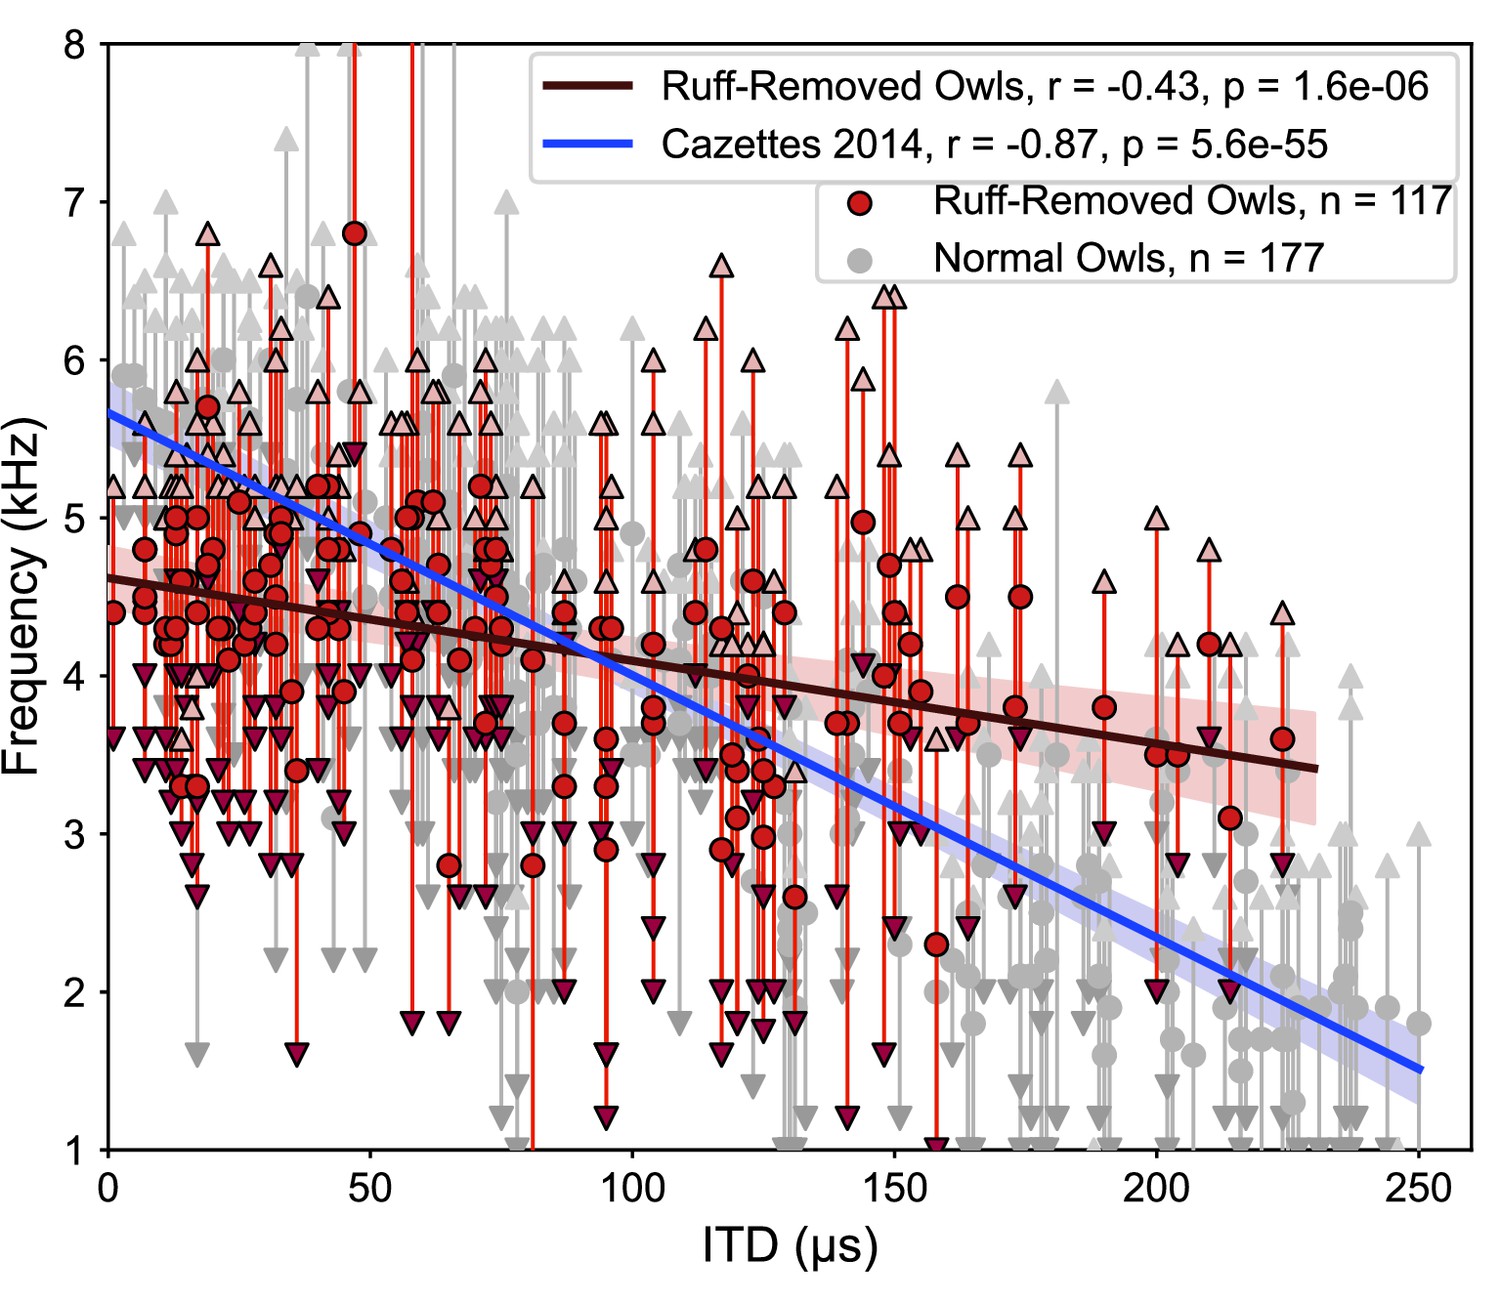
Different correlations between interaural time difference (ITD) and frequency tunings in ruff-removed and normal owls.
Best frequency plotted as a function of best ITD of inferior colliculus (ICx) neurons from ruff-removed owls (red dots) and normal owls (gray dots, from Cazettes et al., 2014). Arrows indicate frequency bounds of each neuron; vertical lines denote frequency range.
Figure 3—figure supplement 1
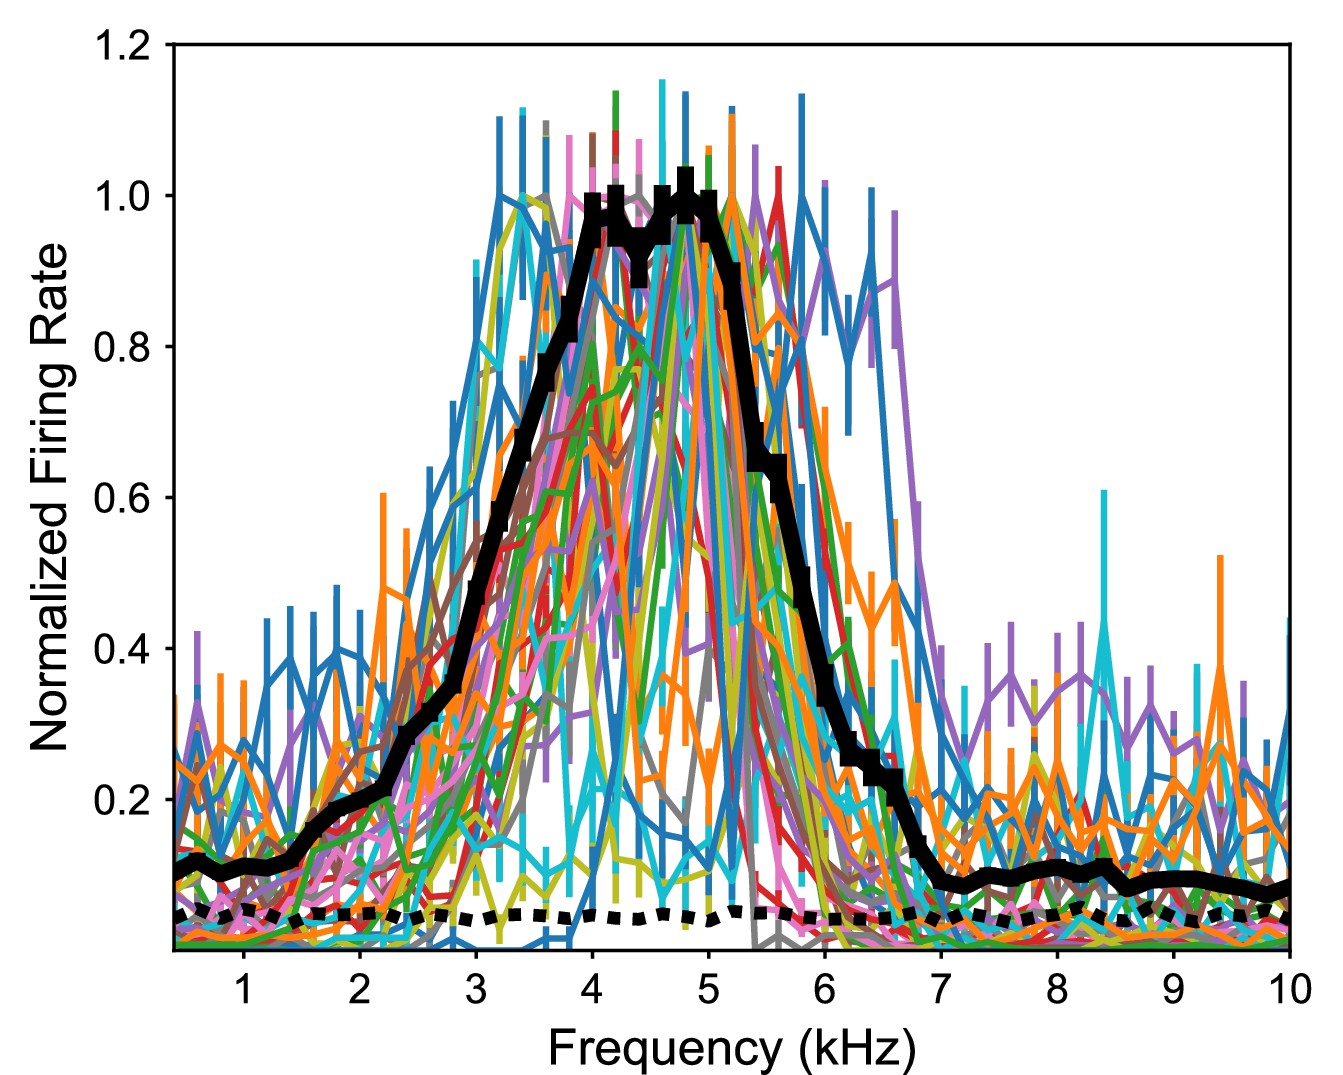
Frequency tuning of frontally tuned inferior colliculus (ICx) neurons in ruff-removed owls.
Frequency tuning curves of ICx neurons with best interaural time differences (ITDs) < 30 µs (n = 33). Tuning curves are normalized by their max response. Thick black line indicates the average across neurons. Dashed black line indicates basal response.
Figure 3—figure supplement 2
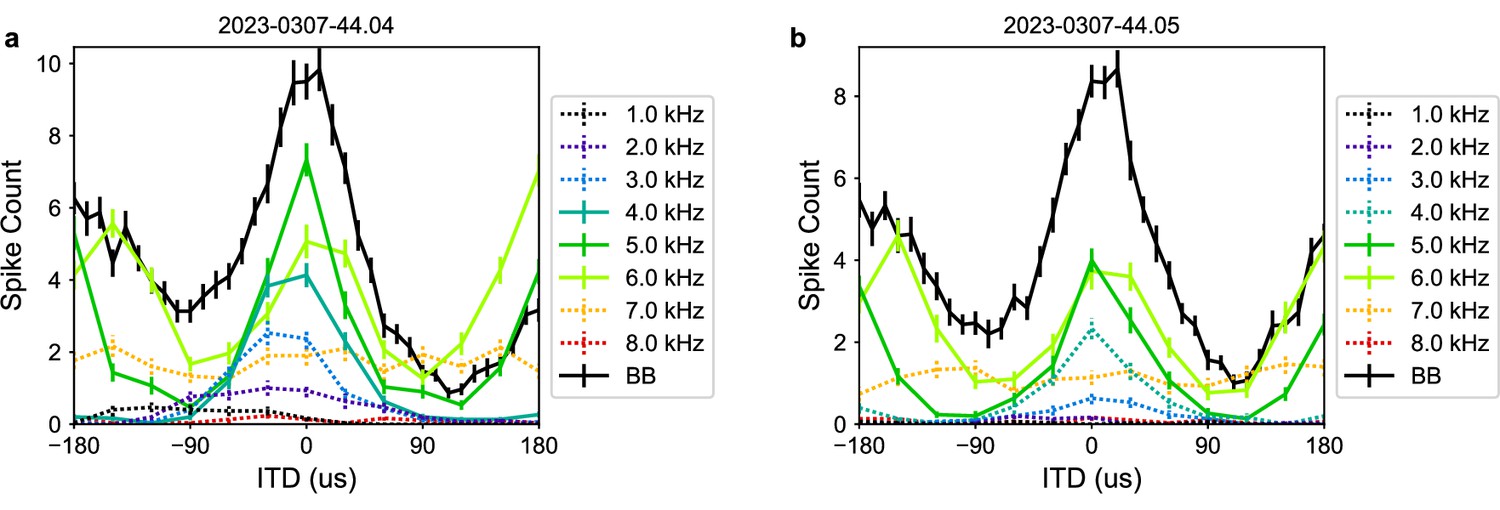
Interaural time difference (ITD) sensitivity across frequencies in the ruff-removed owl inferior colliculus (ICx).
Two example ICx neurons shown in (a) and (b). ITD tuning for tones (colored) and broadband (black) plotted by firing rate (non-normalized). Solid colored lines indicate responses to frequencies that are within the neuron’s preferred frequency range (i.e. above the half-height, see ‘Methods’), dashed lines indicate frequencies outside of the neuron’s frequency range.
Figure 4
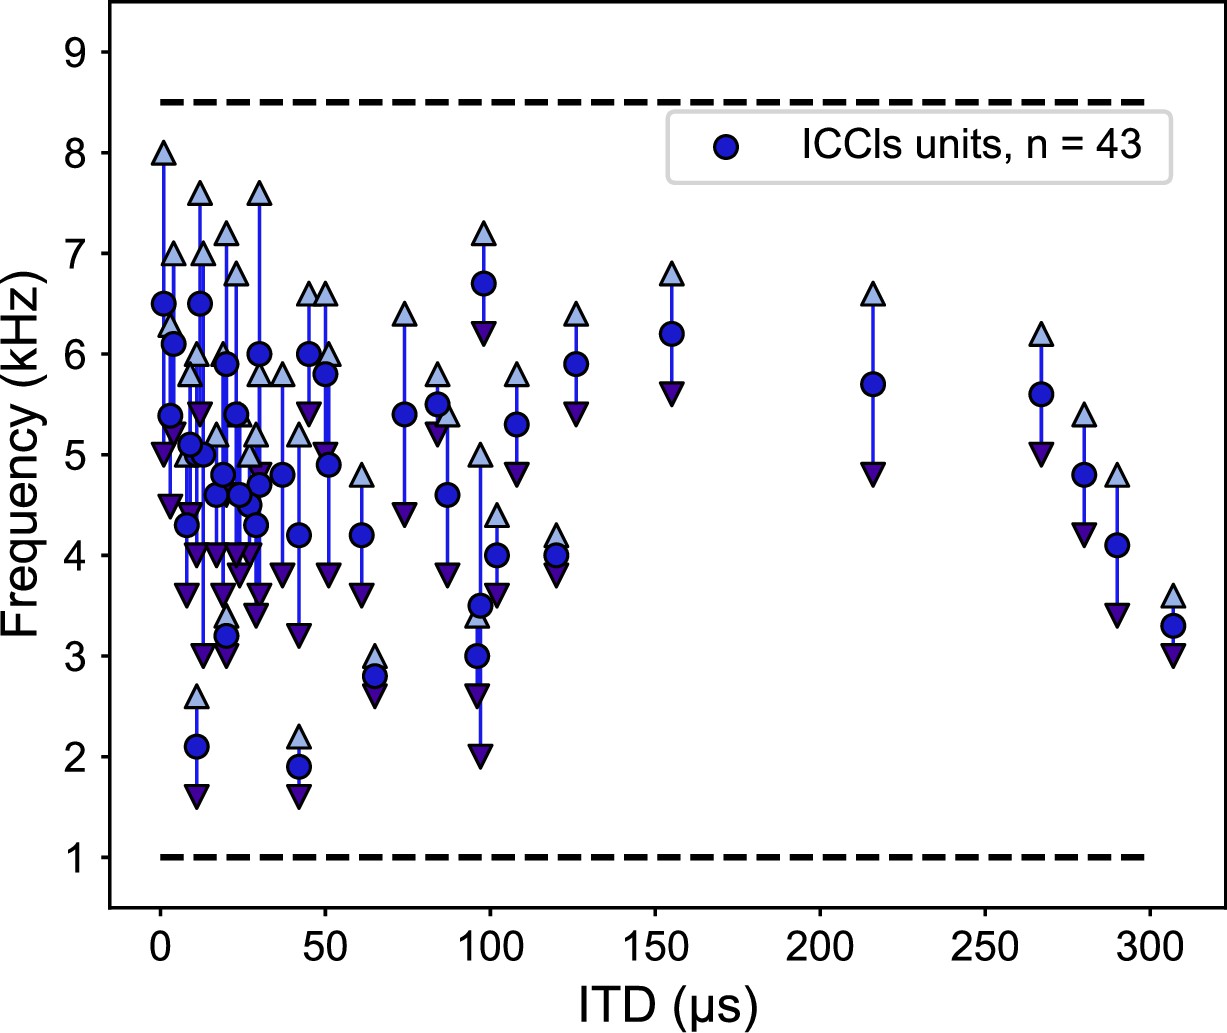
Frequency tunings in the inferior colliculus (ICCls) of ruff-removed owls span across the owl’s normal hearing range.
Frequency tuning of ICCls neurons of ruff-removed owls plotted as a function of their best interaural time difference (ITD). Best frequency denoted by blue dots; frequency range denoted by arrows. Black dashed lines indicate the upper and lower typical frequency range of the barn owl’s ICCls (from Wagner et al., 2007).
Figure 5
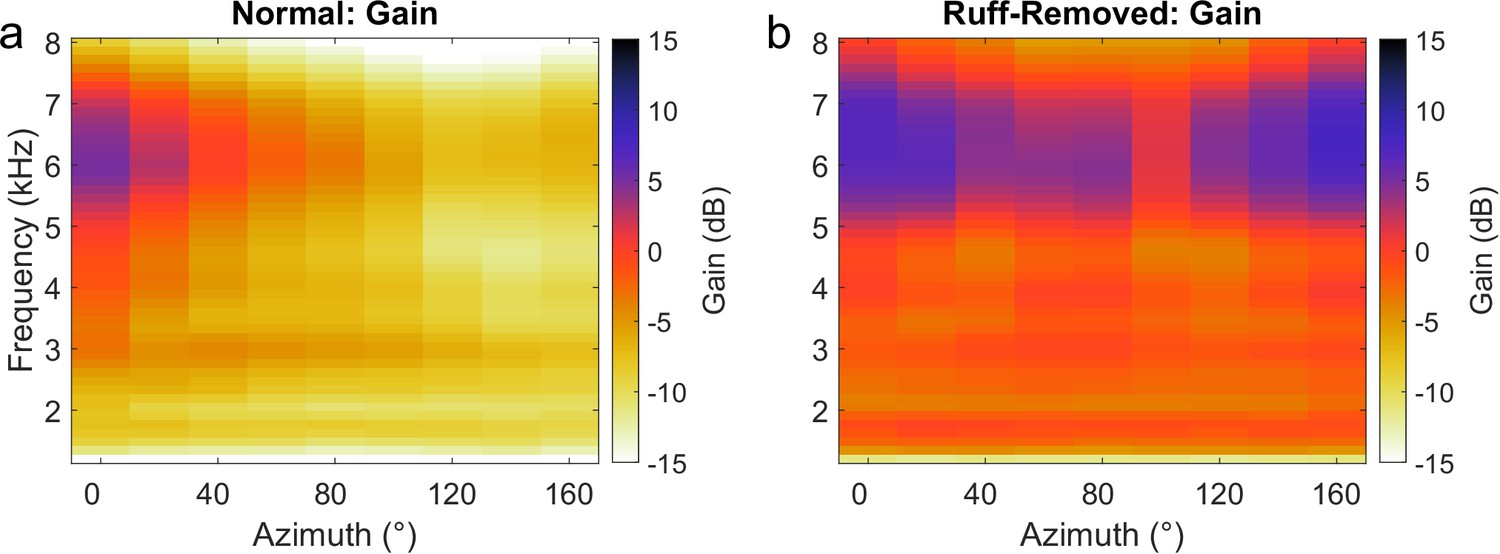
Gain across frequencies in the barn owl.
Gain computed for each frequency using normal (a) and ruff-removed (b) head-related transfer functions (HRTFs). Positive gain indicates an increase in the sound level, relative to the absence of the head to filter the sounds (0 dB). Negative gain indicates a decrease in sound level.
Figure 6
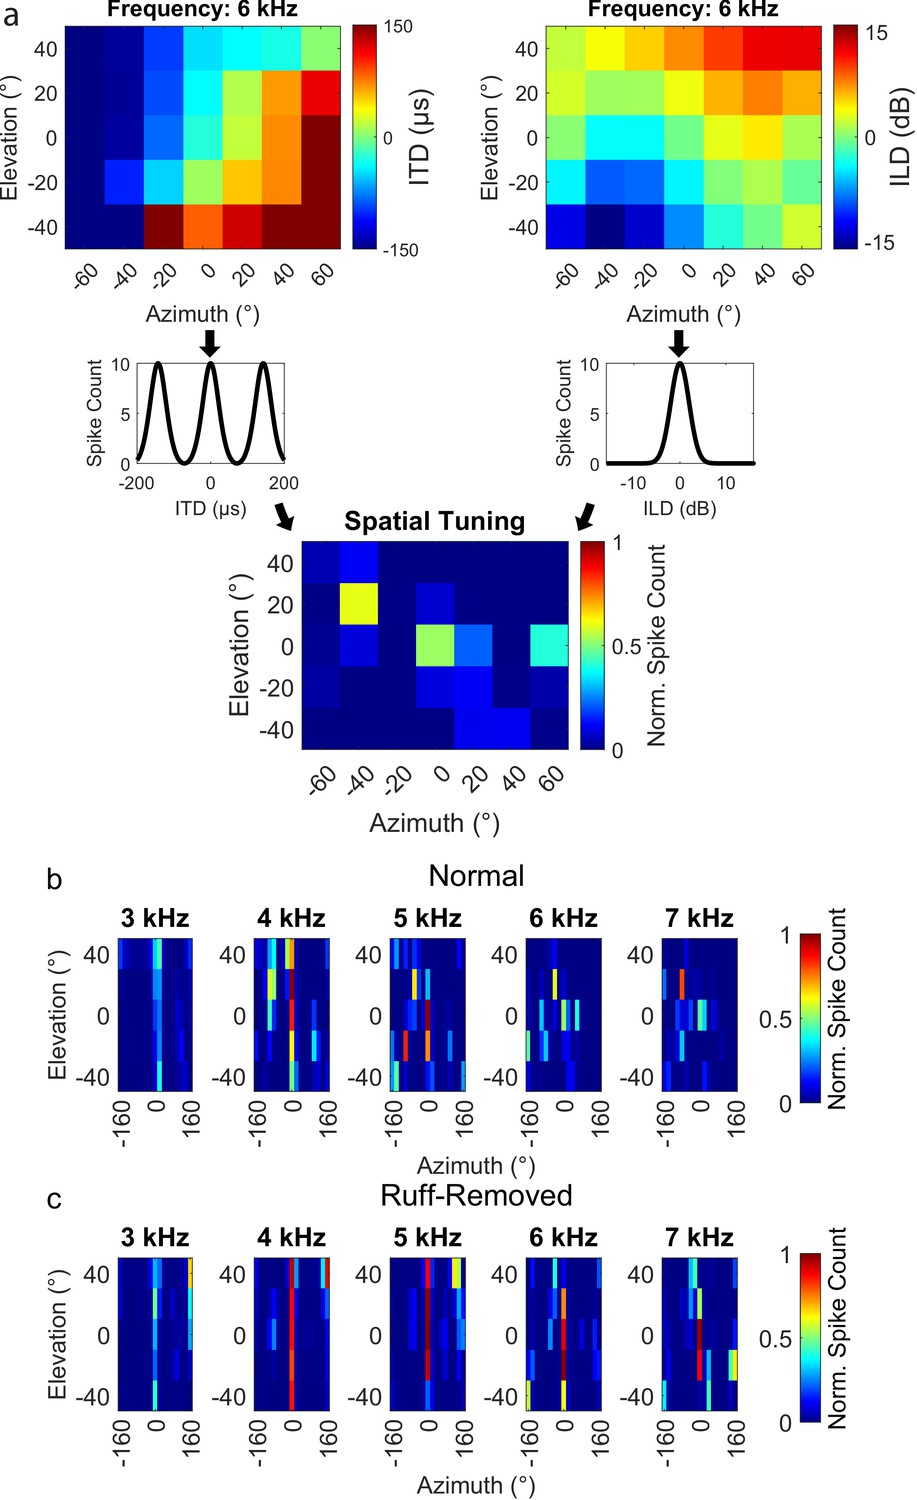
Spatial tuning for frontal space following ruff removal does not show systematic alterations based on frequency.
(a) Schematic methodology to determine spatial tuning, using 6 kHz as an exemplary tone. Interaural time difference (ITD) (upper left) and interaural level difference (ILD) (upper right) were estimated as a function of the spatial location of the sound source. Neural responses were predicted by entering the estimated ITD and ILD into modeled tuning curves for a simulated frontally tuned neuron (middle plots). The overall spatial tuning was calculated by combinatorial multiplication then normalization of these modeled responses (lower plot). (b, c) Spatial tuning maps for owls before (b) and after (c) ruff removal, displayed for five example tones.
Figure 7 with 1 supplement
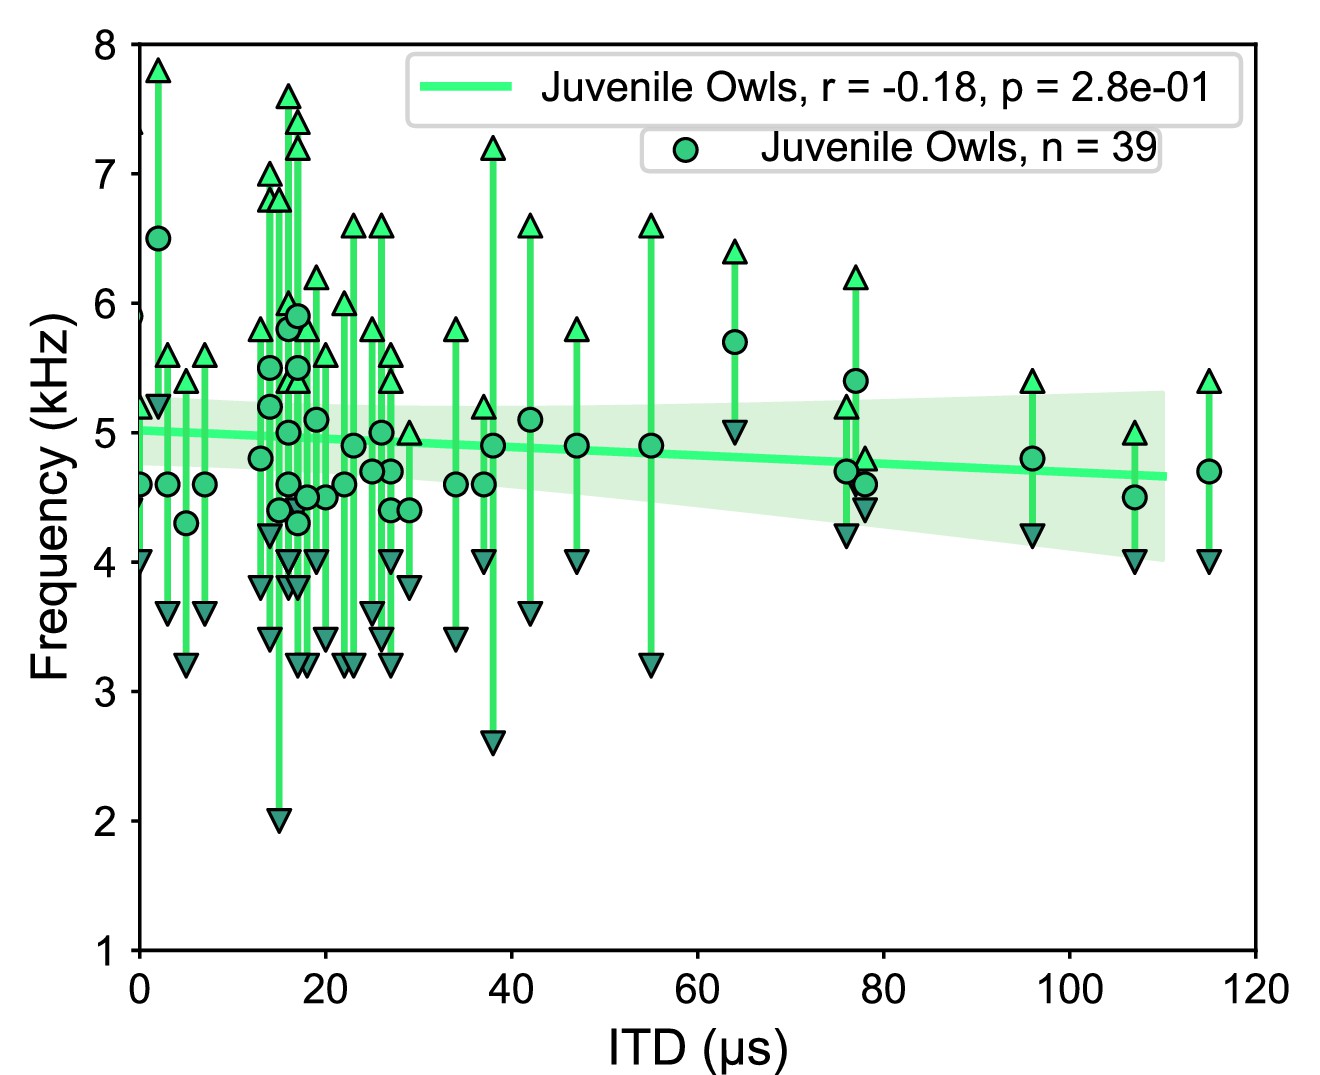
Tuning properties of the juvenile owl’s inferior colliculus (ICx) neurons.
ICx neurons recorded from juvenile owls, before the facial ruff developed, plotted by their best interaural time difference (ITD) and frequency tuning range. Weak correlation between ITD and frequency (green line).
Figure 7—figure supplement 1
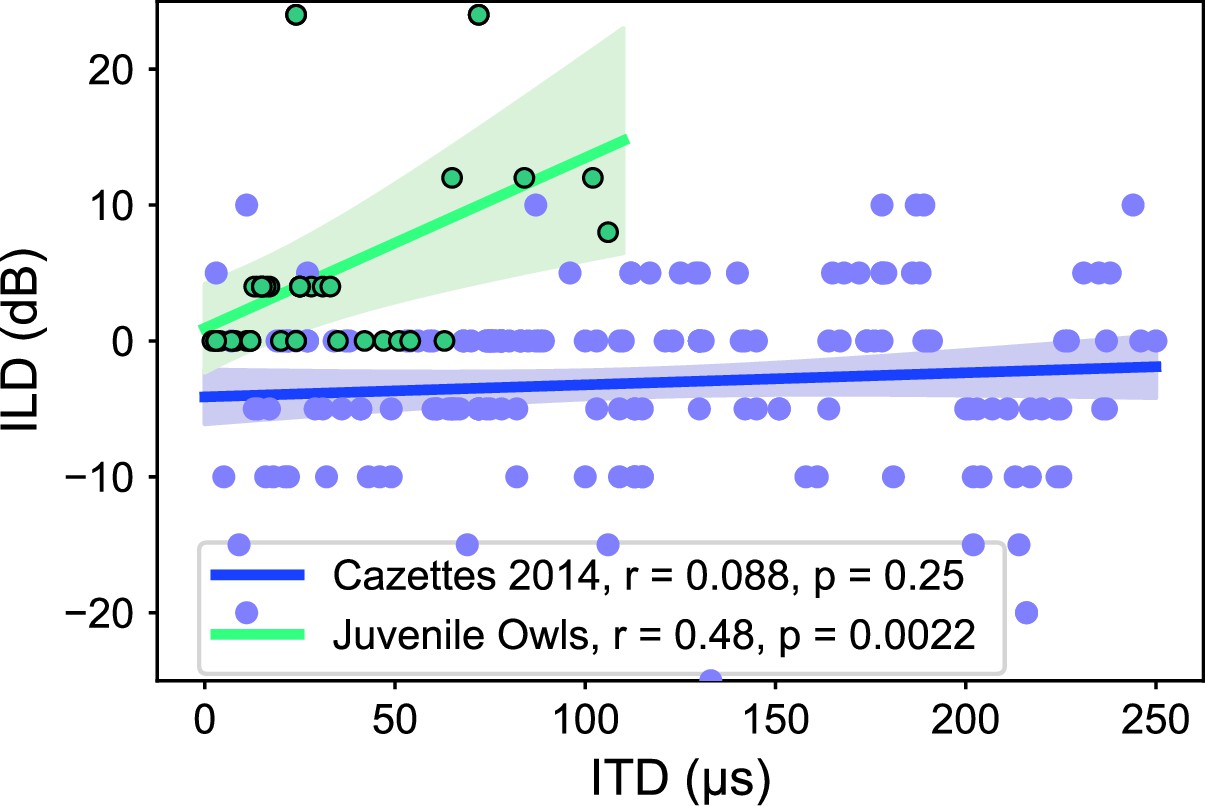
Correlated interaural level difference (ILD) and interaural time difference (ITD) tuning in the juvenile owl inferior colliculus (ICx).
Best ILD plotted as a function of best ITD of ICx neurons from juvenile (green dots) and normal owls (blue dots, from Cazettes et al., 2014). Linear correlations for juvenile (green line) and normal owls (blue line) plotted, showing a significant correlation of ITD and ILD tuning in juvenile owls.
Figure 8
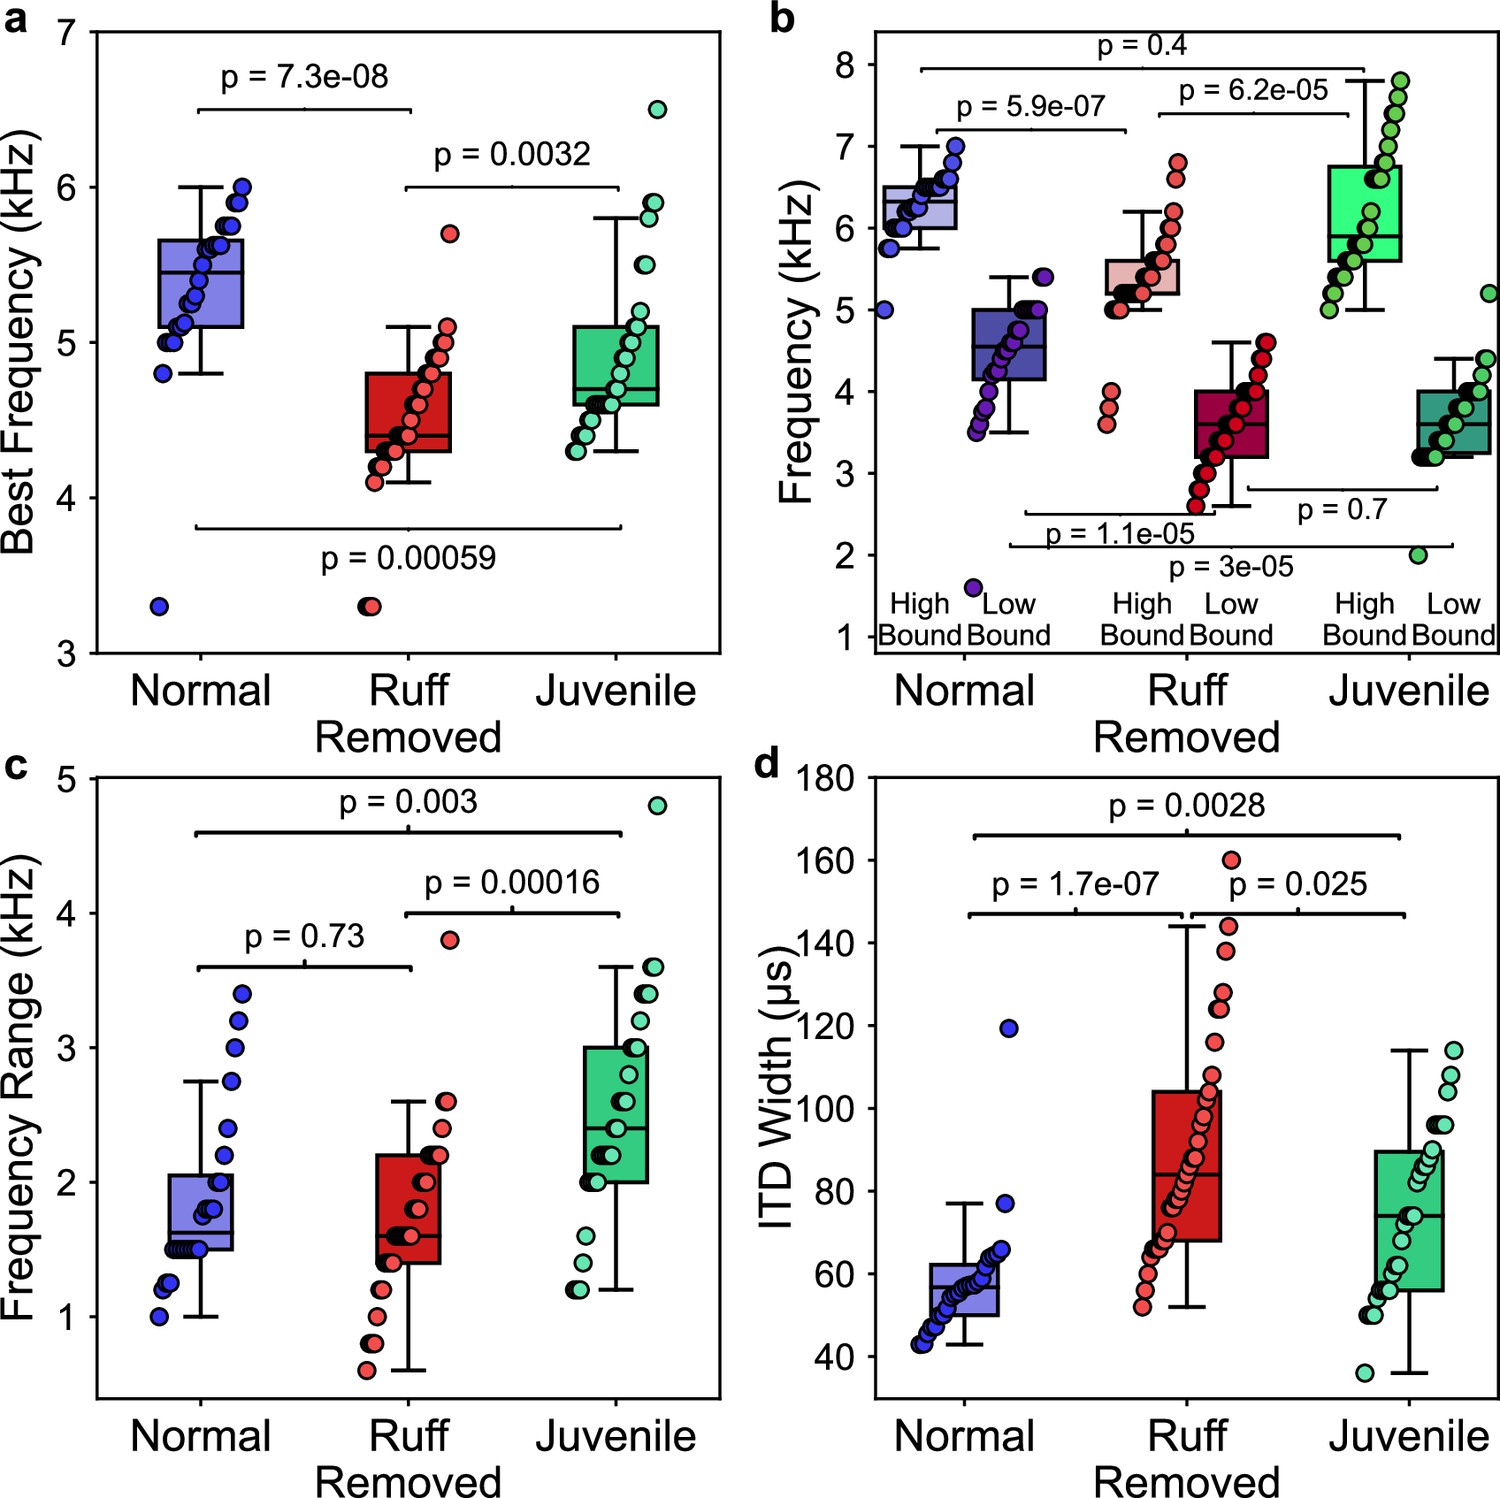
Comparisons of frequency and spatial tunings of frontally tuned inferior colliculus (ICx) neurons between normal, ruff-removed and juvenile owls.
(a) Box plots indicating the distribution of best frequencies for neurons tuned to frontal interaural time differences (ITDs) (±30 µs, equivalent to approximately ±10° azimuth) for normal (blue, n = 24), ruff-removed (red, n = 33) and juvenile (green, n = 30) owls . (b) Box plots for each group, denoting the high and low bounds of frequency tuning curves. (c) Box plots representing the responsive frequency range for neurons of each group. (d) Box plots representing the width of ITD tuning curves of each group. Individual neurons and Mann–Whitney U-test p-values used to compare groups are shown over each box plot.
Author response image 1
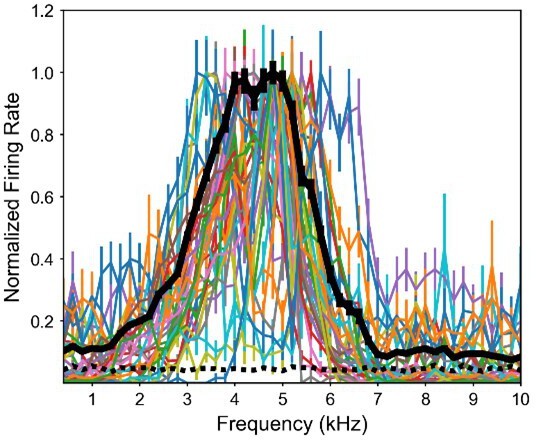
Frequency tuning of frontally-tuned ICx neurons in ruff-removed owls.
Tuning curves are normalized by the max response. Thick black line indicates the average tuning curve. Dashed black line indicates basal response.
Author response image 2
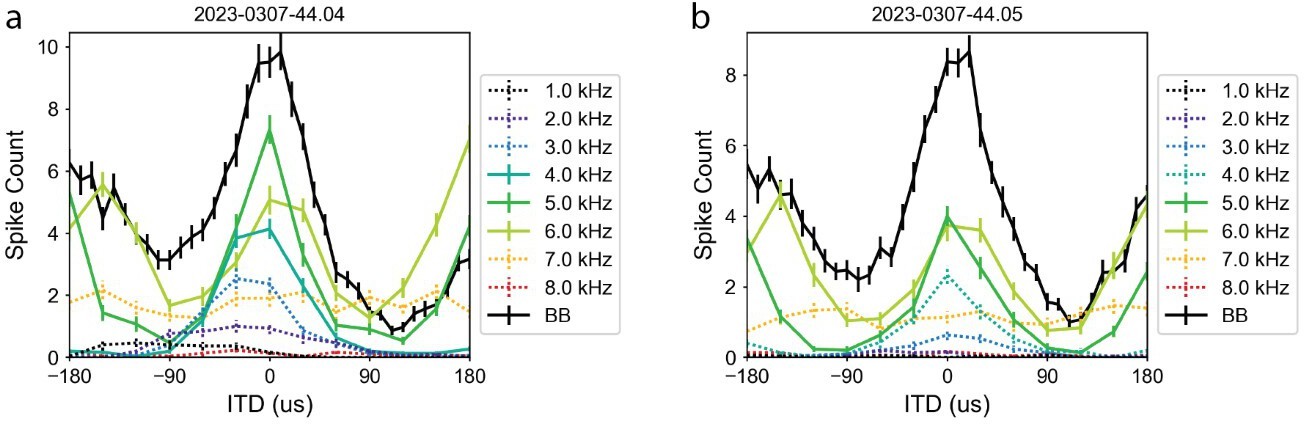
ITD sensitivity across frequencies in ruff-removed owl.
Two example neurons shown in a and b. ITD tuning for tones (colored) and broadband (black) plotted by firing rate (non-normalized). Solid colored lines indicate responses to frequencies that are within the neuron’s preferred frequency range (i.e. above the half-height, see Methods), dashed lines indicate frequencies outside of the neuron’s frequency range.
Additional files
Download links
A two-part list of links to download the article, or parts of the article, in various formats.
Downloads (link to download the article as PDF)
Open citations (links to open the citations from this article in various online reference manager services)
Cite this article (links to download the citations from this article in formats compatible with various reference manager tools)
Development of frequency tuning shaped by spatial cue reliability in the barn owl’s auditory midbrain
eLife 12:e84760.
https://doi.org/10.7554/eLife.84760


