A high-throughput cytotoxicity screening platform reveals agr-independent mutations in bacteraemia-associated Staphylococcus aureus that promote intracellular persistence
- Department of Microbiology and Immunology, Doherty Institute, University of Melbourne, Australia
- Infection and Immunity Program, Department of Microbiology and Biomedicine Discovery Institute, Monash University, Australia
- Biological Optical Microscopy Platform, University of Melbourne, Australia
- School of Microbiology, University College Cork, Ireland
- School of Medicine, University College Cork, Ireland
- APC Microbiome Ireland, University College Cork, Ireland
- School of Cellular and Molecular Medicine, University of Bristol, United Kingdom
- Microbiological Diagnostic Unit Public Health Laboratory, Department of Microbiology and Immunology, Doherty Institute, University of Melbourne, Australia
Figures
Figure 1 with 1 supplement
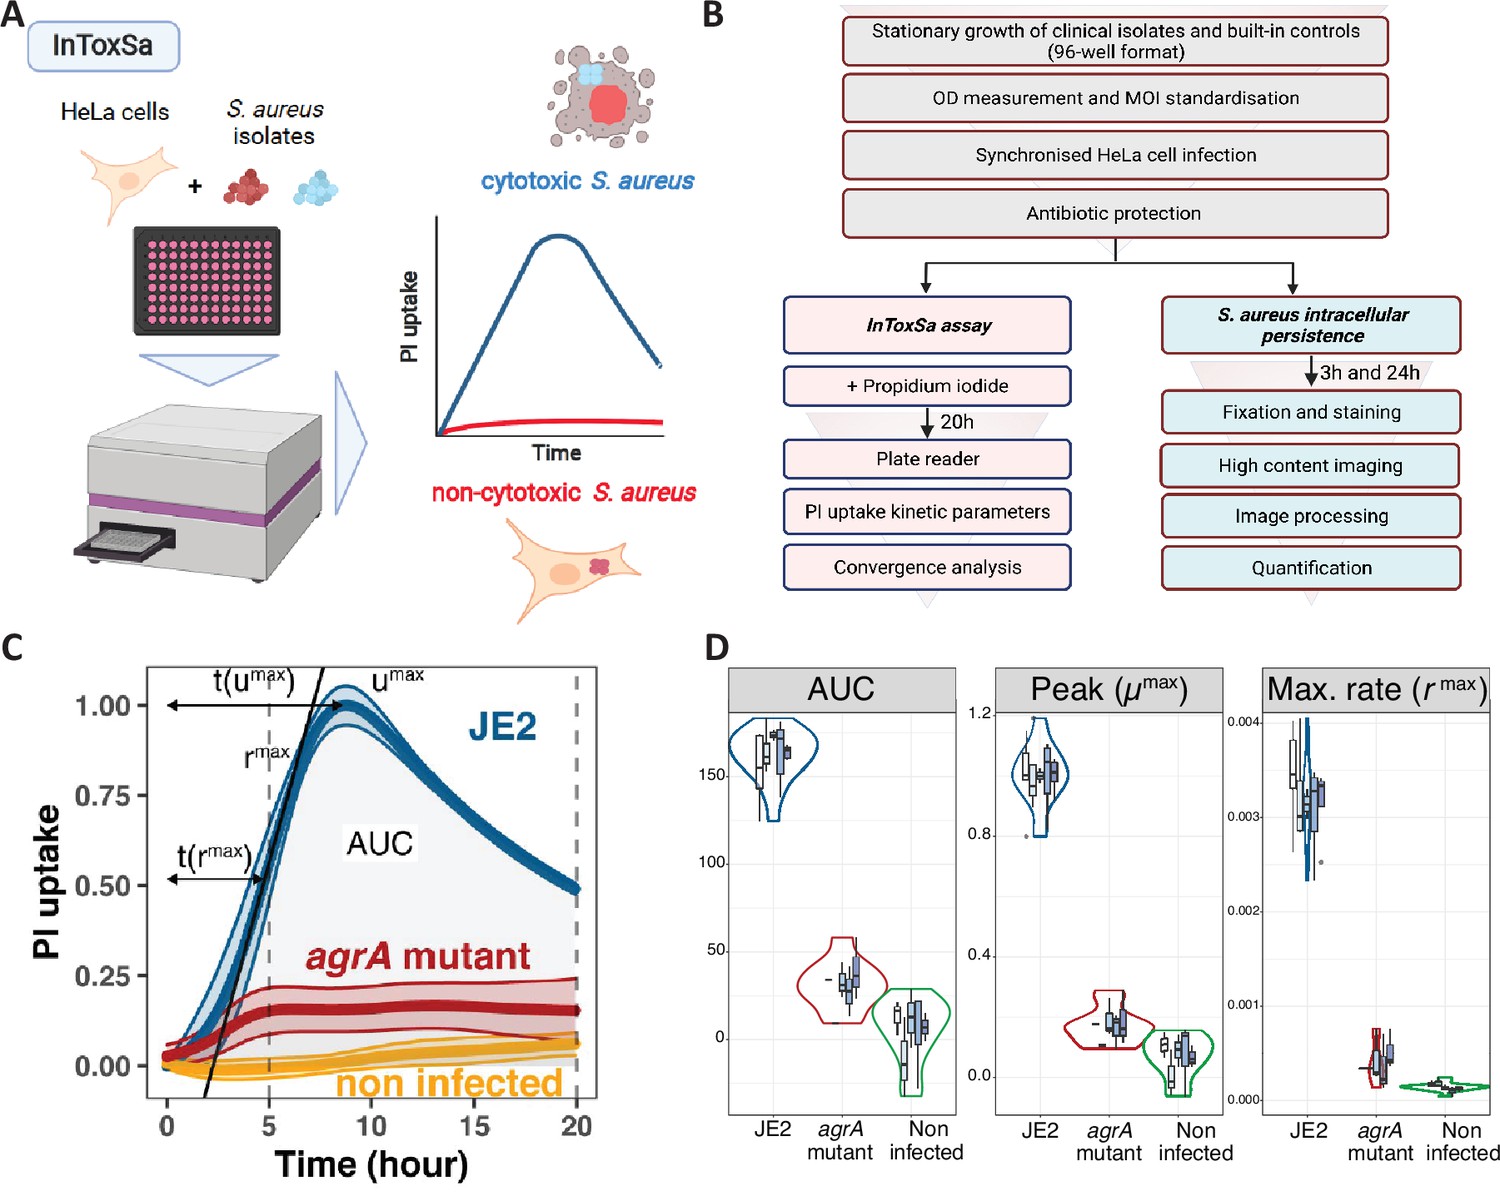
Establishing the intracellular toxicity of S. aureus (InToxSa) assay.
(A) Overview of InToxSa assay. (B) Flow chart of the analytical pathway. (C) Plot of propidium iodide (PI) fluorescence uptake over 20 hr as a measure of S. aureus intracellular cytotoxicity in HeLa cells. Depicted curves are wild-type S. aureus JE2 (blue), the isogenic S. aureus JE2 agrA transposon mutant (red), and uninfected cells (yellow). The PI uptake curve for JE2 is annotated with five kinetic parameters. For each curve, the thick line represents the mean and the shading, the standard deviation. Curves are fitted with cubic smooth splines (see methods). To minimise batch effect, all kinetics data have been transformed using proportion of maximum scoring (POMS) using JE2 controls as reference minimum and maximum values (Little, 2013). x-axis is time and y-axis is PI uptake, represented as a proportion of maximal fluorescence in JE2-infected cells, where for every measured plate, a PI uptake value of 1 represents the maximum of JE2 PI uptake and zero its minimum. (D) Summary of five independent InToxSa experiments to assess assay and parameter variation. Violin plots represent the density distribution of all five replicates (based on Gaussian kernel density estimation) and the nested box plots (boxes represent median, first and third quartiles, whiskers represent are based on ×1.5 interquartile range) show the distribution of within plate replicates (3–5 technical replicates per plate replicate) for the three most discriminatory of seven parameters inferred from the PI uptake data (Figure 1—figure supplement 1).
Figure 1—figure supplement 1
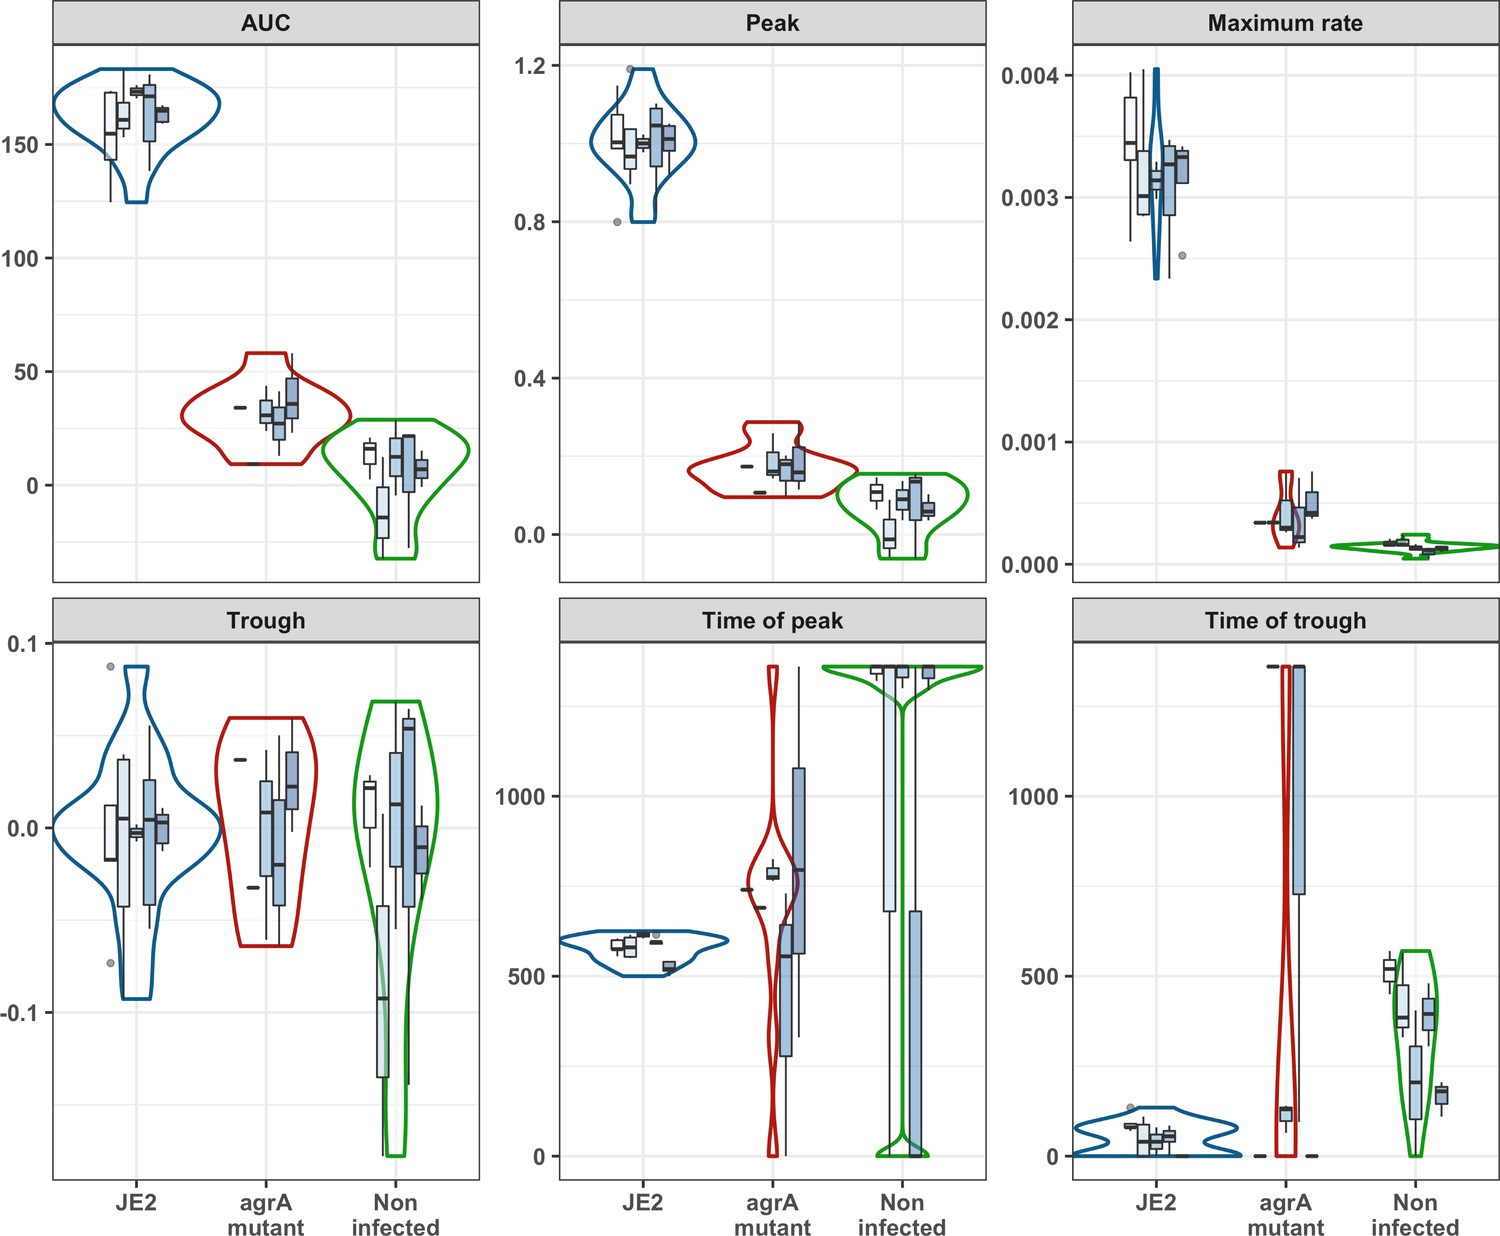
Propidium iodide (PI) uptake curve parameters.
PI uptake area under the curve (AUC), peak PI uptake [mmax], maximum PI uptake rate [rmax], trough, time of PI uptake peak, and time of trough for S. aureus JE2 compared to the agrA mutant. Units for AUC, Peak, and Maximum rate are arbitrary. Time of peak and time of trough (minutes).
Figure 2
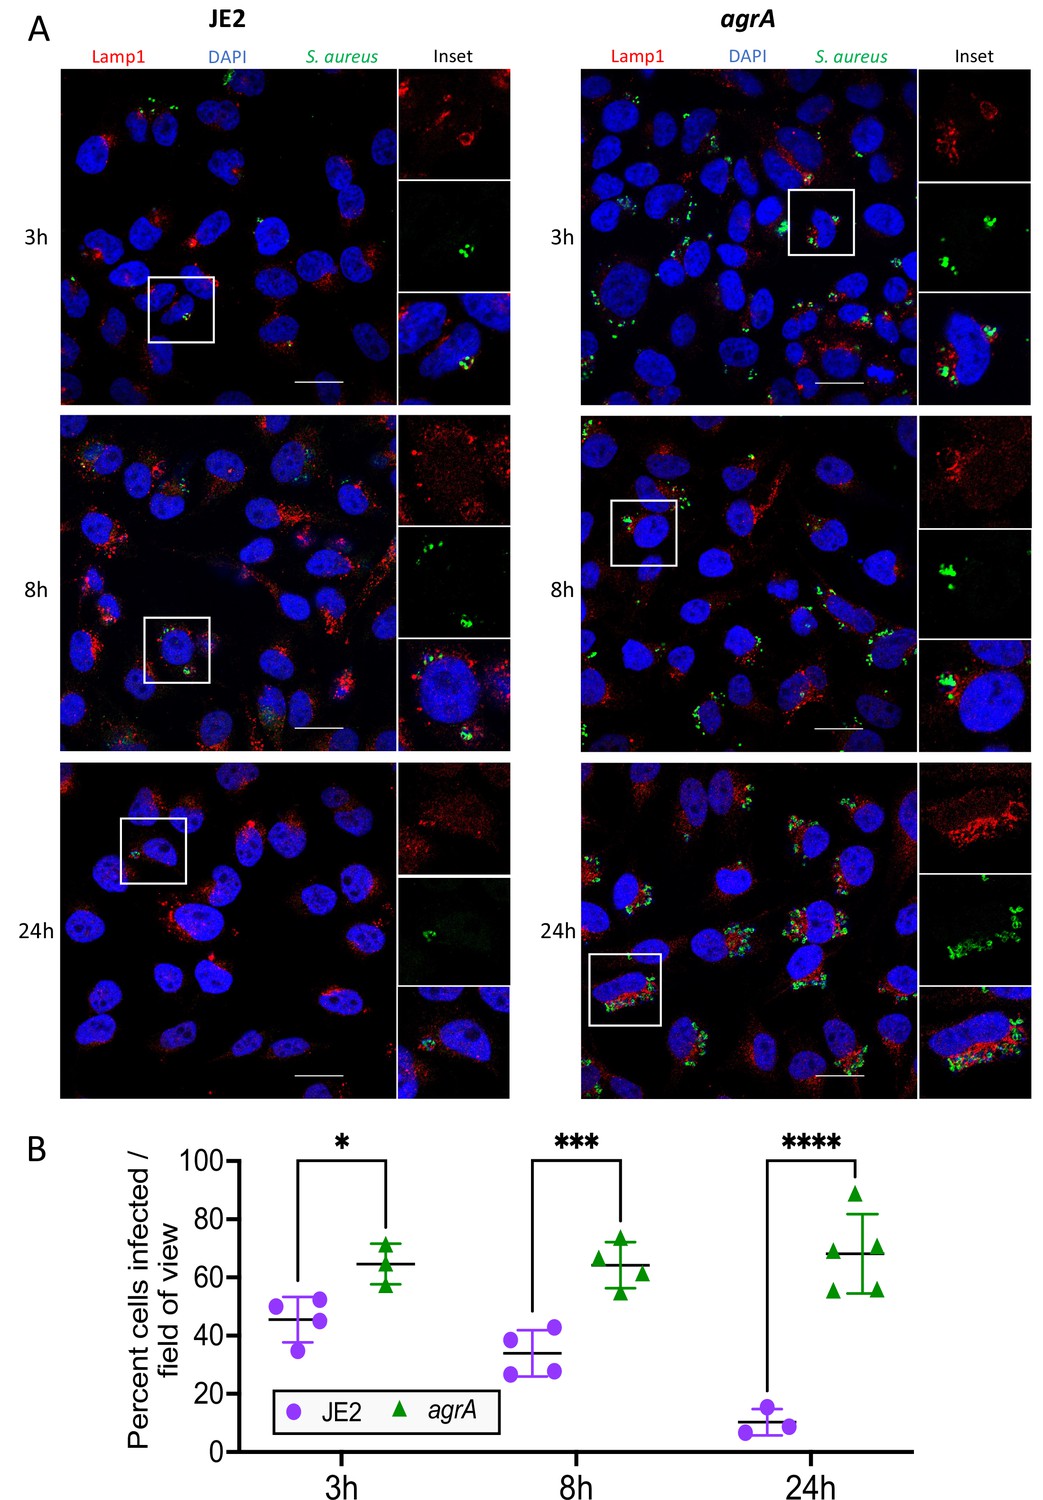
Fluorescence confocal microscopy of intracellular S. aureus.
(A) HeLa cells were infected with S. aureus (wild-type JE2 or isogenic agrA mutant) and imaged at 3, 8, and 24 hr post-infection. Fixed cells were labelled with LAMP-1, S. aureus antibodies and 4′,6-diamidino-2-phenylindole (DAPI). (B) Manual quantification of confocal microscopy. Graph shows the percentage of cells infected with S. aureus at each of the three timepoints. At least 50 cells (n cells = 51–112) were counted in 3–5 fields of view, with at least 12 cells counted per field (n field = 12–40). Shown are all data points, mean, and standard deviation. Significance was assessed using two-way analysis of variance (ANOVA). Null hypothesis (no difference between means) rejected for adj p < 0.05. *p = 0.04, ***p = 0.007, ****p = <0.0001.
Figure 3
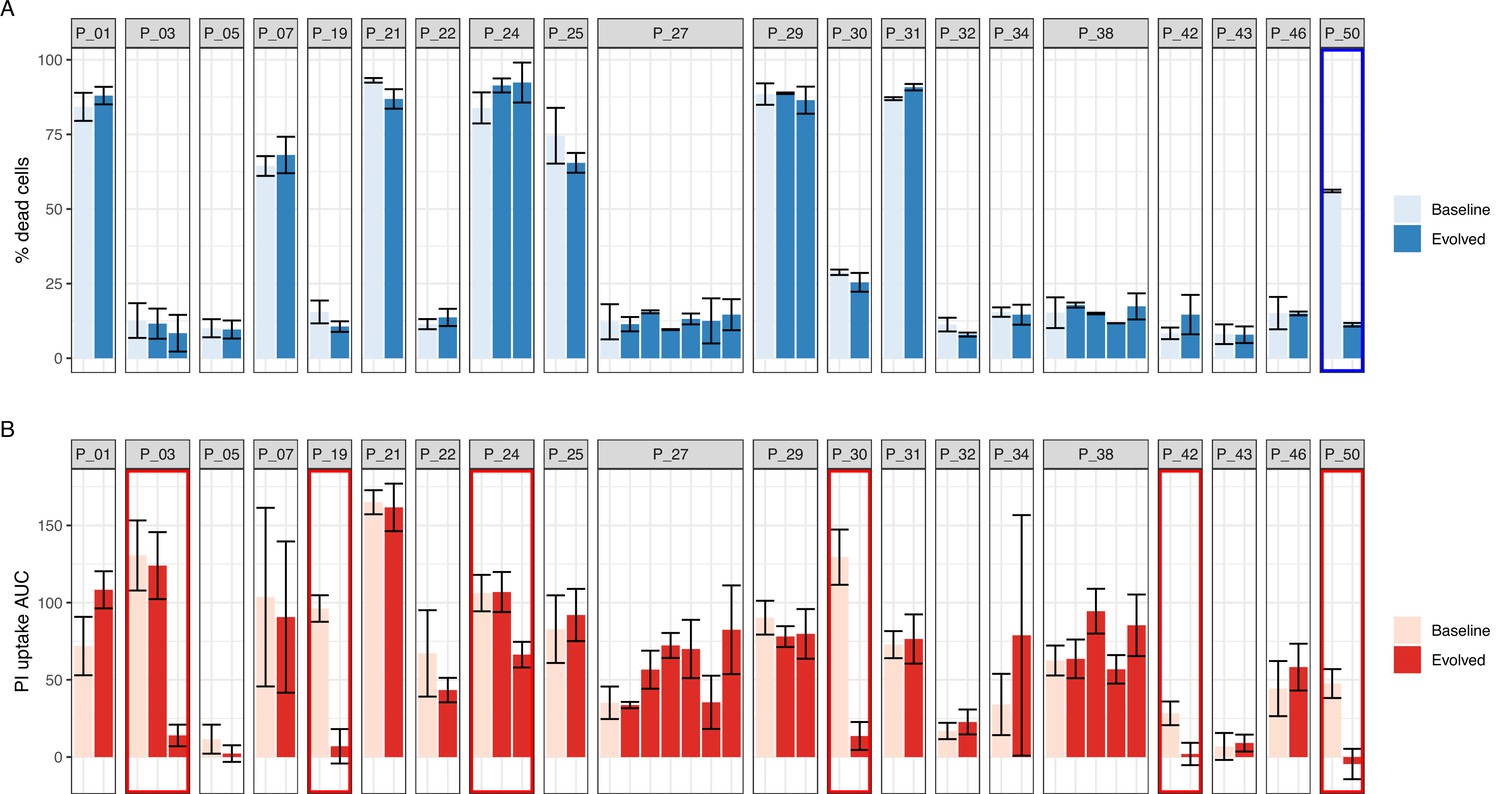
Performance of intracellular toxicity of S. aureus (InToxSa) against trypan blue exclusion assay.
Comparative evaluation of S. aureus intracellular cytotoxicity with bacterial supernatants for 51 paired isolates from 20 patients with S. aureus bacteraemia. (A) Supernatant-based cytotoxicity on THP1 cells. Episode with significant difference in THP1 survival between baseline and evolved isolates is boxed in blue (p < 0.05). Assay performed in biological and technical duplicates. Bars represent mean percentage of dead cells; error bars show range between duplicates. Toxicity within isolate groups was compared using analysis of variance (ANOVA) with Bonferroni correction (B) propidium iodide (PI) uptake of infected HeLa cells. Values are mean area under the curve (AUC) and standard deviation. Episodes exhibiting significant phenotypic differences between baseline and evolved isolates are boxed in red (p < 0.05). Assay performed in biological and technical triplicates. PI uptake AUC within isolate groups was compared using ANOVA with Bonferroni correction.
Figure 4 with 4 supplements
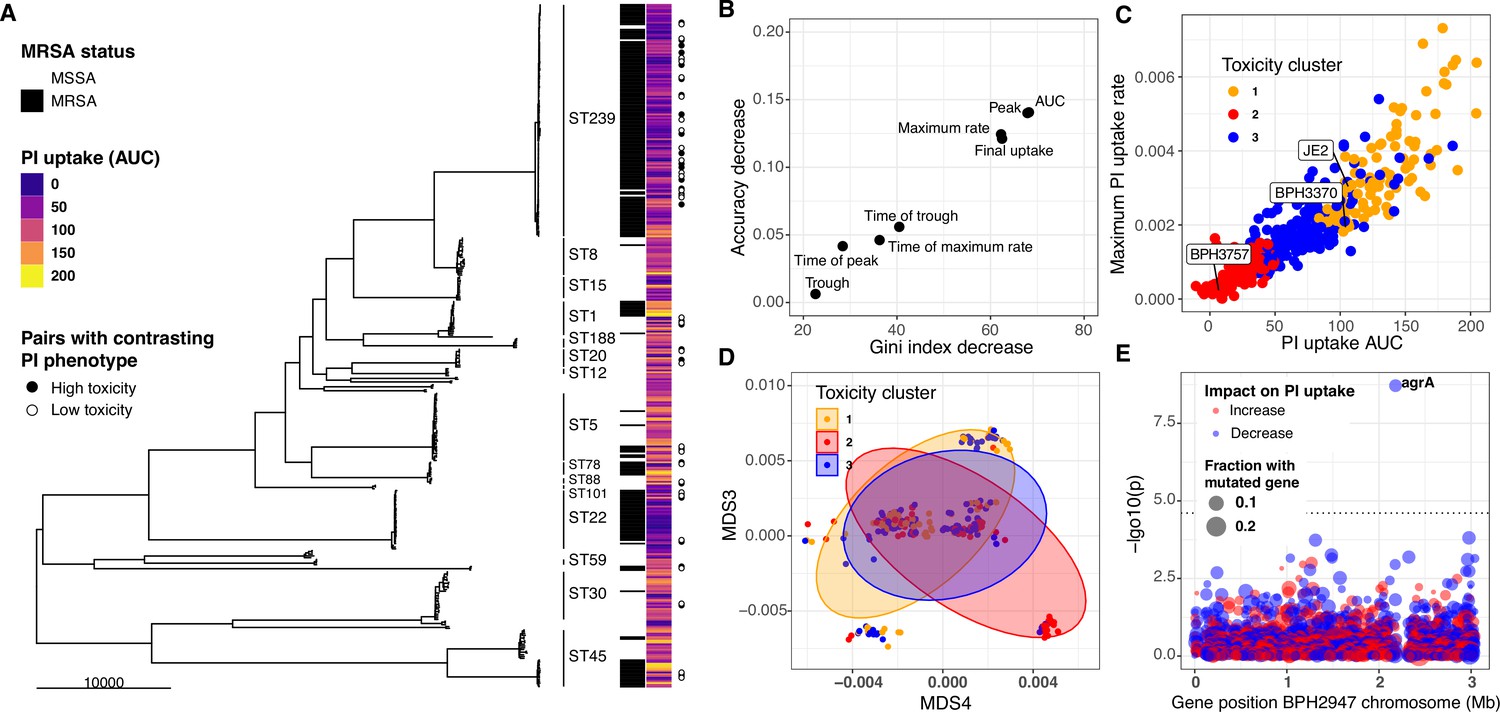
Intracellular cytotoxicity assessment of 387 bloodstream-associated clinical S. aureus isolates.
(A) Maximum likelihood phylogeny based on 164,449 core-genome SNPs for 387 S. aureus, showing sequence type (ST) and MRSA distribution. The heatmap depicts the mean area under the curve (AUC) of cytotoxicity based on intracellular toxicity of S. aureus (InToxSa) propidium iodide (PI) uptake assay. AUC values range from non-cytotoxic (score: 0, dark blue) to highly cytotoxic (score: 200, yellow). Adjacent to the heatmap (closed and open circles) are 28 pairs of genetically related, but phenotypically discordant isolates (see Figure 5). (B) ‘Variable importance plot’ showing different PI uptake metrics (features) in an unsupervised random forest (RF) machine learning model. The higher the value of ‘accuracy decrease’ or ‘Gini index decrease’, the higher the importance of the feature in the model. (C) Scatter plot of the two most discriminatory PI uptake kinetic metrics (AUC and maximum PI uptake rate). Dots are coloured based on the clustering obtained from the proximity matrix of the RF model. (D) Scatter plot showing the two principal components with the strongest association with PI uptake (lineage effect as measured using pyseer). Dots and ellipses are coloured based on the clustering obtained from the proximity matrix of the unsupervised machine learning model. (E) Manhattan plot of gene-burden genome-wide association study (GWAS) of cytotoxicity (PI uptake AUC) of 387 clinical isolates.
Figure 4—figure supplement 1
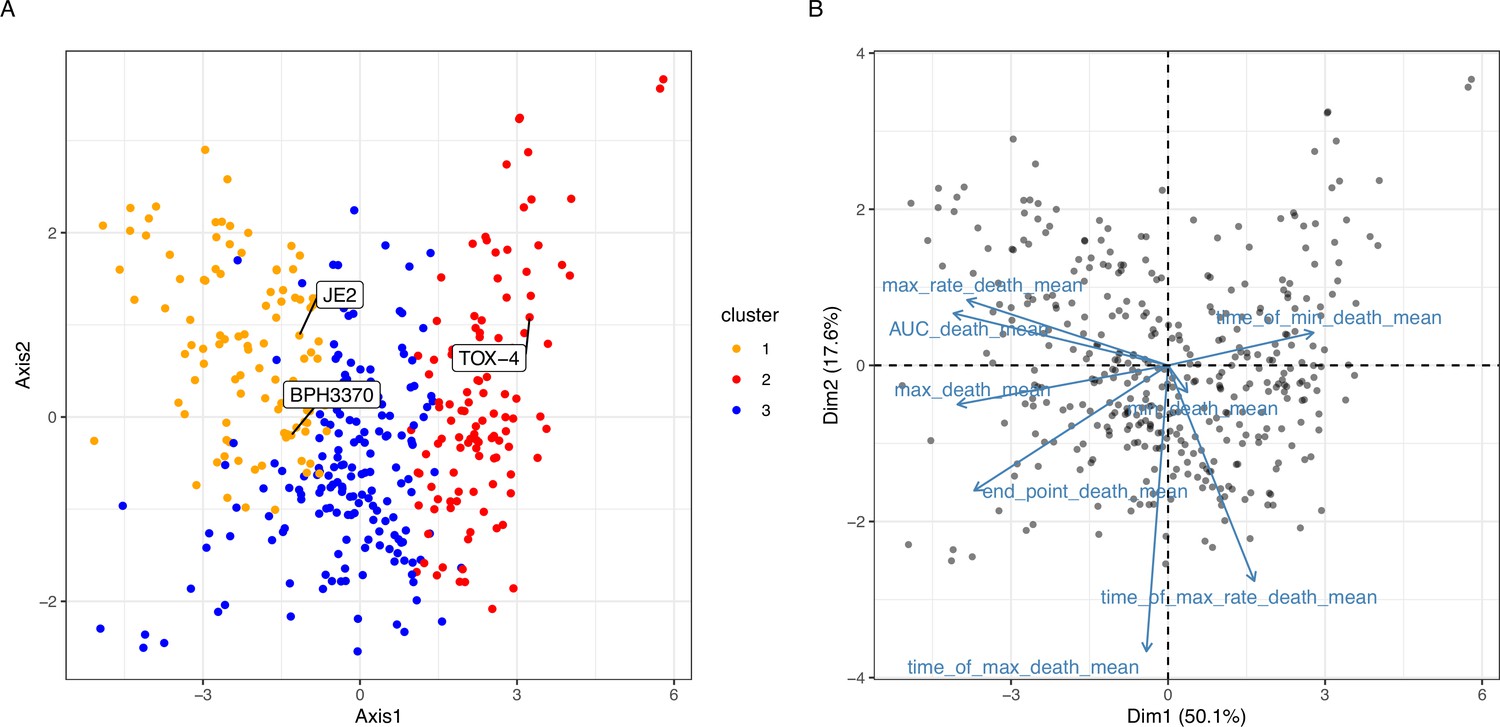
Principal component analysis of mean value of propidium iodide (PI) uptake parameters.
(A) Scatter plot of the first two principal components, representing 67% of the variance. Dots are coloured based on the clustering obtained from the proximity matrix of the unsupervised model. (B) Loading plot illustrating the contribution of each PI uptake parameter to the first two PCA components (depicted in panel A). The loadings are represented by the arrows: the length of the arrow is proportional to the strength of the PI uptake parameter contribution and the angle represents the direction of the contribution.
Figure 4—figure supplement 2

Lineage effects of cytotoxicity (area under the curve [AUC] of propidium iodide [PI] uptake).
Lineages were calculated using multidimensional scaling on a distance matrix generated by Mash. The association with the cytotoxicity phenotype was calculated by computing the fixed effect of the first 10 components by linear regression.
Figure 4—figure supplement 3
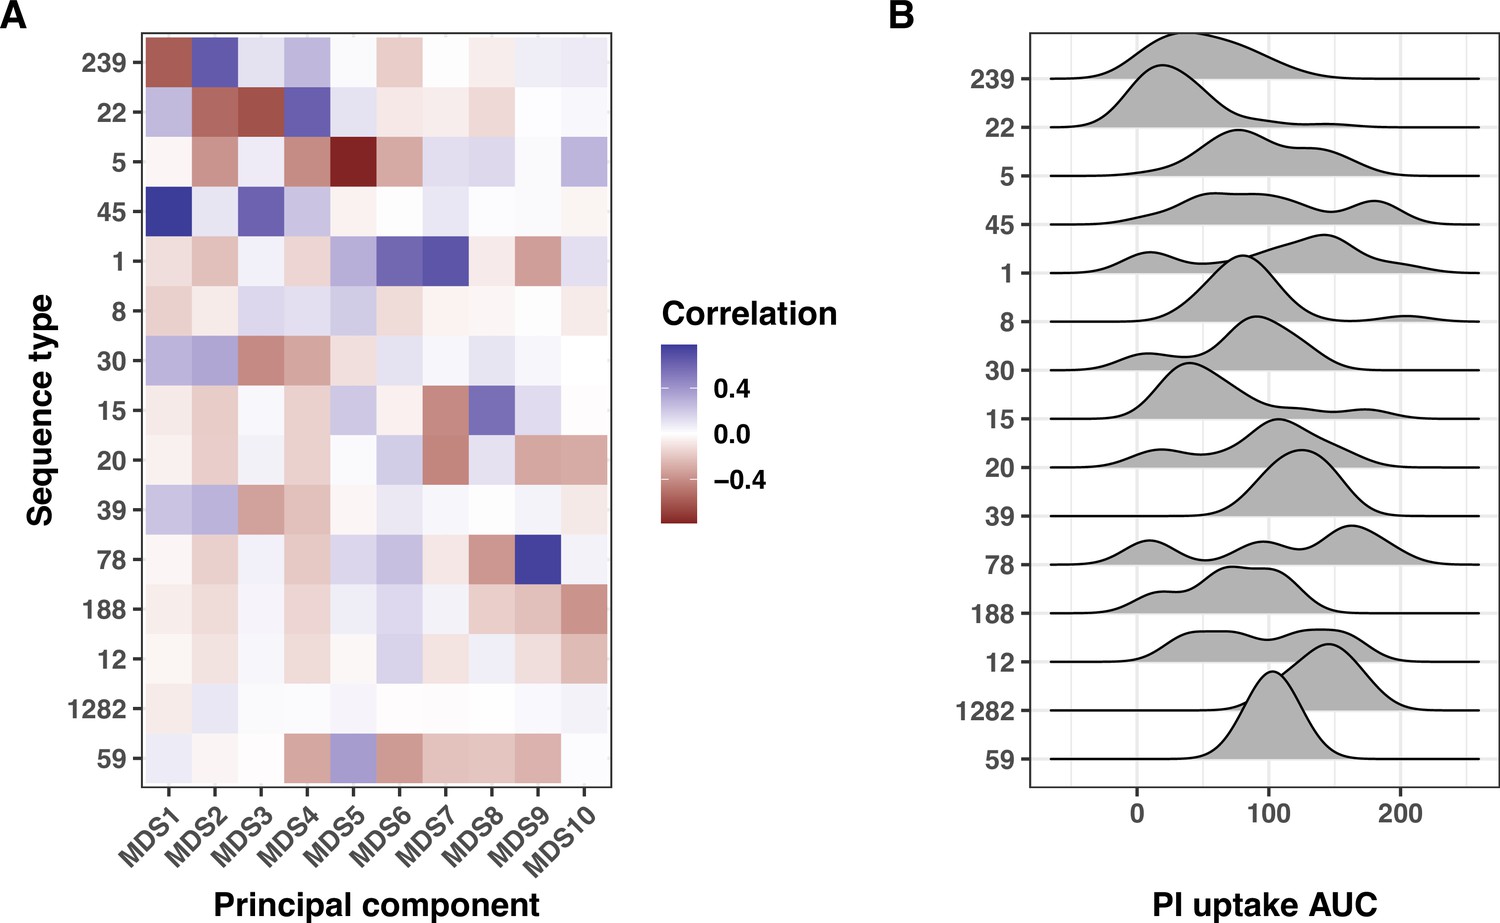
Interplay between multidimensional scaling (MDS) axes, sequence types (STs), and propidium iodide (PI) uptake.
(A) Heatmap showing the correlation between the first 10 MDS axes and the 15 most prevalent STs. Here, MDS was applied to a genetic distance matrix calculated from Mash sketches (10,000 hashed k-mers per set). The correlations were calculated using the R package bugwas. (B) Ridge plots depicting the PI uptake distribution for the 15 most prevalent STs.
Figure 4—figure supplement 4
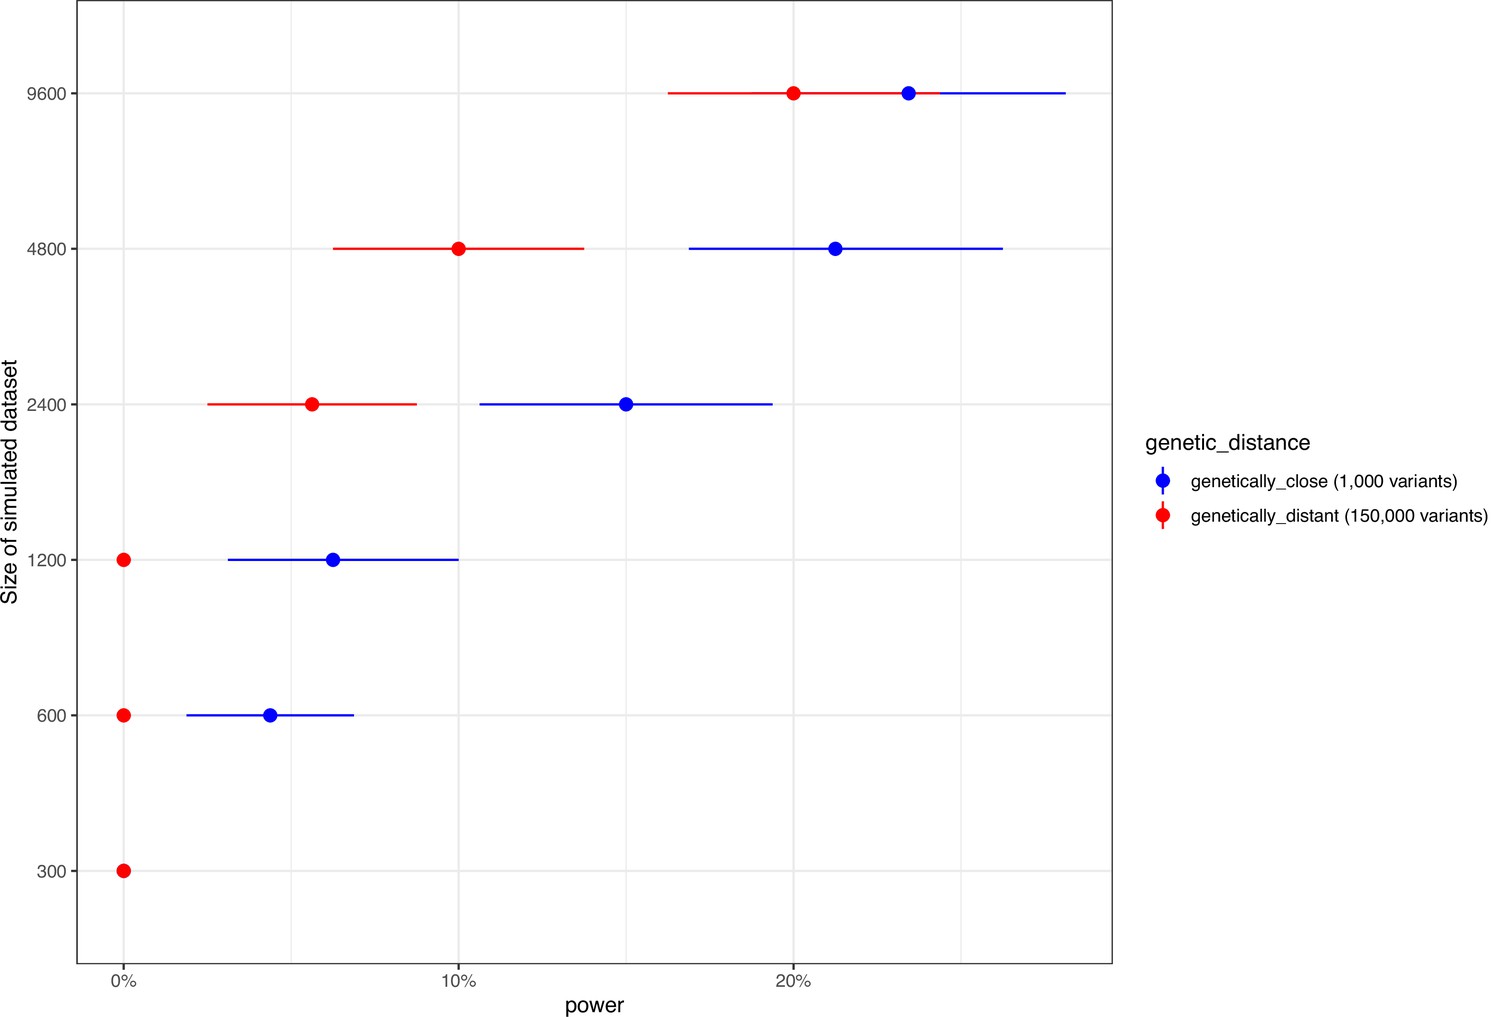
Genome-wide association study (GWAS) power calculation according to the number of isolates and number of variants for a phenotype with 50% heritability.
Figure 5 with 3 supplements
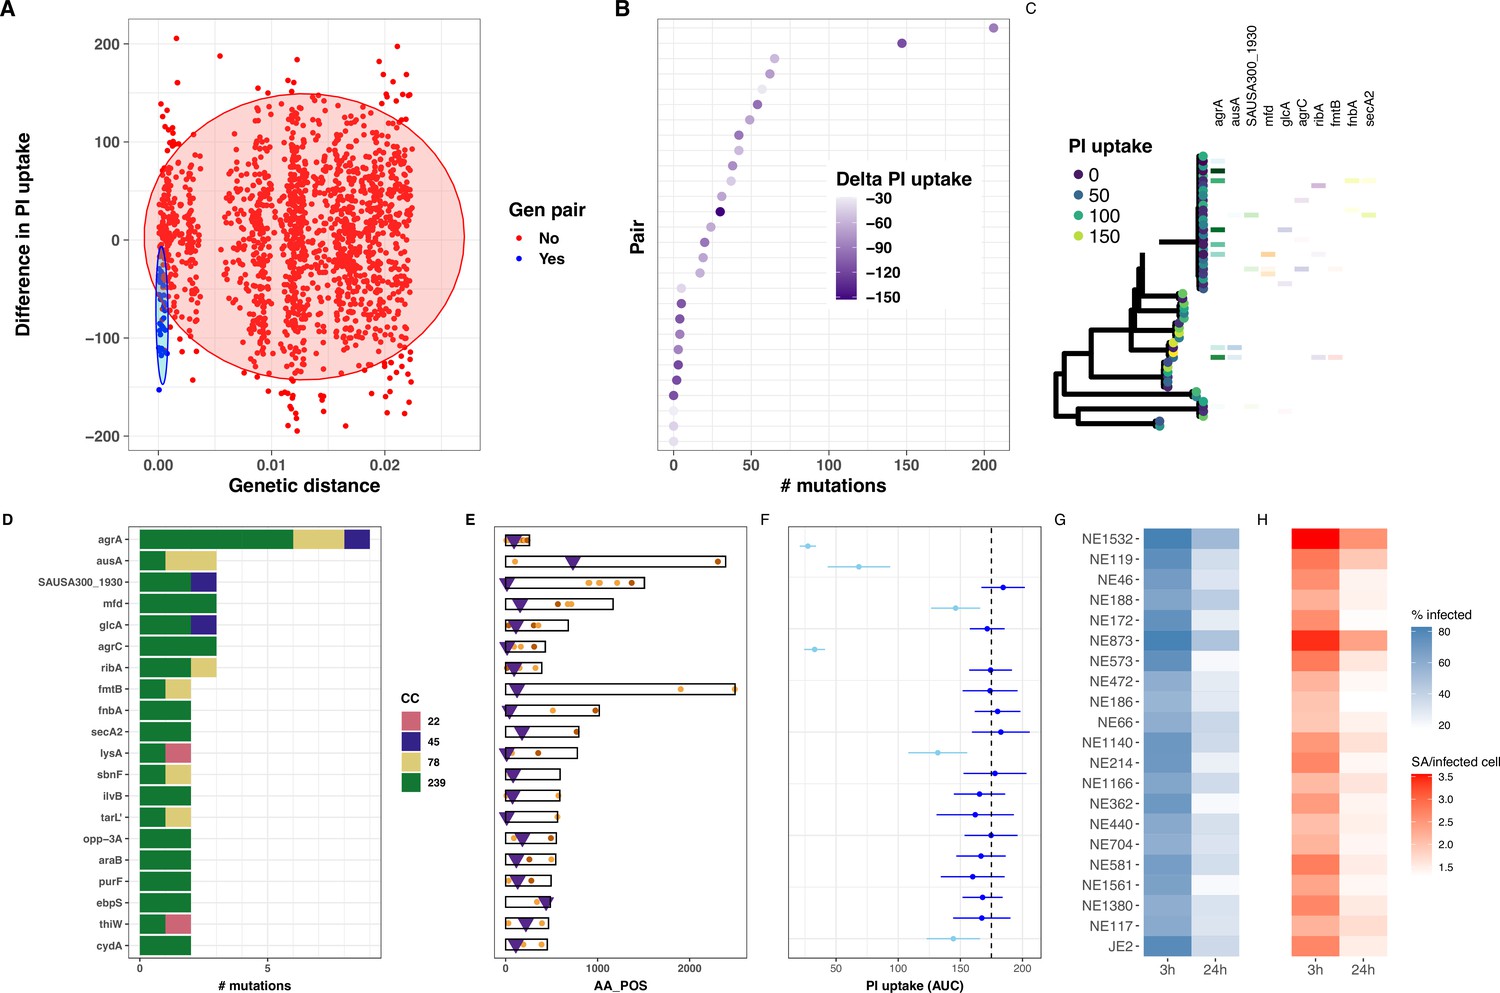
Evolutionary convergence analysis to identify S.aureus genes linked with intracellular cytotoxicity.
(A) Distribution of genetic distance determined by pairwise comparisons using MASH distances among the 387 S. aureus genomes, against the difference in propidium iodide (PI) uptake area under the curve (AUC) between each pair. The shaded circles denote the 95% multivariate t-distribution (blue: pairs included in the convergence analysis; red: pairs excluded from the analysis). (B) Ranked distribution of the difference in PI uptake AUC between the 28 pairs. Heatmap shows reduction in AUC values. (C) Core-genome phylogeny for the 28 pairs of isolates. Tree tips are coloured by PI uptake AUC. Aligned with the phylogeny, the 10 first genes targeted by convergent mutations are shown. (D) Number of mutations detected for each of the 20 genes, coloured by S. aureus ST. (E) Location of convergent mutations in each gene (non-synonymous in orange, truncating in maroon), purple triangles indicate the position of transposon inserted in tested transposon mutant. (F) Effect of loss of function for each of the 20 genes on intracellular cytotoxicity measured by intracellular toxicity of S. aureus (InToxSa), using mutants from the Nebraska transposon library. Dotted line shows mean PI uptake AUC of positive control strain JE2. Depicted are mean (dot) and standard deviation (SD; bar) of biological triplicates. Mutants causing significantly lower PI uptake AUC to JE2 are depicted in light blue, non-significant changes are in dark blue (Wilcoxon rank-sum test, corrected for multiple testing). (G, H) Operetta high-content imaging analysis for each of the 20 Nebraska transposon mutants and JE2 positive control. Heatmaps show the percentage of HeLa cells infected with each transposon mutant (blue) and the number of bacteria per infected cells at 3 and 24 hr post-infection (red).
Figure 5—figure supplement 1
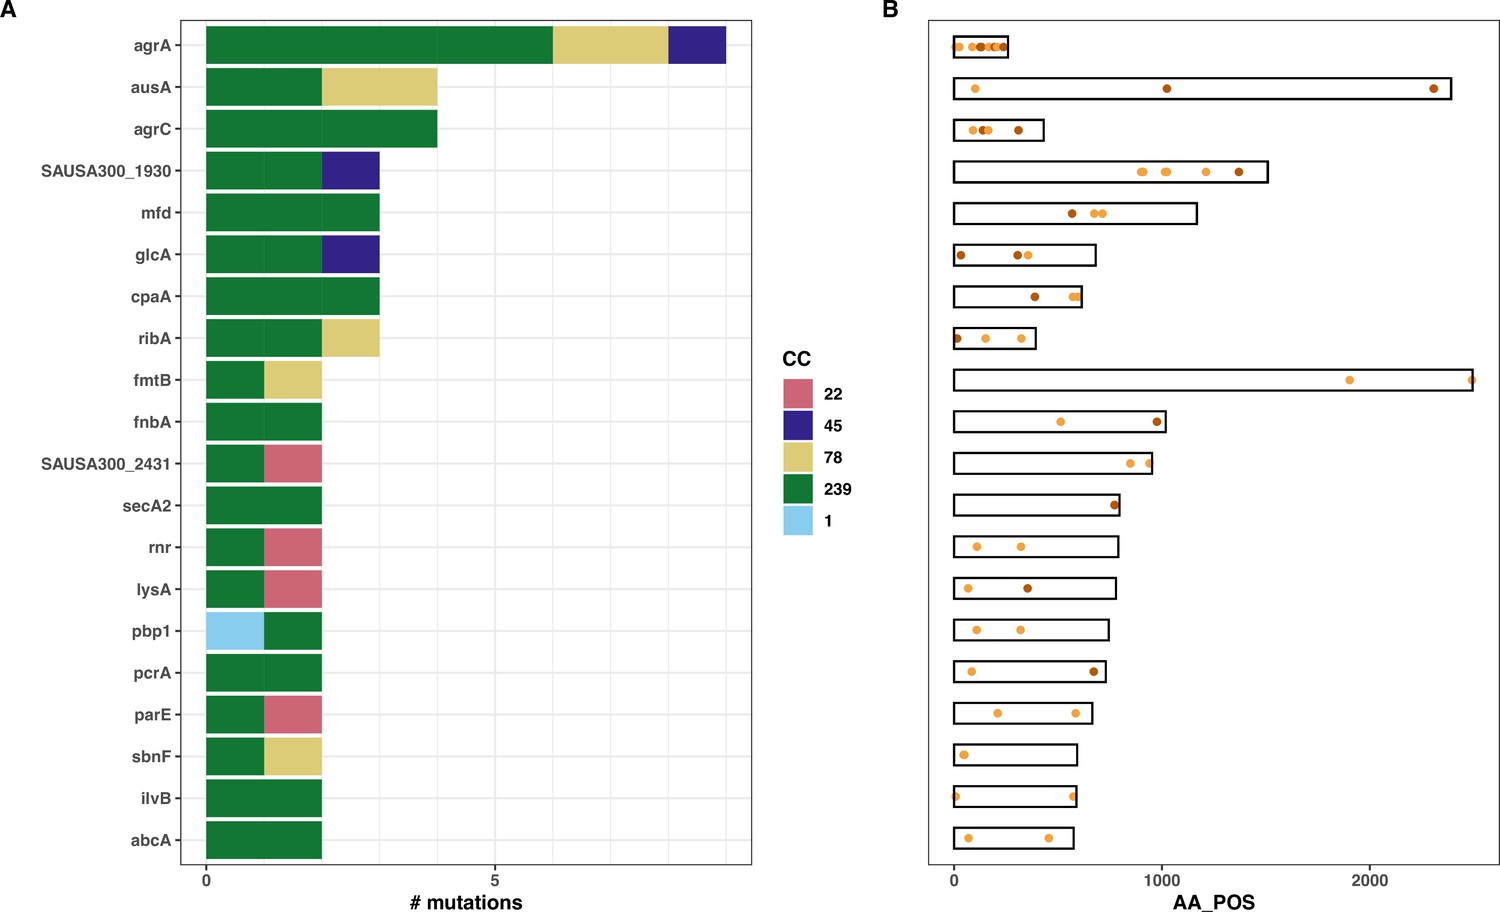
Identification of convergent mutations associated with intracellular toxicity and persistence.
(A) Number of mutations detected for each of the 20 most convergent genes, coloured by S. aureus ST (B) Mutation maps.
Figure 5—figure supplement 2
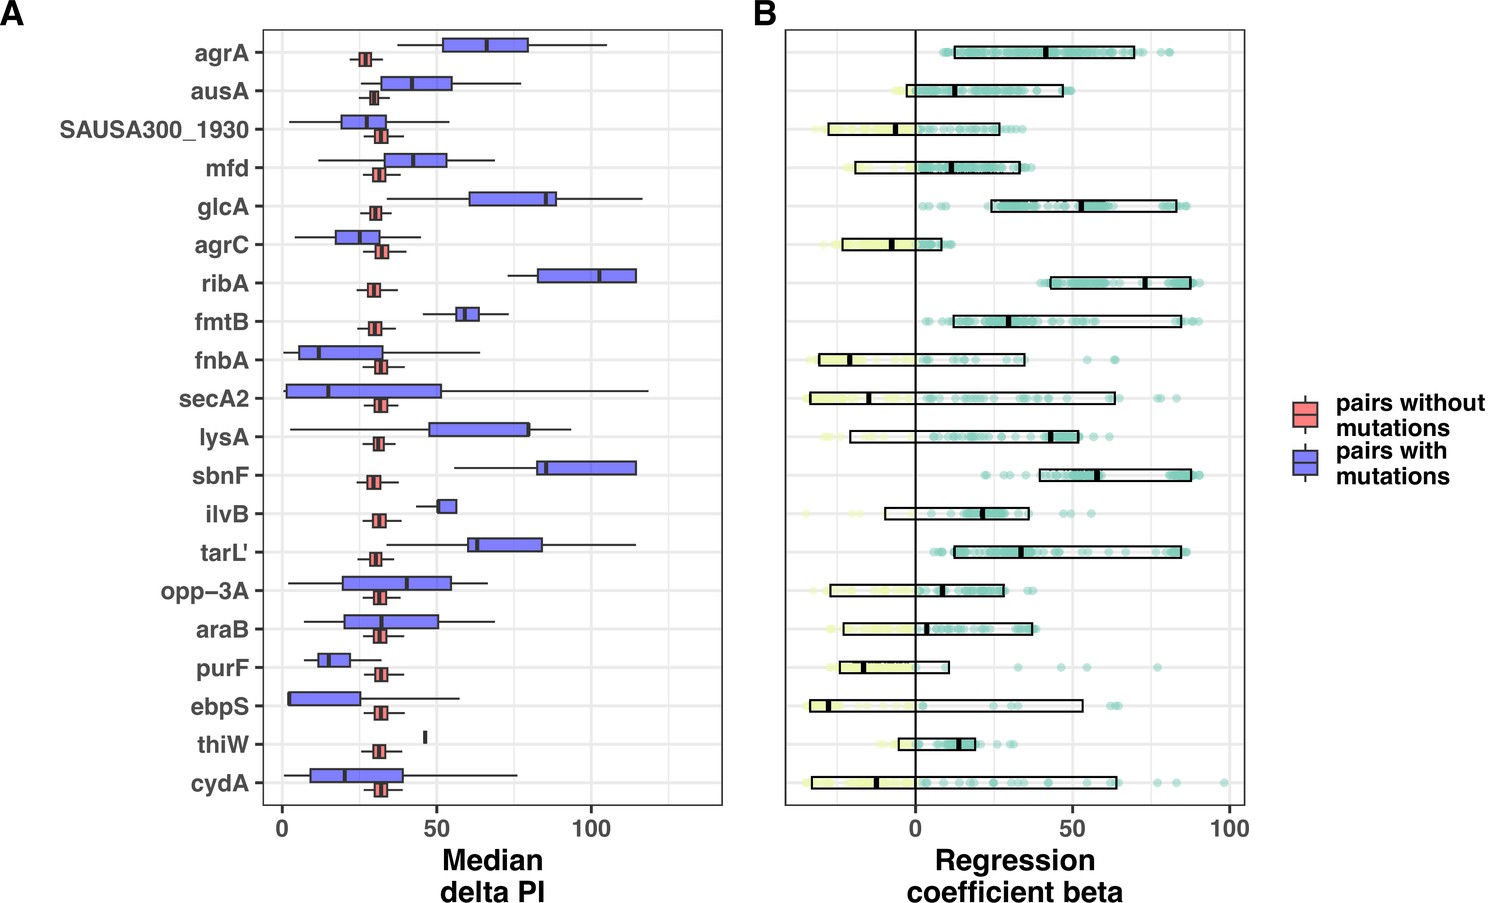
Automated genetic pairs analysis (100 replicated sets of phylogenetically independent genetic pairs).
(A) Comparison of median propidium iodide (PI) uptake area under the curve (AUC; absolute values) between phylogenetically independent pairs with or without mutations in 20 genes with the highest number of homoplasic mutations in the convergent analysis of genetic pairs with discordant PI uptake. The boxplot represents 100 replicates of genetic pairs sampling. (B) Regression coefficients beta for 100 replicated linear regressions modelling the impact of presence/absence of mutations on the PI uptake AUC difference (absolute values) within the pairs (yellow: beta less than 0, green: beta above zero). The boxes show median beta and 5–95% quantile distribution.
Figure 5—figure supplement 3
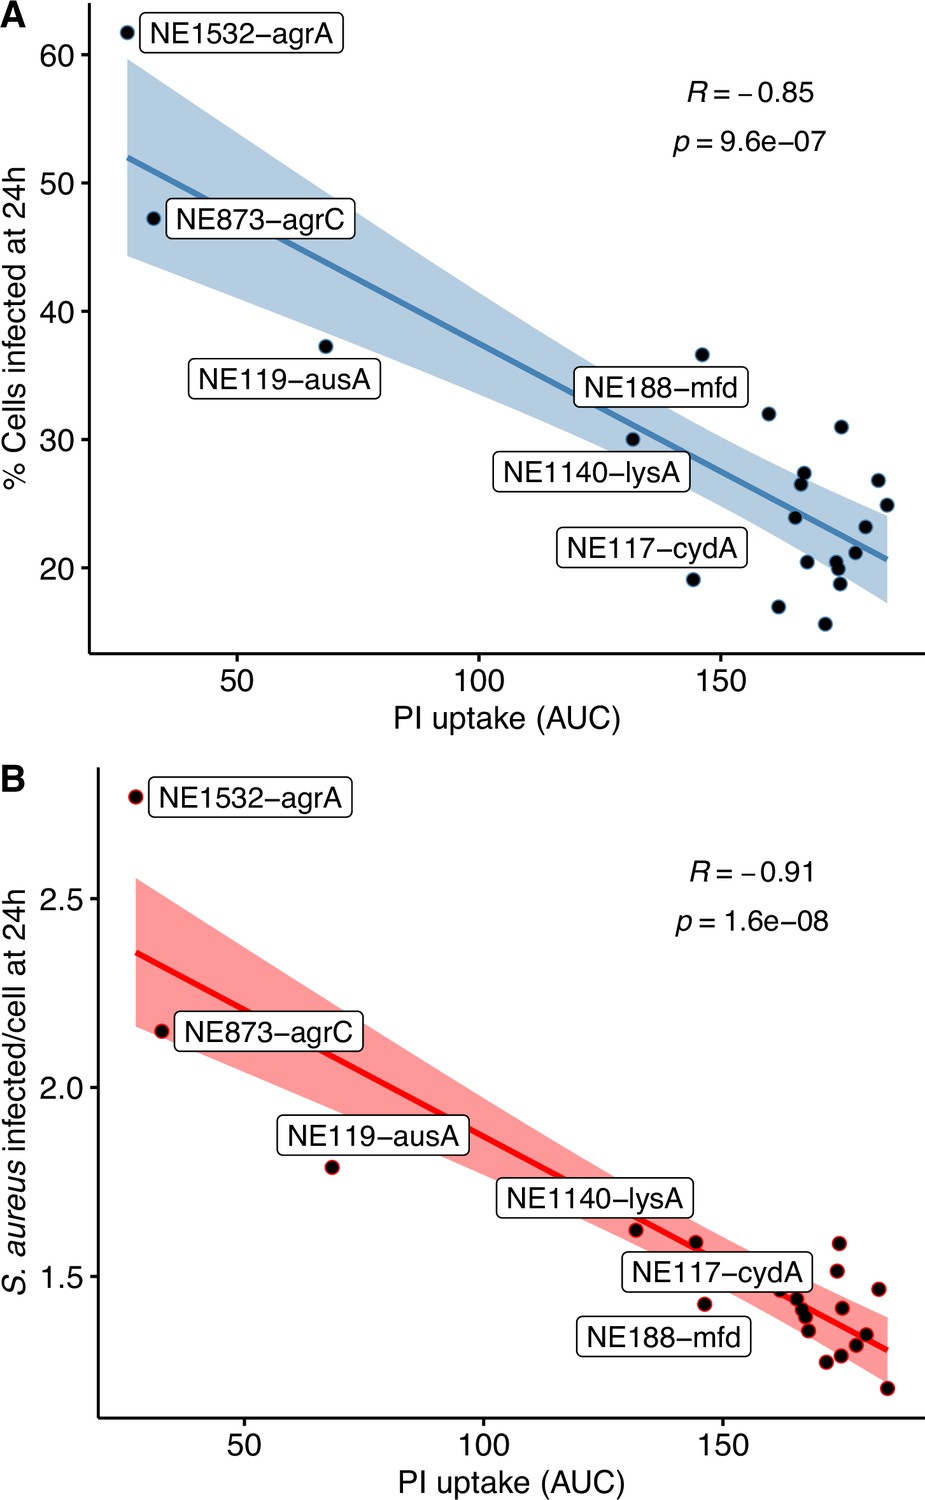
Scatter plots showing the statistically significant inverse Pearson correlations of (A) propidium iodide (PI) area under the curve (AUC) with the percentage of infected cells; and (B) PI AUC with the number of S. aureus per infected cells at 24 hr post-infection.
Lines and shaded areas represent linear regressions and 95% confidence intervals, respectively. Pearson correlation coefficients (R) and p-values (p) are indicated on each plot.
Figure 6 with 1 supplement
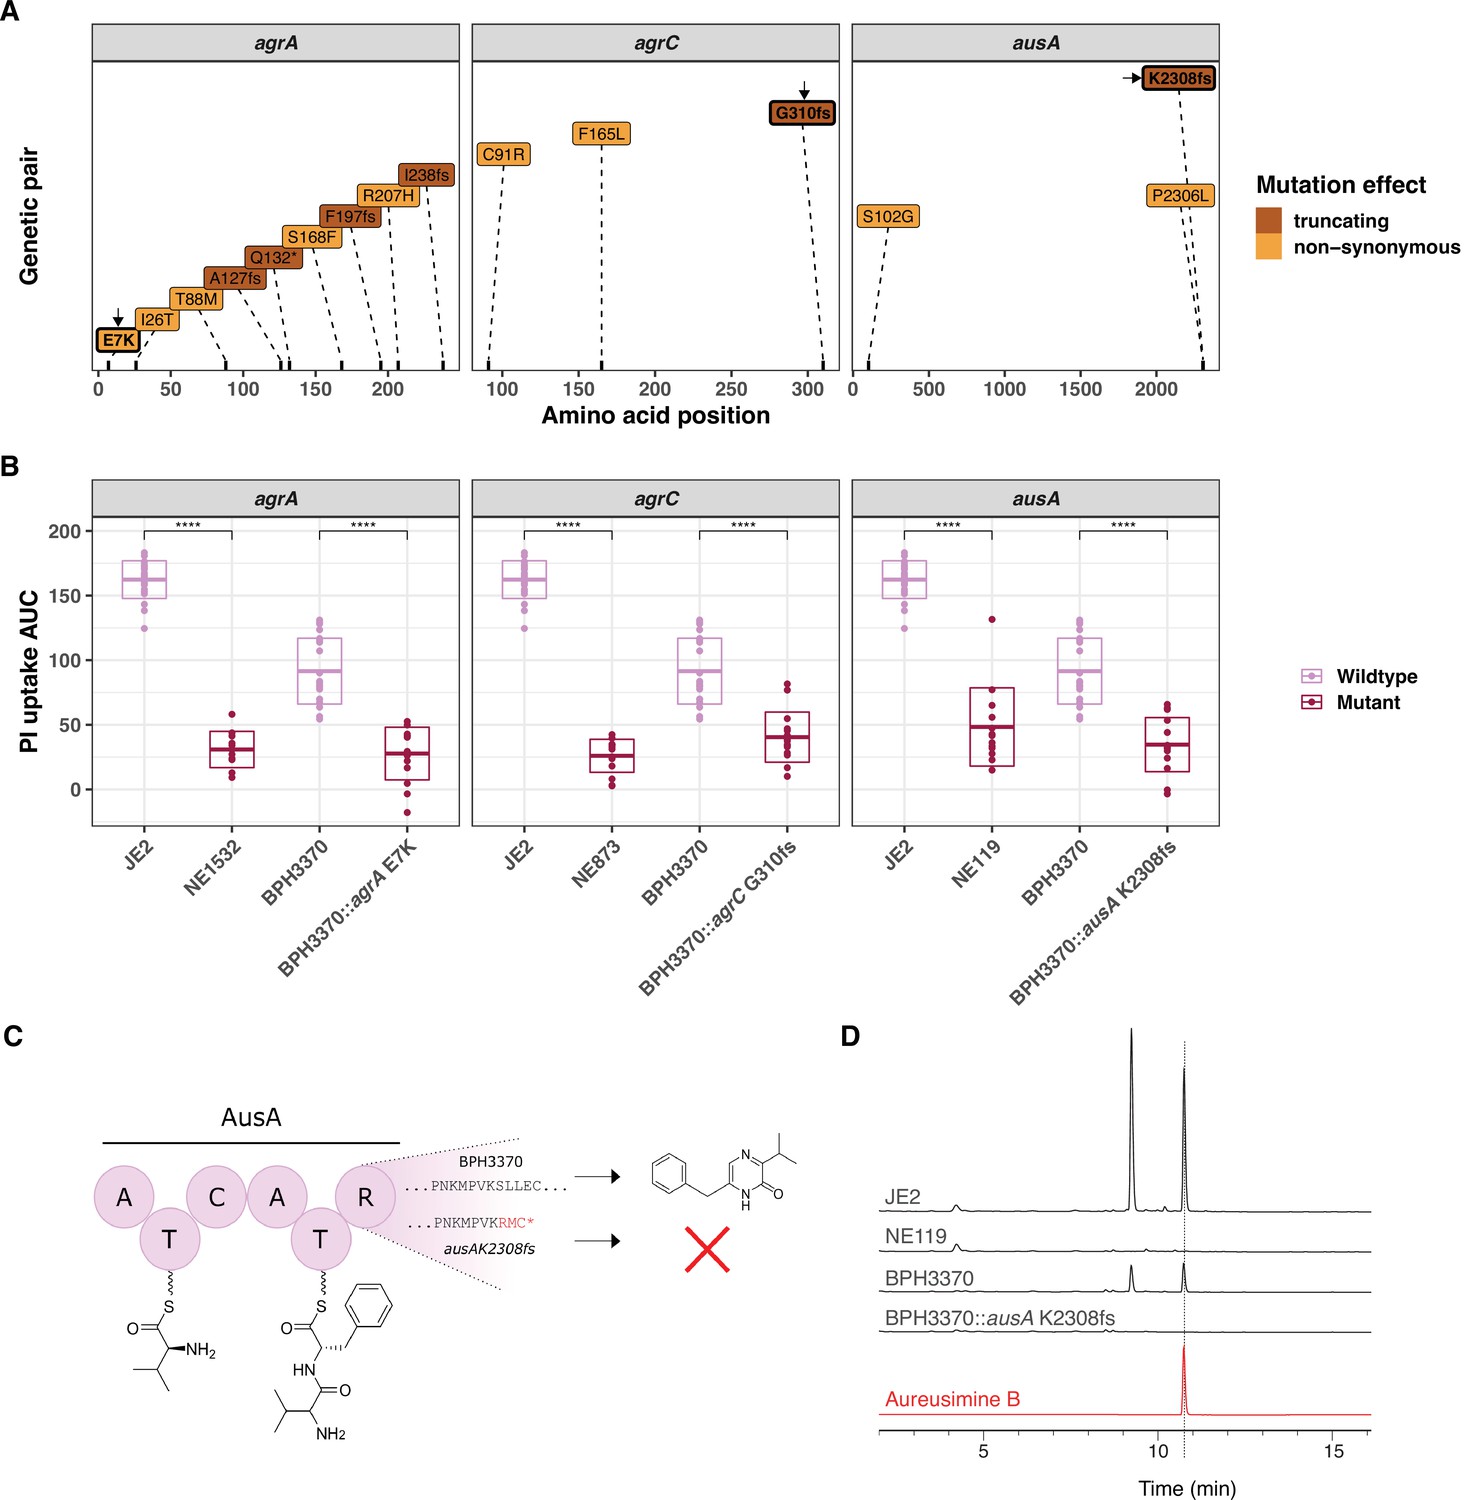
Introduction of convergent agrA, agrC, and ausA mutations in the clinical isolate BPH3370 reduces its intracellular cytotoxicity while ausA mutation affects aureusimine B production.
(A) Position and nature of convergent mutations identified in the genes agrA, agrC, and ausA. For each gene, the amino acid position affected by mutations is shown on the x-axis for each gene. Convergent mutations causing a significant contrasting propidium iodide (PI) uptake phenotype are coloured according to their consequence on protein function: non-synonymous (orange), truncating characterised by the introduction of a frameshift (fs) or a stop codon (*) (maroon). (B) Effect of convergent mutations on the intracellular cytotoxicity of the clinical isolate BPH3370. The PI uptake area under the curve (AUC) values for JE2, the cognate Nebraska transposon mutants of convergent genes, BPH3370 wild type and BPH3370 bearing the mutations affecting agrA, agrC, and ausA. The crossbar represents mean and standard deviation (p < 0.0001). (C) Predicted impact of K2308 frameshift mutation (K2308fs) on aureusimines. (D) HPLC analysis of S. aureus ethyl-acetate extracts for aureusimines compared to an Aureusimine B synthetic standard.
Figure 6—figure supplement 1
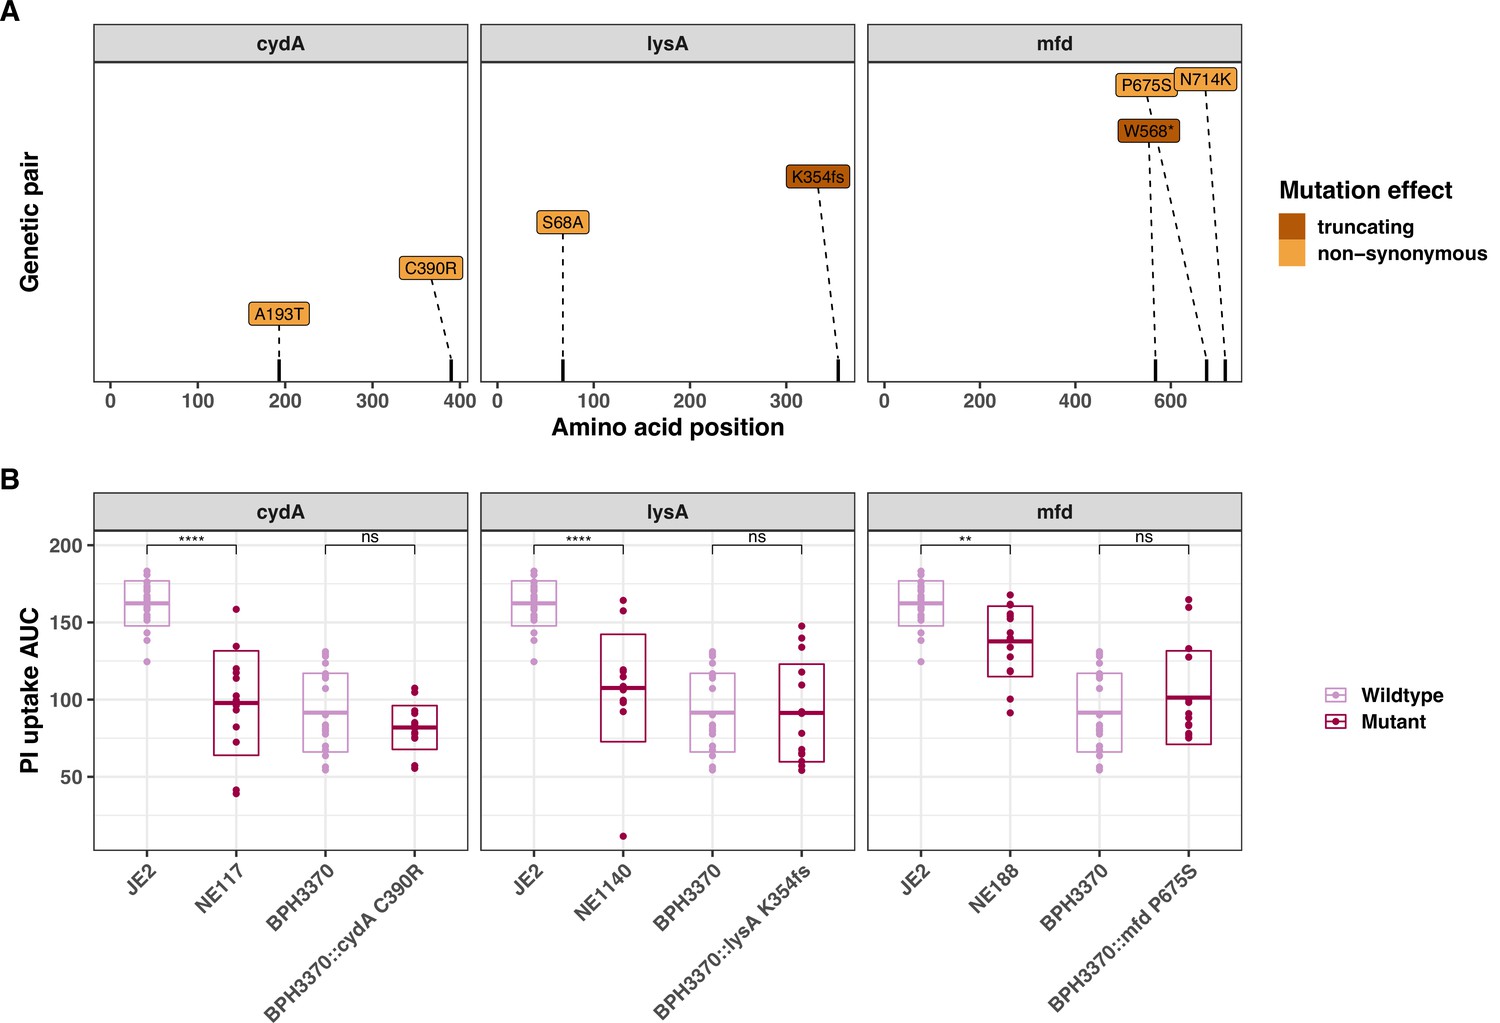
Introduction of convergent cydA, lysA, and mfd mutations in the clinical isolate BPH3370 and intracellullar cytotoxicity (InToxSa) assessment.
(A) Position and nature of convergent mutations. (B) Effect of convergent mutations on the intracellular cytotoxicity of the clinical isolate BPH3370.
Tables
Table 1
Summary of intracellular toxicity of S. aureus (InToxSa) assay performance.
| Strain | No. biological replicates | Area under the curve [AUC] | Peak uptake | Max uptake | ||||||
|---|---|---|---|---|---|---|---|---|---|---|
| [μmax] | [rmax] | |||||||||
| Mean | Std. dev. | CoV | Mean | Std. dev. | CoV | Mean | Std. dev. | CoV | ||
| S. aureus JE2 wild type | 25 | 162 | 14.6 | 0.09 | 1 | 0.09 | 0.09 | 0.003 | 0.0004 | 0.13 |
| S. aureus JE2 agrA mutant | 11 | 30.9 | 14 | 0.45 | 0.17 | 0.06 | 0.35 | 0.0004 | 0.0002 | 0.52 |
| Non-infected | 15 | 5.3 | 18.3 | 3.46 | 0.07 | 0.07 | 1.02 | 0.0001 | 0.00005 | 0.32 |
-
Note: Std. dev. = standard deviation; CoV = coefficient of variation.
Key resources table
| Reagent type (species) or resource | Designation | Source or reference | Identifiers | Additional information |
|---|---|---|---|---|
| Gene (S. aureus) | BPH2947 | GenBank | Accession GCF_900620245.1 | |
| Strain, strain background (Escherichia coli) | E. coli strain IM08B | Monk et al., 2015 | IM08B | Electrocompetent cells |
| Cell line (Homo sapiens) | Epithelial cells | ATCC | HeLa-CCL2 | |
| Chemical compound, drug | Antibiotic | Baxter | Gentamicin | 80 and 40 mg/ml |
| Recombinant DNA reagent | Antibiotic | Ambi | Lysostaphin | 10 mg/ml |
| Chemical compound, drug | Nucleic marker | Sigma | Propidium iodide | 1 mg/ml |
| Antibody | Anti-S. aureus (Rabbit polyclonal) | WEHI-antibody technology platform | Customised | IF (1:1000) |
| Antibody | Anti-rabbit (Donkey polyclonal) coupled to Alexa Fluor 488 | Thermo Fisher-Invitrogen | Cat#: A-21206 | IF (1:2000) |
| Other | Phalloidin-TRITC | Sigma | P1951 | IF (1:4000) |
| Other | DAPI | Sigma-Merck | 10236276001 | IF (1:2000) |
Additional files
-
Supplementary file 1
Parameters data: This is the intracellular toxicity of S. aureus (InToxSa) data used to create the propidium iodide (PI) uptake plots in Figure 1C, D.
Z′ factor: These are the Z′ factors calculated from the parameters data. Legend: Variable details.
- https://cdn.elifesciences.org/articles/84778/elife-84778-supp1-v1.xlsx
-
Supplementary file 2
Table of count data used for Figure 2B.
- https://cdn.elifesciences.org/articles/84778/elife-84778-supp2-v1.xlsx
-
Supplementary file 3
Dataset: Basic table describing the 387 isolates characterised in this study.
Legend: Variable details.
- https://cdn.elifesciences.org/articles/84778/elife-84778-supp3-v1.xlsx
-
Supplementary file 4
Dataset: Basic table of the propidium iodide (PI) uptake values for the 387 isolates.
Legend: Variable details.
- https://cdn.elifesciences.org/articles/84778/elife-84778-supp4-v1.xlsx
-
Supplementary file 5
The genome-wide association study (GWAS) data transformed propidium iodide (PI) uptake data, multidimensional scaling (MDS) lineage data, lineage effect tests, gene-burden test data, and variable legend.
- https://cdn.elifesciences.org/articles/84778/elife-84778-supp5-v1.xlsx
-
Supplementary file 6
Convergence analysis data.
- https://cdn.elifesciences.org/articles/84778/elife-84778-supp6-v1.xlsx
-
Supplementary file 7
List of primers used to introduce convergent mutation by site-directed mutagenesis in BPH3370.
- https://cdn.elifesciences.org/articles/84778/elife-84778-supp7-v1.docx
-
Supplementary file 8
Output of the comparison of the comparison of absolute propidium iodide (PI) uptake area under the curve (AUC) difference between pairs with or without mutations in the most convergent genes identified from the convergence evolution analyses.
This analysis was performed in 100 replicated sets of phylogenetically independent genetic pairs.
- https://cdn.elifesciences.org/articles/84778/elife-84778-supp8-v1.xlsx
-
MDAR checklist
- https://cdn.elifesciences.org/articles/84778/elife-84778-mdarchecklist1-v1.pdf
Download links
A two-part list of links to download the article, or parts of the article, in various formats.
Downloads (link to download the article as PDF)
Open citations (links to open the citations from this article in various online reference manager services)
Cite this article (links to download the citations from this article in formats compatible with various reference manager tools)
A high-throughput cytotoxicity screening platform reveals agr-independent mutations in bacteraemia-associated Staphylococcus aureus that promote intracellular persistence
eLife 12:e84778.
https://doi.org/10.7554/eLife.84778


