Melanocortin 1 receptor regulates cholesterol and bile acid metabolism in the liver
- Research Centre for Integrative Physiology and Pharmacology, Institute of Biomedicine, University of Turku, Finland
- Drug Research Doctoral Programme (DRDP), University of Turku, Finland
- Institute for Molecular Medicine Finland (FIMM), HiLIFE Helsinki Institute of Life Science, University of Helsinki, Finland
- Faculty of Medicine, University of Turku, Finland
- Department of Chemistry and Biochemistry, University of Arizona, United States
- Turku Center for Disease Modeling, University of Turku, Finland
- Unit of Clinical Pharmacology, Turku University Hospital, Finland
Figures
Figure 1 with 3 supplements
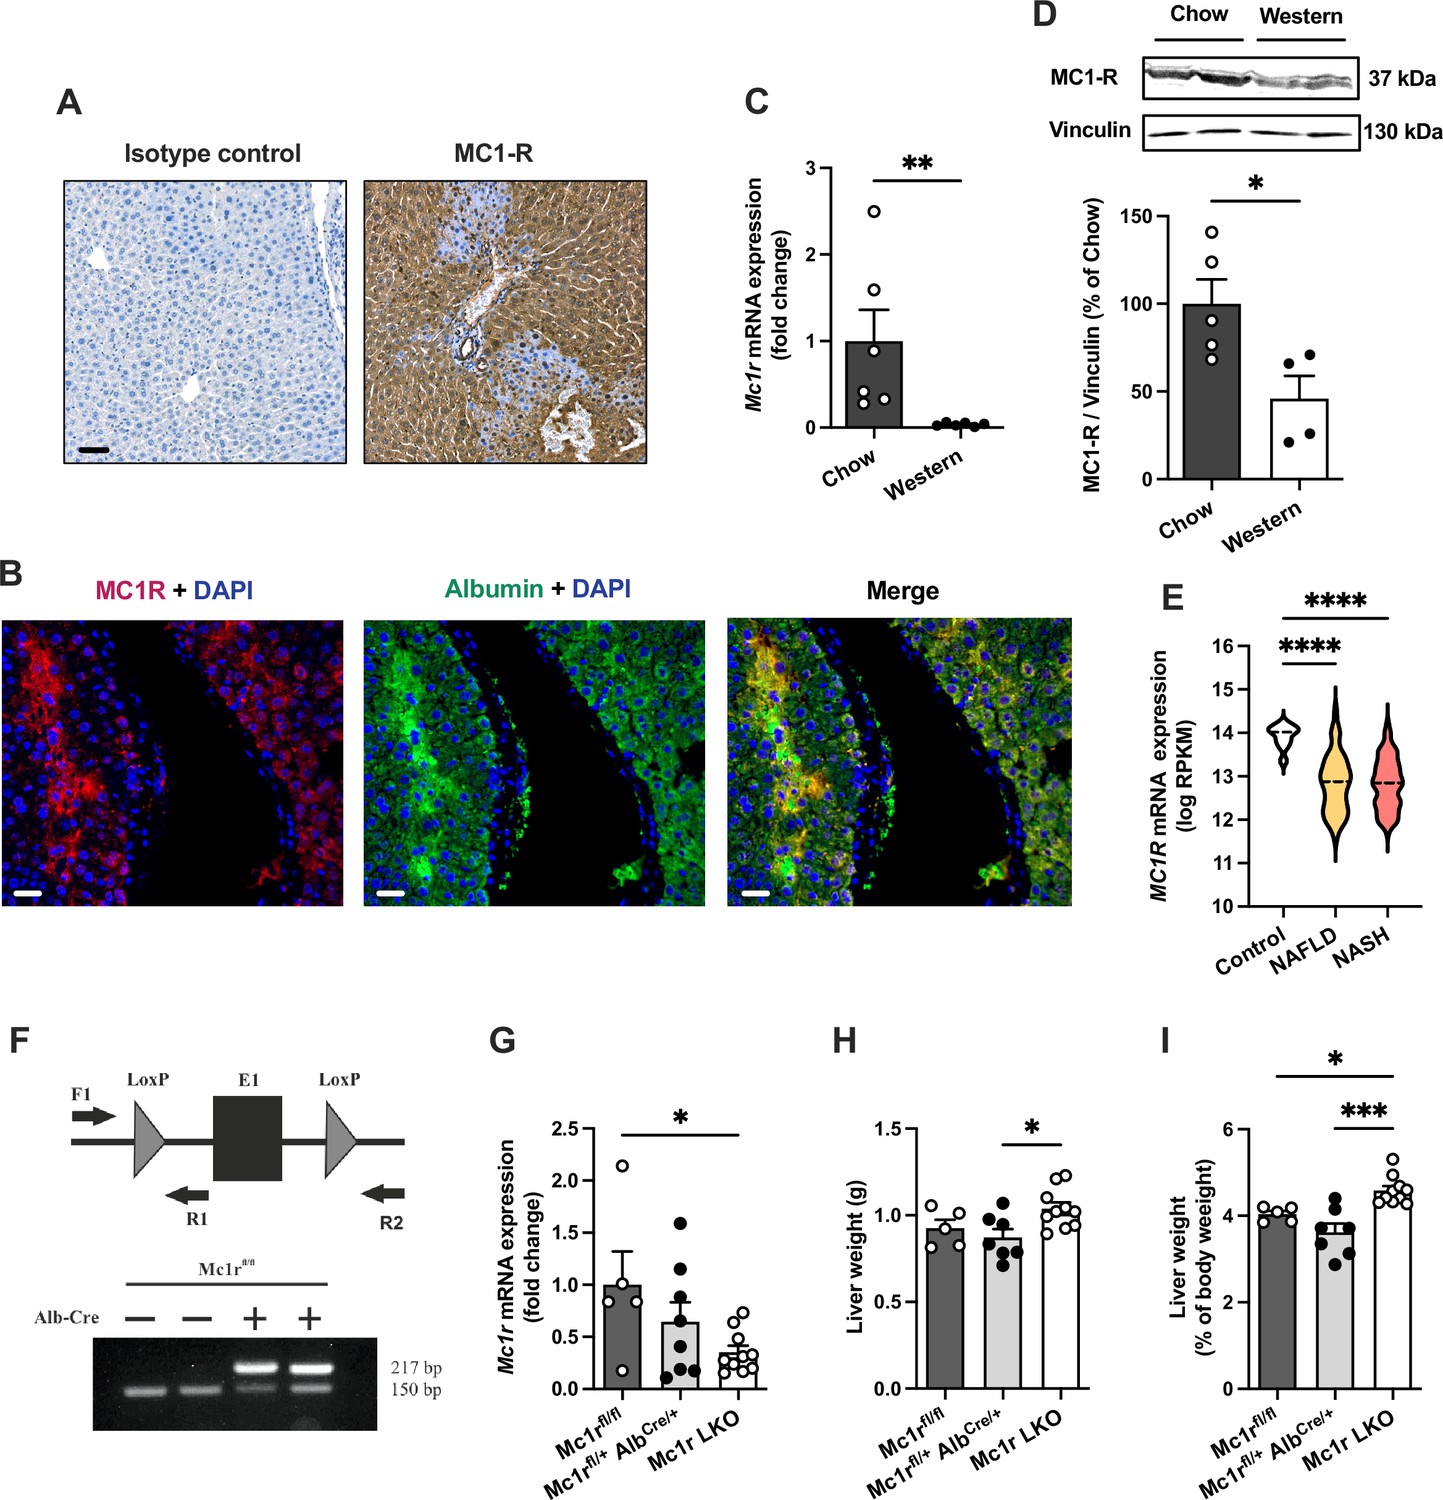
Melanocortin 1 receptor (MC1-R) is expressed in the mouse liver and down-regulated in mice fed a cholesterol-rich diet.
(A) Immunostaining of MC1-R staining in the liver of chow-fed C57Bl/6 J mouse. In the control section, anti-MC1-R antibody was replaced by purified normal rabbit IgG (isotype control). Scale bar, 50 µm. (B) Immunofluorescence staining of MC1-R (red) and the hepatocyte marker serum albumin (green) in the liver of chow-fed C57Bl/6 J mouse. Scale bar, 20 μm. (C) Quantitative real-time polymerase chain reaction (qPCR) analysis of Mc1r mRNA expression in the liver of chow- and Western diet-fed mice. (D) Representative Western blots of MC1-R and β-actin (loading control) and quantification of MC1-R protein level in the liver of chow- and Western diet-fed mice. *p<0.05 and **p<0.01 versus chow-fed mice by Student’s t-test. (E) MC1R gene expression in human liver biopsies from control cases (n=10) and patients with nonalcoholic fatty liver disease (NAFLD, n=51) or nonalcoholic steatohepatitis (NASH, n=155). Violin plots show normalized log2 RPKM values (reads per kilobase of exon per million reads mapped) and medians (dashed line) for each sample group. (F) Schematic presentation of the loxP-flanked (floxed) Mc1r allele and the positions of forward and reverse primers used for PCR genotyping. PCR analysis of genomic DNA extracted from the liver of Alb-Cre-negative and -positive mice that were homozygous for the Mc1r floxed allele (Mc1rfl/fl). The size of the recombined allele is ~217 bp. (G) qPCR analysis of Mc1r expression in the liver of chow-fed Mc1rfl/fl, Mc1rfl/+ AlbCre/+, and Mc1r LKO (Mc1rfl/fl AlbCre/+) mice at the age of 16 weeks. (H, I) Absolute liver weight and liver to body weight ratio (expressed as a percentage of body weight) in chow-fed Mc1rfl/fl, Mc1rfl/+ AlbCre/+, and Mc1r LKO mice at the age of 16 weeks. Values are mean ± SEM, n=5–10 mice per group in each graph. *p<0.05, **p<0.01, and ****p<0.0001 for the indicated comparisons by one-way ANOVA and Dunnet post hoc tests. Mc1r LKO, hepatocyte-specific MC1-R knock-out mice.
-
Figure 1—source data 1
Uncropped Western blots for Figure 1D.
- https://cdn.elifesciences.org/articles/84782/elife-84782-fig1-data1-v1.zip
Figure 1—figure supplement 1

Immunofluorescence staining of melanocortin 1 receptor (MC1-R) in the mouse liver.
(A) Immunofluorescence staining of MC1-R (red) and the cholangiocyte marker cytokeratin 19 (CK19, green) in the liver of a chow-fed C57Bl/6 J mouse. (B) Immunofluorescence staining of MC1-R (red) and the endothelial cell marker CD31 (green) in the liver of a chow-fed C57Bl/6 J mouse. (C) Immunofluorescence staining of MC1-R (red) and the macrophage marker Mac-2 (green) in the liver of a chow-fed C57Bl/6 J mouse. White arrows indicate co-localization of MC1-R and CK-19 or Mac-2. Scale bar, 20 μm in all images.
Figure 1—figure supplement 2
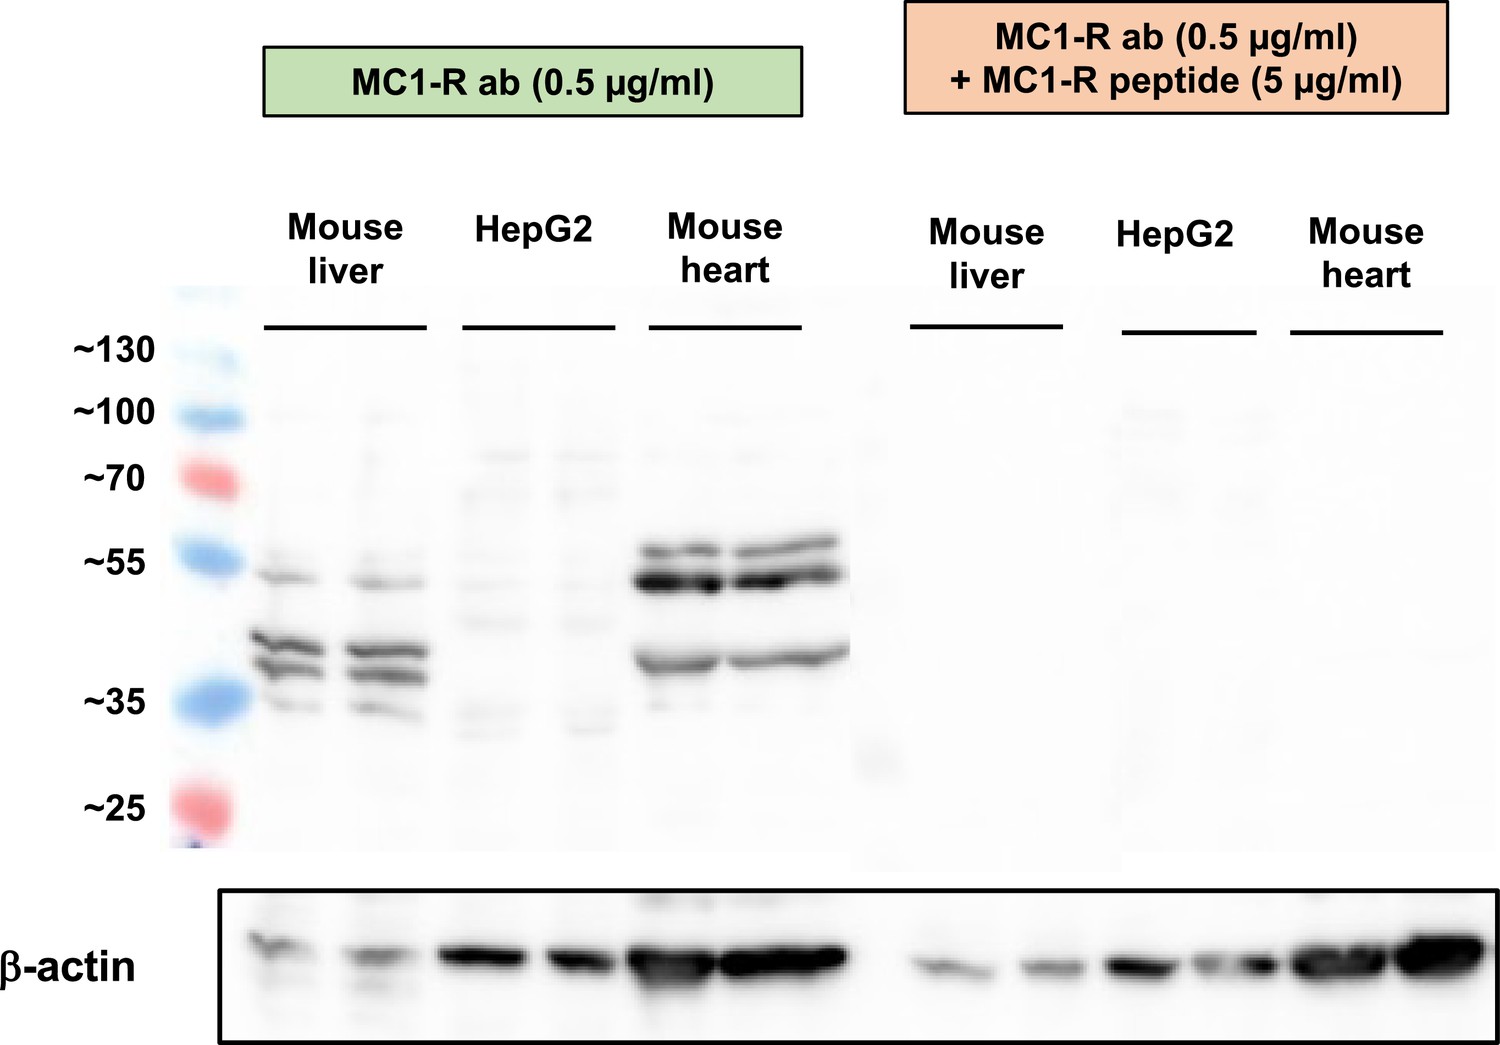
Pre-adsorption control for Melanocortin 1 receptor (MC1-R) Western blotting.
Western blot analysis of MC1-R protein expression in the mouse liver, HepG2, and mouse heart samples. The expression of β-actin is shown as a loading control. Lanes on the right (same samples as on the left) were incubated in an anti-MC1-R antibody solution that was premixed with a molar excess of a blocking MC1-R peptide.
-
Figure 1—figure supplement 2—source data 1
Uncropped Western blots for Figure 1—figure supplement 2.
- https://cdn.elifesciences.org/articles/84782/elife-84782-fig1-figsupp2-data1-v1.zip
Figure 1—figure supplement 3

Hepatocyte-specific Melanocortin 1 receptor (MC1-R) deficiency does not affect body weight or composition in chow-fed female mice.
(A) Representative Western blots of MC1-R and vinculin (loading control) and (B) quantification of MC1-R protein level in the liver of chow-fed control (Mc1rfl/+ AlbCre/+) and Mc1r LKO mice. *p<0.05 versus control mice by Student’s t-test. (C) Body weight curves of chow-fed Mc1rfl/fl, Mc1rfl/+ AlbCre/+, and Mc1r LKO mice. (D and E) Total fat and lean mass of chow-fed Mc1rfl/fl, Mc1rfl/+ AlbCre/+, and Mc1r LKO mice at the start and end of the body weight monitoring period. The change in fat and lean mass between the start and end of the experiment is also presented in the graphs. Values are mean ± SEM, mice n=5–10 mice per group in each graph.
-
Figure 1—figure supplement 3—source data 1
Uncropped Western blots for Figure 1—figure supplement 3.
- https://cdn.elifesciences.org/articles/84782/elife-84782-fig1-figsupp3-data1-v1.zip
Figure 2 with 2 supplements
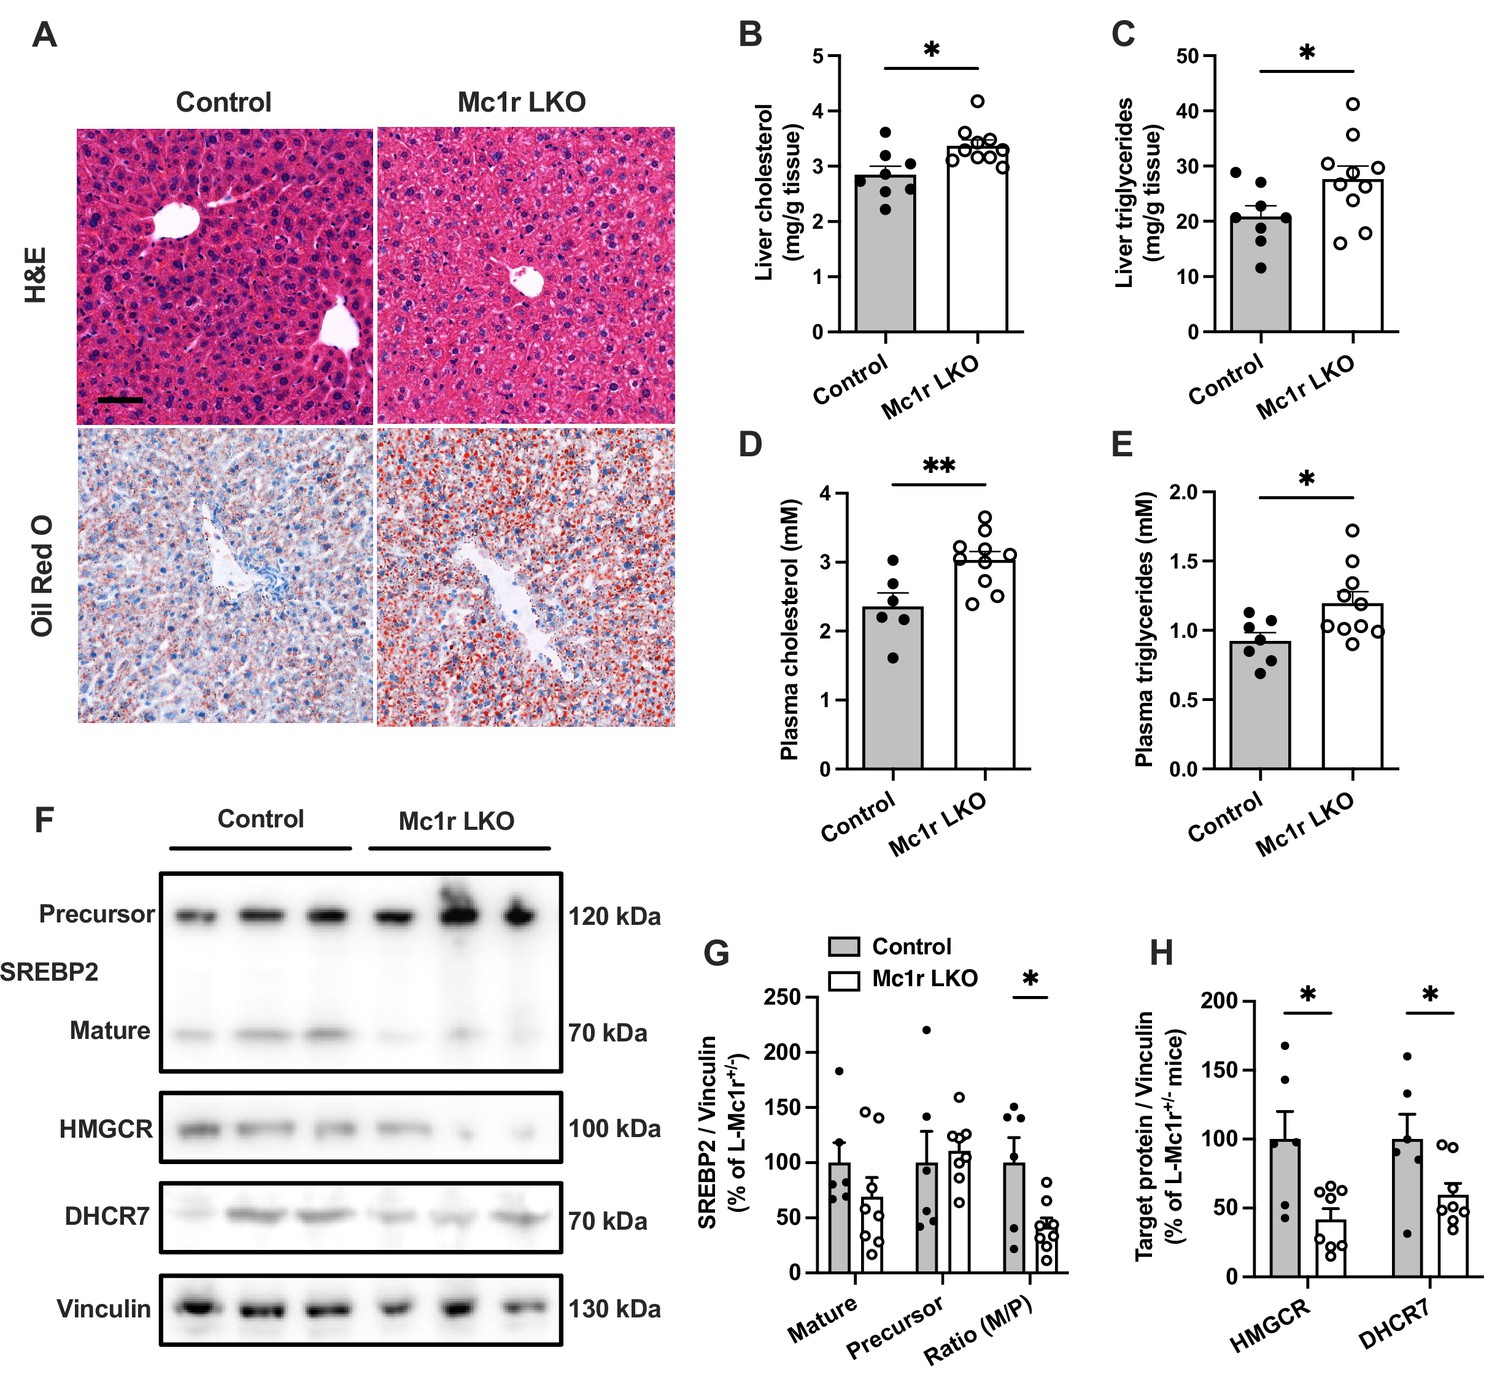
Hepatocyte-specific Melanocortin 1 receptor (MC1-R) deficiency enhances cholesterol and triglyceride accumulation in the liver.
(A) Representative hematoxylin and eosin (H&E) and Oil Red O-stained liver sections of chow-fed control (Mc1rfl/+ AlbCre/+) and Mc1r LKO mice. Scale bar, 50 µm. (B, C) Quantification of liver total cholesterol and triglyceride content in chow-fed control and Mc1r LKO mice. (D, E) Quantification of plasma total cholesterol and triglyceride concentrations in chow-fed control and Mc1r LKO mice. (F) Representative Western blots of SREBP2, HMGCR, DHCR7, and vinculin (loading control) expression in the liver of chow-fed control and Mc1r LKO mice. (G) Quantification of mature and precursor forms SREBP2 as well as their ratio (precursor-to-mature) in the liver of chow-fed control and Mc1r LKO mice. (H) Quantification of HMGCR and DHCR7 protein levels in the liver of chow-fed control and Mc1r LKO mice. Values are mean ± SEM, n=6–10 mice per group in each graph. *p<0.05 and **p<0.01 versus control mice by Student’s t-test. SREBP2, sterol regulatory element binding protein 2; HMGCR, 3-hydroxy-3-methylglutaryl-CoA reductase; DHCR7, 7-dehydrocholesterol reductase.
-
Figure 2—source data 1
Uncropped Western blots for Figure 2F.
- https://cdn.elifesciences.org/articles/84782/elife-84782-fig2-data1-v1.zip
Figure 2—figure supplement 1
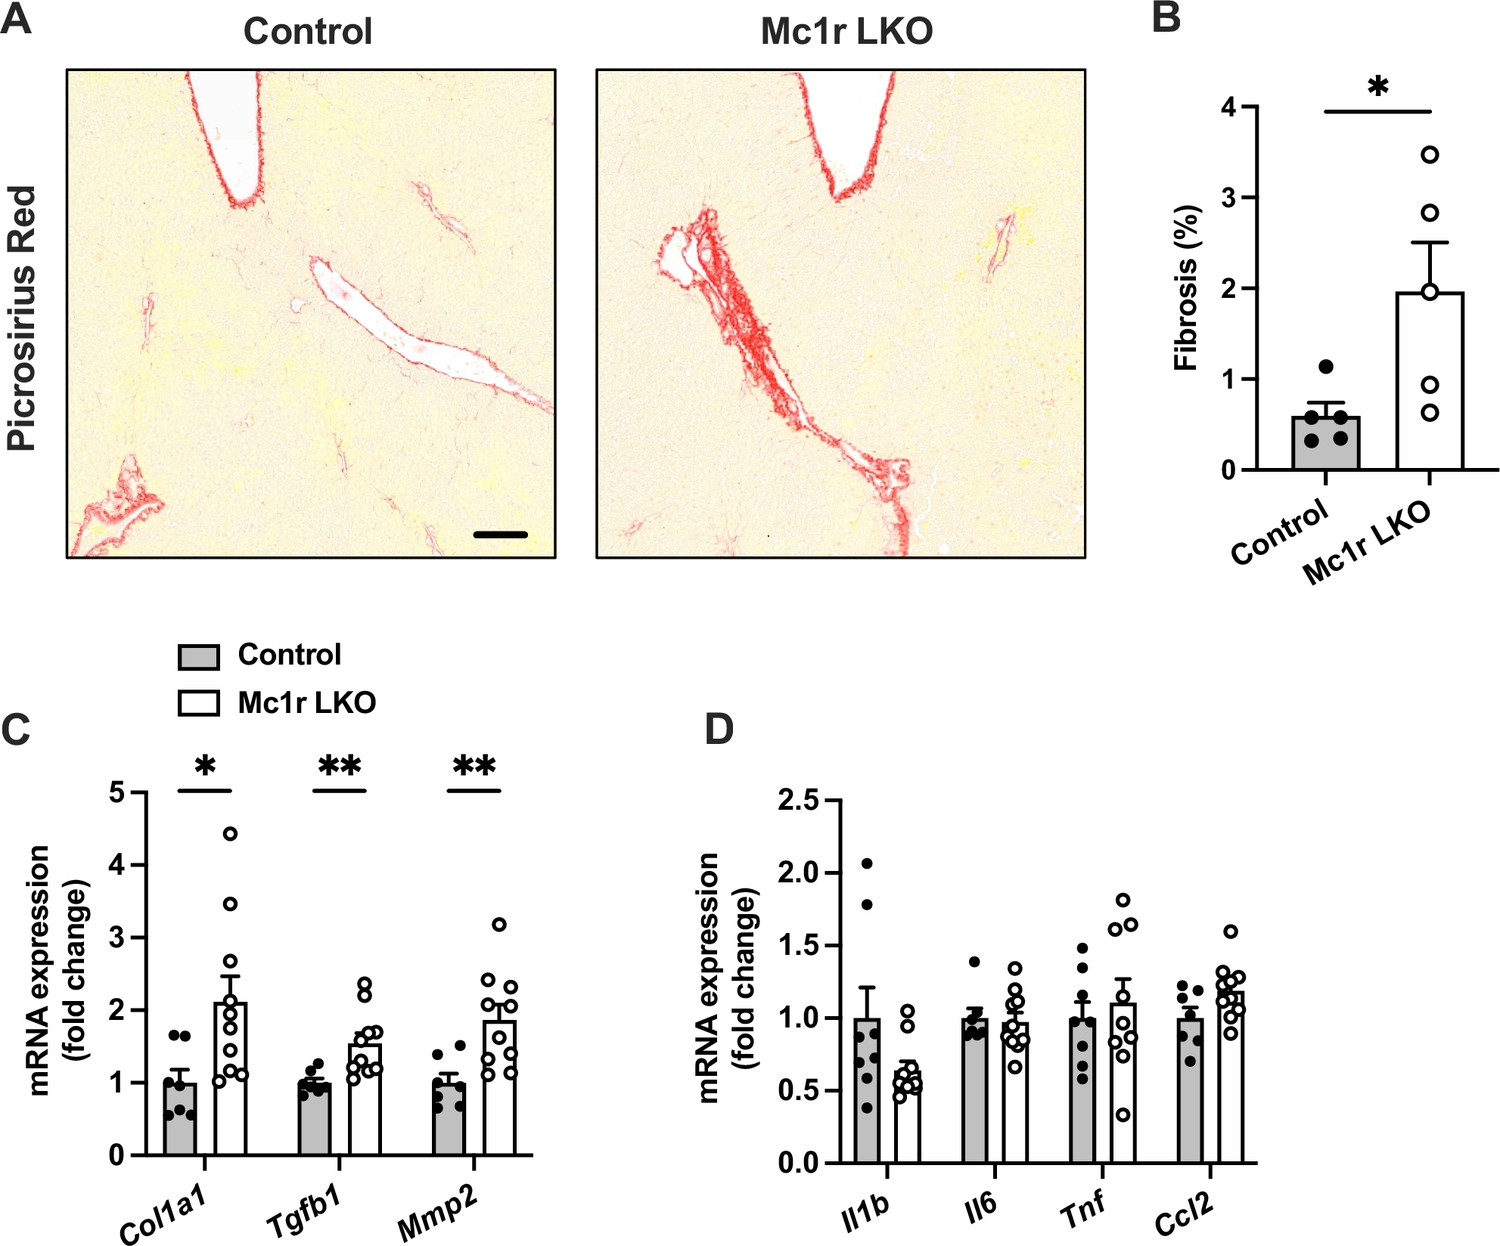
Hepatocyte-specific melanocortin 1 receptor (MC1-R) deficiency enhances liver fibrosis.
(A) Representative Picrosirius Red-stained liver sections of chow-fed control (Mc1rfl/+ AlbCre/+) and Mc1r LKO mice. Scale bar, 100 µm. (B) Quantification of fibrotic area (as a percentage of total tissue area) in the liver of chow-fed control and Mc1r LKO mice. n=5 mice per group. Quantitative real-time polymerase chain reaction (qPCR) analysis of fibrotic (C) and pro-inflammatory (D) genes in the liver of chow-fed control and Mc1r LKO mice. Values are mean ± SEM, mice n=8–10 mice per group in each graph. *p<0.05 and **p<0.01 for the indicated comparisons by Student’s t-test. Col1a1, collagen, type I, alpha 1; Tgfb1, transforming growth factor beta 1; Mmp2, matrix metalloproteinase-2; Il1b, interleukin 1 beta; Il6, interleukin 6; Tnf, tumor necrosis factor; Ccl2, chemokine (C-C motif) ligand 2.
Figure 2—figure supplement 2
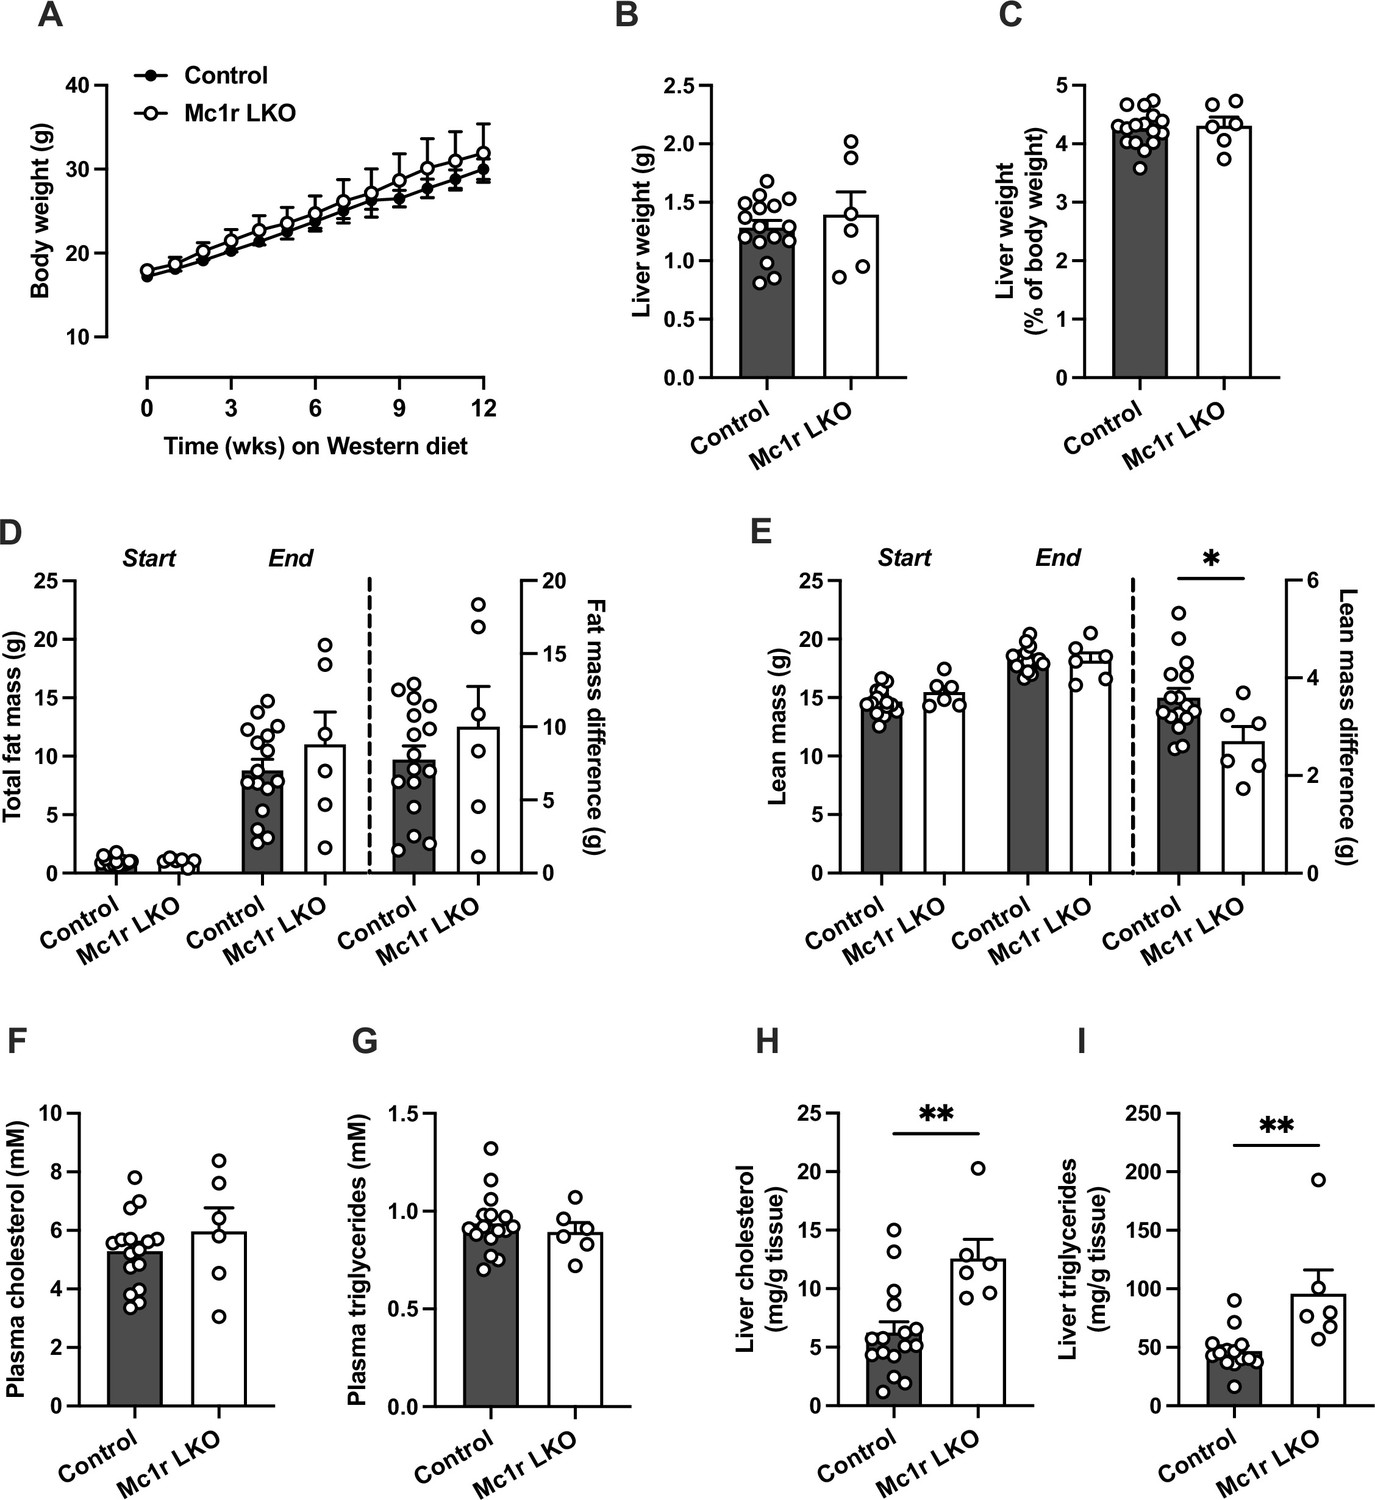
Hepatocyte-specific melanocortin 1 receptor (MC1-R) deficiency does not affect body or liver weight in Western diet-fed female mice, but aggravates hepatic cholesterol and triglyceride accumulation.
(A) Body weight curves of Western diet-fed control (Mc1rfl/fl) and Mc1r LKO mice. (B and C) Absolute liver weight and liver to body weight ratio (expressed as a percentage of body weight) in Western diet-fed control and Mc1r LKO mice (D and E) Total fat and lean mass of HFD-fed control and Mc1r LKO mice at the start and end of the body weight monitoring period. The change in fat and lean mass between the start and end of the experiment is also presented in the graphs. (F and G) Quantification of plasma total cholesterol and triglyceride concentrations in Western diet-fed control and Mc1r LKO mice. (H and I) Quantification of liver total cholesterol and triglyceride concentrations in Western diet-fed control and Mc1r LKO mice. Values are mean ± SEM, mice n=15 (control) and 6 (Mc1r LKO) mice per group. *p<0.05 and **p<0.01 versus Mc1rfl/fl mice by Student’s t-test.
Figure 3 with 1 supplement
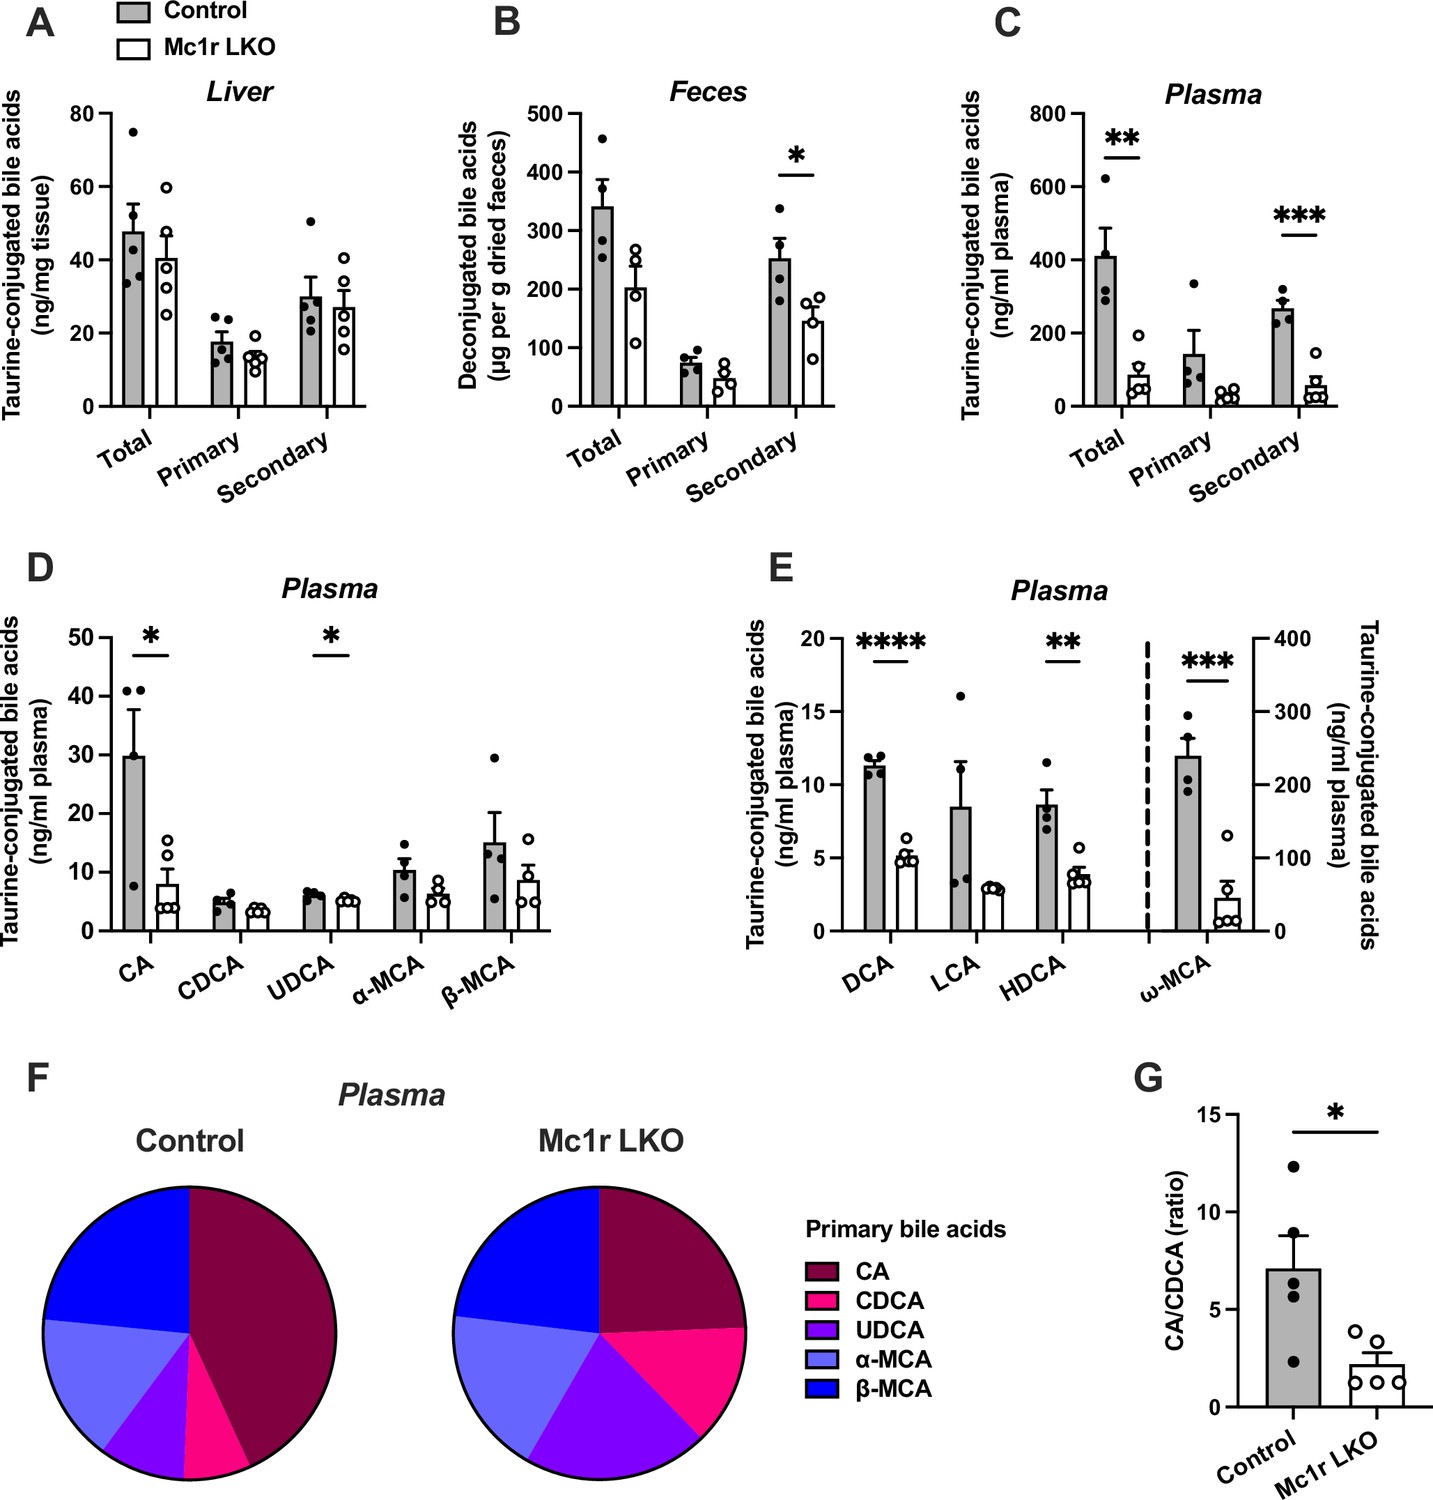
Hepatocyte-specific melanocortin 1 receptor (MC1-R) deficiency disturbs bile acid metabolism.
(A–C) Quantification of total, primary, and secondary bile acids in the liver, plasma and feces of chow-fed control (Mc1rfl/+ AlbCre/+), and Mc1r LKO mice. (D) Quantification of individual primary bile acids in the plasma of chow-fed control and Mc1r LKO mice. (E) Quantification of individual secondary bile acids in the plasma of chow-fed control and Mc1r LKO mice. (F) Relative proportions of individual primary bile acids in the plasma of chow-fed control and Mc1r LKO mice. (G) The ratio of cholic acid (CA) to chenodeoxycholic acid (CDCA) in the plasma of chow-fed control and Mc1r LKO mice. Values are mean ± SEM, n=4–5 mice per group in each graph. *p<0.05, **p<0.01, ***p<0.001, and ****p<0.0001 versus control mice by Student’s t-test. CA indicates cholic acid; CDCA, chenodeoxycholic acid; UDCA, ursodeoxycholic acid; MCA, muricholic acid; DCA, deoxycholic acid; LCA, litocholic acid; HDCA, hyodeoxycholic acid (HDCA).
-
Figure 3—source data 1
Ultra-high performance liquid chromatography–tandem mass spectrometry (UHPLC-MS/MS) analysis of individual bile acids in the plasma.
- https://cdn.elifesciences.org/articles/84782/elife-84782-fig3-data1-v1.xlsx
Figure 3—figure supplement 1
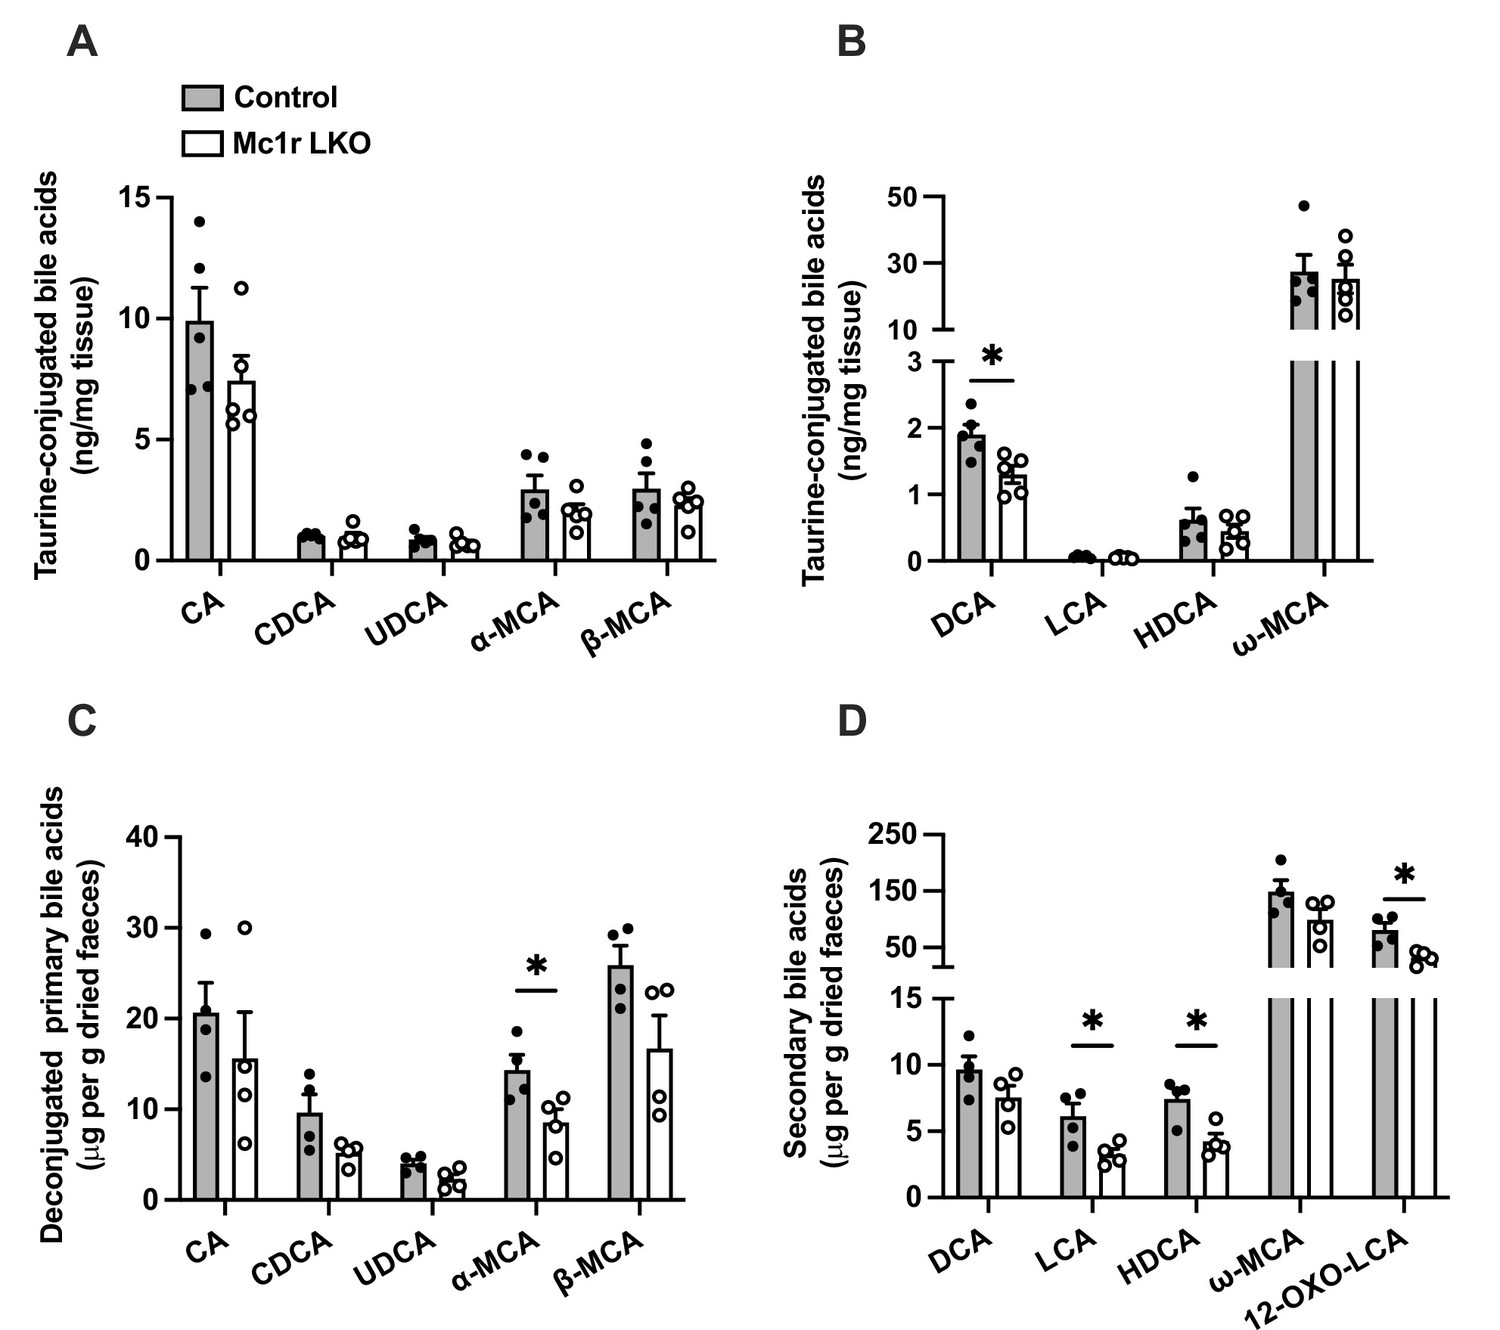
Bile acid profiles in the liver and feces of Mc1r LKO mice.
(A) Quantification of individual primary bile acids in the liver of chow-fed control (Mc1rfl/+ AlbCre/+) and Mc1r LKO mice. (B) Quantification of individual secondary bile acids in the liver of chow-fed control and Mc1r LKO mice. (C) Quantification of individual primary bile acids in the feces of chow-fed control and Mc1r LKO mice. (D) Quantification of individual secondary bile acids in the feces of chow-fed control and Mc1r LKO mice. Values are mean ± SEM, mice n=4–5 mice per group in each graph. *p<0.05 for the indicated comparisons by Student’s t-test. CA indicates cholic acid; CDCA, chenodeoxycholic acid; UDCA, ursodeoxycholic acid; MCA, muricholic acid; DCA, deoxycholic acid; LCA, litocholic acid; HDCA, hyodeoxycholic acid.
-
Figure 3—figure supplement 1—source data 1
Ultra-high performance liquid chromatography–tandem mass spectrometry (UHPLC-MS/MS) analysis of individual bile acids in the liver.
- https://cdn.elifesciences.org/articles/84782/elife-84782-fig3-figsupp1-data1-v1.xlsx
-
Figure 3—figure supplement 1—source data 2
Ultra-high performance liquid chromatography–tandem mass spectrometry (UHPLC-MS/MS) analysis of individual bile acids in the feces.
- https://cdn.elifesciences.org/articles/84782/elife-84782-fig3-figsupp1-data2-v1.xlsx
Figure 4
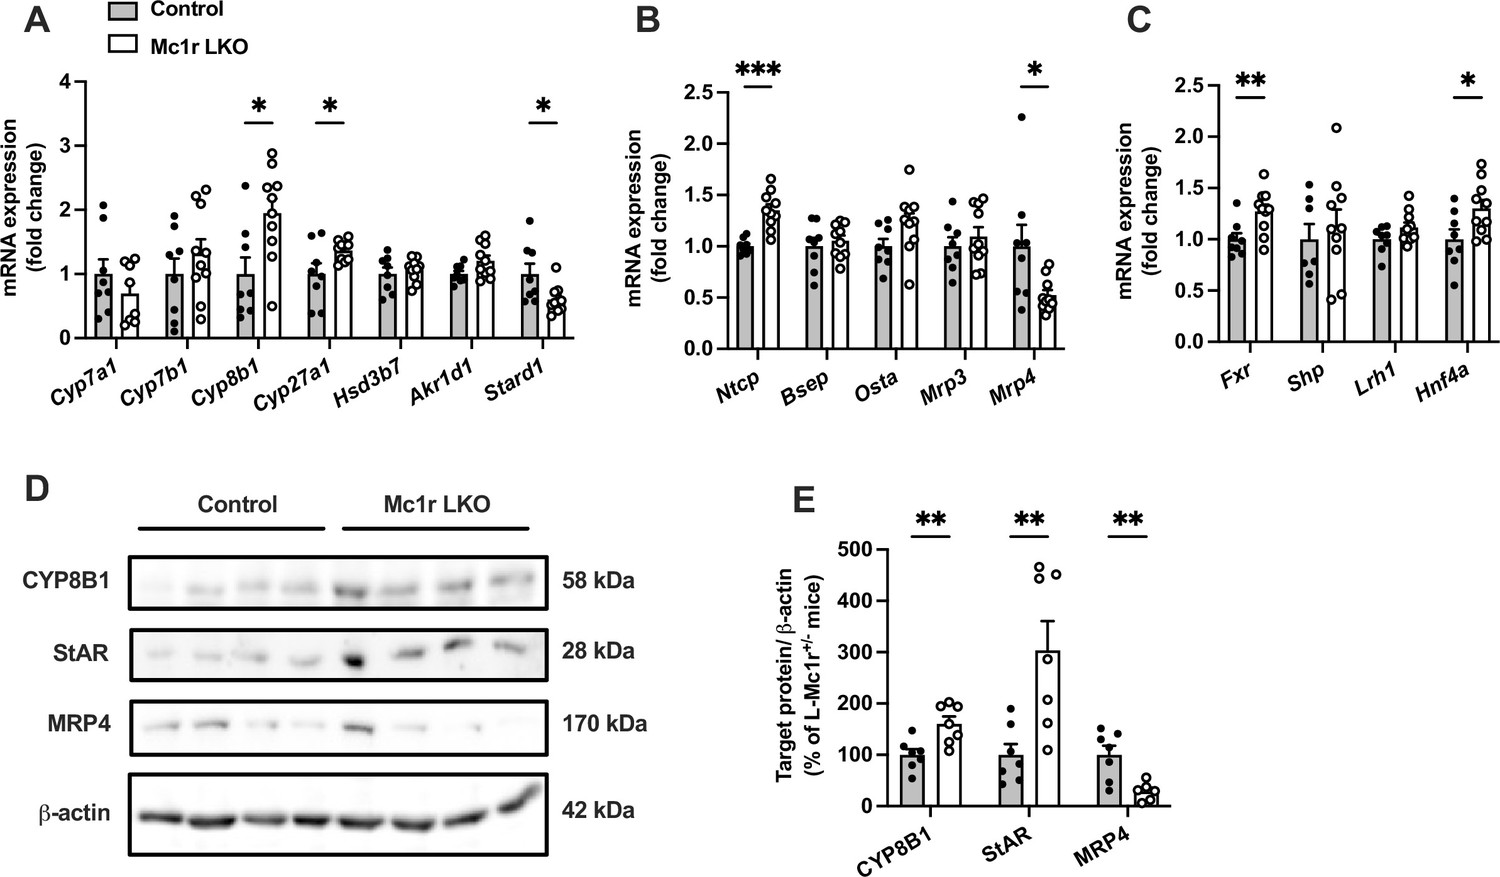
Hepatocyte-specific melanocortin 1 receptor (MC1-R) deficiency affects the expression of genes involved in bile acid synthesis and transport.
(A, B) Quantitative real-time polymerase chain reaction (qPCR) analysis of genes involved in the bile acid synthesis and transport in the liver of chow-fed control (Mc1rfl/+ AlbCre/+) and Mc1r LKO mice. (C) qPCR analysis of nuclear receptor genes that regulate the transcription of bile acid enzymes and transporters. (D, E) Representative Western blots and quantification of CYP8B1, StAR, and MRP4 protein levels in the liver of chow-fed control and Mc1r LKO mice. Values are mean ± SEM, n=7–10 mice per group in each graph. *p<0.05, **p<0.01, and ***p<0.001 versus control mice by Student’s t-test. Cyp7a1, cholesterol 7 alpha-hydroxylase; Cyp7b1, 25-hydroxycholesterol 7-alpha-hydroxylase; Cyp8b1, sterol 12-alpha-hydroxylase; Cyp27a1, sterol 27- hydroxylase; Stard1, steroidogenic acute regulatory protein; Fxr, farnesoid X receptor; Lrh1, liver receptor homologue 1; Bsep, bile-salt export pump; Ntcp, Na+-taurocholate cotransporting polypeptide; Hnf4a, hepatocyte nuclear factor 4 alpha.
-
Figure 4—source data 1
Uncropped Western blots for Figure 4D.
- https://cdn.elifesciences.org/articles/84782/elife-84782-fig4-data1-v1.zip
Figure 5 with 1 supplement
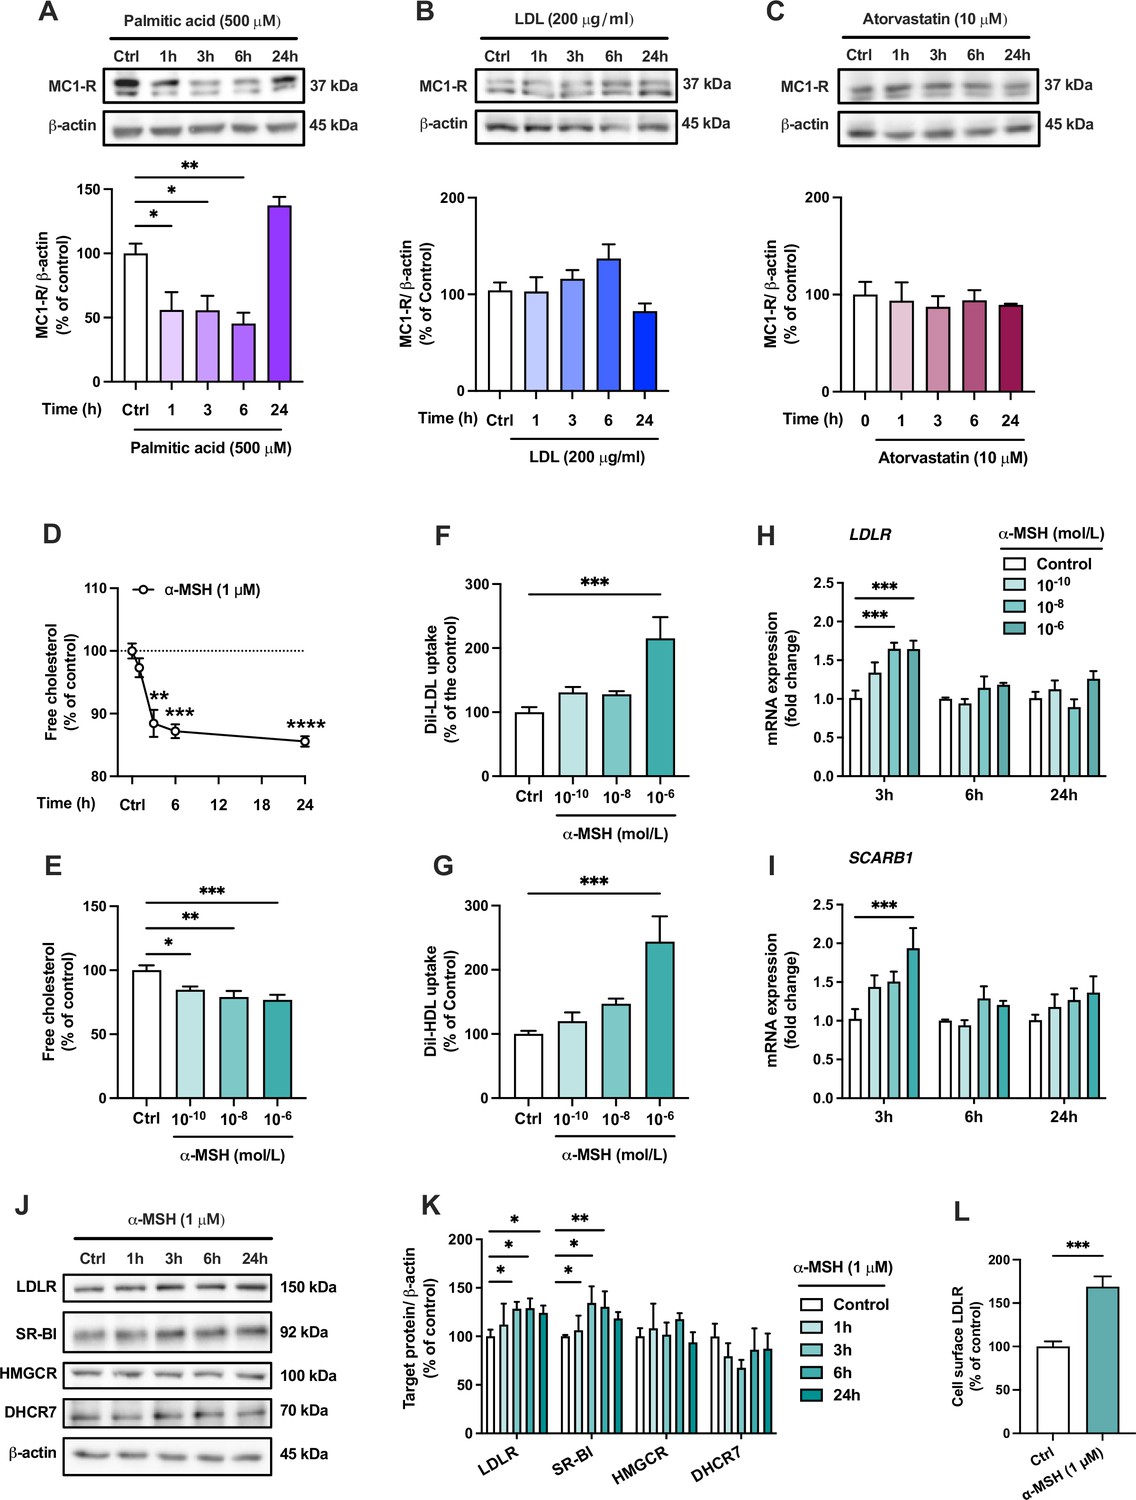
The endogenous melanocortin 1 receptor (MC1-R) agonist α-MSH reduces cellular cholesterol content and enhances low-density lipoprotein (LDL) and high-density lipoprotein (HDL) uptake in HepG2 cells.
(A–C) Representative Western blots and quantification of MC1-R protein level in HepG2 cells treated with palmitic acid (500 µM), LDL (200 µg/ml), or atorvastatin (10 µM) for 1, 3, 6, or 24 hr. (D) Quantification of free cholesterol content using filipin staining in HepG2 cells treated with α-MSH (1 µM) for 1, 3, 6, or 24 hr. (E) Quantification of free cholesterol content in HepG2 cells treated with different concentrations of α-MSH (0.1 nM, 10 nM, or 1 µM) for 24 hr. (F, G) Quantification of LDL and HDL uptake in HepG2 cells treated with different concentrations (0.1 nM, 10 nM, or 1 µM) of α-MSH for 24 hr. (H, I) Quantitative real-time polymerase chain reaction (qPCR) analysis of LDL receptor (LDLR) and SCARB1 expression in HepG2 cells treated with different concentrations of α-MSH for 3, 6, or 24 hr. (J, K) Representative Western blots and quantification of LDL-R and SR-BI proteins levels in HepG2 cells treated with 1 µM α-MSH for 1, 3, 6, or 24 hr. (L) Quantification of cell surface LDLR by flow cytometry in HepG2 cells treated with 1 µM α-MSH for 24 hr. Values are mean ± SEM, n=3–6 per group in each graph. *p<0.05 and **p<0.01 for the indicated comparisons by one-way ANOVA and Dunnet post hoc tests (A–K) or by Student’s t-test (L).
-
Figure 5—source data 1
Uncropped Western blots for Figure 5A, B, C and J.
- https://cdn.elifesciences.org/articles/84782/elife-84782-fig5-data1-v1.zip
Figure 5—figure supplement 1

The effects of α-MSH on bile acid production in HepG2 cells.
(A) Quantification of cholic acid (CA) and chenodeoxycholic acid (CDCA) in the culture medium of HepG2 cells treated with 1 µM α-MSH for 24 hr. (B) The ratio of CA to CDCA in the culture medium of HepG2 cells treated with 1 µM α-MSH for 24 hr. n=3–4 per group in each graph. (C) Representative Western blots and quantification of CYP8B1 in HepG2 cells treated with 1 µM α-MSH for 1, 3, 6, or 24 hr. n=4–6 per group. Values are mean ± SEM, *p<0.05 for the indicated comparisons by Student’s t-test (A and B) or by one-way ANOVA and Dunnet post hoc tests (C).
-
Figure 5—figure supplement 1—source data 1
Ultra-high performance liquid chromatography–tandem mass spectrometry (UHPLC-MS/MS) analysis of individual bile acids in the cell culture medium.
- https://cdn.elifesciences.org/articles/84782/elife-84782-fig5-figsupp1-data1-v1.xlsx
-
Figure 5—figure supplement 1—source data 2
Uncropped Western blots for Figure 5—figure supplement 1.
- https://cdn.elifesciences.org/articles/84782/elife-84782-fig5-figsupp1-data2-v1.zip
Figure 6 with 1 supplement
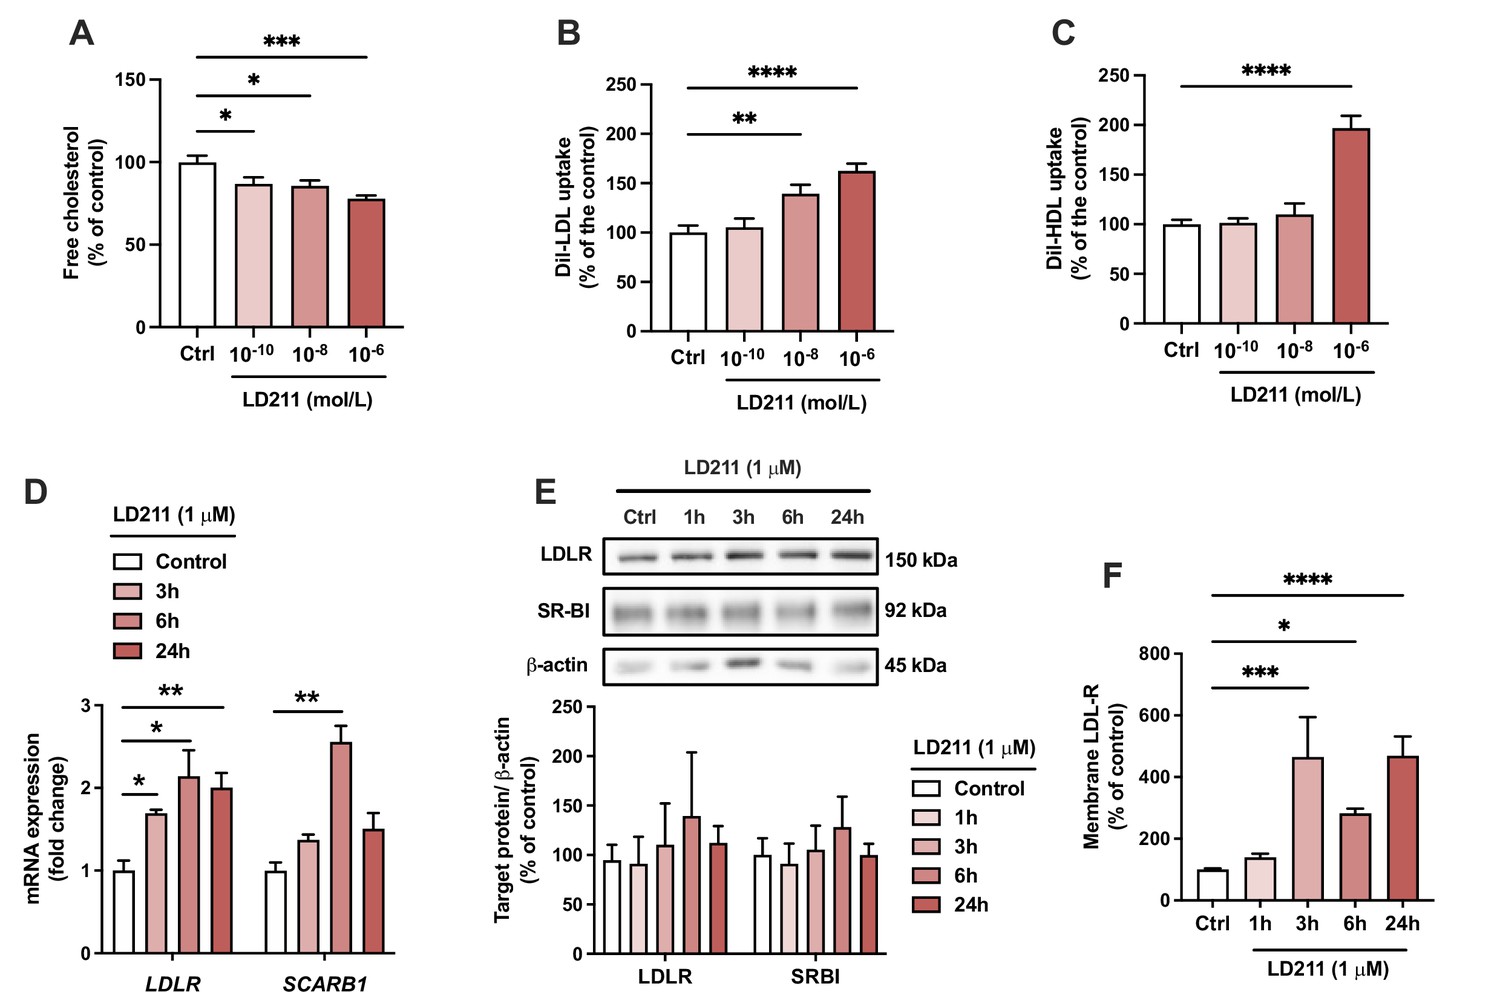
Selective activation of melanocortin 1 receptor (MC1-R) mimics the actions of α-MSH in HepG2 cells.
(A) Quantification of free cholesterol content using filipin staining in HepG2 cells treated with different concentrations of the selective MC1-R agonist LD211 (0.1 nM, 10 nM, or 1 µM) for 24 hr. (B, C) Quantification of low-density lipoprotein (LDL) and high-density lipoprotein (HDL) uptake in HepG2 cells treated with different concentrations (0.1 nM, 10 nM, or 1 µM) of LD211 for 24 hr. (D) Quantitative real-time polymerase chain reaction (qPCR) analysis of LDL receptor (LDLR) and SCARB1 expression in HepG2 cells treated with 1 µM LD211 for 3, 6, or 24 hr. (E) Representative Western blots and quantification of LDL-R and SR-BI proteins levels in HepG2 cells treated with 1 µM LD211 for 1, 3, 6, or 24 hr. (F) Quantification of cell surface LDLR by flow cytometry in HepG2 cells treated with 1 µM LD211 for 24 hr. Values are mean ± SEM, n=3–6 per group in each graph. *p<0.05, **p<0.01, ***p<0.001, and ****p<0.0001 for the indicated comparisons by one-way ANOVA and Dunnet post hoc tests.
-
Figure 6—source data 1
Uncropped Western blots for Figure 6E.
- https://cdn.elifesciences.org/articles/84782/elife-84782-fig6-data1-v1.zip
Figure 6—figure supplement 1
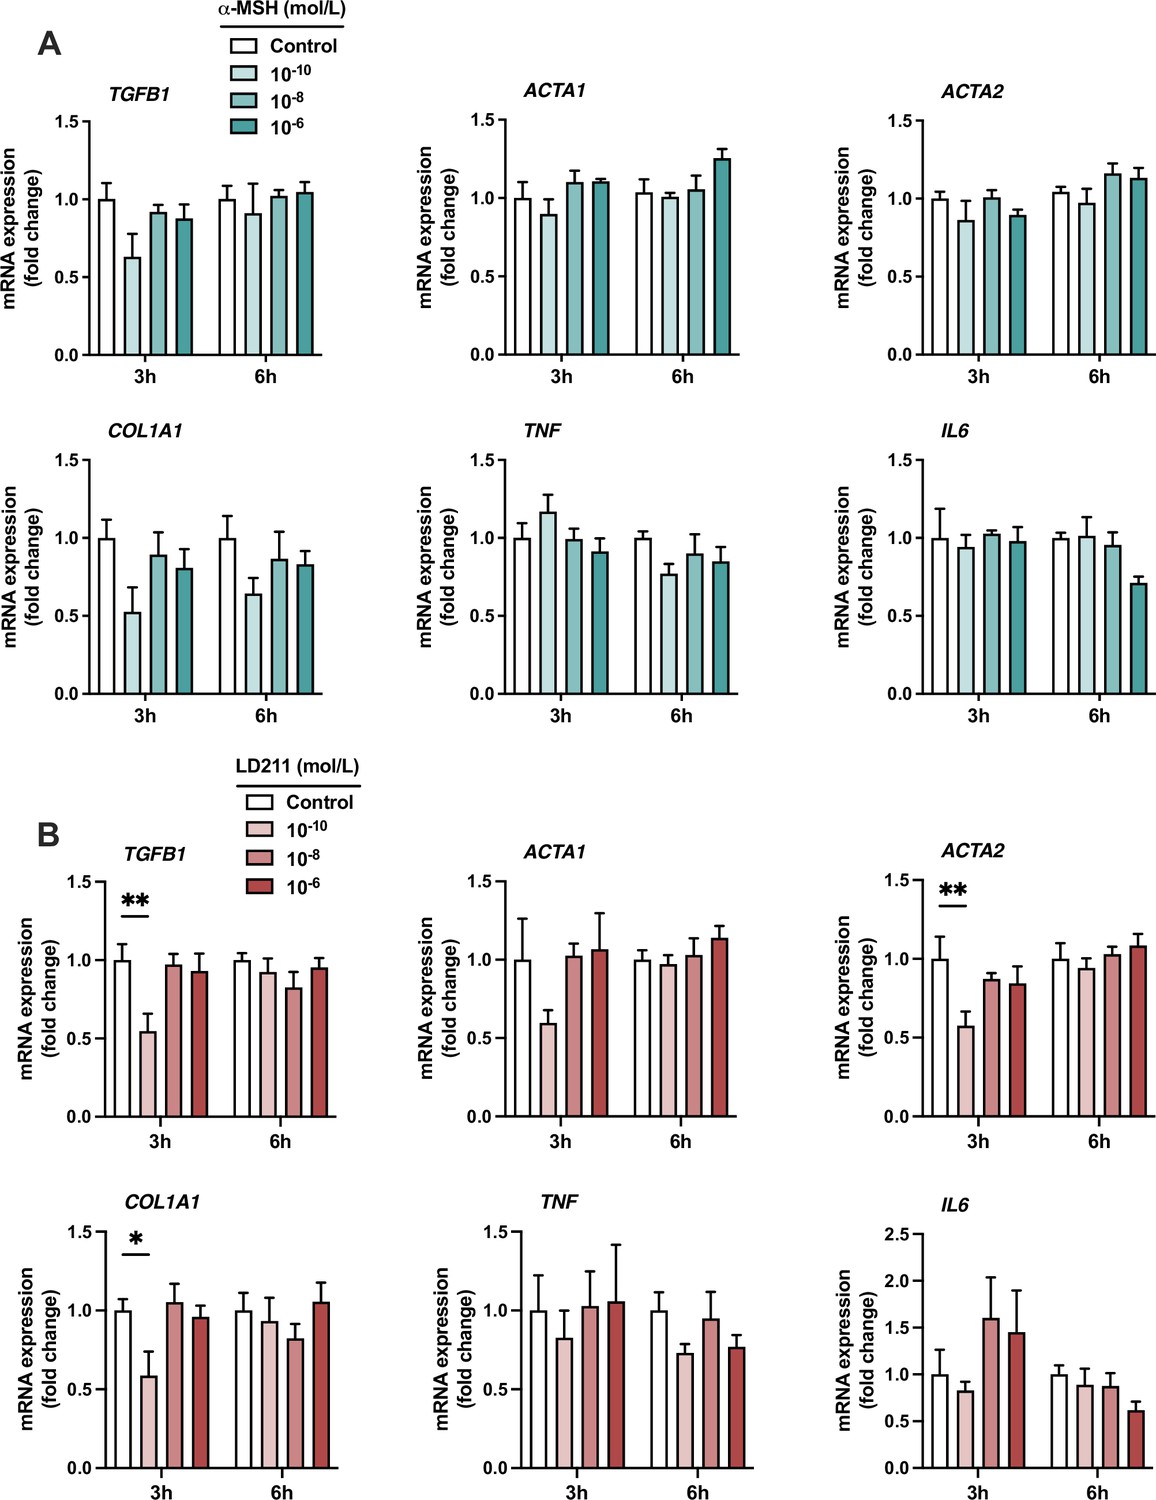
The effects of α-MSH and the selective melanocortin 1 receptor (MC1-R) agonist LD211 on the expression of pro-inflammatory and fibrotic genes in HepG2 cells.
(A) Quantitative real-time polymerase chain reaction (qPCR) analysis of TGFB1, ACTA1, ACTA2, COL1A1, TNF, and IL6 expression in HepG2 cells treated with different concentrations of α-MSH for 3 or 6 hr. (B) qPCR analysis of TGFB1, ACTA1, ACTA2, COL1A1, TNF, and IL6 expression in HepG2 cells treated with different concentrations of LD211 for 3 or 6 hr. n=4–5 per group in each graph. Values are mean ± SEM, *p<0.05 and **p<0.01 for the indicated comparisons by one-way ANOVA and Dunnet post hoc tests.
Figure 7 with 2 supplements
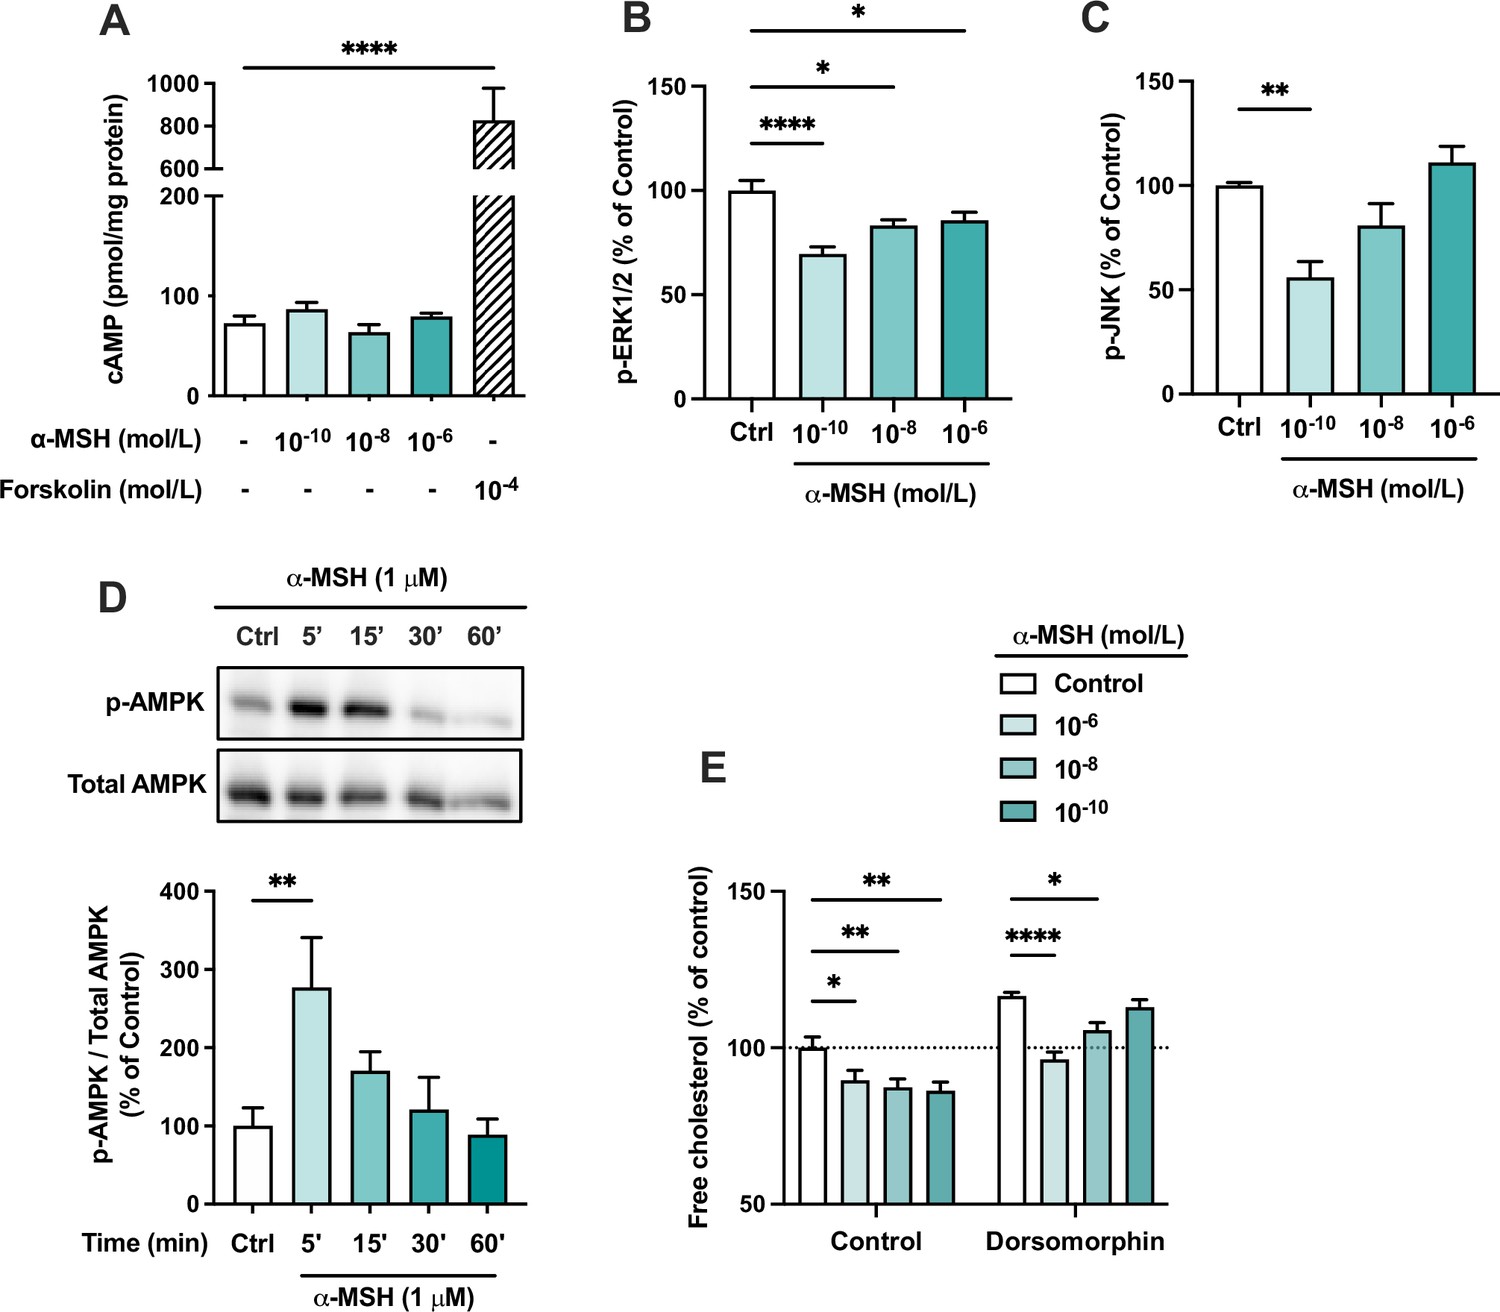
The effects of α-MSH on intracellular signaling pathways in HepG2 cells.
(A) Quantification of intracellular cAMP level in HepG2 cells treated with different concentrations of α-MSH (0.1 nM, 10 nM, or 1 µM) for 30 min. The adenylyl cyclase activator forskolin (10 µM) was used as a positive control. (B, C) Quantification of phosphorylated ERK1/2 and JNK by ELISA assays in HepG2 cells treated with different concentrations of α-MSH (0.1 nM, 10 nM, or 1 µM) for 10 min. (D) Representative Western blots and quantification of phosphorylated AMPK level (p-AMPK normalized against total AMPK) in HepG2 cells treated with 1 µM α-MSH for 5, 15, 30, or 60 min. (E) Quantification of free cholesterol content using filipin staining in HepG2 cells treated with different concentrations of α-MSH (0.1 nM, 10 nM, or 1 µM) for 24 hr in the presence or absence of the AMP-activated protein kinase (AMPK) inhibitor dorsomorphin (1 µM). Values are mean ± SEM, n=3–6 per group in each graph. *p<0.05, **p<0.01, and ****p<0.0001 for the indicated comparisons by one-way ANOVA and Dunnet post hoc tests.
-
Figure 7—source data 1
Uncropped Western blots for Figure 7D.
- https://cdn.elifesciences.org/articles/84782/elife-84782-fig7-data1-v1.zip
Figure 7—figure supplement 1

The effects of α-MSH on the phosphorylation of ERK1/2 and AMP-activated protein kinase (AMPK) in HepG2 cells.
(A) Quantification of phosphorylated ERK1/2 by ELISA assay in HepG2 cells treated with 1 µM α-MSH for 5, 15, 30, or 60 min. **p<0.01 and ***p<0.001 versus Control (0 min). (C) Representative Western blots and quantification of phosphorylated AMPK level (normalized against total AMPK) in HepG2 cells treated with different concentrations of α-MSH (0.1 nM, 10 nM, or 1 µM) for 5 min. Values are mean ± SEM, *p<0.05 for the indicated comparisons by one-way ANOVA and Dunnet post hoc tests. n=4–6 per group in each graph.
-
Figure 7—figure supplement 1—source data 1
Uncropped Western blots for Figure 7—figure supplement 1.
- https://cdn.elifesciences.org/articles/84782/elife-84782-fig7-figsupp1-data1-v1.zip
Figure 7—figure supplement 2
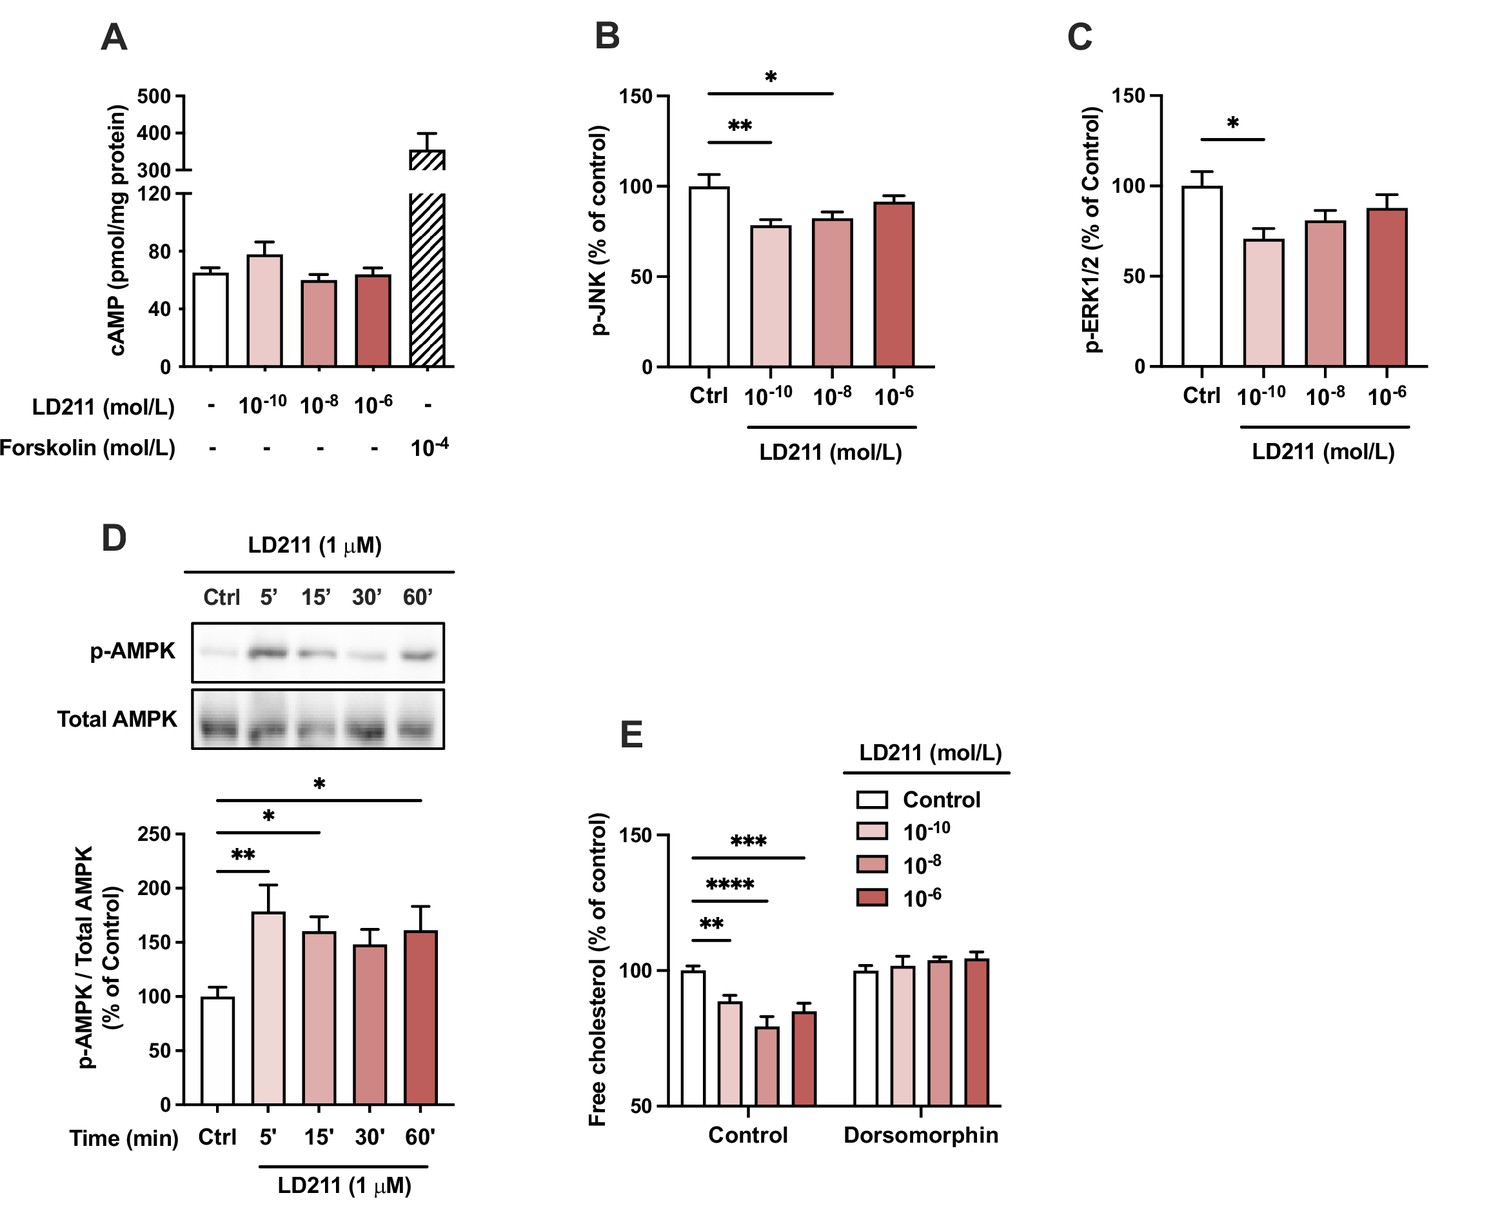
The effects of the selective melanocortin 1 receptor (MC1-R) agonist LD211 on intracellular signaling pathways in HepG2 cells.
(A) Quantification of intracellular cAMP level in HepG2 cells treated with different concentrations of LD211 (0.1 nM, 10 nM, or 1 µM) for 30 min. The adenylyl cyclase activator forskolin (10 µM) was used as a positive control. (B and C) Quantification of phosphorylated ERK1/2 and c-Jun N-terminal kinase (JNK) by ELISA assays in HepG2 cells treated with different concentrations of LD211 (0.1 nM, 10 nM, or 1 µM) for 10 min. (D) Representative Western blots and quantification of phosphorylated AMPK level (p-AMPK normalized against total AMP-activated protein kinase (AMPK)) in HepG2 cells treated with 1 µM LD211 for 5, 15, 30, or 60 min. (E) Quantification of free cholesterol content using filipin staining in HepG2 cells treated with different concentrations of LD211 (0.1 nM, 10 nM, or 1 µM) for 24 hr in the presence or absence of the AMPK inhibitor dorsomorphin (1 µM). Values are mean ± SEM, *p<0.05, **p<0.01, ***p<0.001, and ****p<0.0001 for the indicated comparisons by one-way ANOVA and Dunnet post hoc tests. n=4–6 per group in each graph.
-
Figure 7—figure supplement 2—source data 1
Uncropped Western blots for Figure 7—figure supplement 2.
- https://cdn.elifesciences.org/articles/84782/elife-84782-fig7-figsupp2-data1-v1.zip
Figure 8
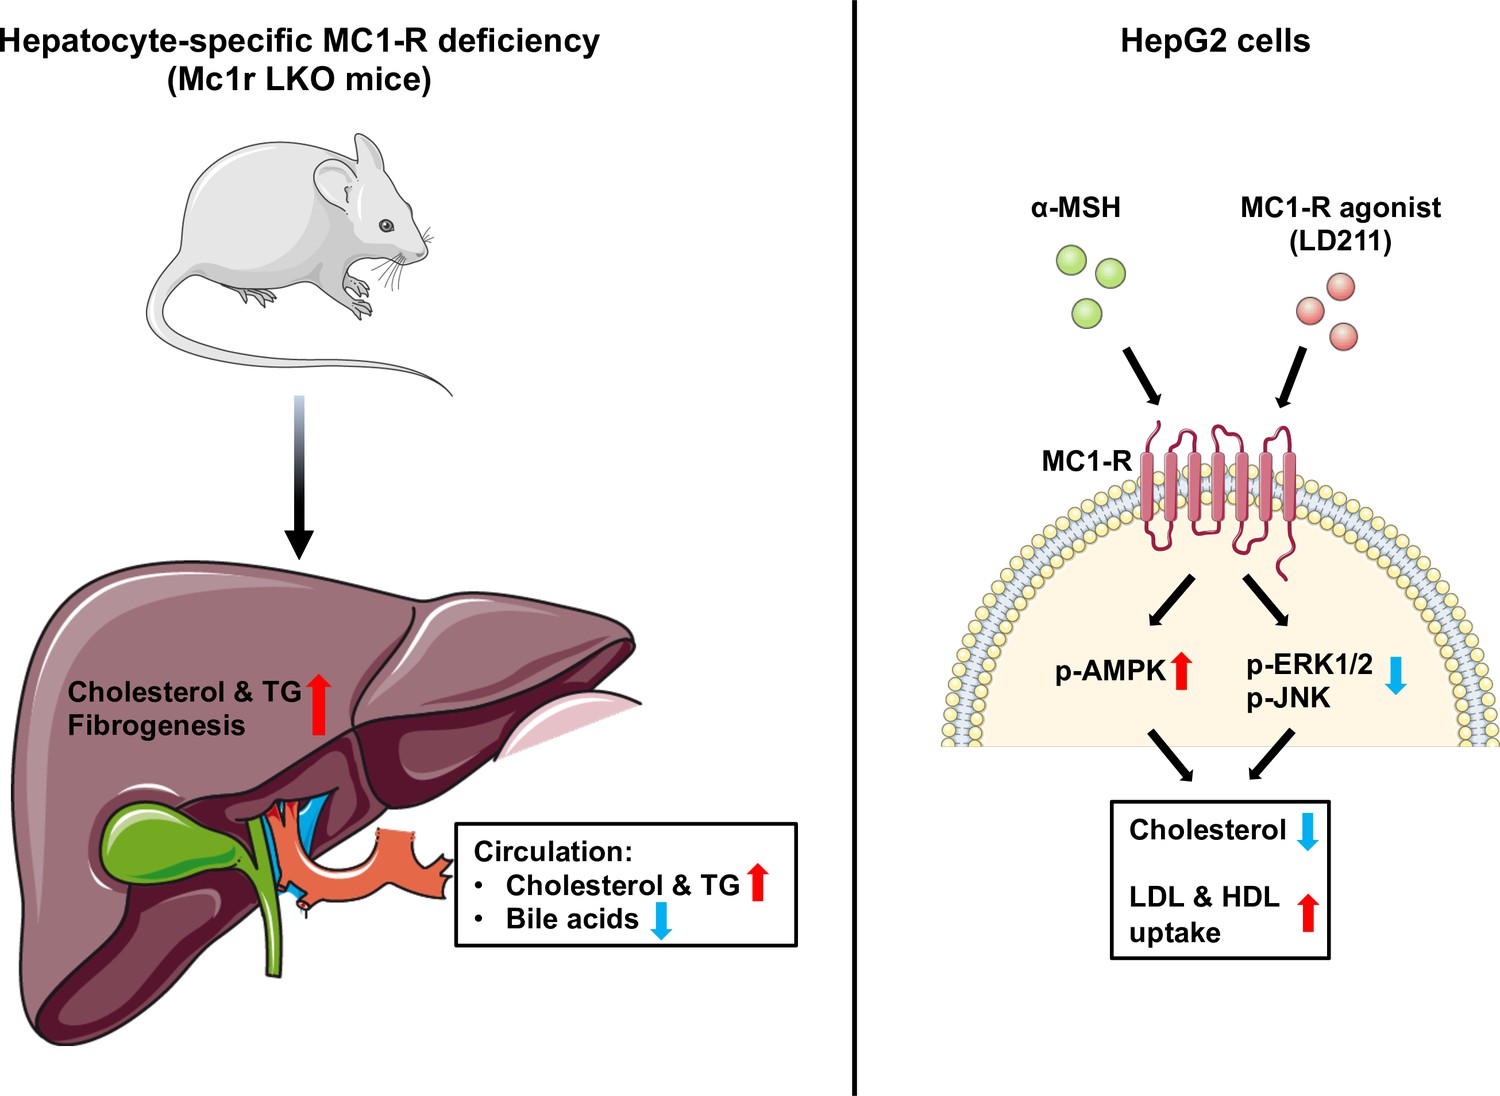
Schematic figure illustrates the role of melanocortin 1 receptor (MC1-R) in regulating cholesterol and bile acid homeostasis.
Hepatocyte-specific MC1-R deficiency enhanced the accumulation of cholesterol and triglycerides (TG) in the liver, promoted fibrogenesis, and lead to a disturbance in bile acid metabolism. Conversely, activation of MC1-R with the endogenous agonist α-MSH or the synthetic agonist LD211 reduced cellular cholesterol levels and increased the uptake of low-density lipoprotein (LDL) and high-density lipoprotein (HDL) particles in cultured HepG2 cells. p-AMPK indicates phosphorylated AMP-activated protein kinase; p-ERK1/2, phosphorylated extracellular-signal-regulated kinase 1/2; p-JNK, phosphorylated c-Jun N-terminal kinase. The figure was partly generated using Servier Medical Art, provided by Servier, licensed under a Creative Commons Attribution 3.0 unported license.
Author response image 1

Author response image 2

Author response image 3

Tables
Table 1
Quantitative RT-PCR primers for mouse genes.
| Gene nameAccession number | 5’–3’ primer sequence |
|---|---|
| Actb NM_007393.5 | Forward: tccatcatgaagtgtgacgt Reverse: gagcaatgatcttgatcttca |
| Akr1d1 NM_145364.2 | Forward: gaaaagatagcagaagggaaggt Reverse: gggacatgctctgtattccataa |
| Bsep NM_021022.3 | Forward: aagctacatctgccttagacacagaa Reverse: caatacaggtccgaccctctct |
| Ccl2 NM_011333.3 | Forward: aggtccctgtcatgcttctg Reverse: aaggcatcacagtccgagtc |
| Col1a1 NM_007742.4 | Forward: gctcctcttaggggccact Reverse: ccacgtctcaccattgggg |
| Cyp7a1 NM_007824.2 | Forward: gatcctctgggcatctcaag Reverse: agaggctgctttcattgctt |
| Cyp7b1 NM_007825.4 | Forward: gaaaactcttcaaaggcaacatgg Reverse: actggaaagggttcagaacaaatg |
| Cyp8b1 NM_010012.3 | Forward: gccttcaagtatgatcggttcct Reverse: gatcttcttgcccgacttgtaga |
| Cyp27a1 NM_024264.5 | Forward: gcctcacctatgggatcttca Reverse: tcaaagcctgacgcagatg |
| Fxr NM_001163700.1 | Forward: tccggacattcaaccatcac Reverse: tcactgcacatcccagatctc |
| Hnf4a NM_008261.3 | Forward: accaagaggtccatggtgttt Reverse: gtgccgagggacgatgtag |
| Hsd3b7 NM_133943.2 | Forward: gggagctgcgtgtctttga Reverse: gtggatggtctttggactggc |
| Il1b NM_008361.4 | Forward: tgtaatgaaagacggcacacc Reverse: tcttctttgggtattgcttgg |
| Il6 NM_031168.2 | Forward: ggccttccctacttcacaag Reverse: atttccacgatttcccagag |
| Lrh1 NM_030676.3 | Forward: tgggaaggaagggacaatctt Reverse: cgagactcaggaggttgttgaa |
| Abcc3 (Mrp3) NM_029600.4 | Forward: ctgggtcccctgcatctac Reverse: gccgtcttgagcctggataac |
| Abcc4 (Mrp4) NM_001163676.1 | Forward: ggcactccggttaagtaactc Reverse: tgtcacttggtcgaatttgttca |
| Ntcp NM_011387.2 | Forward: gaagtccaaaaggccacactatgt Reverse: acagccacagagagggagaaag |
| Gene name Accession number | 5’–3’ primer sequence |
| Slc51a (Osta) NM_145932.3 | Forward: aggcaggactcatatcaaacttg Reverse: tgagggctatgtccactggg |
| S29 NM_009093.2 | Forward: atgggtcaccagcagctcta Reverse: agcctatgtccttcgcgtact |
| Nr0b2(Shp) NM_011850.3 | Forward: tgggtcccaaggagtatgc Reverse: gctccaagacttcacacagtg |
| Stard1 NM_011485.5 | Forward: atgttcctcgctacgttcaag Reverse: cccagtgctctccagttgag |
| Tgfb1 NM_011577.2 | Forward: ccgcaacaacgccatctatg Reverse: cccgaatgtctgacgtattgaag |
| Tnf NM_013693.3 | Forward: ctgaacttcggggtgatcgg Reverse: ggcttgtcactcgaattttgaga |
Table 2
Quantitative RT-PCR primers for human genes.
| Gene nameAccession number | 5’–3’ primer sequence |
|---|---|
| ACTA1 NM_001100.4 | Forward: aggtcatcaccatcggcaacga Reverse: gctgttgtaggtggtctcgtga |
| ACTA2 NM_001613.4 | Forward: ctatgcctctggacgcacaact Reverse: cagatccagacgcatgatggca |
| ACTB NM_001101.5 | Forward: caccattggcaatgagcggttc Reverse: aggtctttgcggatgtccacgt |
| COL1A1 NM_000088.4 | Forward: gagggccaagacgaagacatc Reverse: cagatcacgtcatcgcacaac |
| GAPDH NM_002046.7 | Forward: tcaaggctgagaacgggaag Reverse: cgccccacttgattttggag |
| IL6 NM_00600.5 | Forward: gatgagtacaaaagtcctgatcca Reverse: ctgcagccactggttctgt |
| LDLR NM_000527.5 | Forward: ccacggtggagatagtgaca Reverse: ctcacgctactgggcttctt |
| SCARB1 NM_005505.5 | Forward: ctggcagaagcggtgact Reverse: cagagcagttcatggggatt |
| TGFB1 NM_000660.7 | Forward: tacctgaacccgtgttgctctc Reverse: gttgctgaggtatcgccaggaa |
| TNF NM_000594.4 | Forward: cctctctctaatcagccctctg Reverse: gaggacctgggagtagatgag |
Additional files
Download links
A two-part list of links to download the article, or parts of the article, in various formats.
Downloads (link to download the article as PDF)
Open citations (links to open the citations from this article in various online reference manager services)
Cite this article (links to download the citations from this article in formats compatible with various reference manager tools)
Melanocortin 1 receptor regulates cholesterol and bile acid metabolism in the liver
eLife 12:e84782.
https://doi.org/10.7554/eLife.84782


