Structural insight into the stabilization of microtubules by taxanes
- Laboratory of Biomolecular Research, Division of Biology and Chemistry, Paul Scherrer Institute, Switzerland
- Centro de Investigaciones Biológicas Margarita Salas, Consejo Superior de Investigaciones Científicas, Spain
- State Key Laboratory of Bioactive Substances and Functions of Natural Medicines, Institute of Materia Medica, Chinese Academy of Medical Sciences & Peking Union Medical College, China
- Department of Chemistry and Applied Biosciences, Institute of Pharmaceutical Sciences, ETH Zurich, Switzerland
- Department of Biological Sciences, Faculty of Science and Engineering, Chuo University, Japan
- Department of Biomedical Sciences, University of Alcalá, Spain
- University of Basel, Switzerland
Figures
Figure 1

Structures of tubulin and ligands employed in the work.
(A) Tubulin heterodimer (α-tubulin in gray and β-tubulin in white) in ribbon representation, where nucleotide binding sites have been highlighted in sphere representation (B) Structural features of the tubulin β-subunit. (C) Structures of taxanes used in this study.
Figure 2
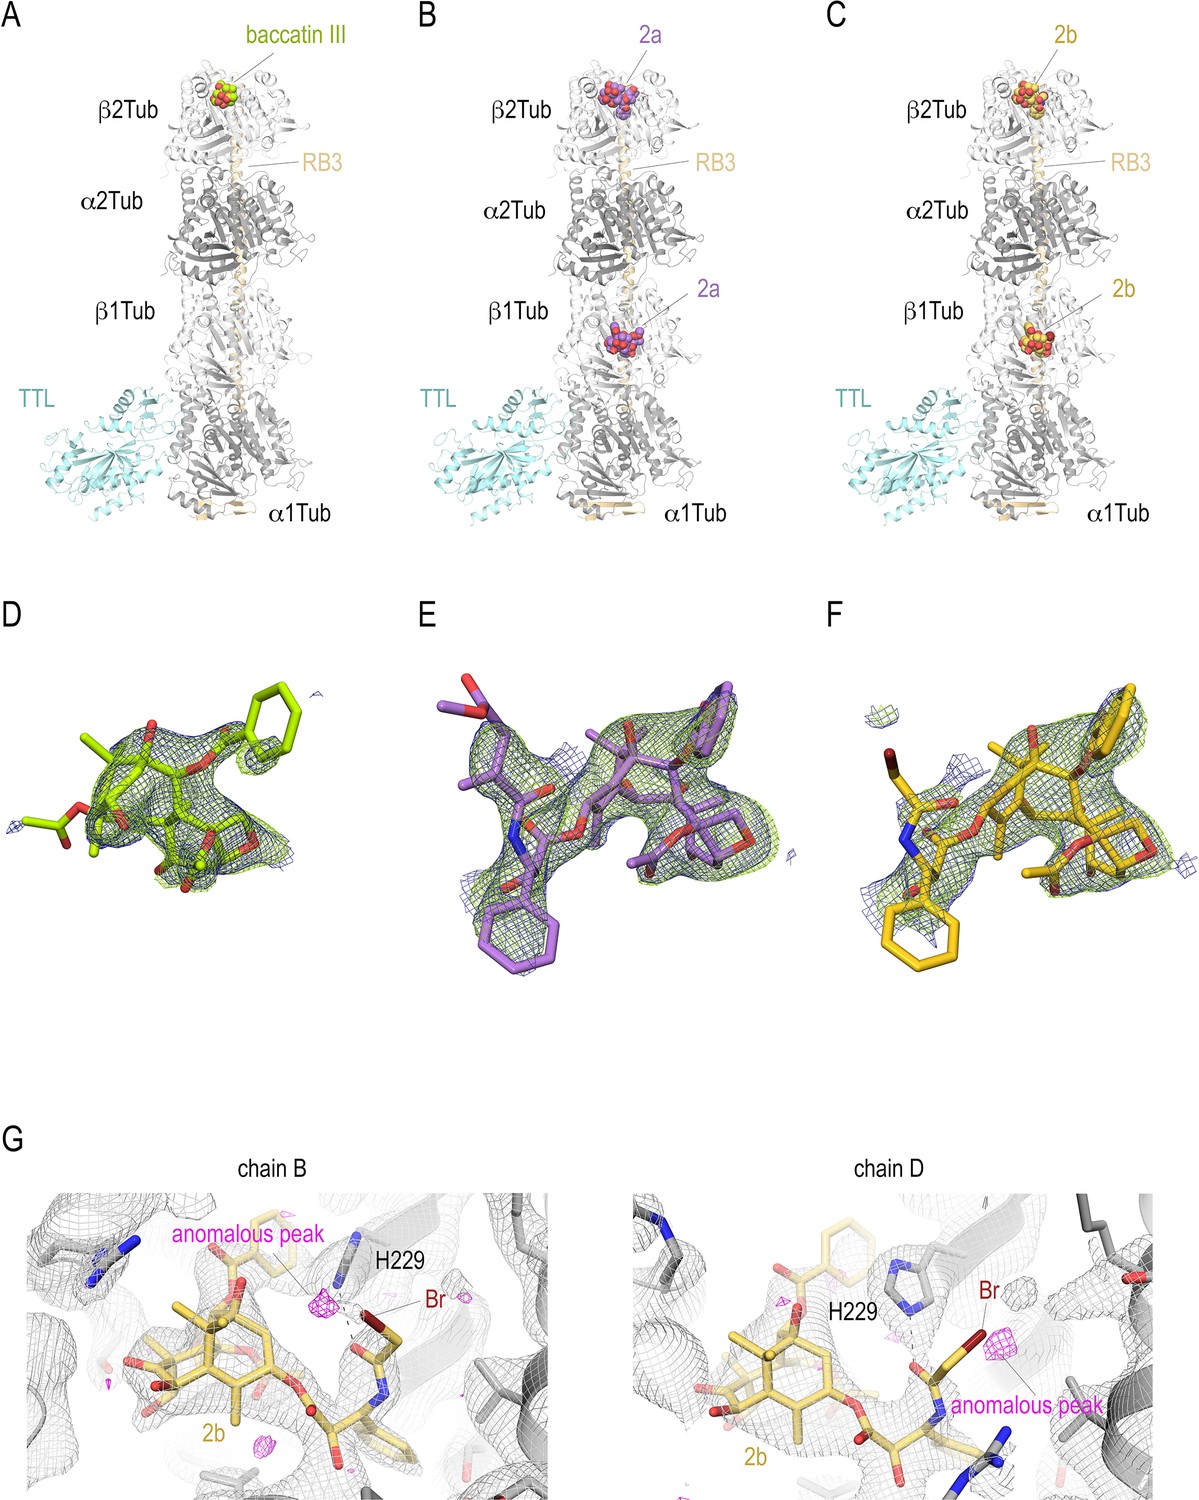
T2R-TTL structures in complex with baccatin III, 2a, and 2b.
Overall view of the T2R-TTL-baccatin III (PDB ID 8BDE) (A), the T2R-TTL-2a (PDB ID 8BDF) (B), and the T2R-TTL-2b (PDB ID 8BDG) crystal structures. The α- and β-tubulin chains are colored in dark and light gray, respectively. The TTL chains (cyan) and the RB3 (yellow-orange) are shown in ribbon representation. The tubulin-bound ligands are displayed as spheres and are colored following the same color scheme as in the main figures. (D–F) Electron-density maps highlighting the bound baccatin III, 2a, and 2b. The SigmaA-weighted 2mFo − DFc (dark blue mesh) and mFo − DFc (light green mesh) omit maps are contoured at +1.0σ and +3.0σ, respectively. The map calculations excluded the atoms of the corresponding ligands. (G) Anomalous density peaks detected in both the binding sites in chains B and D of T2R-TTL for the bromine moiety of compound 2b.
Figure 3
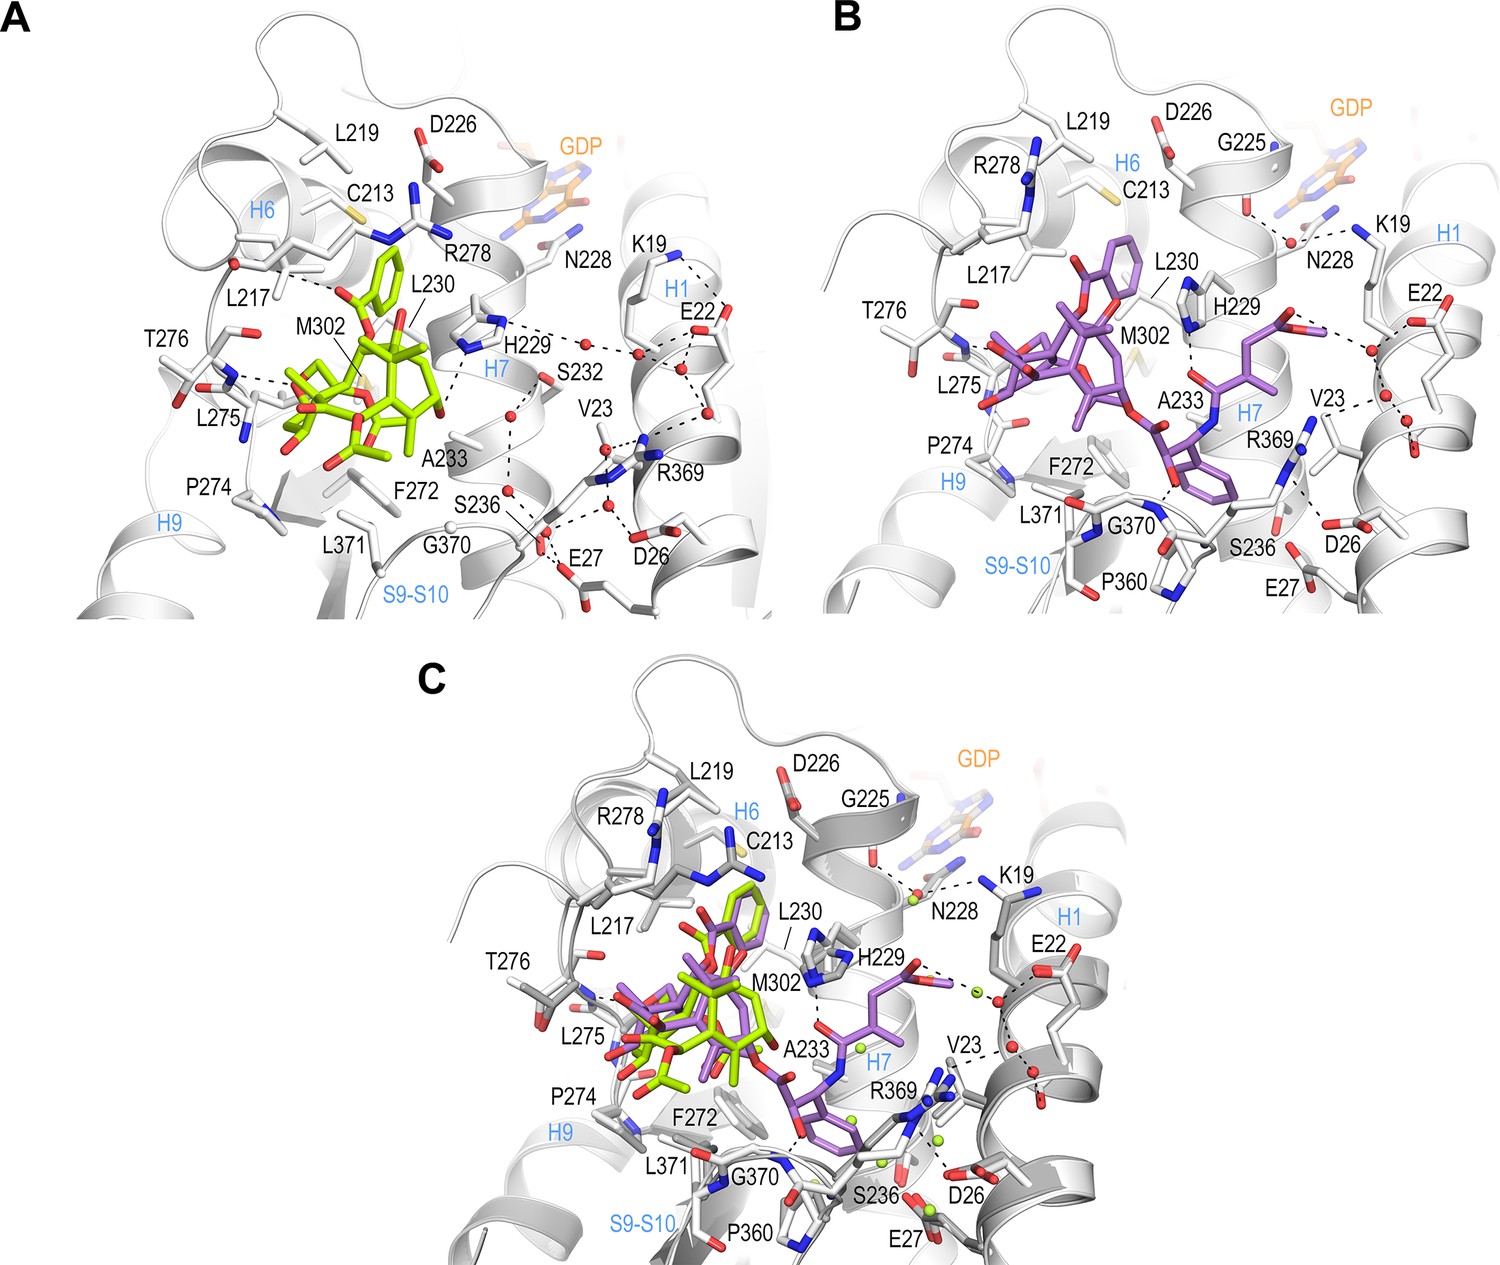
Crystal structure of T2R-TTL-baccatin III (PDB ID 8BDE) and T2R-TTL-2a (PDB ID 8BDF) complexes.
(A) Close-up view of the interaction network observed between baccatin III (lemon) and β-tubulin (light gray). Interacting residues of tubulin are shown in stick representation and are labeled. Oxygen and nitrogen atoms are colored red and blue, respectively; carbon atoms are in lemon (baccatin III) or light gray (tubulin). Hydrogen bonds are depicted as black dashed lines. Secondary structural elements of tubulin are labeled in blue. (B) Close-up view of the interaction of 2a (violet) with β-tubulin in the same view and representation as in (A). (C) The same close-up view as in (A) and (B) with the superimposed baccatin III (lemon) and 2a (violet) complex structures. Water molecules belonging to the baccatin III structure are represented as lemon spheres.
Figure 4
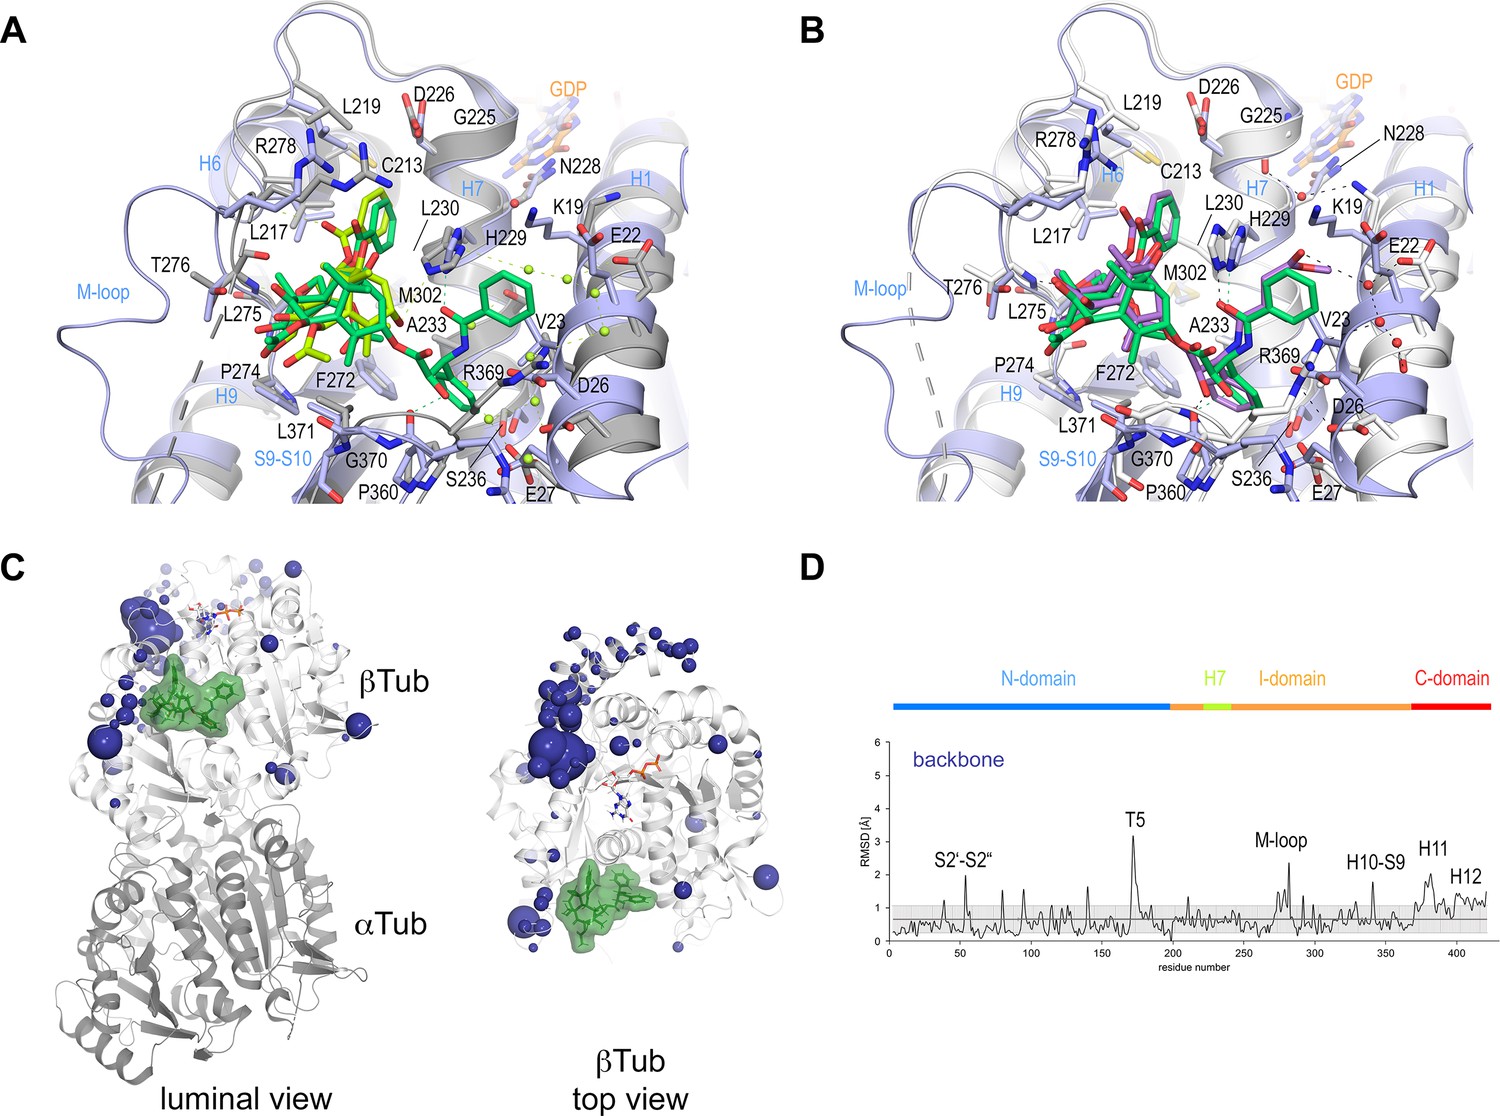
Comparison of taxane binding to unassembled curved versus assembled straight tubulin.
(A) Close-up view of the superimposed baccatin III bound (ligand in lemon; protein in gray ribbon and sticks) to curved tubulin (PDB ID 8BDE) and paclitaxel bound to straight tubulin as found in a microtubule (PDB ID 6WVR; ligand in dark green; protein in slate ribbon and sticks) structures. Interacting residues of tubulin are shown in stick representation and are labeled. Oxygen and nitrogen atoms are colored red and blue, respectively. Hydrogen bonds are depicted as black dashed lines. Secondary structural elements of tubulin are labeled in blue. Water molecules belonging to the baccatin III structure are represented as lemon spheres. The structures were superimposed onto their taxane sites (residues 208–219+225–237+272–276+286–296+318–320+359–376); root-mean-square deviations (rmsd) 0.894 Å (52 Cα atoms). (B) Close-up view of superimposed 2a bound to curved tubulin (PDB ID 8BDF) (ligand in violet; protein in gray ribbon and sticks) and paclitaxel bound to straight tubulin (PDB ID 6WVR; ligand in dark green; protein in slate ribbon and sticks) structures (rmsd 0.826 Å over 52 Cα atoms) using the same settings as in (A). (C) Conformational changes on β-tubulin induced by paclitaxel upon binding to straight tubulin in microtubules (PDB ID 6WVR). The α-tubulin and β-tubulin chains are in ribbon representation and are colored in dark and light gray, respectively. The rmsd differences between unbound and paclitaxel-bound straight tubulin are represented as dark (backbone rmsd) blue spheres. Only the rmsd differences above a threshold of average ± standard deviation are displayed. The sphere radii correspond to the average-subtracted rmsd values displayed in panel (D). (D) Rmsd plots of backbone positions between the paclitaxel bound (PDB ID 6WVR) and the apo (PDB ID 6DPV) straight tubulin in microtubules. The gray error bar represents the average rmsd ± standard deviation. The top bar is colored according to the following domain assignment: N-terminal domain (N-domain., marine blue), intermediate domain (I-domain, orange), central helix βH7 (lemon), and C-terminal domain (C-domain, red). The β-tubulin chains of the corresponding structures were superimposed onto their β-tubulin N-terminal β-sheets (rmsd 0.304 Å over 30 Cα).
Figure 5
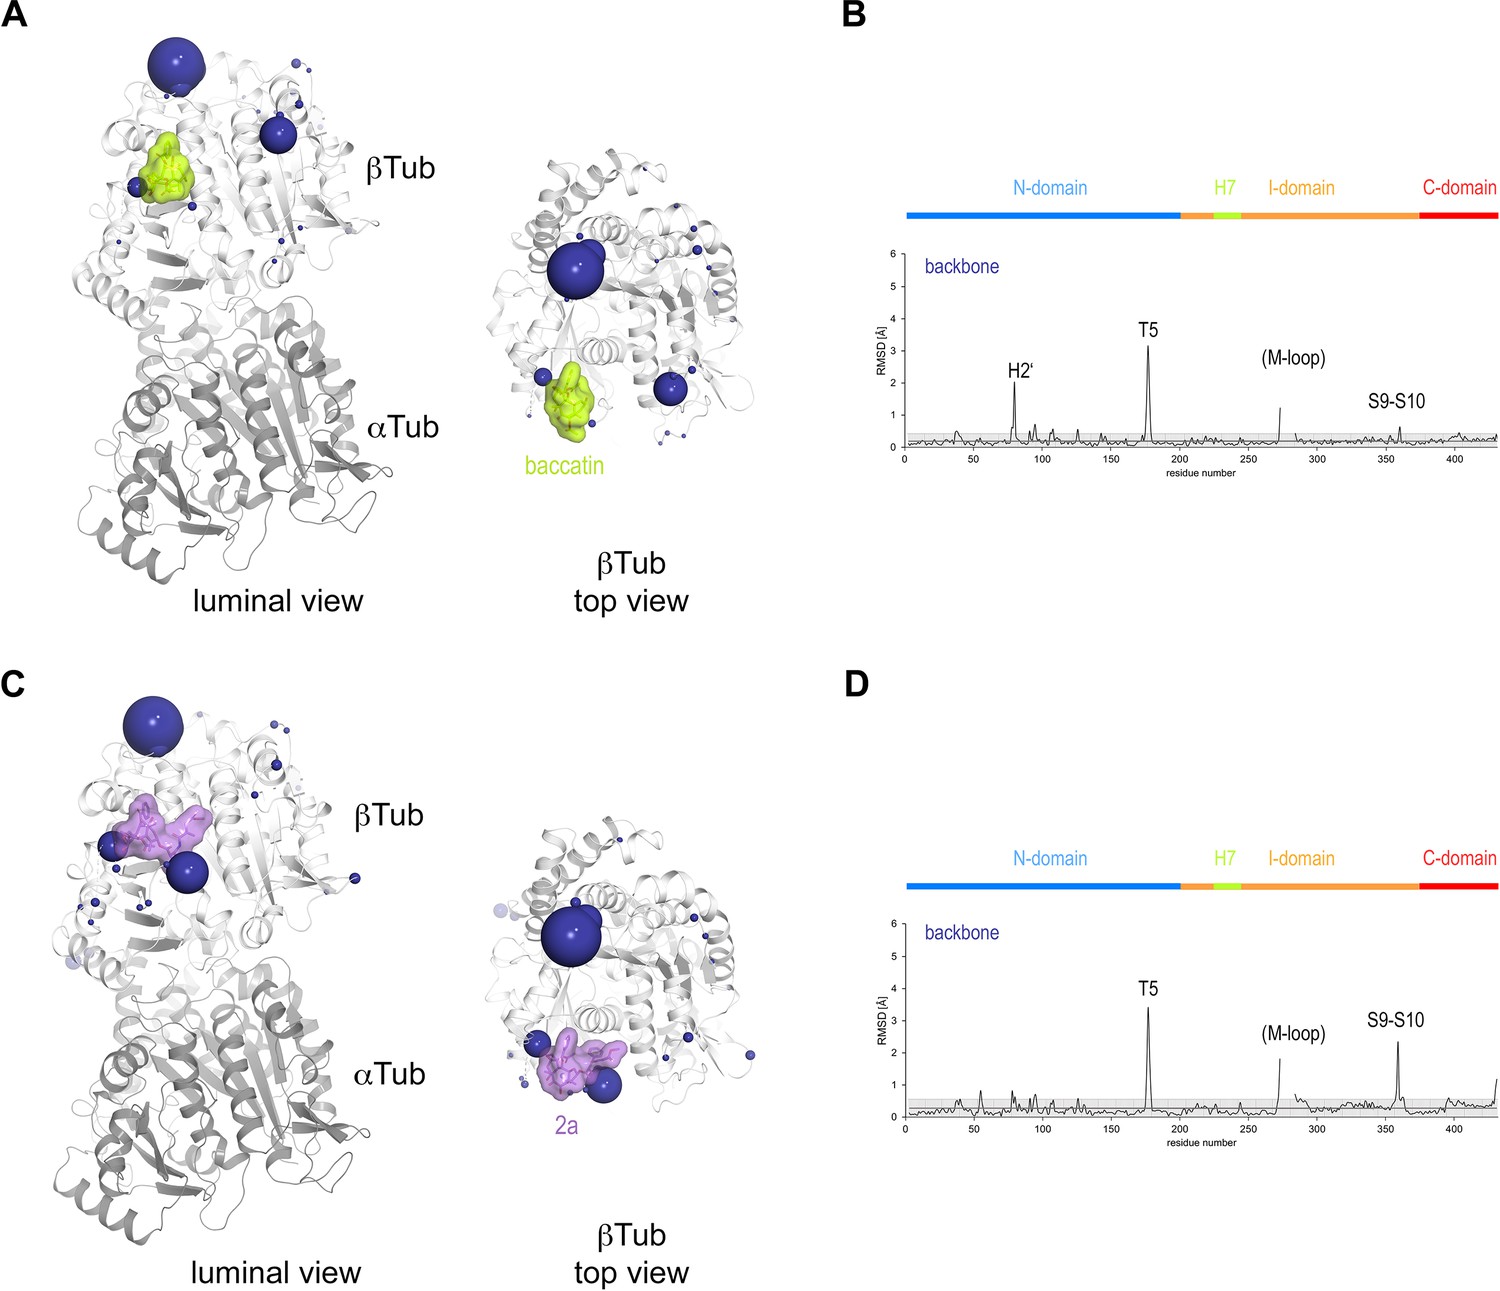
Conformational changes induced by taxane binding to unassembled, curved tubulin.
(A) Conformational changes on the backbone atoms (dark blue) of the β-tubulin chain induced by baccatin III upon binding to curved tubulin. The tubulin chains are in ribbon representation and are colored in dark (α-tubulin) and light (β-tubulin) gray, respectively. The root-mean-square deviation (rmsd) values of the superimposed unbound and baccatin III-bound curved tubulin are represented as dark blue (backbone rmsd) spheres, respectively. Only the rmsd values above a threshold of average + standard deviation are displayed. The sphere radii correspond to the average-subtracted rmsd values displayed in panel (B). (B) Rmsd plots of the backbone (bottom) positions between the baccatin bound (PDB ID 8BDE) and the apo (PDB ID 4I55) curved tubulin state. The gray error bar represents the average rmsd ± standard deviation. The top bar is colored according to the following domain assignment: N-terminal domain (N-domain, marine blue), intermediate domain (I-domain, orange), central helix H7 (lemon), C-terminal domain (C-domain, red). The β-tubulin chains of the corresponding structures were superimposed onto their β-tubulin N-terminal β-sheet (rmsd 0.08 Å over 29 Cα). (C) Conformational changes on the backbone atoms (dark blue) of the β-tubulin chain induced by 2a upon binding to curved tubulin. (D) Rmsd plots of the backbone (bottom) positions between the 2a bound (PDB ID 8BDF) and the apo (PDB ID 4I55) curved tubulin state (rmsd 0.10 Å over 29 Cα). The same display settings as in (B) are applied.
Figure 6
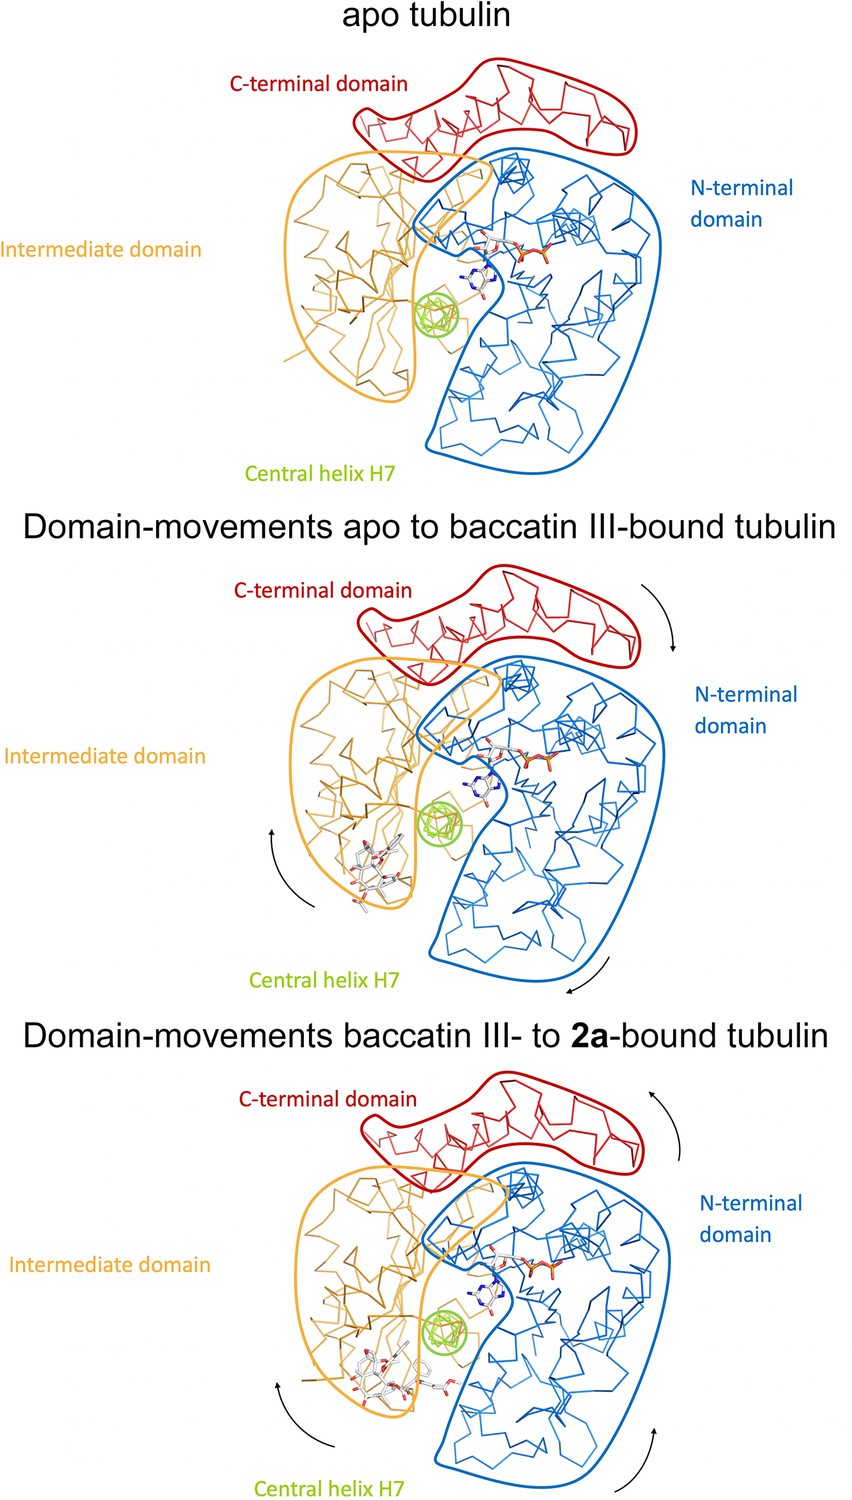
Schematic representation of subtle domain movements observed from apo to baccatin III- to 2a-bound curved tubulin.
The three structures were superimposed onto their central helices βH7 to highlight better the subtle domain movements relative to each other. The individual domains are colored according to their domain assignment and their borders are contoured using the same color scheme: N-terminal domain (N-domain, marine blue), intermediate domain (I-domain, orange), central helix βH7 (lemon), C-terminal domain (C-domain, red). The directions of the individual movements are highlighted with black arrows.
Figure 7
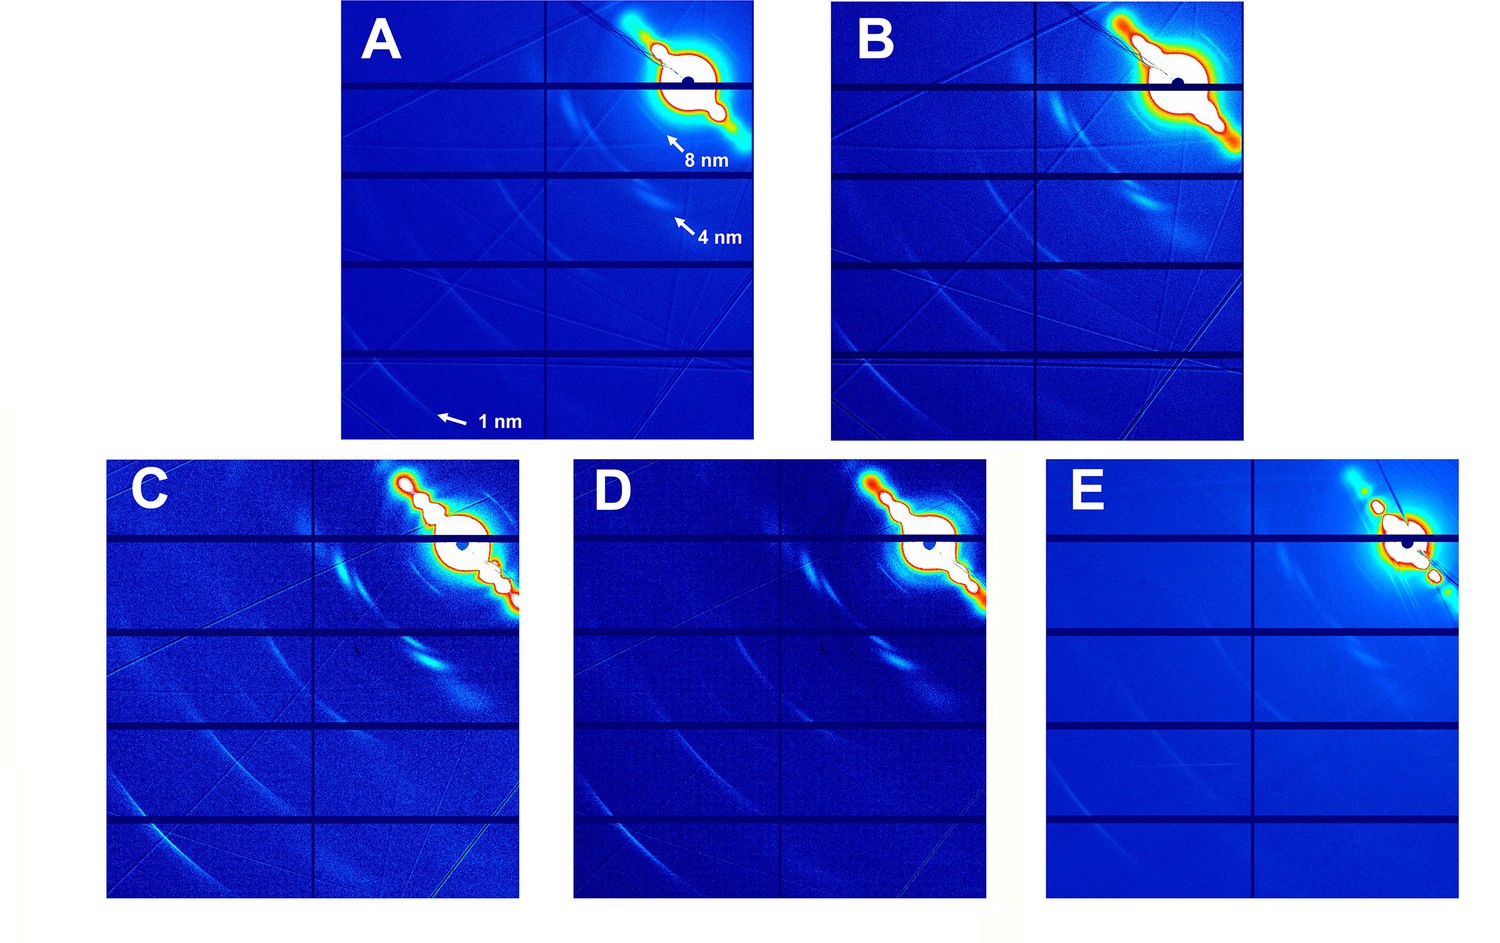
Fiber diffraction patterns of microtubules.
Microtubules assembled from guanosine triphosphate (GTP)-tubulin and paclitaxel (A), GTP-tubulin and docetaxel (B), GTP-tubulin and 2a (C), GTP-tubulin and 2b (D), and GTP-tubulin and baccatin III (E) are shown.
Figure 8
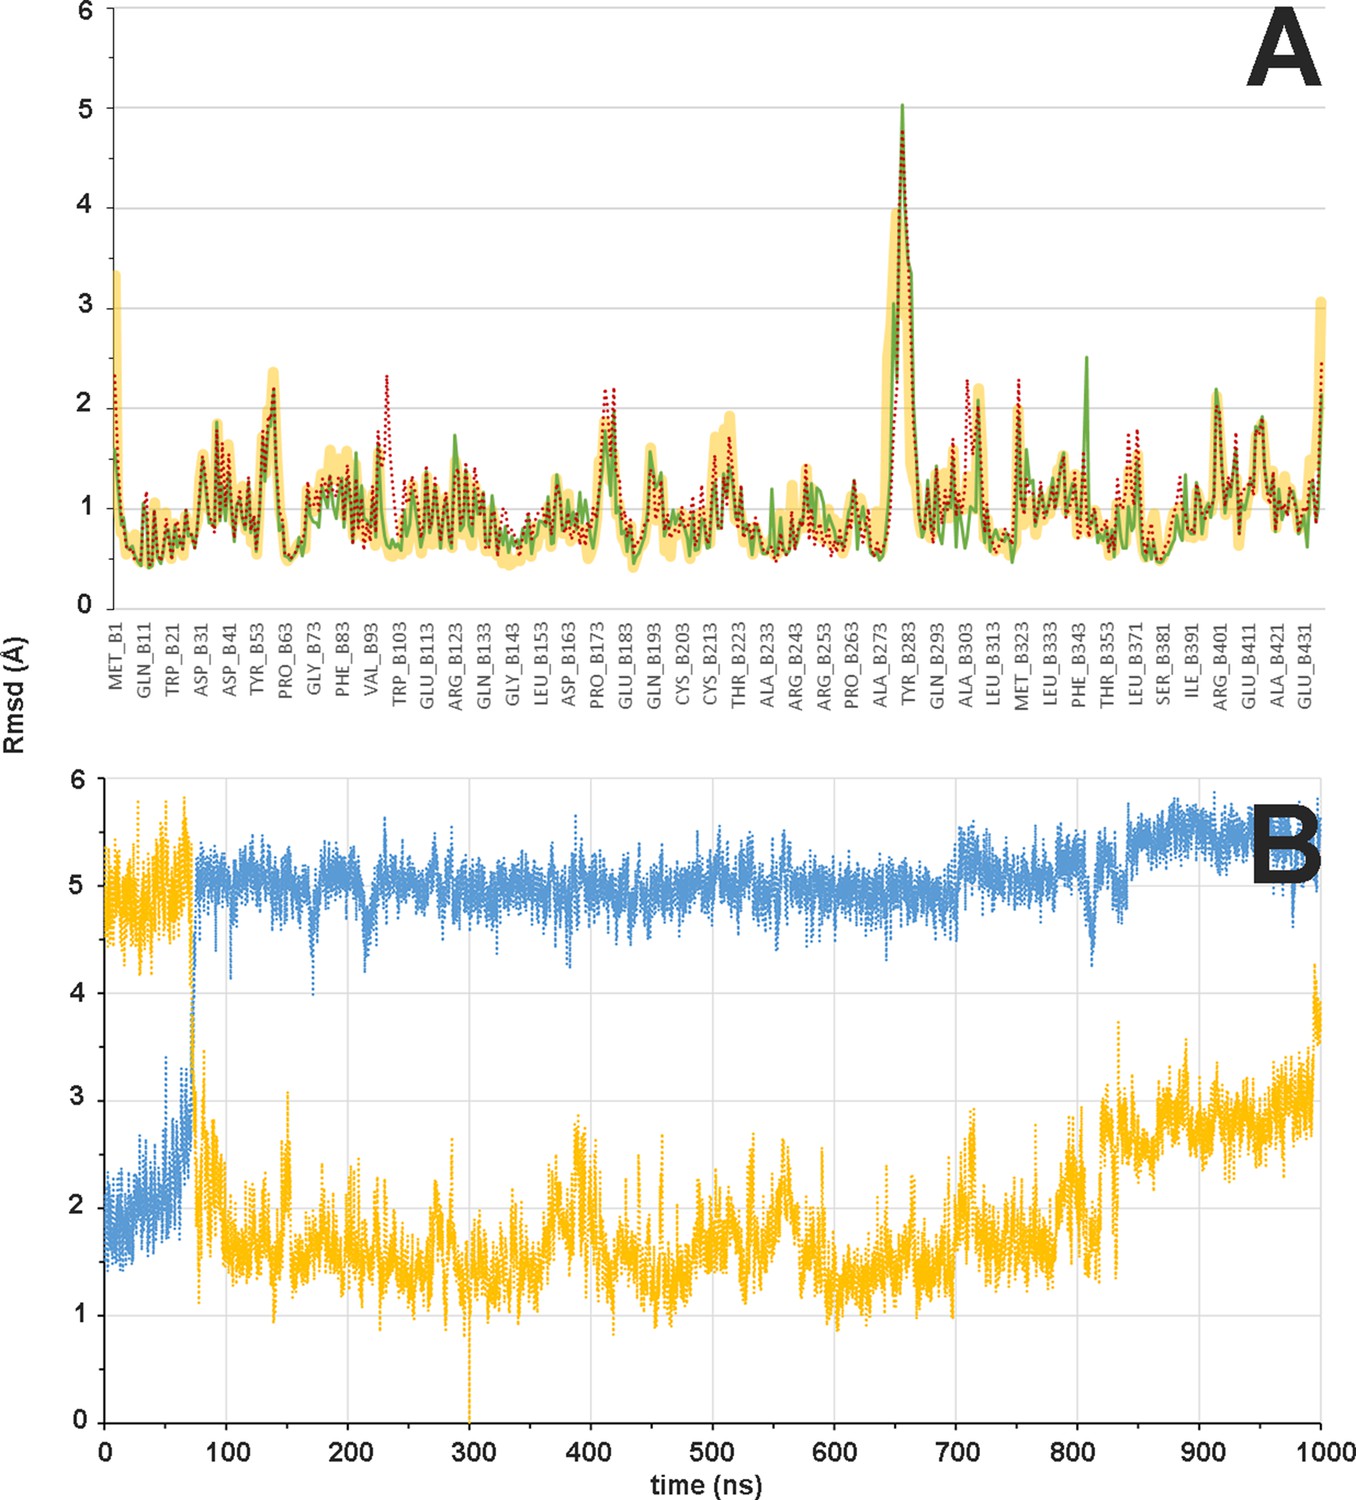
Flexibility of β subunit and βM loop during the αβ-tubulin dimer molecular dynamics (MD) simulation.
(A) Mass-weighted positional fluctuations (or root-mean-square fluctuations, Å) by residue for atoms in the β subunit of the αβ-tubulin dimer over the course of 0.6 µs of MD simulation, in the apo form (yellow line) and in complex with baccatin III (green line) or paclitaxel (red dotted line). (B) Evolution of the conformation of the βM loop in the 1.0 µs simulation of the αβ-tubulin dimer free in solution. The Cα root-mean-square deviation is measured with respect to either the initial α-helical structure (blue line) or the extended hairpin conformation that was stabilized at 300 ns (orange line).
Figure 9
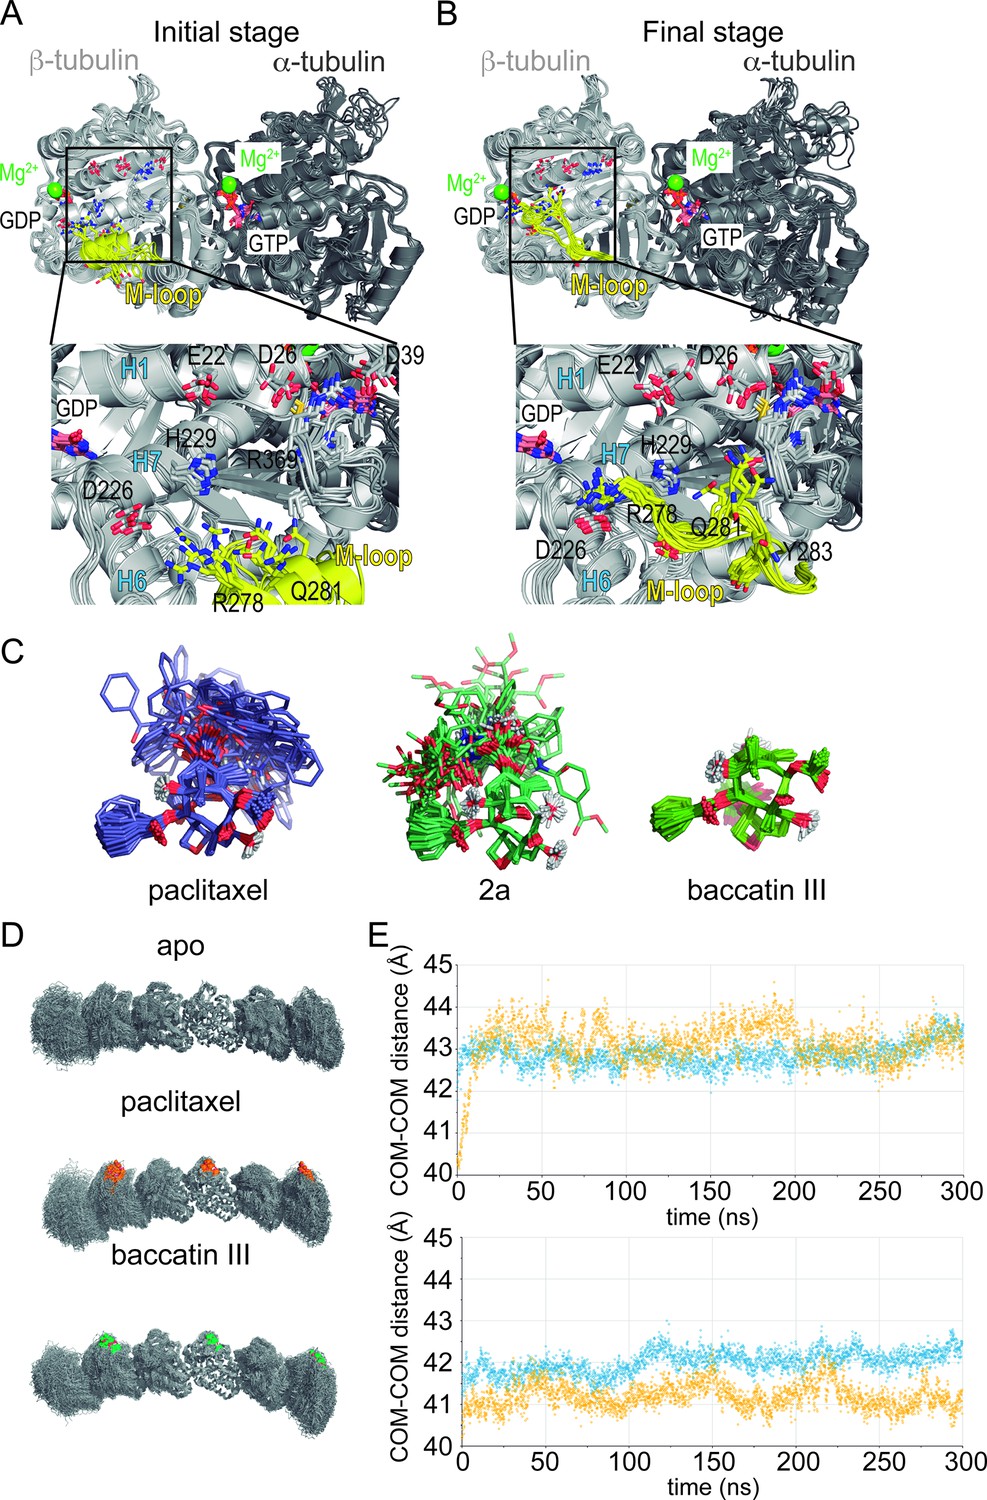
Molecular dynamics (MD) simulation of tubulin-taxane complexes.
(A,B) MD simulations of the free αβ-tubulin dimer. (A) Initial stage of the simulation, starting from a βM loop (residues β275-β286; yellow) organized as an α-helix akin to what is observed in a microtubule and (B) after 100 ns of an MD simulation. (C) Overlaid snapshots taken every 5 ns over the course of a 250 ns MD simulation of paclitaxel (left), 2a (middle), or baccatin III (right). (D) Snapshots of the protofilament model bound to paclitaxel or baccatin III and apo form. (E) Time evolution of the intermonomer distances (measured between the respective centers of mass; α2-β2 in blue and β2-α3 in yellow) in the simulated apo (lower graph) and liganded (upper graph) protofilaments.
Figure 10
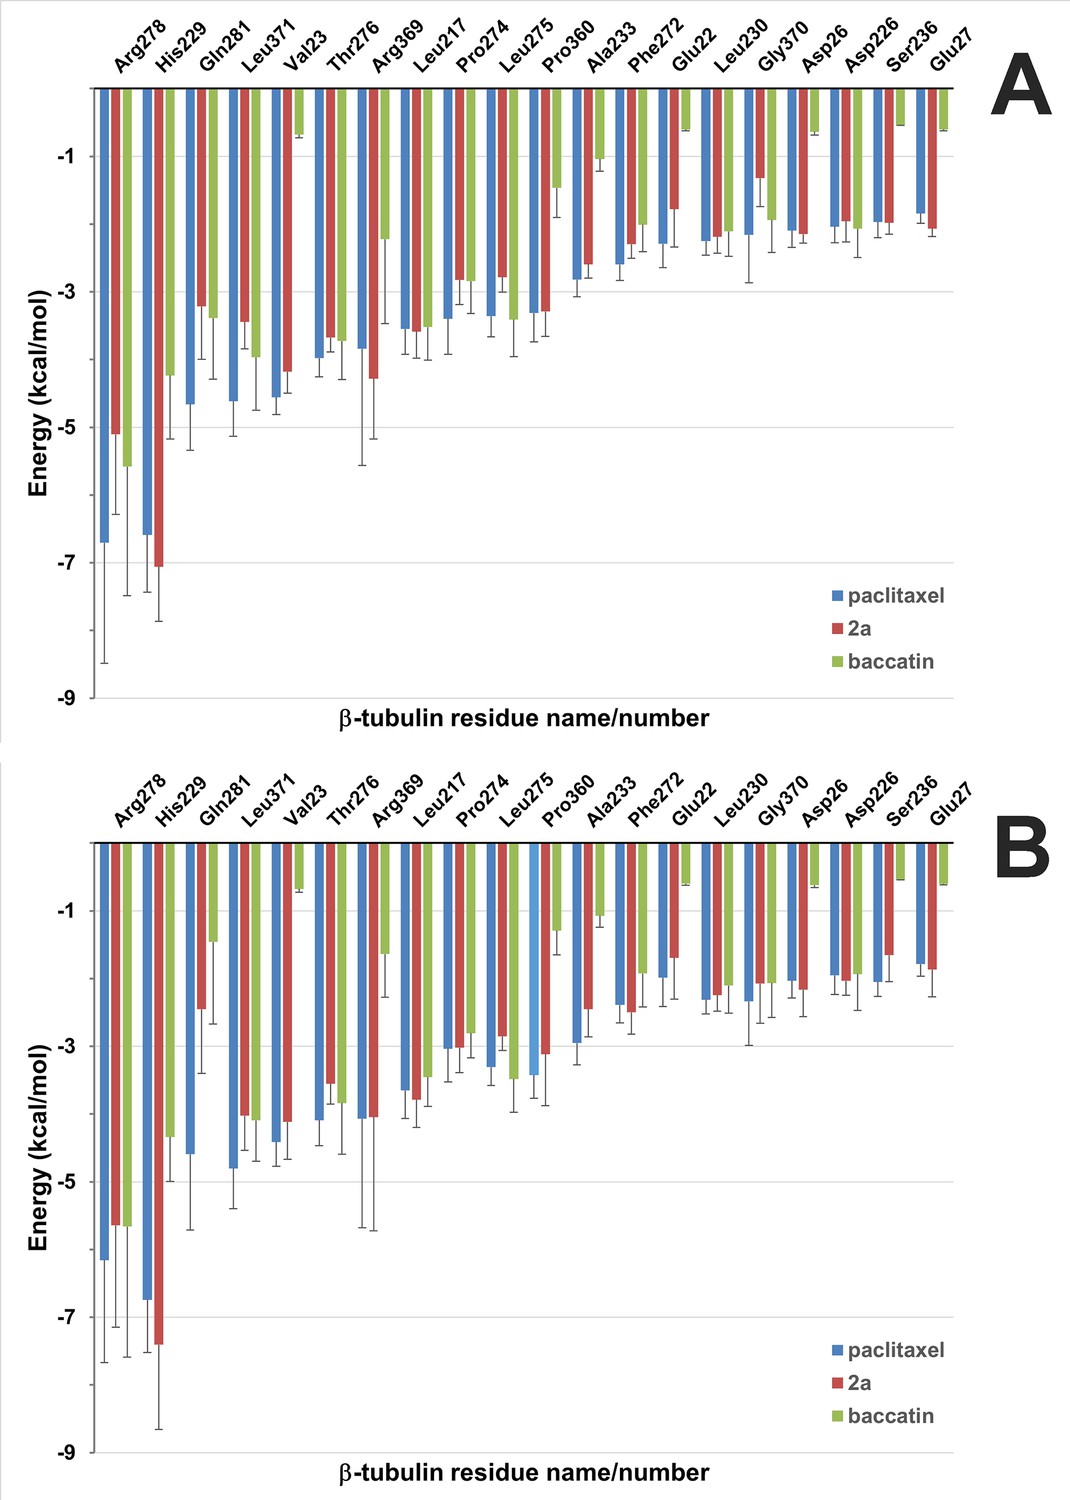
Solvent-corrected interaction energies between individual β2-tubulin residues and ligands throughout the molecular dynamics (MD) simulations of the minimalist representation of a microtubule.
(A) The interfacial site 1 between neighboring protofilamentes. (B) The solvent-exposed site 2. These per-residue energies, which together represent a ‘binding fingerprint’, were calculated by means of the program MM-ISMSA (Klett et al., 2012) using 120 complex structures from the MD simulations after equilibration (5–600 ns), cooling down to 273 K and energy minimization. A cutoff of 1.5 kcal mol–1 was used in the plot for enhanced clarity. Bars are standard errors.
Figure 11
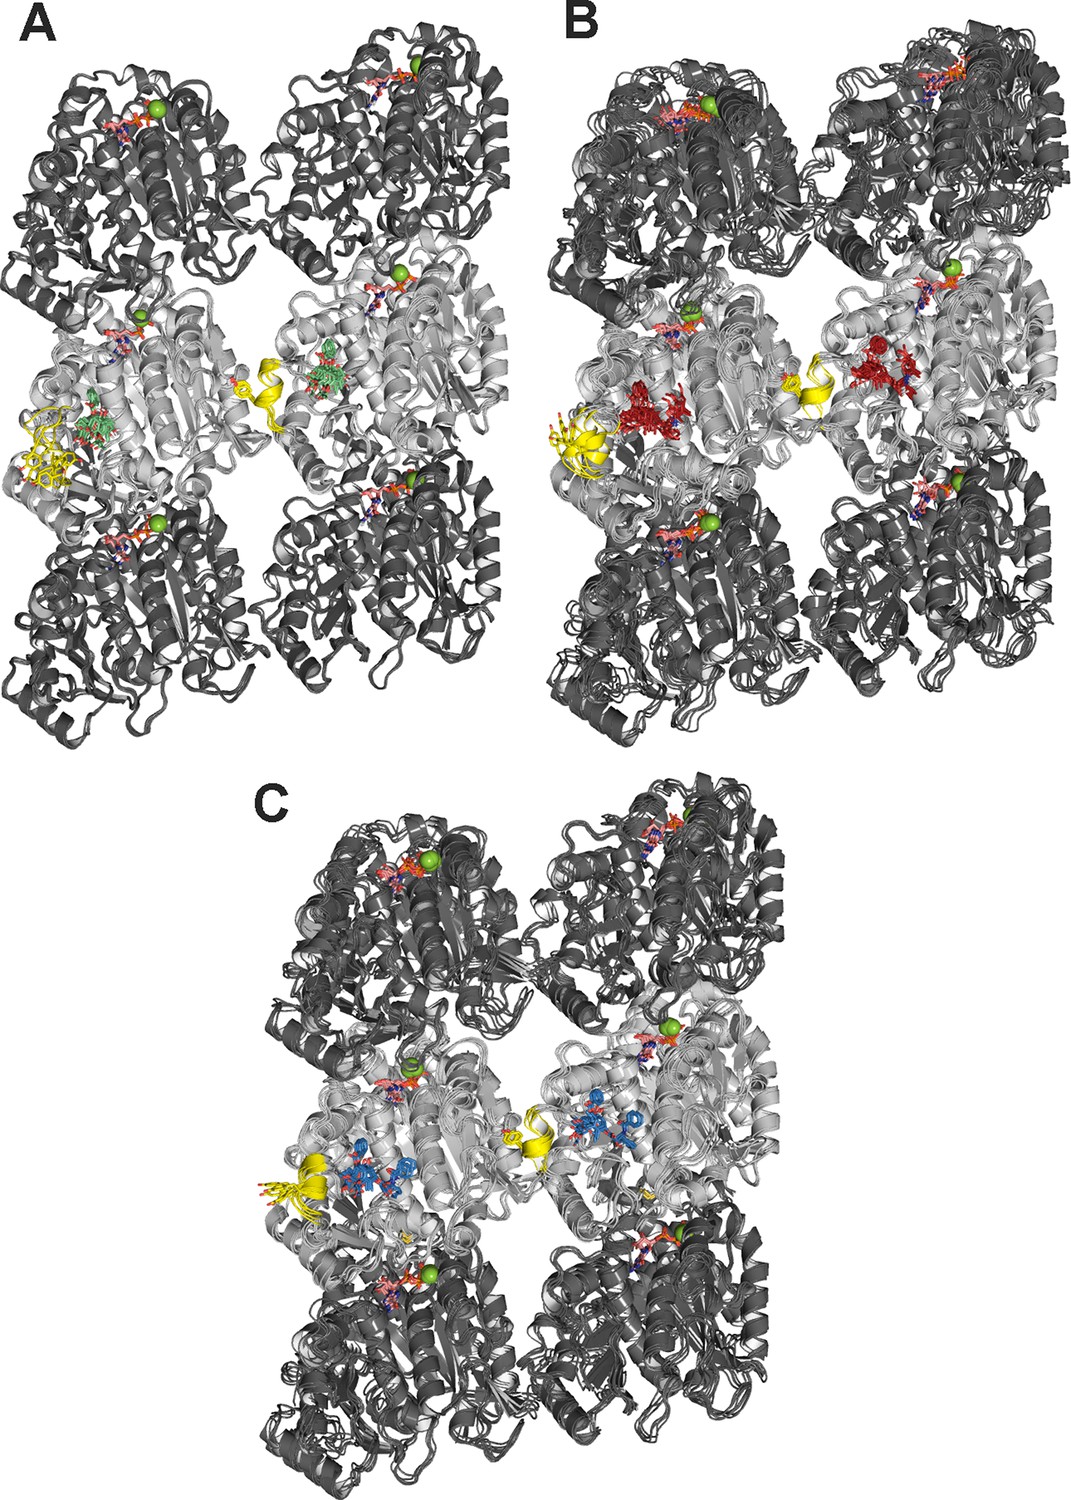
Molecular dynamics (MD simulations of minimalist) representations of a microtubule ((α1-β1-α2)/(α1’-β1’-α2’)) in complex with the ligands employed.
Baccatin III (green, A), 2a (red, B), paclitaxel (blue, C). α- (dark gray) and β-tubulin (light gray) are displayed as ribbons, with the βM loop colored in yellow and the side chain of Tyr283 as sticks. Guanosine diphosphate (GDP) and guanosine triphosphate (GTP) are shown as sticks, with C atoms colored in salmon. Mg2+ ions are displayed as green spheres. Each set of five overlaid structures represents a conformational ensemble made up of snapshots spaced by 5 ns taken from the equilibrated part of the trajectory and then cooled down to 273 K and energy minimized. Site 1 (at the top of each figure) is located at the interface between two neighboring protofilaments whereas site 2 (at the bottom of each figure) is devoid of any lateral contacts but exposed to the bulk solvent instead.
Figure 12
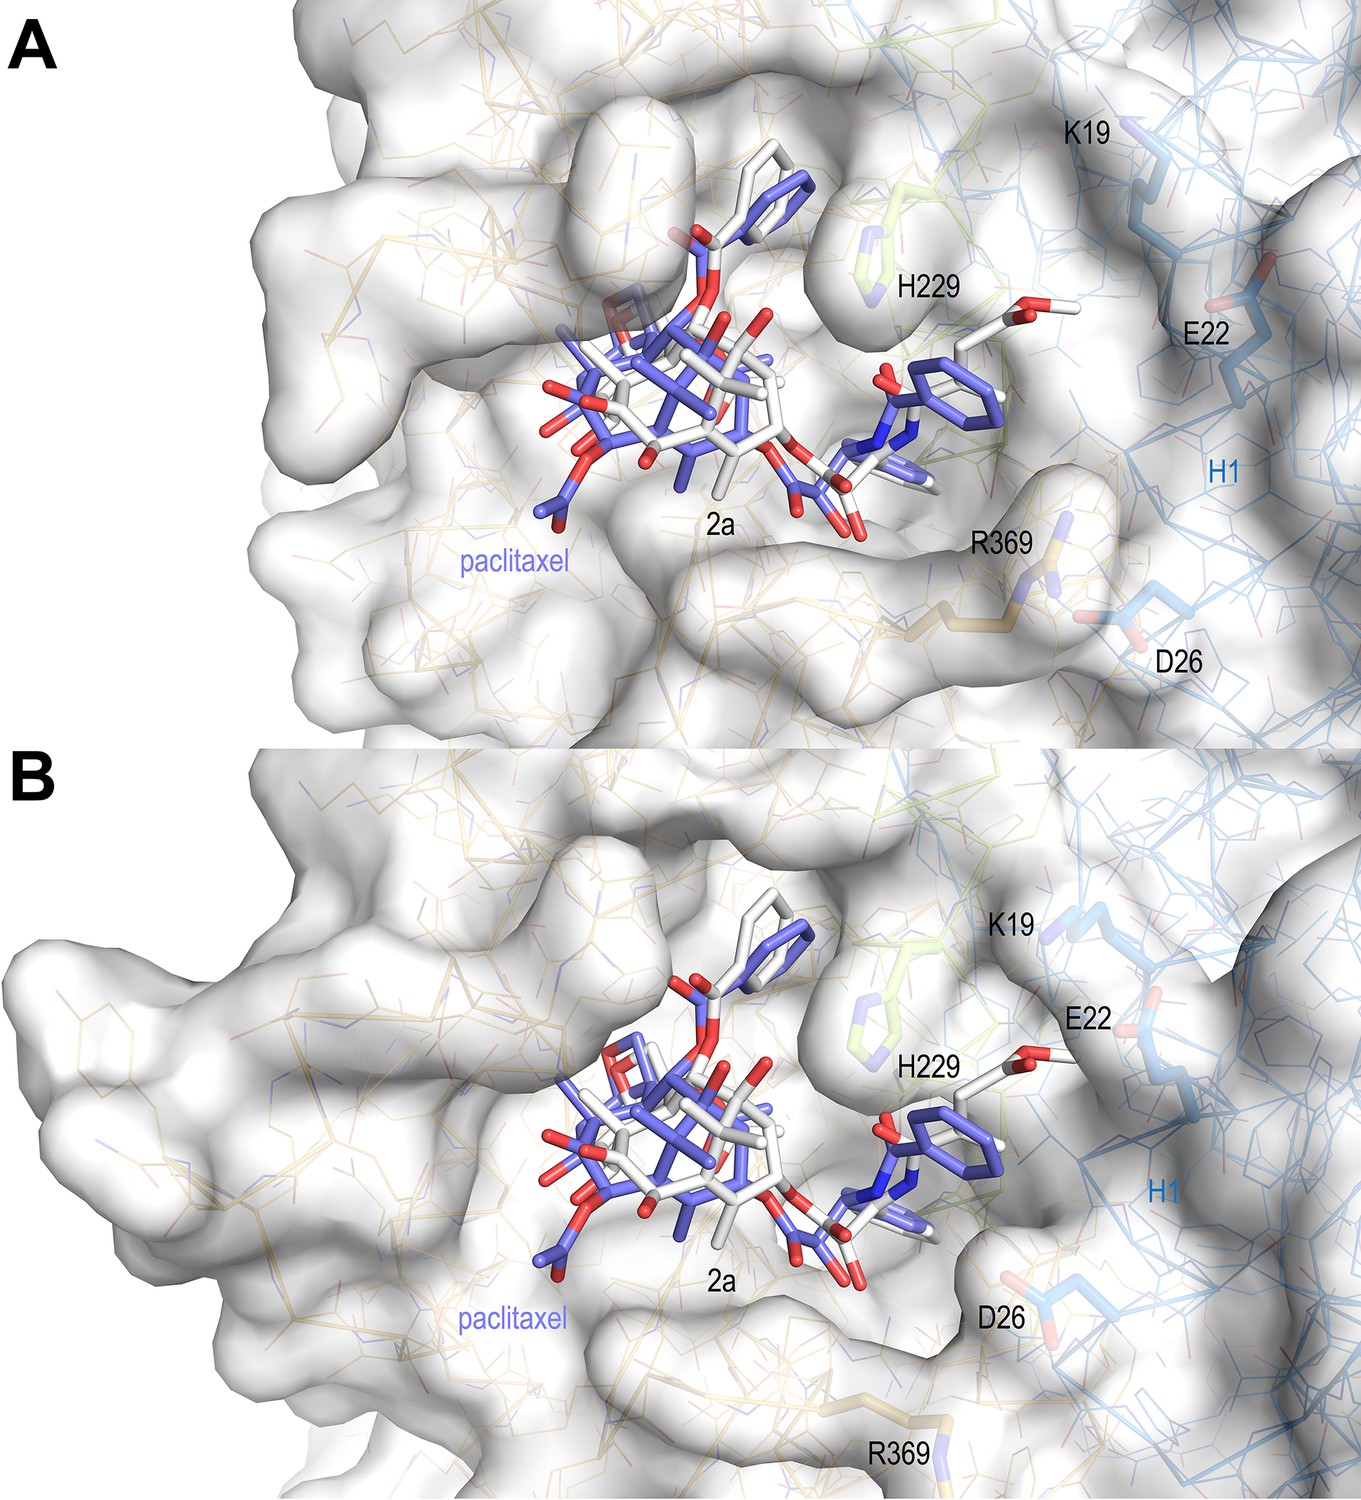
Surface representations of liganded taxane sites in both the curved and straight tubulin conformational states.
(A) Curved tubulin; (B) straight tubulin. The structures of 2a (white) and paclitaxel (slate) bound to microtubules (PDB ID 6WVR) were superimposed onto their central helices βH7. The side chains of the βM loop residue βR278 and of residues surrounding the C13 side chains of the ligands are in stick representation and are labeled. Helix βH1 is highlighted in ribbon representation.
Scheme 1

Reagents and conditions.
(a) TESCl, triethylamine (TEA), 4-dimethylaminopyridine (DMAP), LiBr, THF, RT to 70°C, 84%; (b) LHMDS, THF, –45°C, 79%; (c) 10% Pd/C, H2, MeOH, 64%; (d) DCC, DMAP, acid, DCM, 0°C to RT; (e) HF, Py, CH3CN or 5% HCl/MeOH, 32% for 2a, 40% for 2b, 48% for 2c, and 83% for 2e for two steps (d, e); (f) PPh3, CS2, THF, 83%.
Videos
Video 1
Conformational transition from apo to baccatin III-bound, unassembled tubulin state.
Top view on β-tubulin (onto the ‘plus end’ in the context of a microtubule).
Video 2
Conformational transition from apo to baccatin III-bound, unassembled tubulin state.
Luminal view on β-tubulin (view from the lumen in the context of a microtubule).
Video 3
Conformational transition from apo to 2a-bound, unassembled tubulin state.
Top view on β-tubulin (onto the ‘plus end’ in the context of a microtubule).
Video 4
Conformational transition from apo to 2a-bound, unassembled tubulin state.
Luminal view on β-tubulin (view from the lumen in the context of a microtubule).
Animation 1
Molecular dynamics (MD) movie of the apo tubulin dimer showing the occupancy of the taxane site by the βM loop.
1 µs simulation, 1 snapshot every 5 ns, βM loop in yellow.
Animation 2
Simulation of ligand exit and entry using targeted molecular dynamics (MD) for baccatin III unbinding from and binding to αβ-tubulin.
Animation 3
Simulation of ligand exit and entry using targeted molecular dynamics (MD) for paclitaxel unbinding from and binding to αβ-tubulin.
Tables
Table 1
X-ray data collection and refinement statistics.
| T2R-TTL-BacIII | T2R-TTL-2a | T2R-TTL-2b | |
|---|---|---|---|
| Data collection | |||
| Space group | P212121 | P212121 | P212121 |
| Cell dimensions | |||
| a, b, c (Å) | 104.1, 157.2, 179.2 | 104.8, 157.9, 179.1 | 105.3, 158.6, 179.2 |
| Resolution (Å) | 49.2–1.9 (1.95–1.90) | 49.3–1.95 (2.00–1.95) | 49.4–2.35 (2.41–2.35) |
| Rmerge(%) | 10.7 (491.9) | 13.3 (516.6) | 17.4 (403.5) |
| Rmeas (%) | 11.1 (513.1) | 13.6 (526.1) | 17.7 (410.8) |
| Rpim (%) | 3.3 (147.5) | 2.9 (102.9) | 2.6 (57.7) |
| I/σI | 16.5 (0.5) | 20.1 (0.7) | 20.1 (0.9) |
| CC half | 100 (17.8) | 100 (31.4) | 99.9 (46.6) |
| Completeness (%) | 100 (99.8) | 100 (100) | 100 (100) |
| Redundancy | 13.5 (12.4) | 27.3 (27.8) | 28.5 (28.3) |
| Refinement | |||
| Resolution (Å) | 49.2–1.9 | 49.3–1.95 | 49.4–2.35 |
| No. unique reflections | 229654 | 215774 | 125168 |
| Rwork/Rfree | 19.2/21.8 | 18.9/21.6 | 18.3/21.4 |
| No. atoms | |||
| Protein | 17555 | 17389 | 17227 |
| Ligand | 42 | 120 | |
| Water | 861 | 883 | 166 |
| Average B-factors (Å2) | |||
| Protein | 59.0 | 62.9 | 76.1 |
| Ligand (chain B/D) | n.a. / 109.2 | 111.4/102.8 | 146.6/144.9 |
| Water | 56.2 | 60.3 | 59.4 |
| Wilson B-factor | 41.7 | 43.1 | 56.9 |
| R.m.s. deviations | |||
| Bond lengths (Å) | 0.003 | 0.003 | 0.002 |
| Bond angles (°) | 0.642 | 0.655 | 0.550 |
| Ramachandran statistics | |||
| Favored regions (%) | 98.1 | 98.1 | 98.0 |
| Allowed regions (%) | 1.8 | 1.8 | 2.0 |
| Outliers (%) | 0.1 | 0.1 | 0 |
-
For each structure, data were collected from a single crystal. Values in parentheses are for highest-resolution shell.
Table 2
Structural parameters of microtubules assembled in the presence of different nucleotides and drugs*.
| Paclitaxel-pre microtubules | Paclitaxel- post microtubules | Paclitaxel- GDP tubulin | GDP-microtubules | GMPCPP-microtubules | Docetaxel-microtubules | Baccatin III-microtubules | 2a-microtubules | 2b-microtubules | |
|---|---|---|---|---|---|---|---|---|---|
| Microtubule radius (nm) | 10.97±0.10 | 11.04±0.51 | 10.98±0.47 | 11.42±0.10 | 11.63±0.10 | 11.53±0.10 | 11.06±0.35 | 11.27±0.57 | 11.60±0.36 |
| Avg. PF number | 12.21±0.10 | 12.28±0.71 | 12.23±0.65 | 12.91±0.10 | 13.29±0.10 | 12.90±0.10 | 12.29±0.39 | 12.63±0.72 | 12.99±0.40 |
| Inter-PF distances (nm) | 5.58±0.01 | 5.59±0.33 | 5.57±0.29 | 5.50±0.03 | 5.45±0.03 | 5.57±0.01 | 5.61±0.18 | 5.55±0.31 | 5.56±0.17 |
| Avg. monomer length (nm) | 4.18±0.01 | 4.18±0.01 | 4.18±0.01 | 4.06±0.01 | 4.18±0.010 | 4.18±0.01 | 4.16±0.03 | 4.15±0.03 | 4.13±0.03 |
| 1 nm band peak position (nm–1) | 6.02±0.01 | 6.02±0.01 | 6.02±0.01 | 6.19±0.01 | 6.02±0.01 | 6.02±0.01 | 6.04±0.5 | 6.06±0.05 | 6.08±0.05 |
| 8 nm band | Yes | Yes | Yes | No | Yes | Yes | Yes | Yes | Yes |
-
*
Errors are SE of three independent.
Additional files
Download links
A two-part list of links to download the article, or parts of the article, in various formats.
Downloads (link to download the article as PDF)
Open citations (links to open the citations from this article in various online reference manager services)
Cite this article (links to download the citations from this article in formats compatible with various reference manager tools)
Structural insight into the stabilization of microtubules by taxanes
eLife 12:e84791.
https://doi.org/10.7554/eLife.84791


