An optimal regulation of fluxes dictates microbial growth in and out of steady state
- Department of Biology, Stanford University, United States
Figures
Figure 1 with 4 supplements
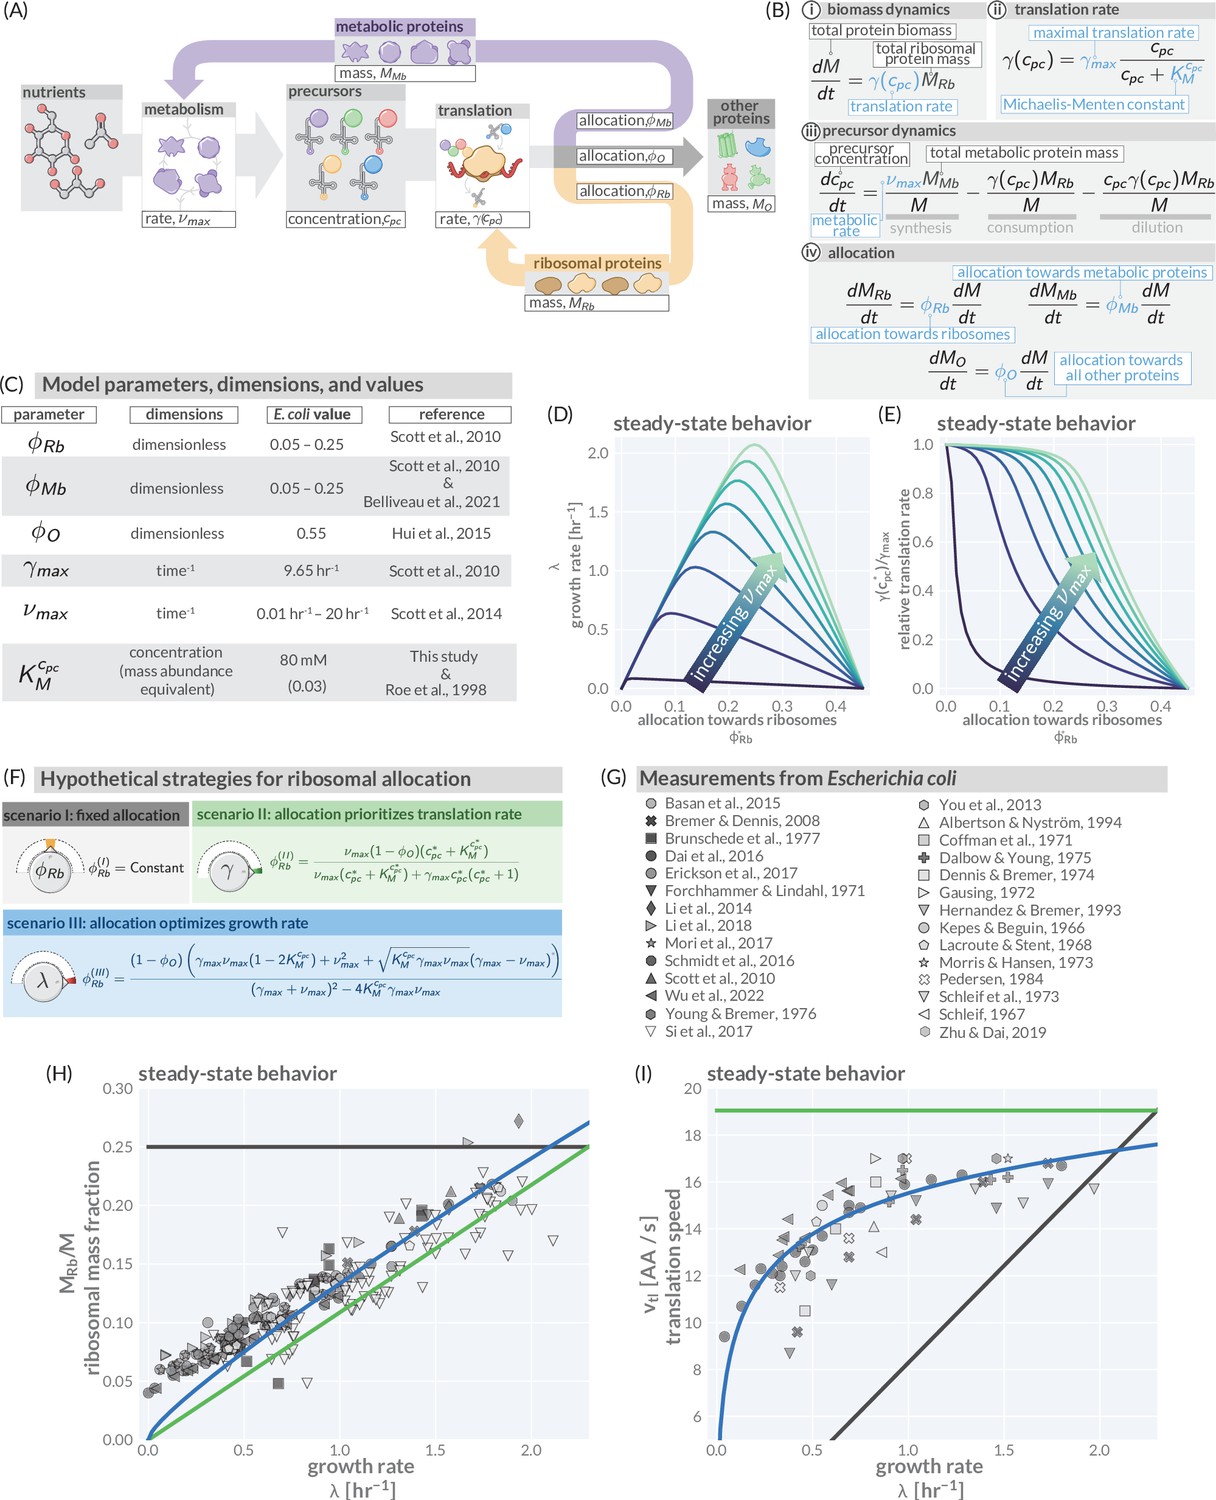
A simple model of ribosomal allocation and hypothetical regulatory strategies.
(A) The flow of mass through the self-replicating system. Biomolecules and biosynthetic processes are shown as gray and white boxes, respectively. Nutrients in the environment passed through cellular metabolism to produce ‘precursor’ molecules which are then consumed through the process of translation to produce new protein biomass, either as metabolic proteins (purple arrow), ribosomal proteins (gold arrow), or ‘other’ proteins (gray arrow). (B) Annotated equations of the model with key parameters highlighted in blue. An interactive figure where these equations can be numerically integrated is provided on paper website (cremerlab.github.io/flux_parity). (C) Key model parameters, their units, typical values in E. coli, and their appropriate references. This is also provided as Supplementary file 1. The steady-state values of (D) the growth rate and (E) the relative translation rate , are plotted as functions of the allocation towards ribosomes for different metabolic rates (colored lines). (F) Analytical solutions for candidate scenarios for regulation of ribosomal allocation with fixed allocation, allocation to prioritize translation rate, and allocation to optimal growth rate highlighted in gray, green, and blue respectively. (G) A list of collated data sets of E. coli ribosomal allocation and translation speed measurements spanning 55 years of research. Details regarding these sources and method of data collation is provided in Supplementary file 2. A comparison of the observations with predicted growth-rate dependence of ribosomal allocation (H) and translation speeds (I) for the three allocation strategies. An interactive version of the panels allowing the free adjustment of parameters is available on the associated paper website (cremerlab.github.io/flux_parity).
-
Figure 1—source data 1
Collated measurements of ribosomal mass fractions in E. coli.
- https://cdn.elifesciences.org/articles/84878/elife-84878-fig1-data1-v2.csv
-
Figure 1—source data 2
Collated measurements of translation speeds per ribosome in E. coli.
- https://cdn.elifesciences.org/articles/84878/elife-84878-fig1-data2-v2.csv
Figure 1—figure supplement 1
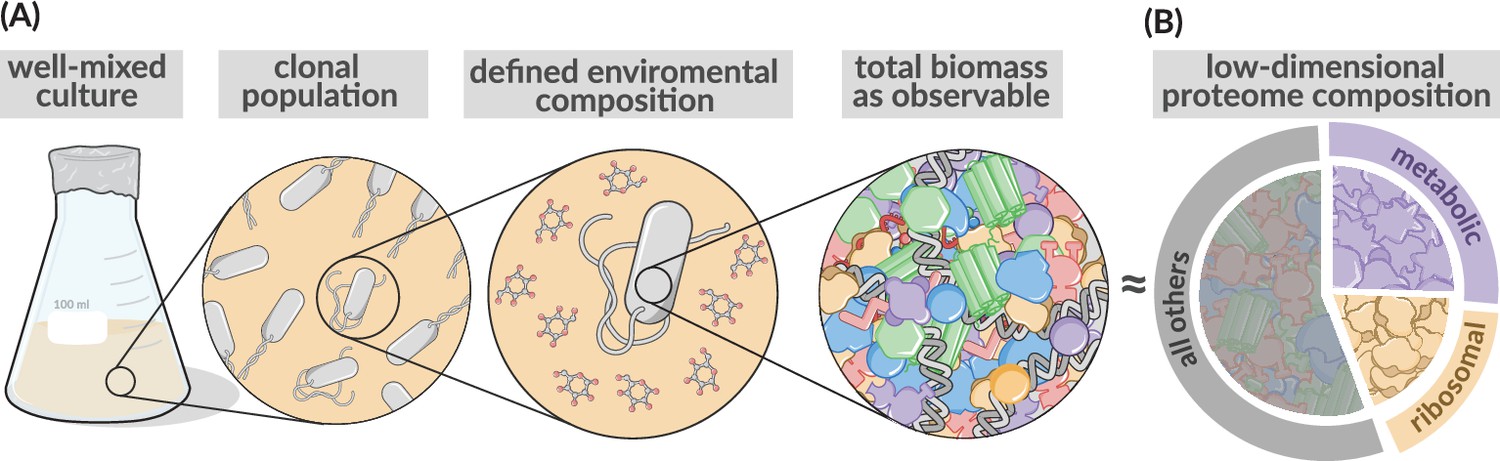
Coarse-grained description of biomass and the proteome.
Low-dimensional allocation models consider in their simplest form growth of a clonal population within a well-mixed environment. Biomass is described in a highly simplified manner focusing in the simplest case on protein synthesis alone (Molenaar et al., 2009, Scott et al., 2014), with different protein species jointly considered by a few different protein classes. Here, metabolic proteins (purple), ribosomal proteins (gold), or ‘other’ proteins (gray). Sectors areas are displayed as being approximately equivalent to those found in rapidly growing E. coli.
Figure 1—figure supplement 2
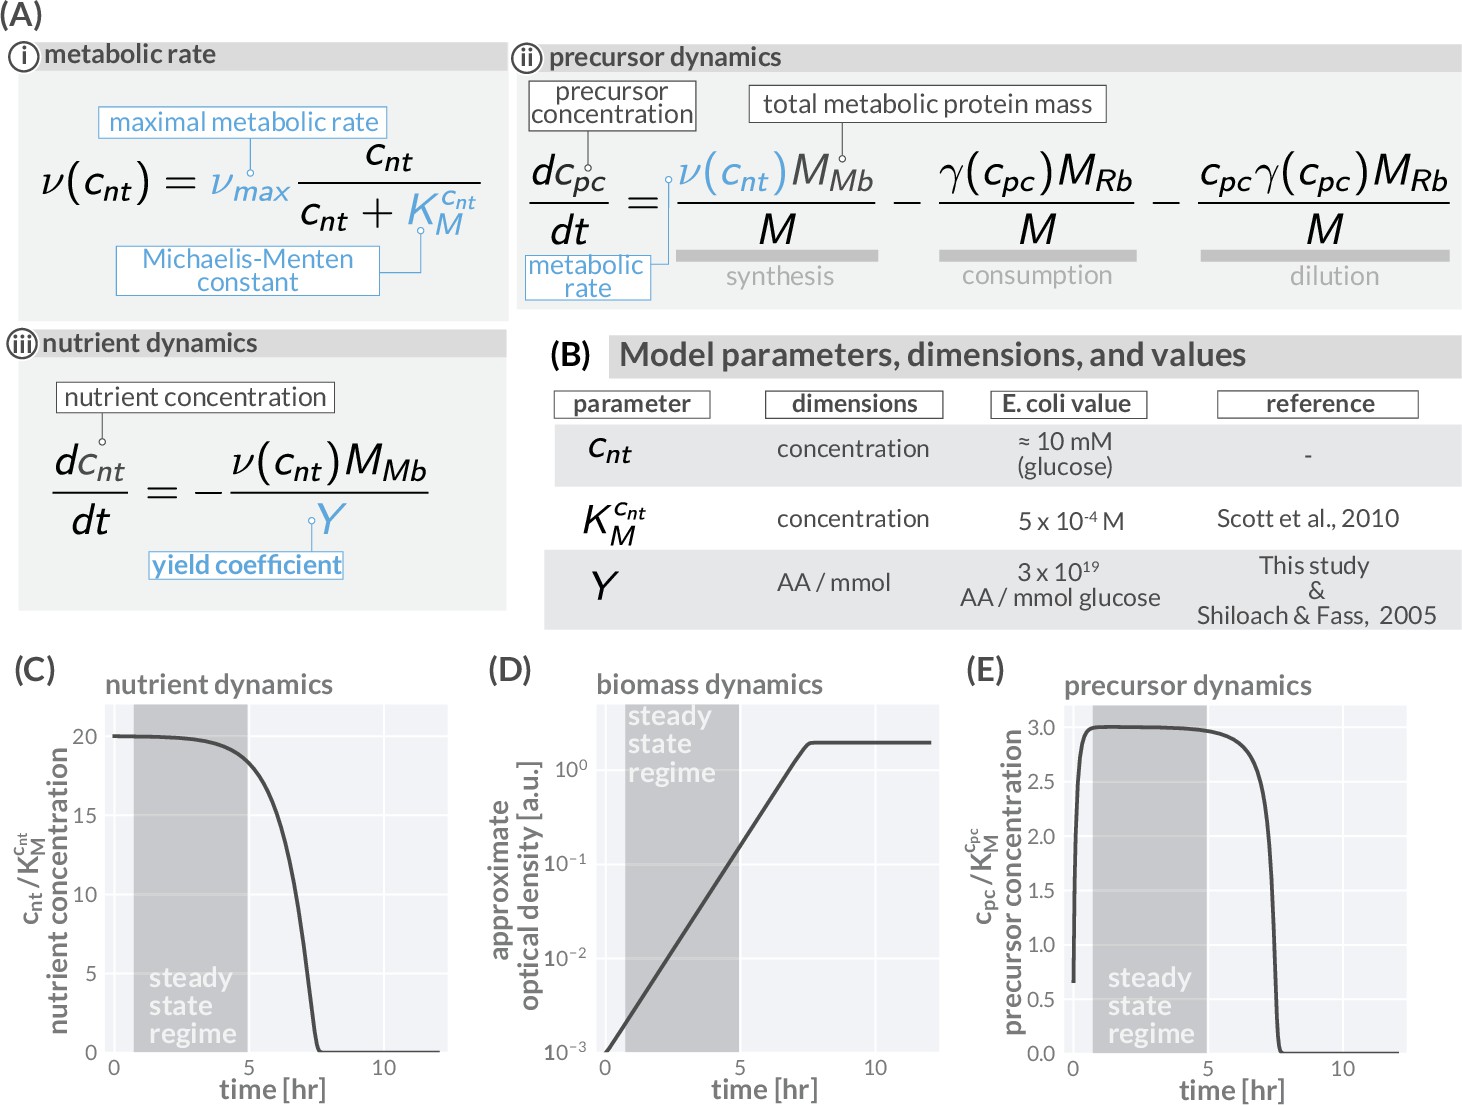
Precursor synthesis and growth when nutrients are not saturating.
In general, the environmental conditions microbes encounter changes rapidly and nutrient availability commonly limits growth. Growing batch cultures, for example, run out of nutrients eventually and growth stops. The allocation modeling framework can account such a dynamics by including metabolic rates which depend on the nutrient concentrations in the environment. In the simplest case, one nutrient source is considered (concentration ) with the metabolic rate depending on the concentration in a Michaelis–Menten manner with a maximal metabolic rate being reached only at high nutrient concentrations (Ai). The dynamics of precursors is given by a balance of synthesis, consumption, and dilution (Aii), replacing the corresponding equation of the simple model in (Figure 1Biv). The modeling of growth further requires the explicit modeling of nutrient concentrations. This dynamics depends on the specifics of the environment and, depending on the environment, can become very complex with multiple sources and sinks affecting the nutrient concentration. Here, we consider a typical batch culture scenario in which cells grow under well-mixed conditions. Nutrients are provided only initially and nutrient concentrations are falling because of consumption (Aiii). (B) Model parameters, dimensions, values, and relevant reference for including nutrient dynamics. (C–E) Resulting temporal variation of nutrient concentrations (C), biomass accumulation (D), and precursor concentration (E) when integrating the model equations and using a parameter set descriptive of E. coli growing in a glucose-minimal medium with a growth rate ≈1 hr-1 and a starting glucose concentration of 10 mM. As experimentally observed, initially abundant nutrients are consumed and biomass accumulates (exponential phase) until nutrients are exhausted and growth stops (saturation phase) (C, D). Importantly, precursor concentrations (E) quickly reach a constant plateau which lasts until nutrients become scarce ( and ). During this transient period (shaded regions), the synthesis of precursors matches the consumption by protein synthesis and dilution, meaning . Given a constant precursor concentration , the translation rate is also constant. As a consequence, the protein pool approaches a steady composition dictated by the allocation parameters (, and ). With precursor concentrations and protein composition remaining constant, the system is in a steady state and biomass accumulates exponentially over time, . This is the steady-state regime we focus on in the main text. Note that the steady state growth regime readily emerges when we consider dilution (see Appendix 1 - Precursor concentrations and the importance of dilution by cell growth). Model parameters are provided in Supplementary file 1. Biomass units are converted to optical density assuming at , there are 109 cells per ml and 109 amino acids per cell. An interactive version of these dynamics can be found on the paper website (cremerlab.github.io/flux_parity).
Figure 1—figure supplement 3
Modeling predictions of steady growth behavior.
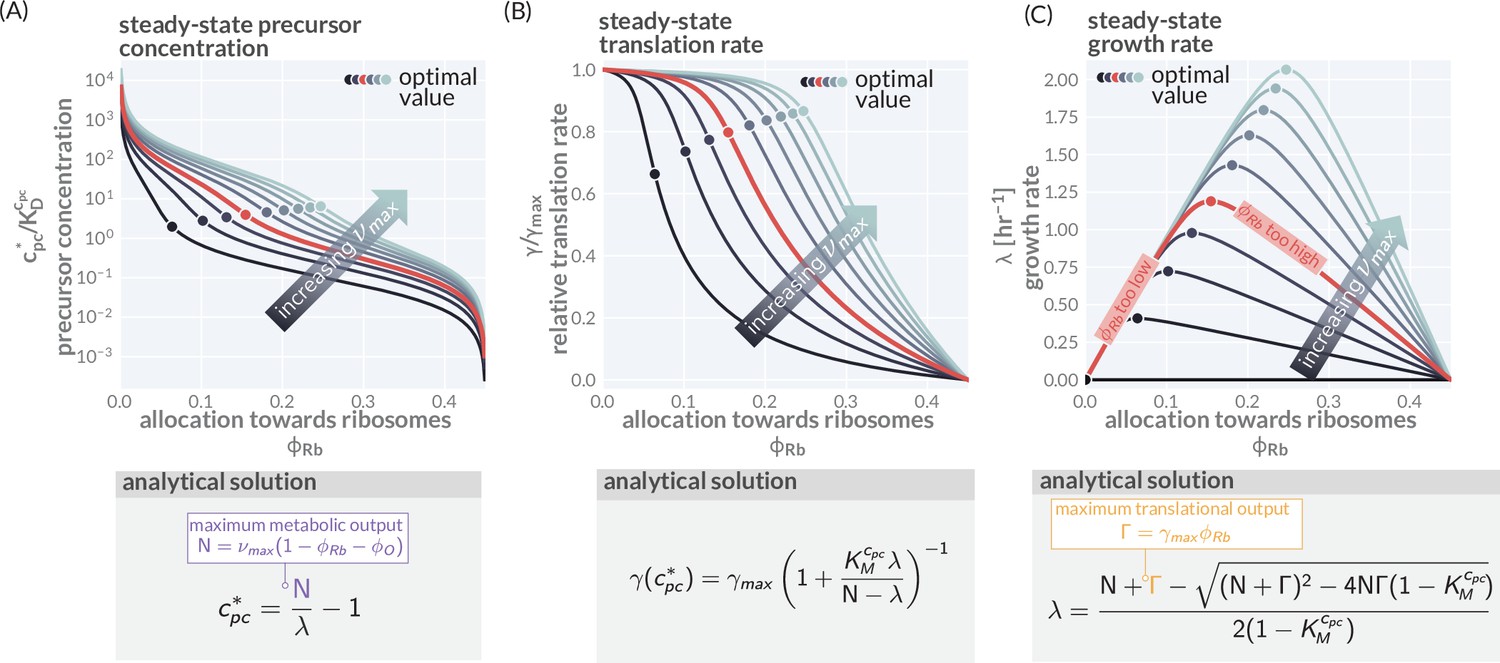
(A) Variation of the precursor concentration with varying allocation parameters () and maximal metabolic rate (). (B, C) Corresponding trends of translation and growth rate as also shown in Figure 1C and D. Corresponding boxes show the analytical expression describing the steady-state precursor concentration, translation speed, and growth rate with details of the derivation provided in 'Methods.' Model parameters used are provided in Supplementary file 1. Colors indicate different metabolic rates = 0.2–12.5 hr-1.
Figure 1—figure supplement 4
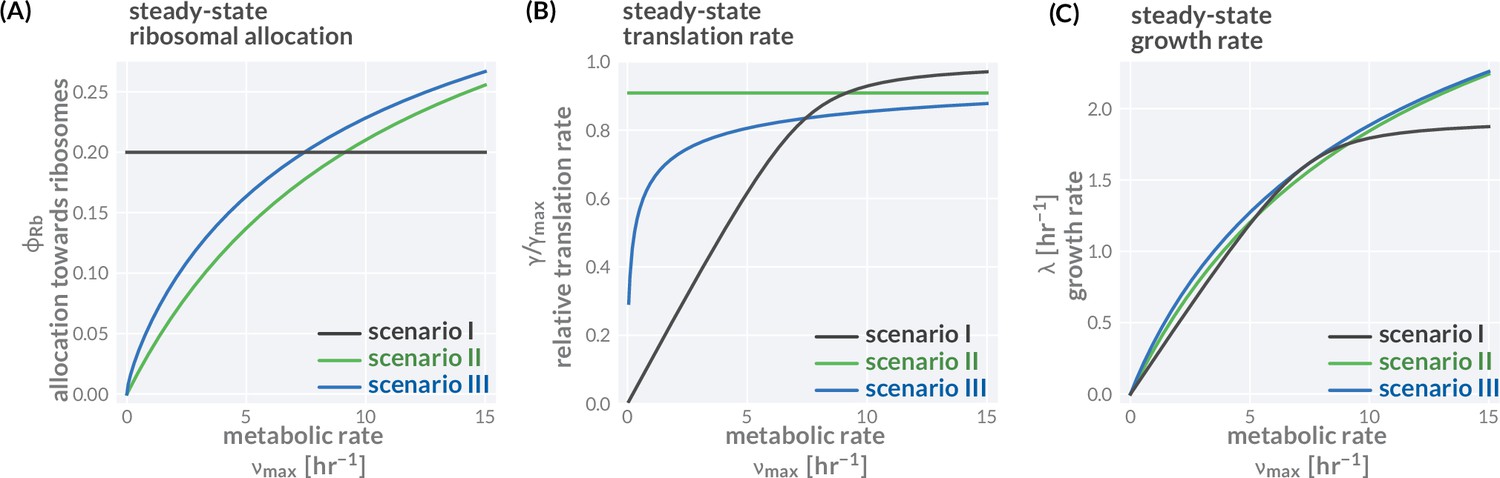
Three different allocation scenarios.
The variation of precursor concentration (A), translation rate (B), and growth rate (C) with changing metabolic rate is shown for the three allocation scenarios introduced in the main text; fixed allocation (scenario I, black lines), prioritizing fast translation (scenario II, green lines), and growth-optimal allocation (scenario III, blue lines). Plotted are the analytical solutions provided in Figure 1F and derived in 'Methods.' The resulting relations between growth rate and translation as well as growth rate and ribosome content are shown in Figure 1H andI. We here discuss the consequence of these allocation scenarios in more detail. Scenario I—fixed allocation: In this scenario, allocation is fixed and does not vary with conditions. Locking in the ribosome allocation to (A, black line), for example, carries strong consequences for translation and growth rates (B and C, black lines). When conditions are poor ( is small), the translation rate is significantly lower than the maximal rate as there are too many ribosomes competing for a small pool of precursors (B). The translation and growth rates increase with the metabolic rate until the influx of precursors is sufficiently high such that all ribosomes are translating close to their maximum and growth rate is at its optimal value. Further increasing the metabolic rate does not increase the growth rate (plateau of black curve in B) as all ribosomes are already translating close to their maximum rate. Scenario II—prioritizing fast translation: In this scenario, allocation is adjusted such that translation rates are maintained at a high value. This is achieved by tuning the allocation between ribosomes and metabolic proteins such that a constant precursor concentration is maintained. For example, at higher metabolic rates, the metabolic proteins can sustain a higher influx of precursors allowing a larger allocation towards ribosomal proteins (green lines). Scenario III—optimizing growth: In this scenario, allocation is tuned to optimize growth rate across conditions, meaning that the fastest growth rate is achieved given a set metabolic rate and other model parameters. For example, the allocation towards ribosomes is adjusted with the metabolic rate such that the growth rate rests at the peak of the curves shown in Figure 1D (blue lines). Accordingly, the growth rate continues to increase with higher metabolic rates always exceeding the growth rate of scenarios I and II (C, green line). Model parameters follow the reference set for E. coli (Supplementary file 1). Black lines correspond to a constant allocation and green lines correspond to a constant precursor concentration , yielding a constant translation rate of . An interactive version of these figure panels is available on the paper website (cremerlab.github.io/flux_parity).
Figure 2 with 1 supplement
The regulation of ribosome allocation via a flux-sensing mechanism.
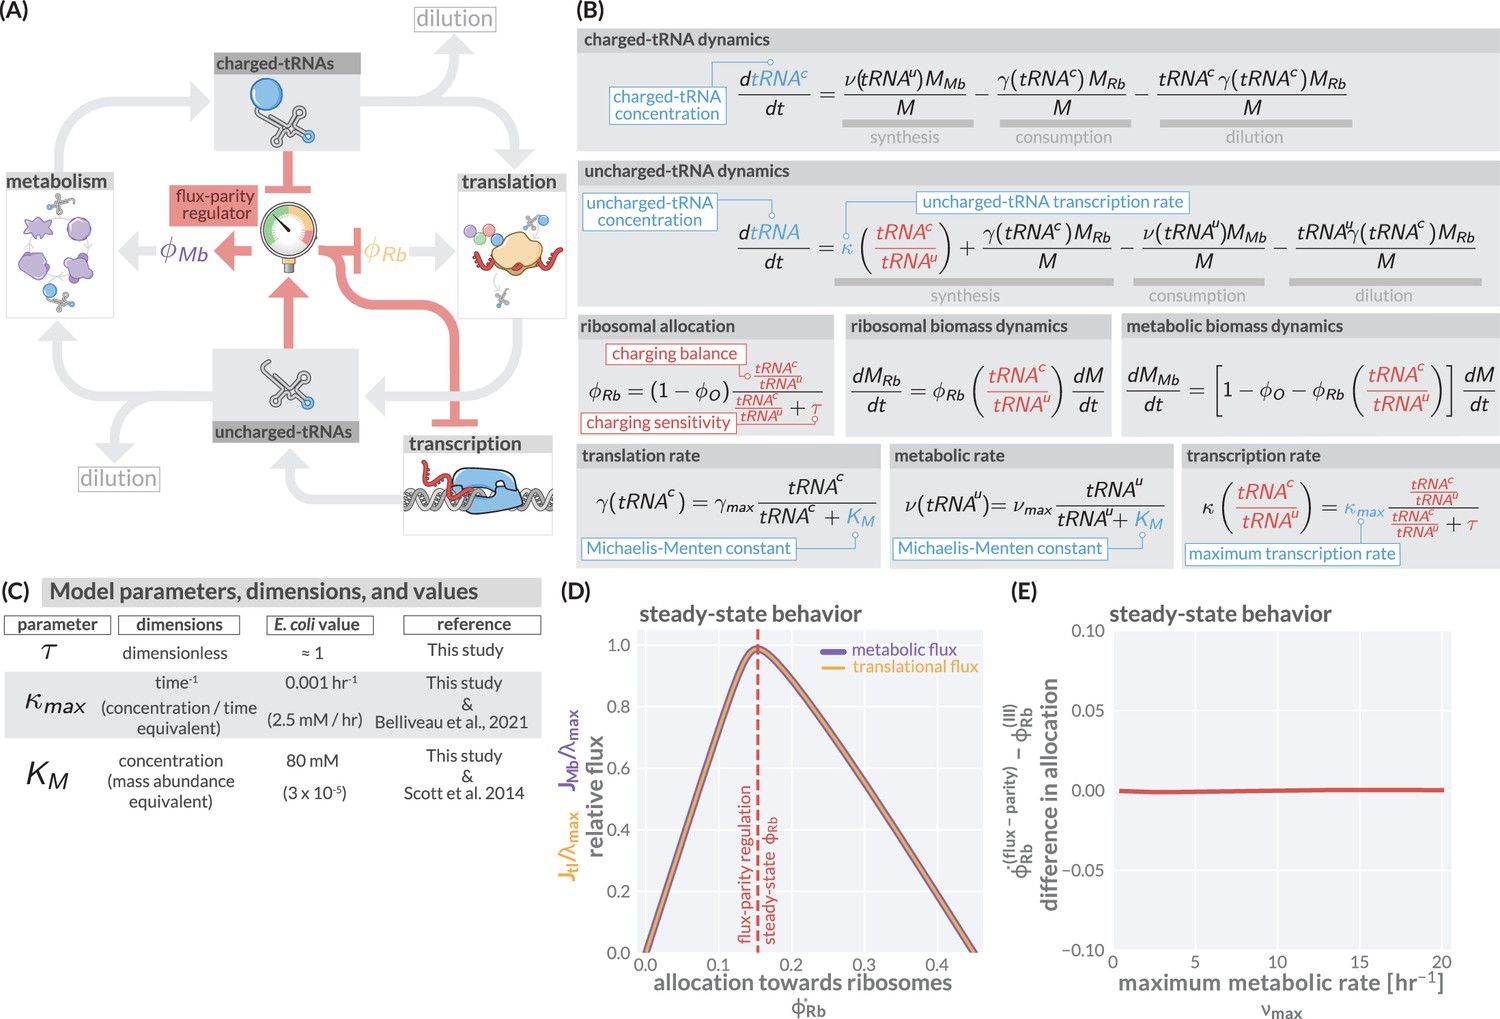
(A) A circuit diagram of interactions between metabolic and translational fluxes with flux-parity regulatory connections highlighted in red. The fluxes are connected via a positive feedback loop through the generation of mutual starting materials (uncharged- or charged-tRNAs, respectively). The rates of each flux exhibit semi-autoregulatory behavior in that flux through each process reduces the standing pool of tRNAs. (B) The governing dynamics of the flux-parity regulatory circuit with key parameters highlighted in blue and flux-parity regulatory components highlighted in red. (C) Parameters, dimensions, values, and references for each component of the flux-parity regulatory circuit. (D) The steady-state meabolic (purple) and translational (gold) fluxes plotted as a function of the ribosomal allocation under the simple allocation model. Vertical red line indicates the steady-state solution of the flux-parity model under physiological parameter regimes. (E) The difference in allocation towards ribosomes in steady state between the flux-parity model and optimal allocation () plotted as a function of the maximal metabolic rate, .
Figure 2—figure supplement 1
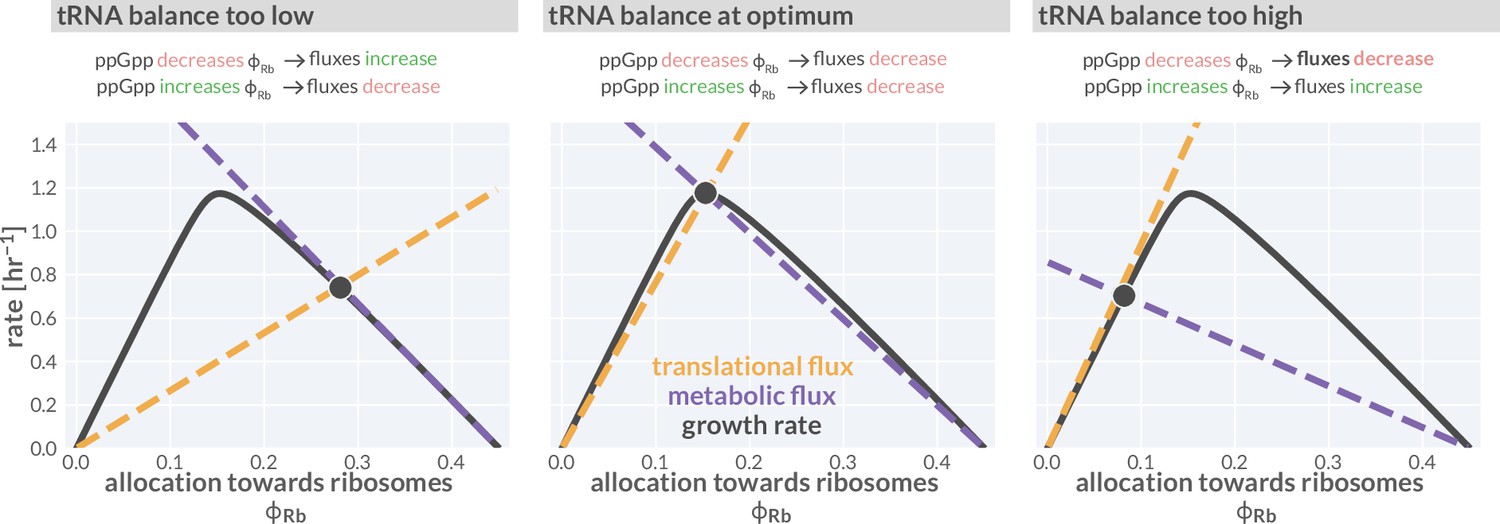
Flux-parity directs allocation parameters towards an optimum.
Black lines represent the steady-state growth rate as a function of the allocation towards ribosomes . Dashed gold and purple lines correspond to the translational and metabolic fluxes, with their intersection indicating the steady state. The different panels consider from left to right three scenarios with a too low, optimal, and too high allocation towards ribosomes. An interactive version of this figure is available on the paper website (cremerlab.github.io/flux_parity).
Figure 3 with 1 supplement

The predictive power of flux-parity regulation in steady state.
Measurements of the (A) ribosomal allocation and the (B) translation rate are plotted alongside the steady-state behavior of the flux-parity regulatory circuit (red dashed line) and the optimal behavior of scenario III (solid blue line). Points and markers are the same as those shown in Figure 1G. (C) Measurements of intracellular ppGpp concentrations relative to a reference condition ( hr-1) are plotted as a function of growth rate alongside the prediction emergent from the flux-parity regulatory circuit (red dashed line). (D–F) Inhibition of ribosome activity via antibiotic modeled repression of translational flux. Plots show comparison with data for different media (red shades) with the flux-parity model predictions (dashed lines). (G–I) Inhibition of metabolic and translational fluxes through excess gene expression. (H) shows data where β-galactosidase is expressed at different levels. Different shades of red correspond to different growth media. Right-hand panel shows collapse of the growth rates of overexpression of β-galactosidase (squares), β-lactamase (inverted triangles), and EF-Tu (diamonds) relative to the wild-type growth rate in different media conditions. The same set of model parameters listed in Supplementary file 2 has been used to generate the predictions.
-
Figure 3—source data 1
Collated measurements of relative ppGpp concentrations.
- https://cdn.elifesciences.org/articles/84878/elife-84878-fig3-data1-v2.csv
-
Figure 3—source data 2
Collated measurements of excess protein mass fractions.
- https://cdn.elifesciences.org/articles/84878/elife-84878-fig3-data2-v2.csv
Figure 3—figure supplement 1

Comparison of predictive capacity of flux-parity allocation between ppGpp scaling ansatzes.
Measurements are shown for ribosomal content, translation rate, and relative ppGpp concentration from left to right, respectively. Markers are the same as those in Figure 3 of the main text. Solid blue line shows predicted steady-state behavior assuming a simple ansatz of ribosome-tRNA binding probabilities (Equation 41). Dashed red line denotes predicted behavior using the ansatz that ppGpp concentration is dependent on the charging balance.
Figure 4
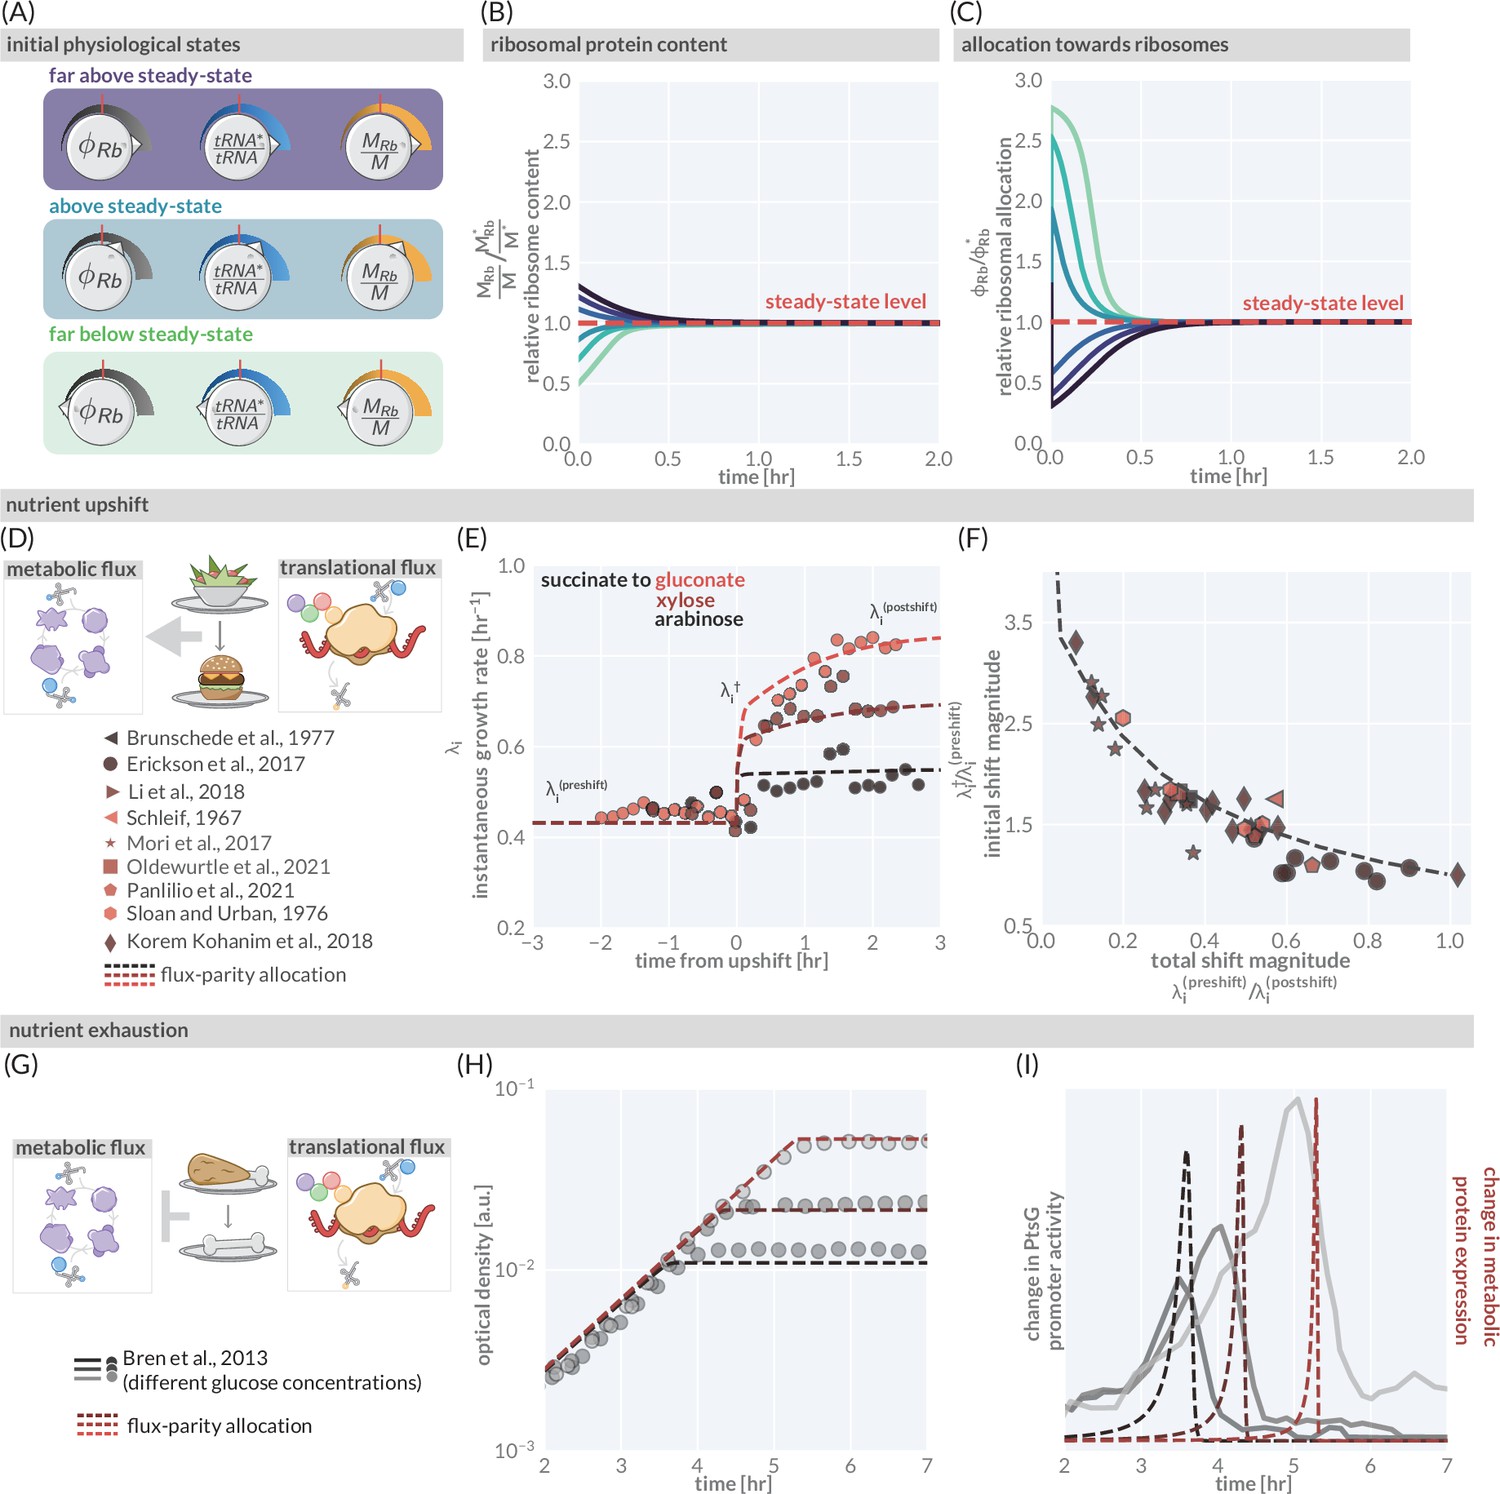
The predictive power of flux-parity regulation out of steady state.
(A) Hypothetical initial configurations of model parameters and variables before begining numerical integration. (B) The equilibration of the ribosomal protein content (). (C) Dynamic adjustment of the ribosomal allocation parameter in response to the new environment. Green and purple colored lines correspond to the initial conditions of the culture from well above to well below the steady-state values, respectively. Dashed red line indicates the steady-state solution. (D, E) Nutrient upshifts with increased metabolic flux. (E) The instantaneous growth rate for shifts from succinate to gluconate (bright red), xylose (dark red), or arabinose (black) (Erickson et al., 2017). (F) Collapse of instantaneous growth rate measurements immediately after the shift (relative to the preshift-growth rate) as a function of the total shift magnitude. (G–I) Exhaustion of nutrients in the environment yields a decrease in the metabolic flux, promoting expression of more metabolic proteins. (H) Growth curve measurements in media with different starting concentrations of glucose (0.22 mM, 0.44 mM, and 1.1 mM glucose from light to dark, respectively) overlaid with flux-parity predictions. (I) The change in total metabolic protein synthesis in the flux-parity model (dashed lines) overlaid with the change in expression of a fluorescent reporter from a PtsG promoter (solid lines).
-
Figure 4—source data 1
Collated measurements of relative nutrient upshift magnitudes.
- https://cdn.elifesciences.org/articles/84878/elife-84878-fig4-data1-v2.csv
Figure 5
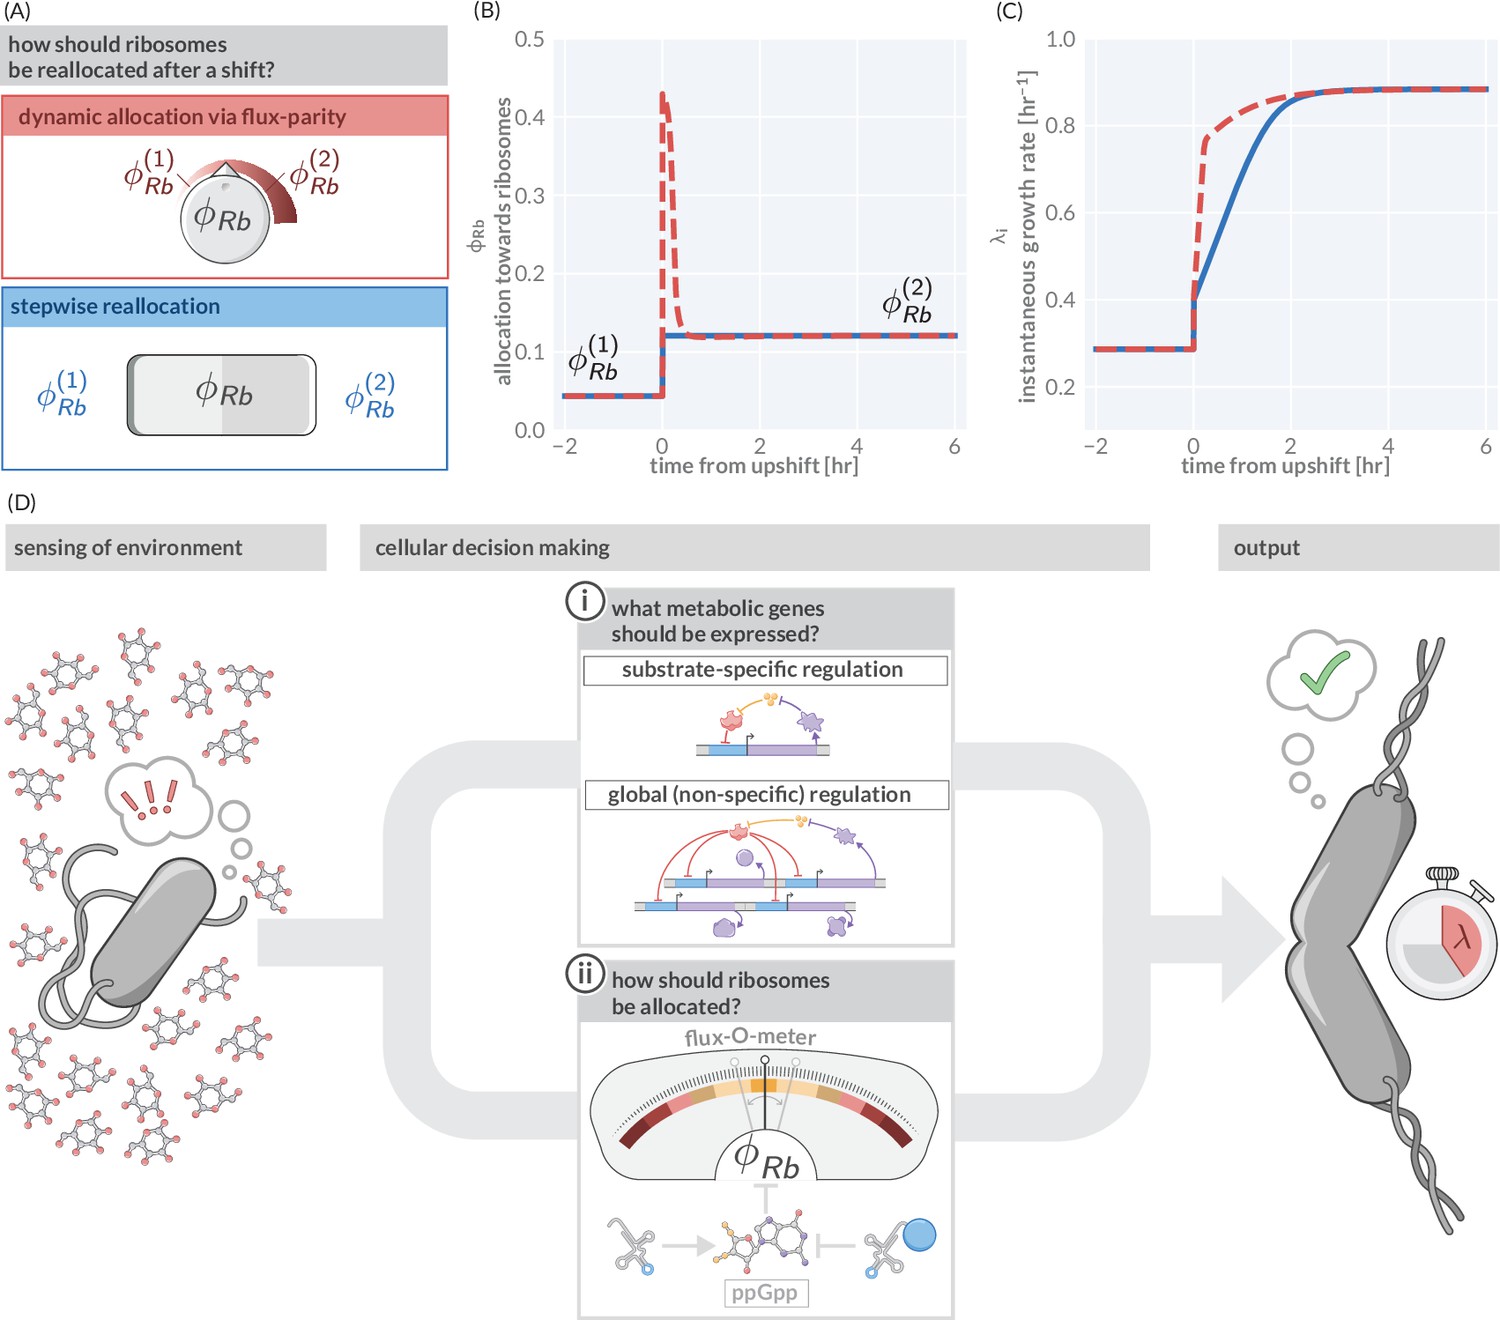
Flux-parity allocation as a strategy to adapt to fluctuating conditions.
(A) Ribosome reallocation strategies upon a nutrient upshift. After a nutrient upshift, cells either dynamically reallocate their ribosomes given flux-parity regulation (top, red) or they undergo stepwise reallocation from one steady-state value to the next (bottom, blue). (B) The allocation dynamics for both strategies in response to a nutrient upshift. (C) The instantaneous growth rate for both strategies over the course of the shift. Dashed red and solid blue lines correspond to model predictions for optimal allocation and flux-parity regulation, respectively. (D) Cellular decision making in fluctuating environments. Upon sensing features of the environment, cells undergo a two-component decision making protocol defining what metabolic genes should be expressed (top) and how the allocation towards ribosomes should be adjusted to maintain flux-parity. The combination of these processes yield an increase of biomass at a given characteristic growth rate.
Appendix 1—figure 1
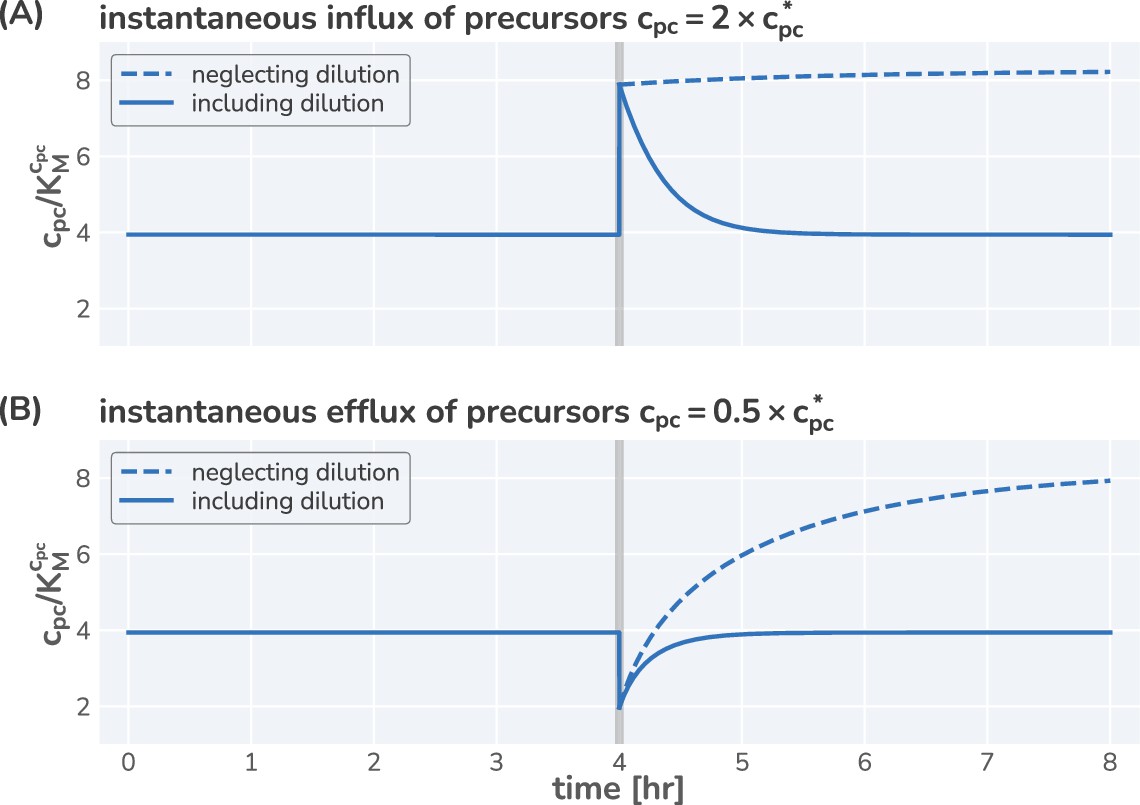
Neglecting effect of precursor dilution results in an unstable steady state.
Integrated dynamics of the model equations including (solid lines) and neglecting (dashed lines) the dilution of the precursors with increasing biomass. At time hr (gray vertical line), the precursor concentration is instantaneous increased (A) or decreased (B) by a factor of 2 and the system is allowed to respond. Neglecting the effect of dilution results in a monotonic increase in the precursor concentration, whereas including dilution allows a rapid return to the steady-state concentration.
Appendix 1—figure 2
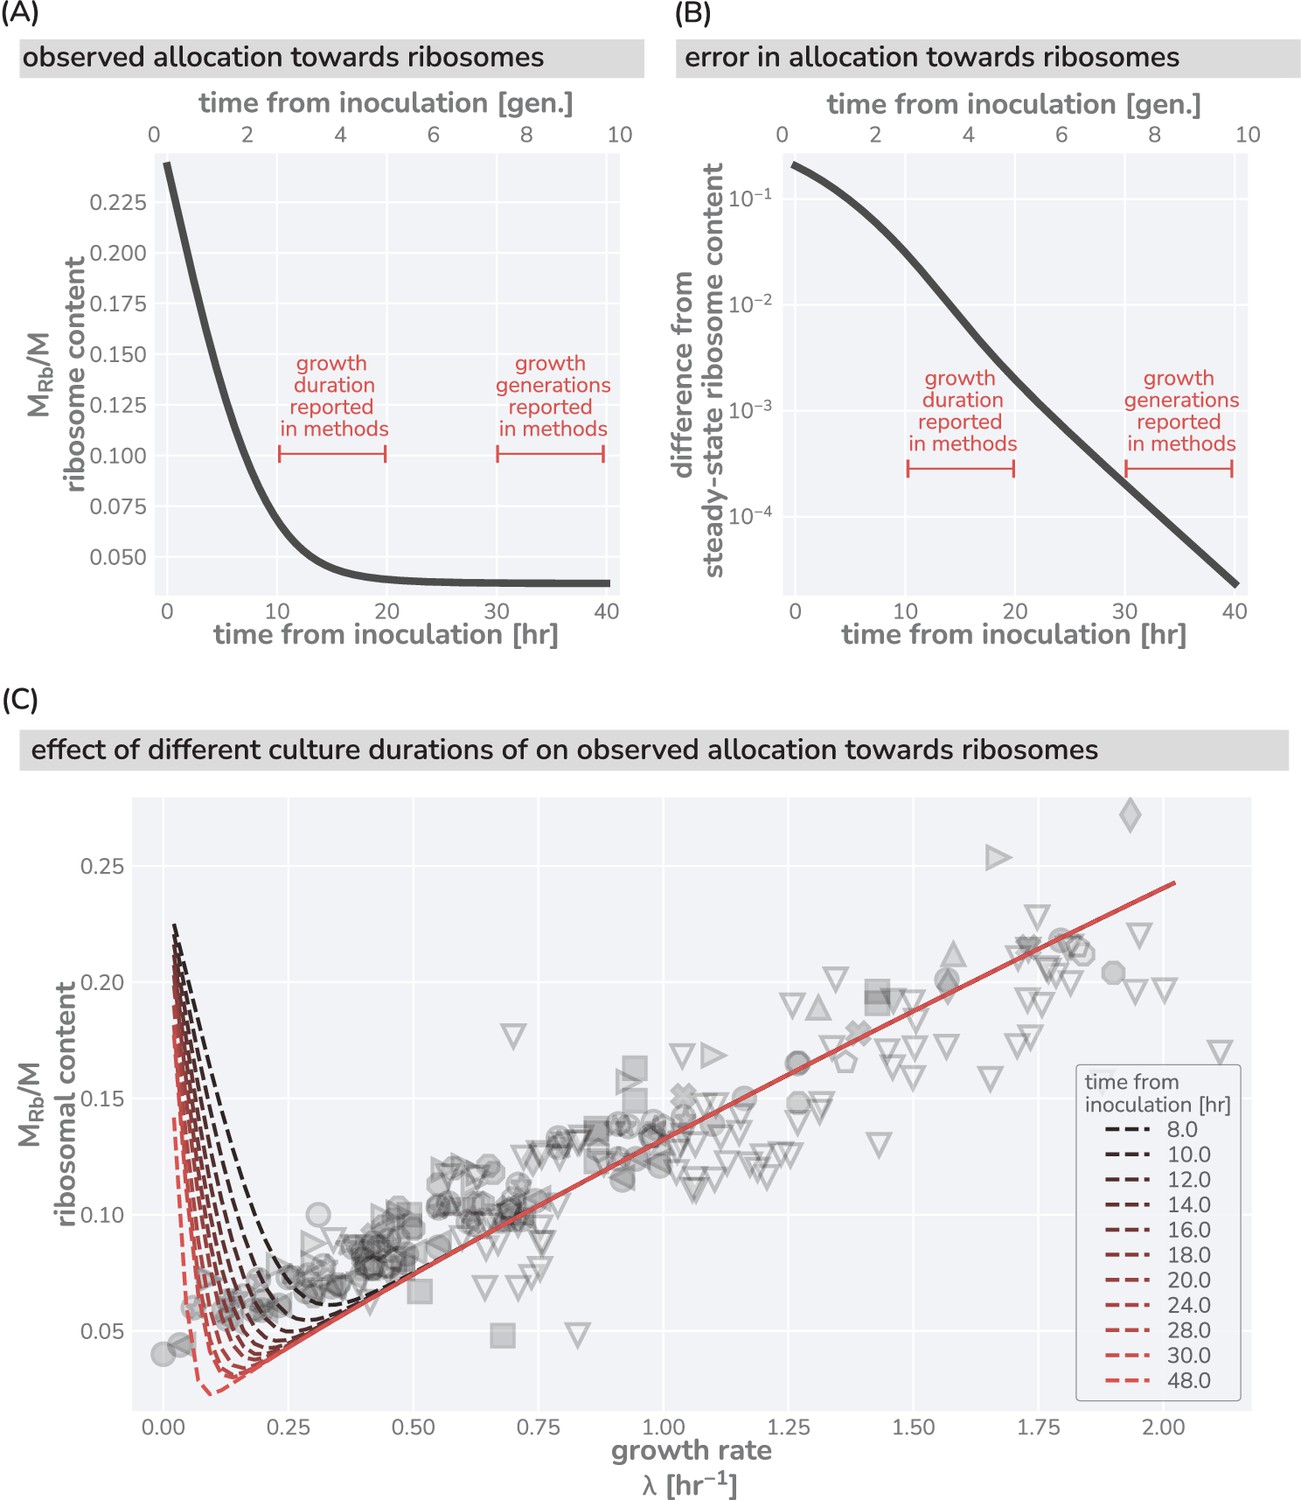
Effects of culturing time on observed ribosomal content at slow growth.
(A) Predicted dynamics of equilibration to steady-state from a seeding culture with high ribosome content (, hr-1, hr-1) into a poor growth medium with a low steady-state ribosome content (, hr-1, hr-1). (B) The difference between the measurable ribosomal content and the steady-state value in the poor growth medium. Red brackets in (A) and (B) correspond to claimed culturing duration commonly seen in the literature. Culturing time of ‘overnight’ is taken to approximately mean 12 hr. (C) The effect of insufficient culturing time on the measurable ribosome content. Red dashed lines show model predictions assuming a seeding culture with same parameters as in (A) and (B) into different media with a range of metabolic rates. Dark to light colors correspond to short (8 hr) and long (48 hr) culturing conditions, respectively. Data and markers are the same as those shown in Figure 1.
Appendix 1—figure 3
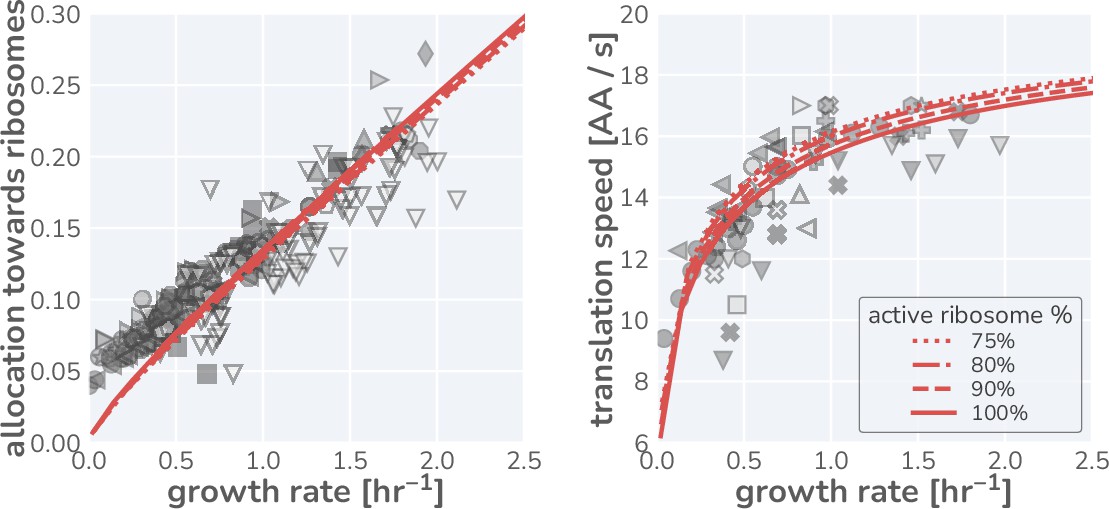
Influence of a growth rate independent inactive fraction of ribosomes on model predictions.
Data for the ribosomal mass fraction (left) and translation rate (right) observed in steady-state growth are shown using symbols as defined in Figure 1G. Red lines indicate the model predictions assuming an active ribosome fraction of 75% (dotted line), 80% (dashed-dotted line), 85% (dashed line), and 100% (solid line).
Appendix 1—figure 4
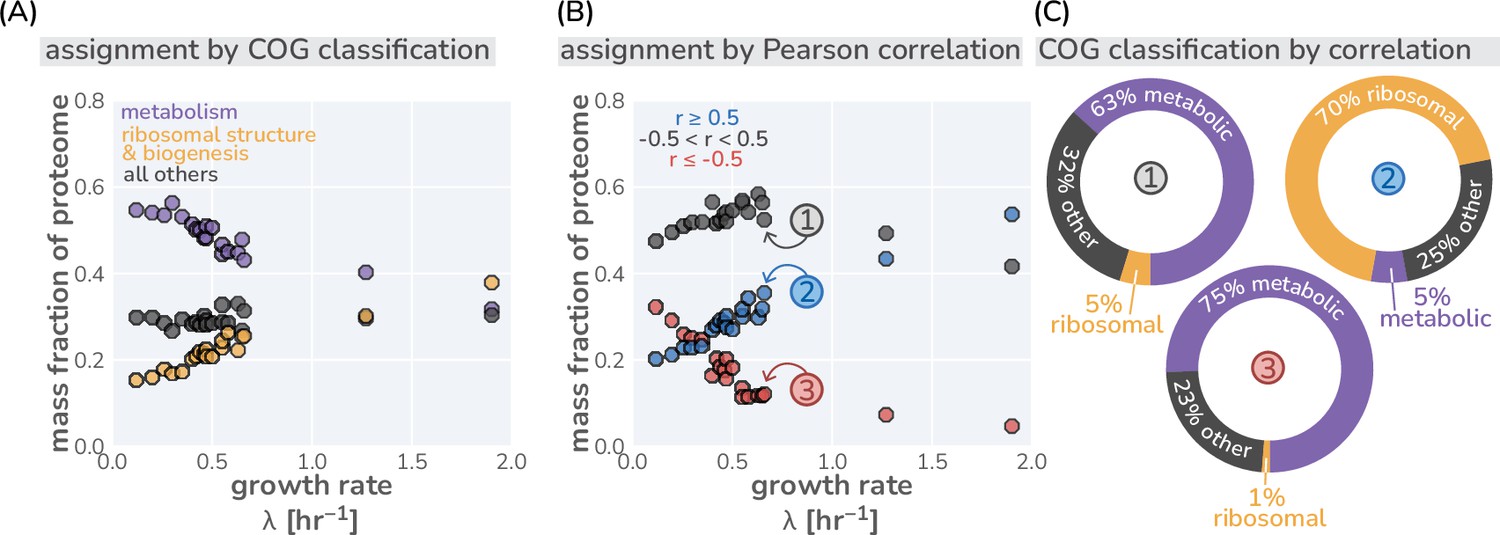
Different classification strategies of ‘other’ proteins.
(A) Classification of proteins in mass spectrometry data (Schmidt et al., 2016) by their COG classification. ’Metabolism’ includes all transport and metabolic processes (COG letters: P,H,F,E,G,C Maitra and Dill, 2015). (B) Classification of ‘other’ proteins by their growth rate dependence. Other proteins are defined as those with a Pearson correlation coefficient between –0.5 and +0.5. (C) The composition of each correlation-defined sector for one condition are shown as doughnut plots. Colors correspond to the COG classifications shown in (A) and circled numbers correspond to labeled points in (B).
Appendix 1—figure 5
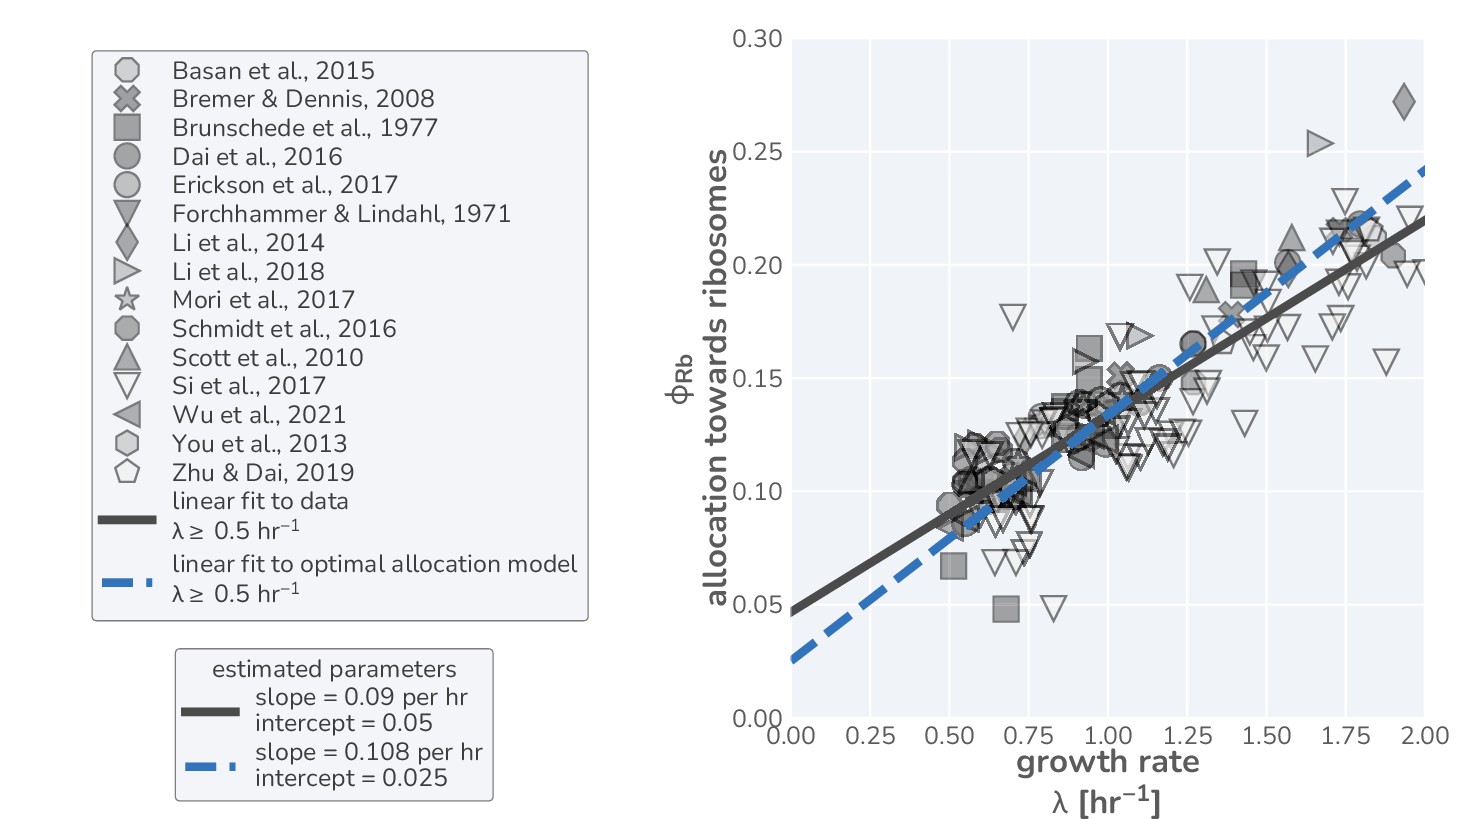
Linear regression on data and optimal allocation model in fast-growth regime yields comparable offsets.
Data in right-hand panel corresponds to the same measurements used in the main text but restricted to only those data where the growth rate is hr-1. A simple linear regression (using the SciPy python library) was performed on this data (solid black line) to yield a slope of hr-1 and an intercept of , in line with parameter estimates from previous work (Li et al., 2014). Restricting the model predictions to growth rates 0.5 hr-1 yields a linear relation (dashed blue line) with a slope of hr-1 and an intercept of 0.02.
Appendix 1—figure 6
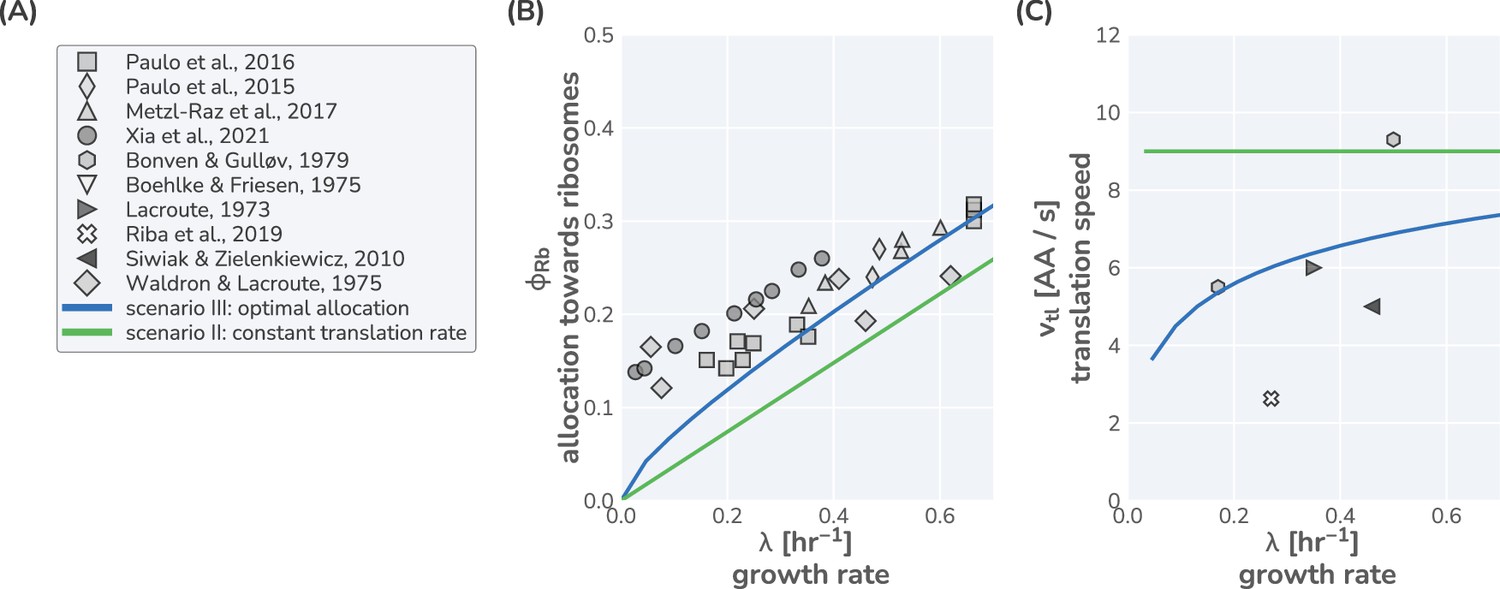
Comparison of model predictions to data from Saccharomyces cerevisiae.
(A) List of literature sources reporting measurement of ribosomal content and/or translation speed measurements. Experimental data for (B) ribosomal content and (C) translation speed are shown as function of growth rate. Green and blue lines correspond to model predictions for scenarios II and III, respectively, using the model parameters defined in Supplementary file 3. For scenario II, a constant translation rate of 90% of was used.
Appendix 1—figure 7
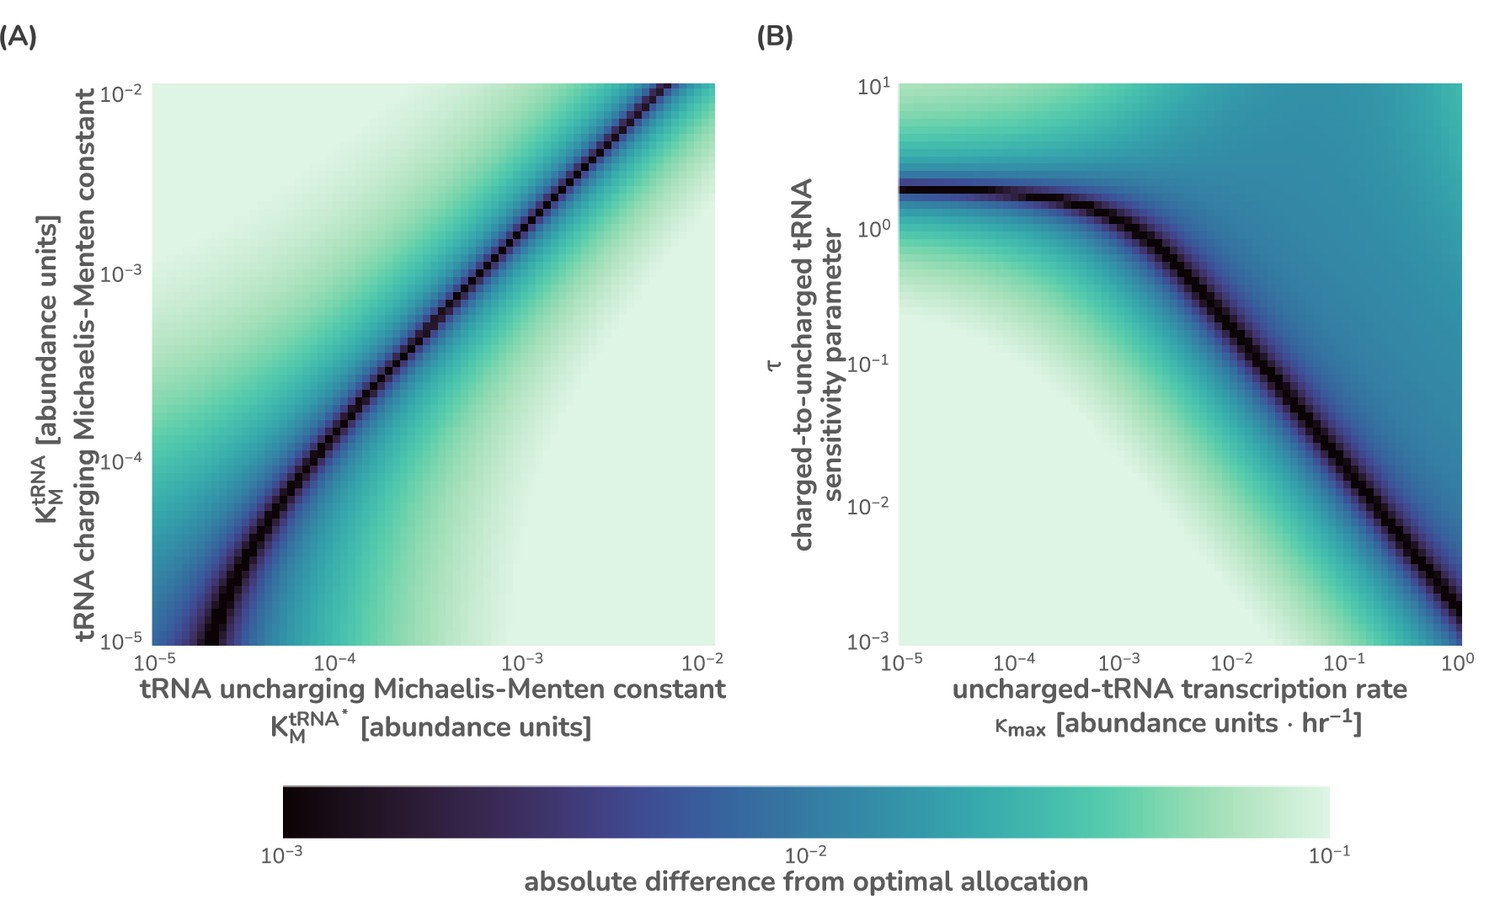
Sensitivity analysis of the flux-parity model for key parameters.
To demonstrate the sensitivity of the flux-parity model to yield approximately identical predictions to optimal allocation, parameter values spanning several orders of magnitude were compared for the (A) Michaelis–Menten constants and (B) the tRNA synthesis rate and ppGpp sensitivity parameter . Both (A) and (B) were evaluated at a single metabolic rate hr-1. The absolute difference from the flux-parity determined allocation and the optimal allocation was computed and is shown on a logarithmic color scale from near-identical (purple) to significantly different (light green). All parameter values except for those being explored were kept the same as listed in Supplementary file 1
Appendix 1—figure 8
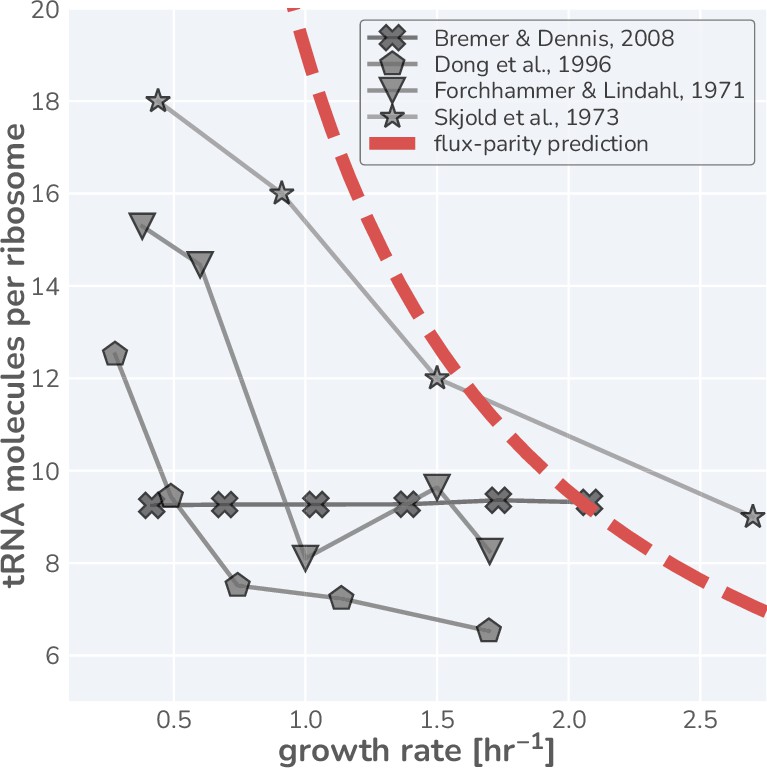
Literature measurements for the number of tRNA molecules per ribosome in steady-state growth.
Glyphs are shown with connecting lines to more clearly demonstrate the observed trend in each dataset. Red dashed-line represents the estimated tRNA abundance per ribosome resulting from the flux-parity allocation model.
Additional files
-
Supplementary file 1
Reference parameter set for E. coli used in this work.
(a) Value was estimated as follows. The maximum tRNA synthesis rate was taken to be that in very rich media. In these conditions, each E. coli cell has ≈ 5–8 copies of its genome and each genome is assumed to have ≈ 64 copies of tRNA genes. At a transcription rate of 40 nt/s, each tRNA gene can produce ≈ 1 tRNA per second Belliveau et al., 2021. Together, this yields an estimate for the maximum rate of tRNA synthesis to be ≈ 5× genomes × 64 genes/genome.
- https://cdn.elifesciences.org/articles/84878/elife-84878-supp1-v2.xlsx
-
Supplementary file 2
E. coli data used in this work and the corresponding sources.
(a) Concentration of ppGpp was computed relative to that of the sample with the closest growth rate of 1.0 hr−1 to remain consistent with Wu et al., 2022. (b) Source data was not available, so data was determined from figures using WebPlotDigitizer (Rohatgi, 2021). (c) Converted to ribosome content by assuming 0.86 µg of rRNA per 1 µg RNA and 0.53 µg of ribosomal protein per 1 μg of rRNA. This yields a conversion factor of . (d) Original values were calculated assuming ≈ 70% of ribosomes were active. We assume all ribosomes are active and recalculated the values accordingly. (e) Growth rate immediately following the shift was calculated by averaging values within first 20 min after the shift to be consistent with procedure reported by Korem Kohanim et al., 2018. (f) Original data curated and standardized by Belliveau et al., 2021.
- https://cdn.elifesciences.org/articles/84878/elife-84878-supp2-v2.xlsx
-
Supplementary file 3
Reference parameter set for S. cerevisiae used in this work.
- https://cdn.elifesciences.org/articles/84878/elife-84878-supp3-v2.xlsx
-
Supplementary file 4
S. cerevisiae data used in this work and the relevant sources.
(a) Original values were calculated assuming ≈ 70% of ribosomes were active. We assume all ribosomes are active and recalculated the values accordingly. (b) Source data was not available, so data was approximated from Figure using WebPlotDigitizer (Rohatgi, 2021). (c) Calculated given the total mass of protein per cell in Table 5 and the number of ribosomes in Table 4. A length of 11,984 AA per ribosome and an average amino acid mass of 110 Da /AA was used to calculate total ribosomal mass.
- https://cdn.elifesciences.org/articles/84878/elife-84878-supp4-v2.xlsx
-
MDAR checklist
- https://cdn.elifesciences.org/articles/84878/elife-84878-mdarchecklist1-v2.pdf
Download links
A two-part list of links to download the article, or parts of the article, in various formats.
Downloads (link to download the article as PDF)
Open citations (links to open the citations from this article in various online reference manager services)
Cite this article (links to download the citations from this article in formats compatible with various reference manager tools)
An optimal regulation of fluxes dictates microbial growth in and out of steady state
eLife 12:e84878.
https://doi.org/10.7554/eLife.84878


