Prefrontal cortex state representations shape human credit assignment
- Department of Cognitive Linguistic & Psychological Sciences, Brown University, United States
- Department of Neuroscience, Brown University, United States
- Carney Institute of Brain Sciences, Brown University, United States
Figures
Figure 1
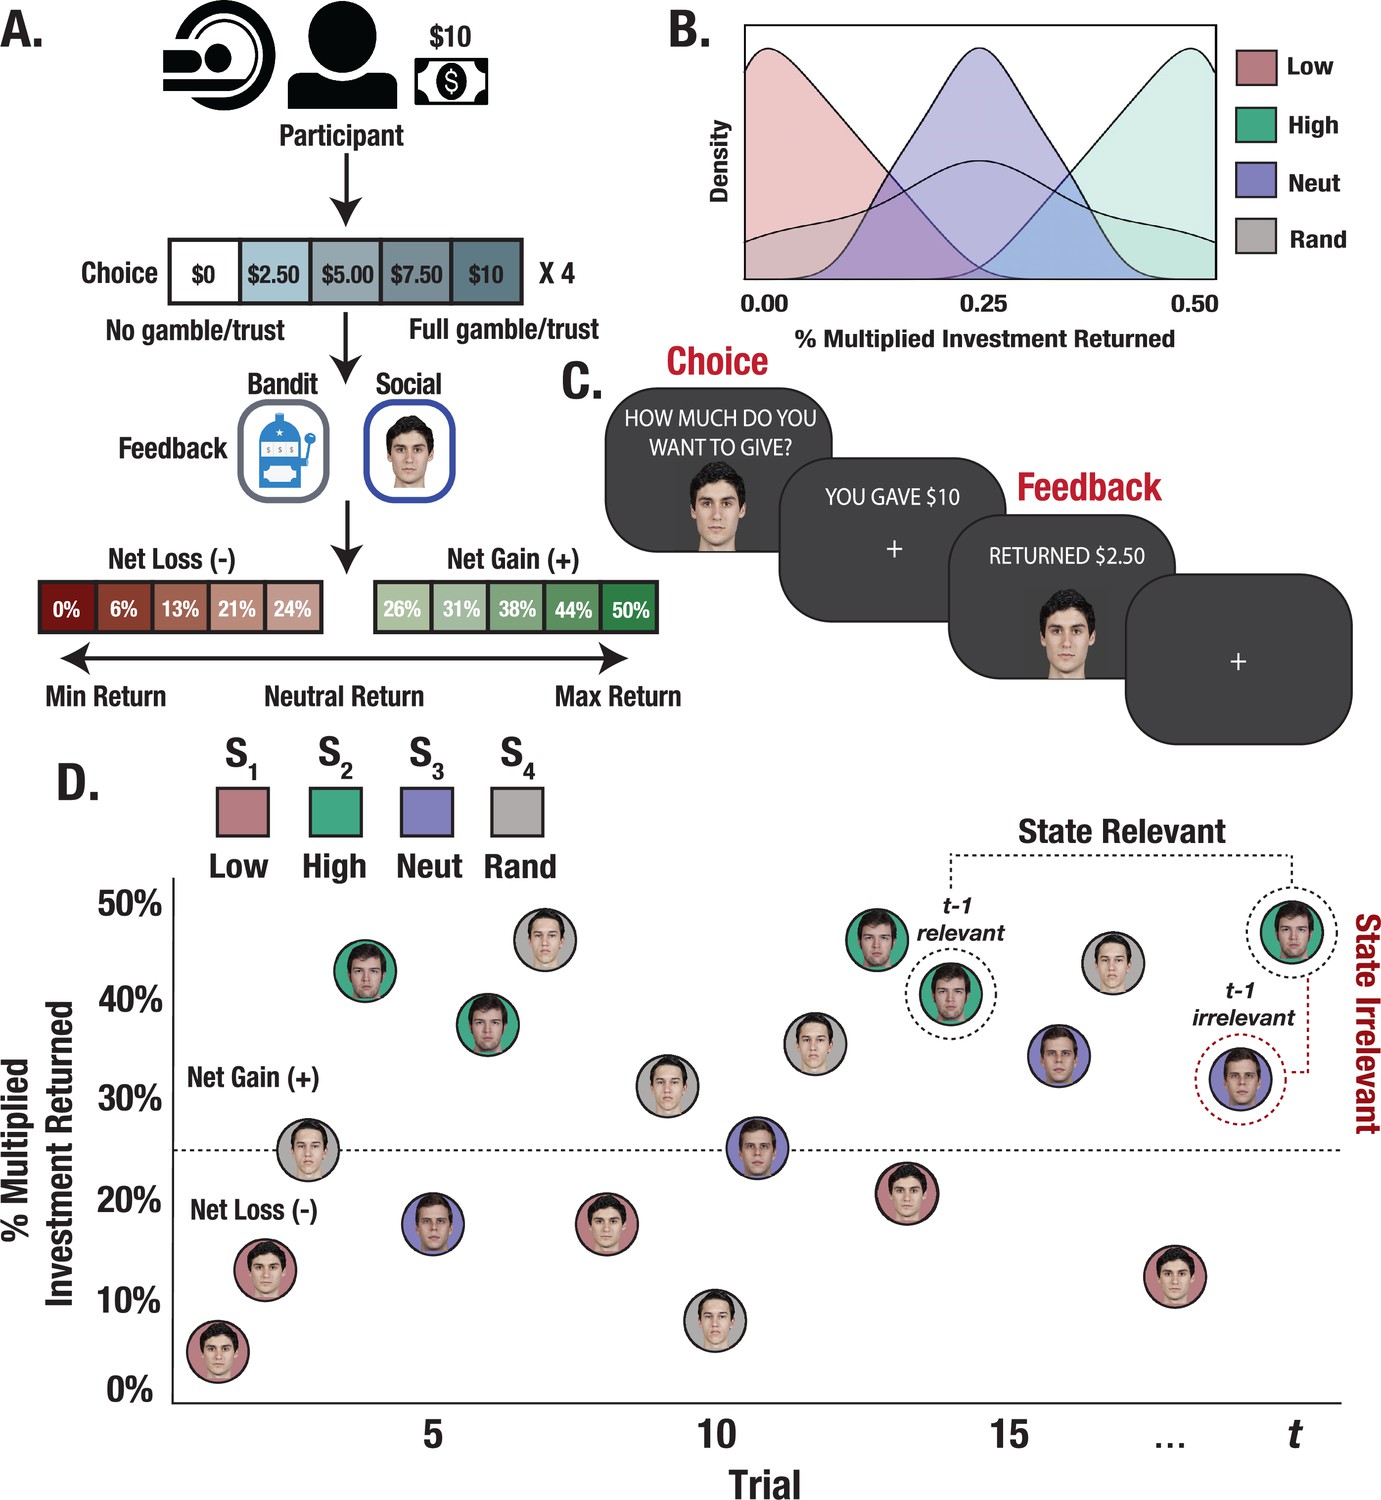
Experimental design and trial structure.
(A) Trust Game and matched bandit task. Participants played 15 trials with each partner/bandit while in the scanner. On each trial, participants were paired with one of the four stimuli (partner/bandit) and given $10 to invest using a 5-button response box to indicate their investment in $2.50 increments. The monetary investment was then quadrupled, and partners/bandits returned anywhere from 0% to 50% of the money received, allowing for the possibility to double one’s earnings, lose the full investment, or any outcome in between. (B) Task reward structure. Stimuli were randomly assigned to respond with fixed reward rates generated from one of four outcome distributions. Each stimulus deterministically returned less than the participant initially invested (low), more (high), an amount close to the initial investment (neutral), or a random amount. (C) Task event sequence. Participants were given up to 3 s to indicate their choice, after which they experienced a jittered inter-stimulus delay. The returned investment was then displayed on the screen for a fixed 2 s duration. (D) Within-task stimulus presentation. Trials were randomly interleaved such that interactions with each stimulus could occur anywhere from 1 to 15 trials apart, allowing us to probe learning effects from relevant versus temporally adjacent irrelevant outcomes.
Figure 2
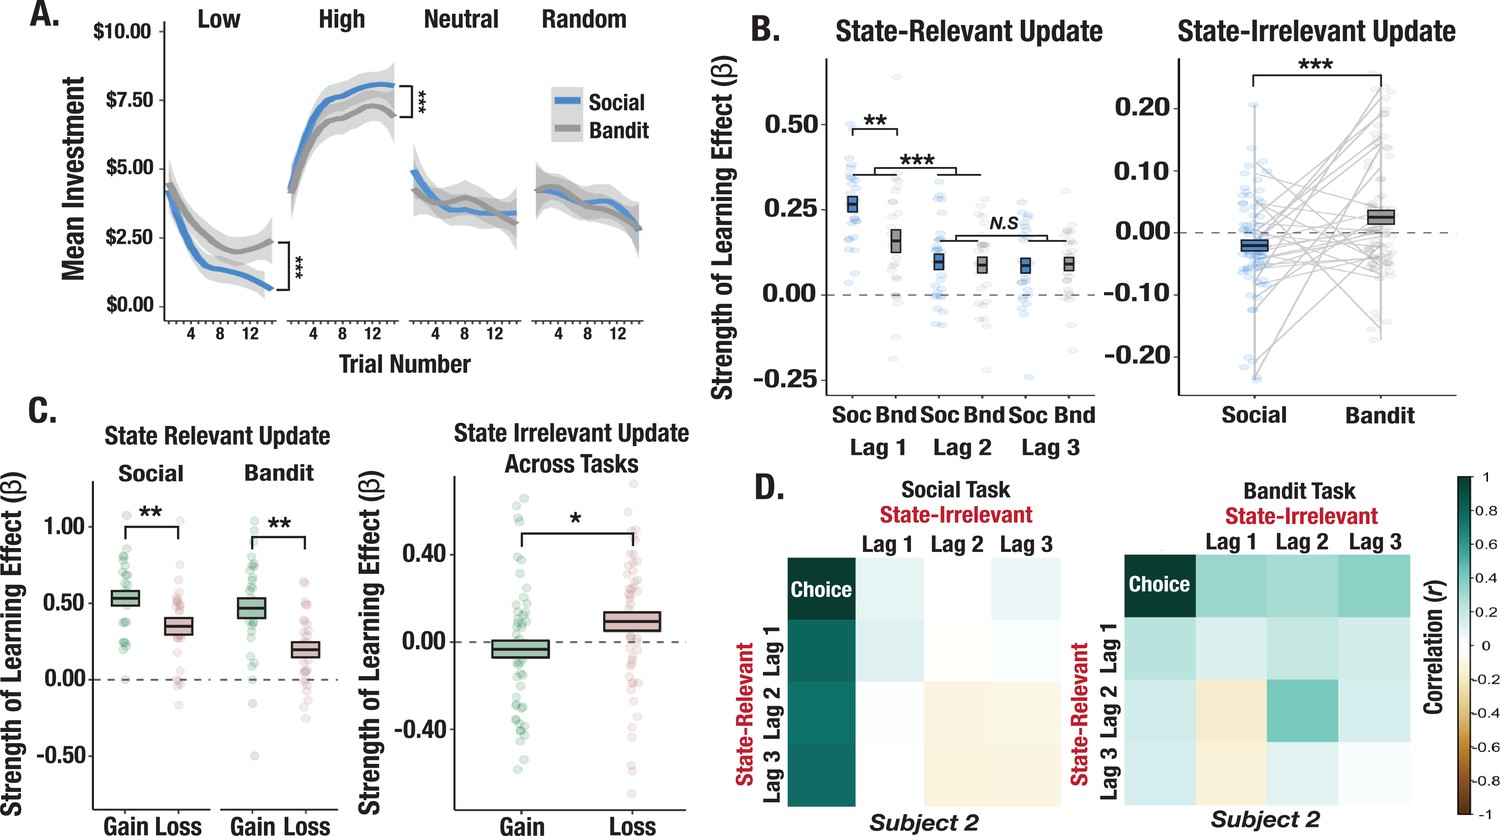
Behavioral differences across social and bandit tasks.
(A) Learning curves from social and bandit tasks. Predicted investments over trials computed from fixed-effects regression model show faster learning in the social task. Shaded gray regions correspond to the standard error of the mean of the regression line. (B) Effect of relevant and irrelevant outcome history on choice. Model terms show increased learning from the most recent relevant outcome in the social task and an increased effect of irrelevant outcomes on investments in the bandit task. The box-length denotes the standard error of the mean, and the black line corresponds to the mean beta estimate for the lag term. (C) Effect of valence-dependent outcome history on choices. Relevant prior gains compared to losses exerted a greater influence on investments. (D) Correlation matrix of relevant and irrelevant outcomes on investments for a prototypical participant. The participant shows a strong pattern of learning exclusively from relevant outcomes in the social task but applies irrelevant outcomes to learning in the bandit task. Asterisks (*,**,***) denote p<0.05, p<0.01, p<0.001, respectively.
Figure 3 with 5 supplements
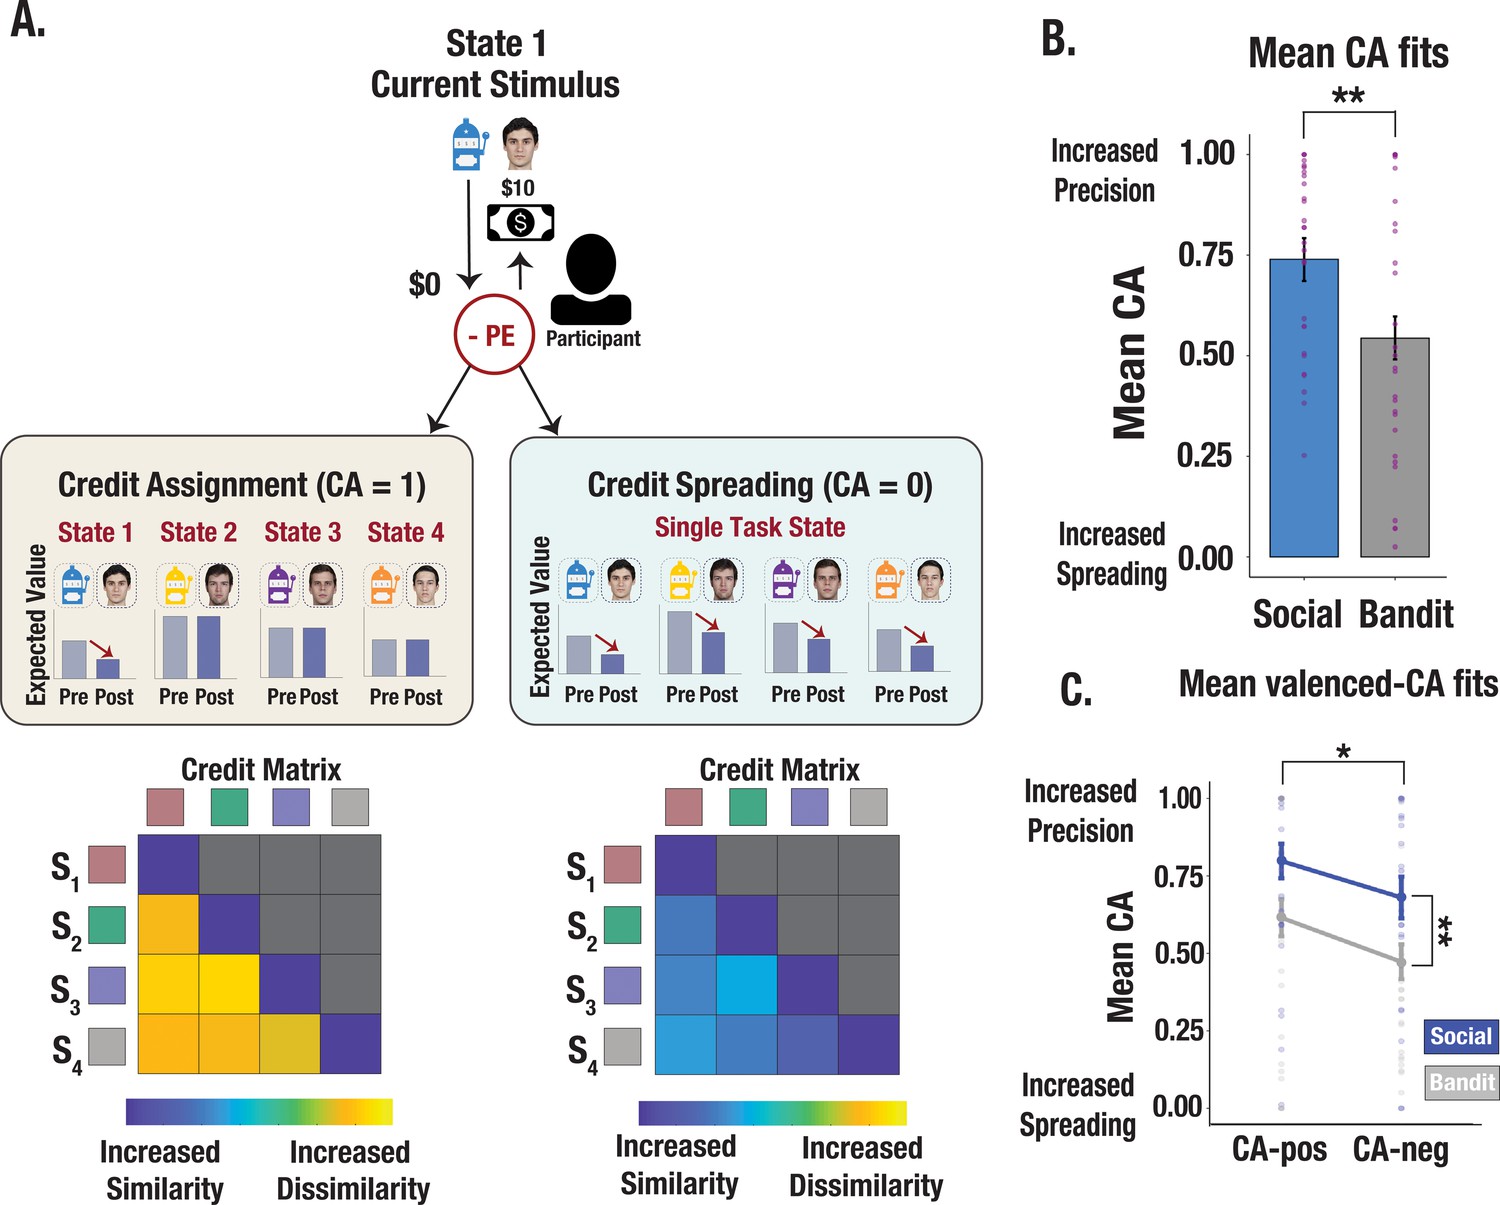
Illustration of credit assignment model and task differences in credit assignment precision.
(A) Schematic visualization of credit assignment and credit spreading mechanisms. In a perfect credit assignment scenario (left side), PEs only update the expected value of the current state. A hypothetical credit matrix shows how credit assignment may impact the discriminability between states. Credit assignment values closer to 1 (perfect credit assignment) only use PEs from the relevant state to update expected values, therefore allowing for increased differentiation in the state space. Conversely, in a credit-spreading scenario illustrated with a hypothetical matrix (right side), PEs are used to update the expected value of current and irrelevant states, as if stimuli were clustered into a single causal state. This would result in less differentiation between states and increased confusability. (B) Credit assignment parameter estimates from the V-LR, V-CA model across social and bandit tasks. Mean CA fits show more precise credit assignment in the social task and increased spreading in the bandit task. Purple dots show individual parameter estimates and error bars denote the standard error of the mean. (C) Valenced credit assignment parameter estimates from the V-LR, V-CA model. Parameter fits from our valenced CA model show more precise credit assignment for gains (CA-pos) and more spreading for losses (CA-neg). Error bars show the standard error of the mean computed from a sample size of N = 28.
Figure 3—figure supplement 1
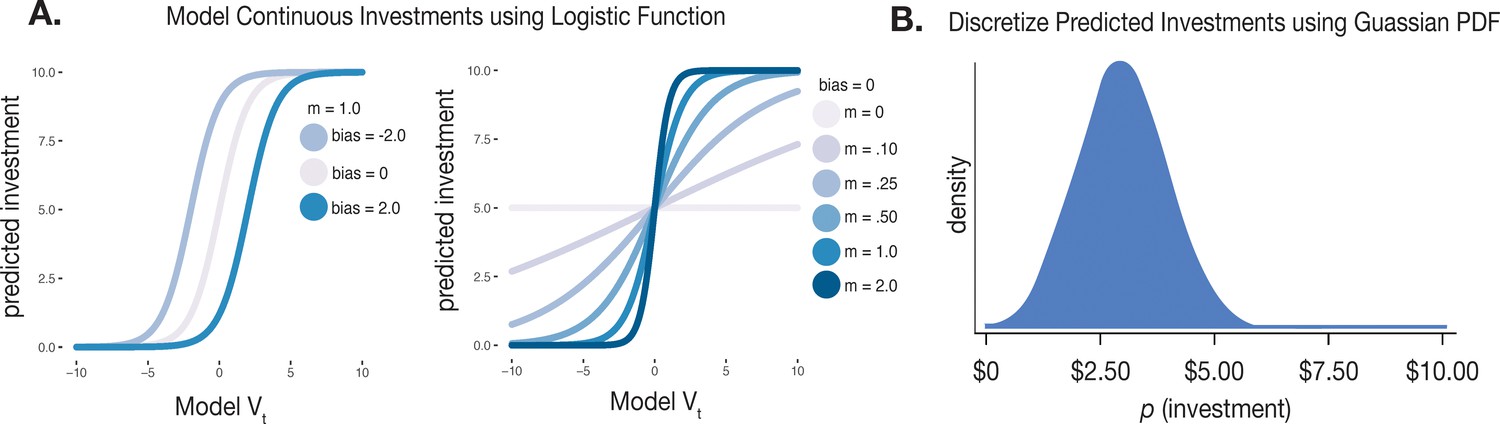
Continuous choice, logistic RL algorithm.
(A) Impact of bias and m parameter estimates on predicted investments in the RL model. Higher bias parameters indicate an increased baseline tendency to invest larger monetary amounts, whereas m parameters capture the degree of evidence learners require before switching investment strategies. (B) Schematic of Gaussian density function used to convert predicted investments from continuous to discrete ordinal scale and to compute trial log likelihood.
Figure 3—figure supplement 2
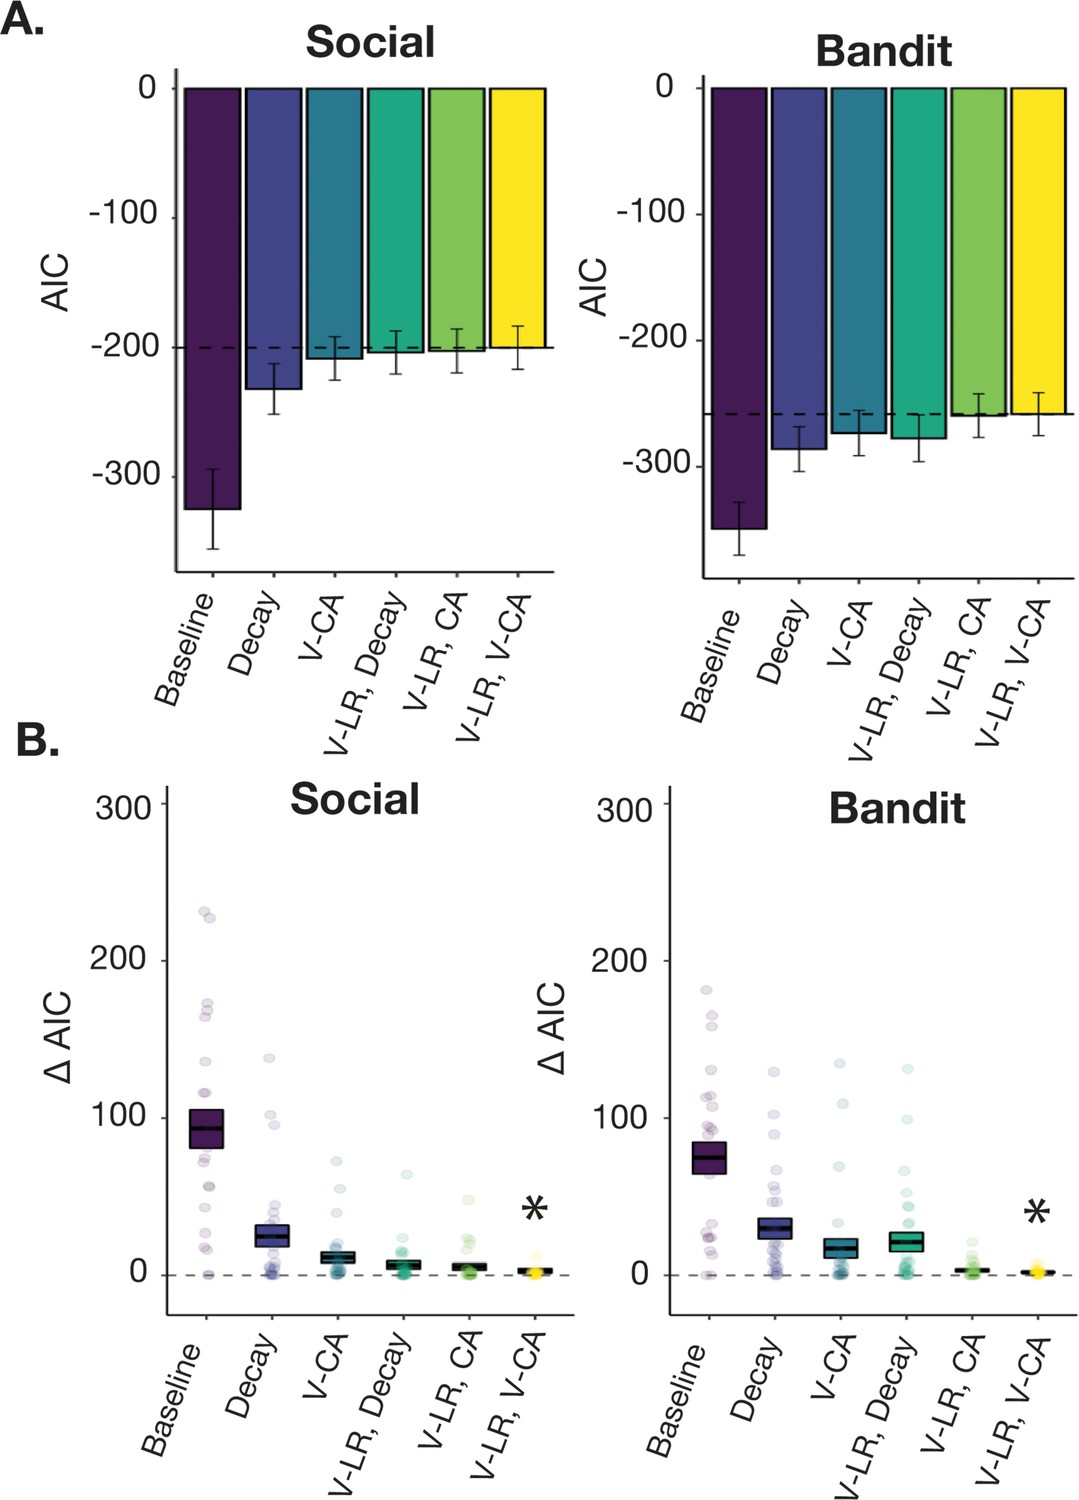
Model performance and comparison.
(A) Mean AIC for each model. Error bars correspond to the standard error of the mean. The dotted black line shows the mean AIC for the V-LR, V-CA model for comparison. (B) Mean Δ AIC for each model. The length of each bar shows the standard error of the mean, and individual points correspond to the difference between the AIC for each participant’s best-fitting model and the model denoted on the x-axis. * Denotes the model with the min Δ AIC in the set.
Figure 3—figure supplement 3

Model identifiability.
(A) Model confusion matrix. Model confusability was evaluated by simulating 100 participants per model. For each simulated participant, free parameters were randomly sampled from a uniform distribution (Supplementary file 1e) and trial-to-trial investments were generated under the sampled parameterization. Each model was fit to each simulated participant using 20 iterations of gradient descent, and classification rates were computed as the frequency with which each participant was best fit by the correct generative model which we evaluated by maximizing the negative AIC (rate of winning model/true model). (B) Inverse confusion matrix based on same data but showing the probability that each generative model gave rise to a given ‘best fitting’ model.
Figure 3—figure supplement 4
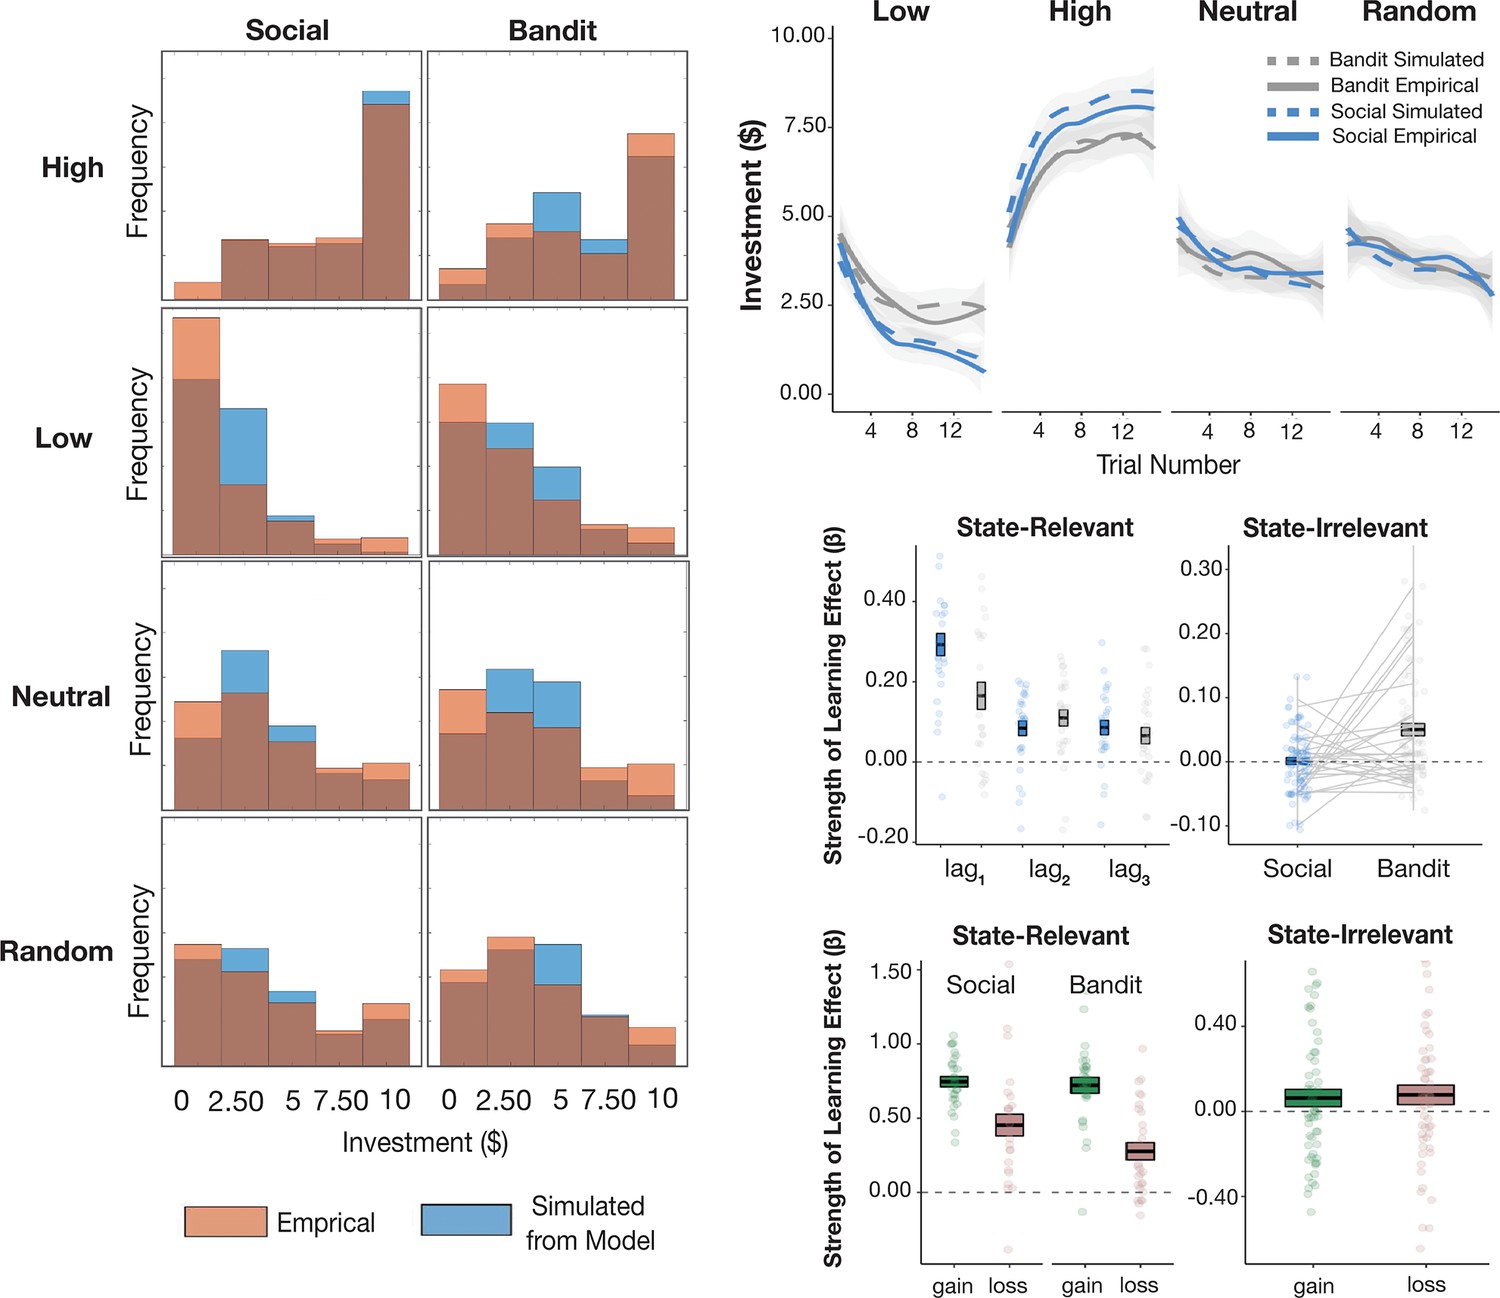
MLE predictive check.
For each participant, the set of MLE-optimized parameters from the V-LR, V-CA model were used to simulate data from the model. Model-generated data is plotted above and reproduces behavioral effects.
Figure 3—figure supplement 5
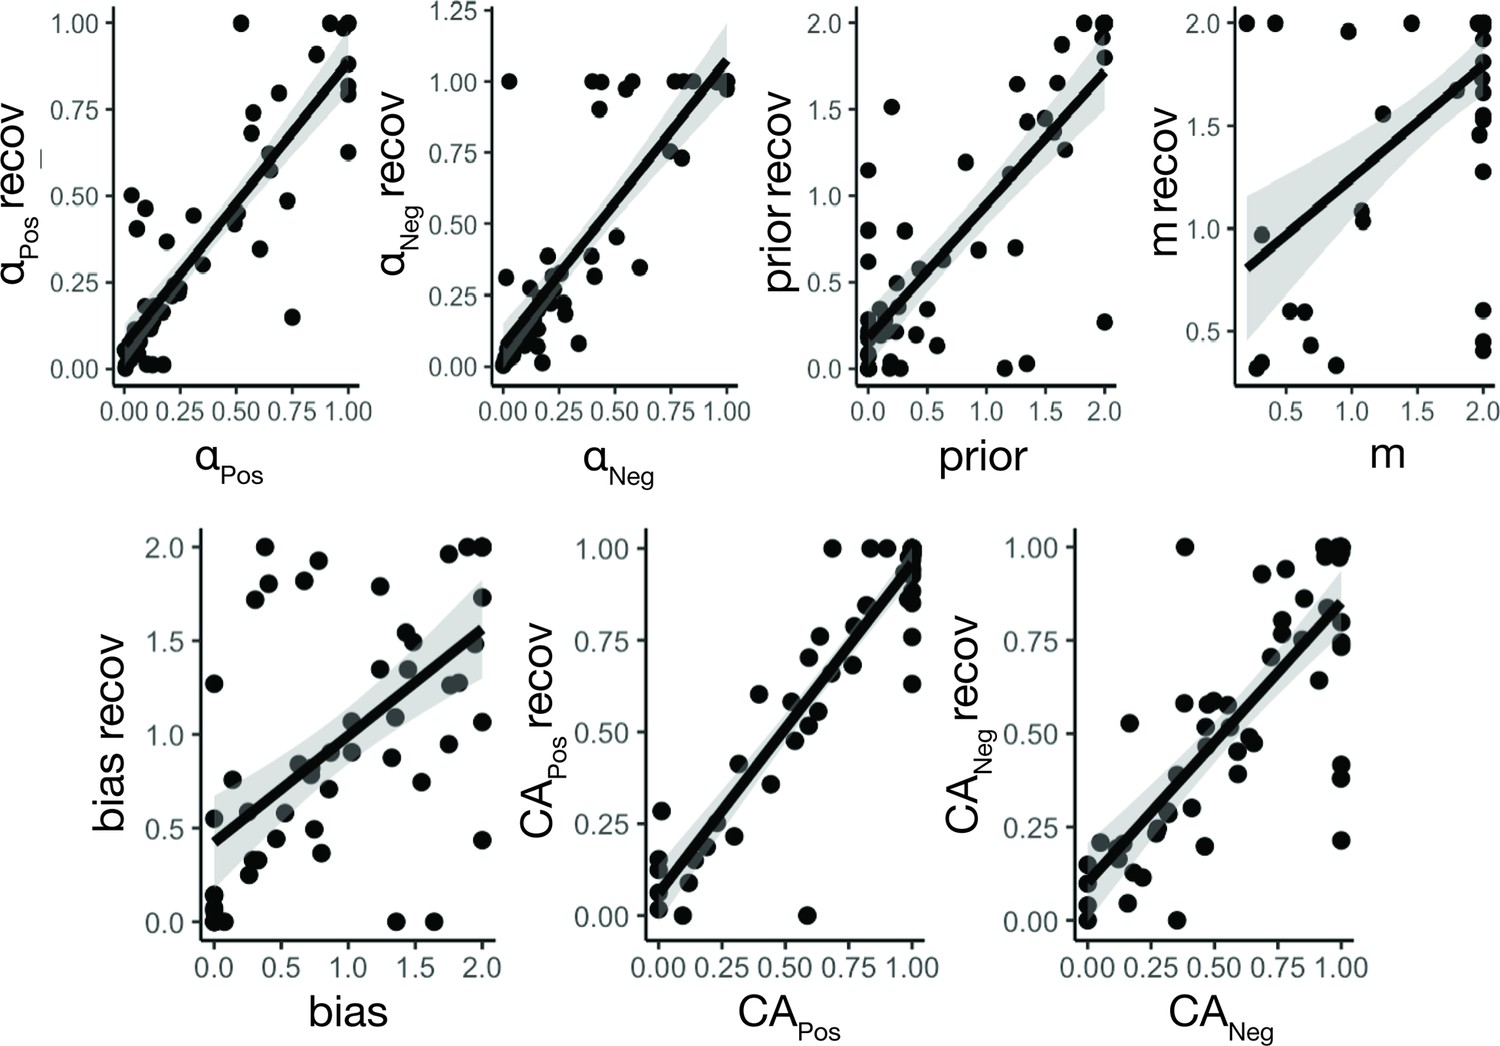
Parameter recovery.
Estimated parameters from the V-LR, V-CA model could be reliably recovered from model-generated data from the MLE predictive check, particularly for parameters of interest (CA and LR).
Figure 4
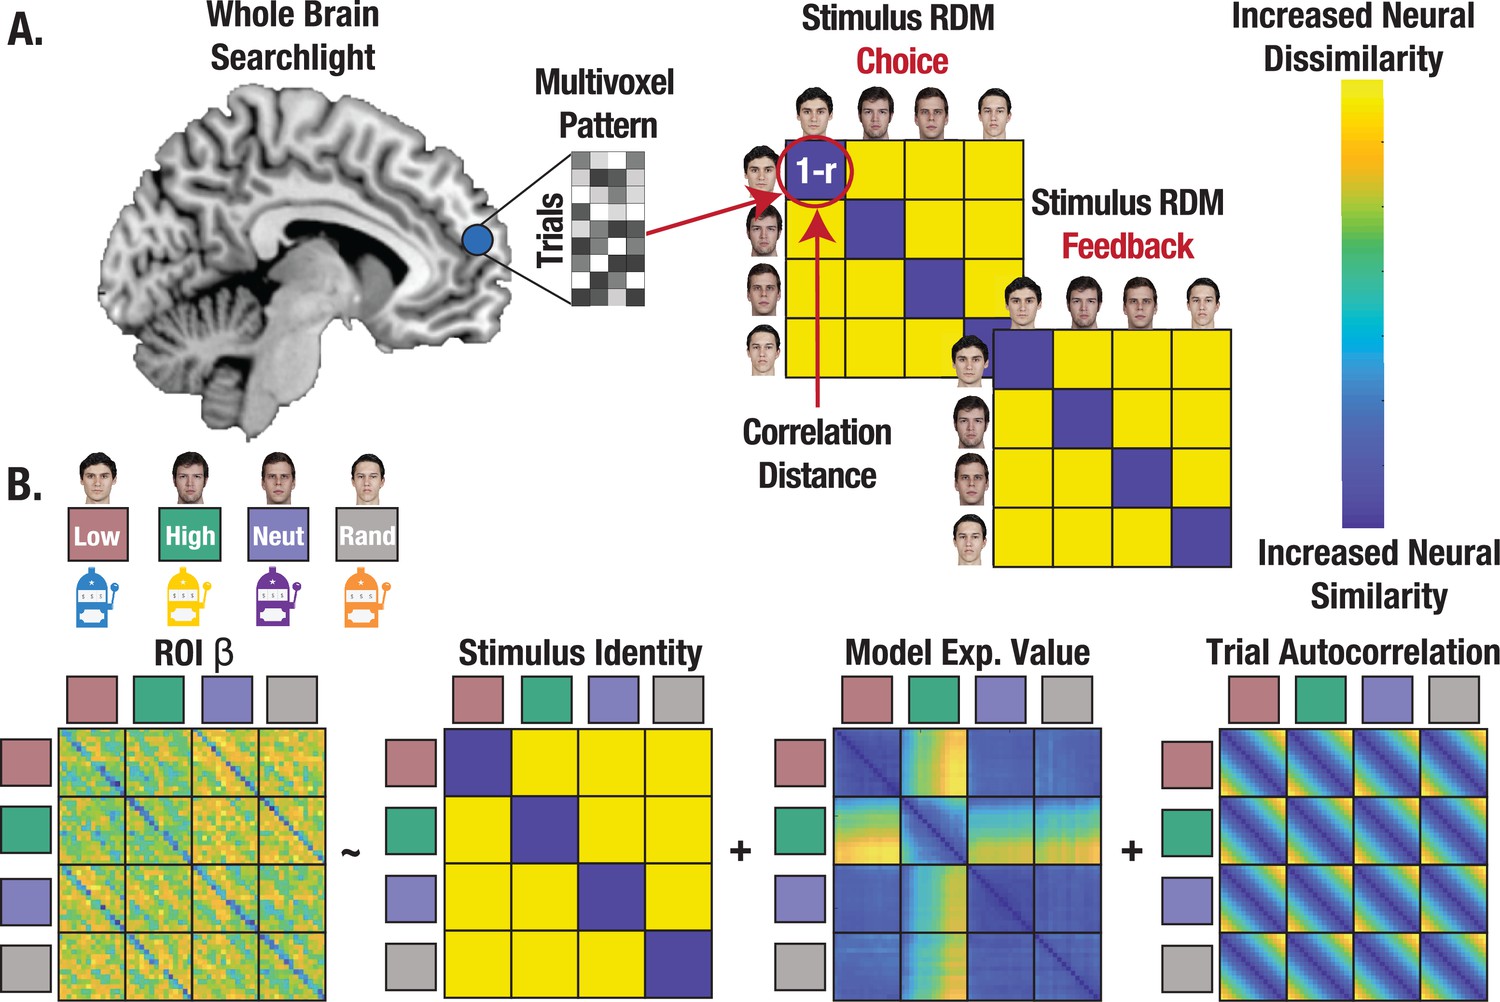
Representational similarity analysis (RSA) captures the format of state representations.
(A) Conceptual depiction of RSA methods with whole brain searchlight. Multivoxel patterns were extracted for all trials and reorganized into a correlation distance (1 r) matrix with trials nested within stimulus identities for each task. State representation was evaluated separately for choice and feedback. (B) Regression approach estimating state representation in neural ROIs, controlling for expected value (V) and trial autocorrelation.
Figure 5
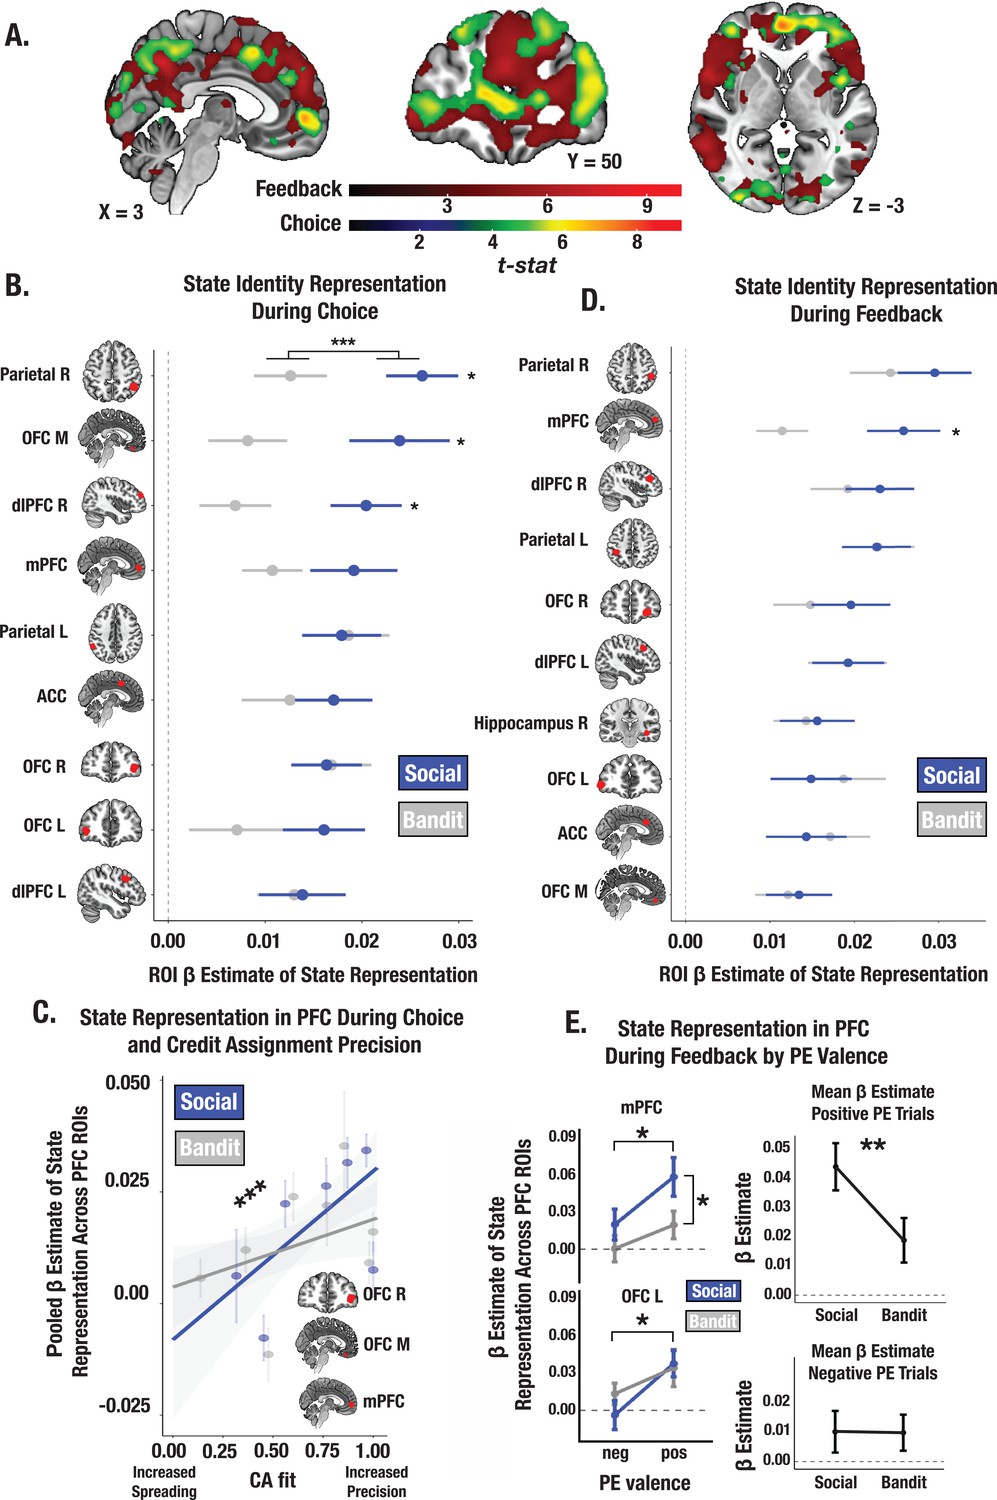
Social and bandit task state representations during choice and feedback.
(A) Task-summed group-level t-map of state representation during choice and feedback; image is thresholded at the cluster-level (PFWE <.05) and at peak level (P<.0001). (B) Beta estimates of state representation across ROIs identified from choice phase searchlight, broken down by social and bandit tasks. RSA results indicate stronger state representation in the social task. Individual asterisks denote a significant within-subject effect for the specified ROI. (C) Predictive association between individual CA parameter estimates and the fidelity of state representation in mPFC, lOFC, and mOFC during choice. Across both social and bandit tasks, credit assignment predicts the strength of state representation in the PFC. *** Denotes the main effect of CA on the pooled estimate of state representation across ROIs (p<0.001). (D) State representation estimates in ROIs during feedback. Task differences only emerge in the mPFC. (E) Effect of PE valence on state encoding in the PFC during feedback. Across social and bandit tasks, positively valenced PEs were associated with higher-fidelity state representations in the mPFC and lOFC. Pooling across mPFC and lOFC ROIs, state encoding was greater in the social compared to bandit task on positive PE trials. Error bars show the standard error of the mean computed from a sample size of N = 28.
Figure 6
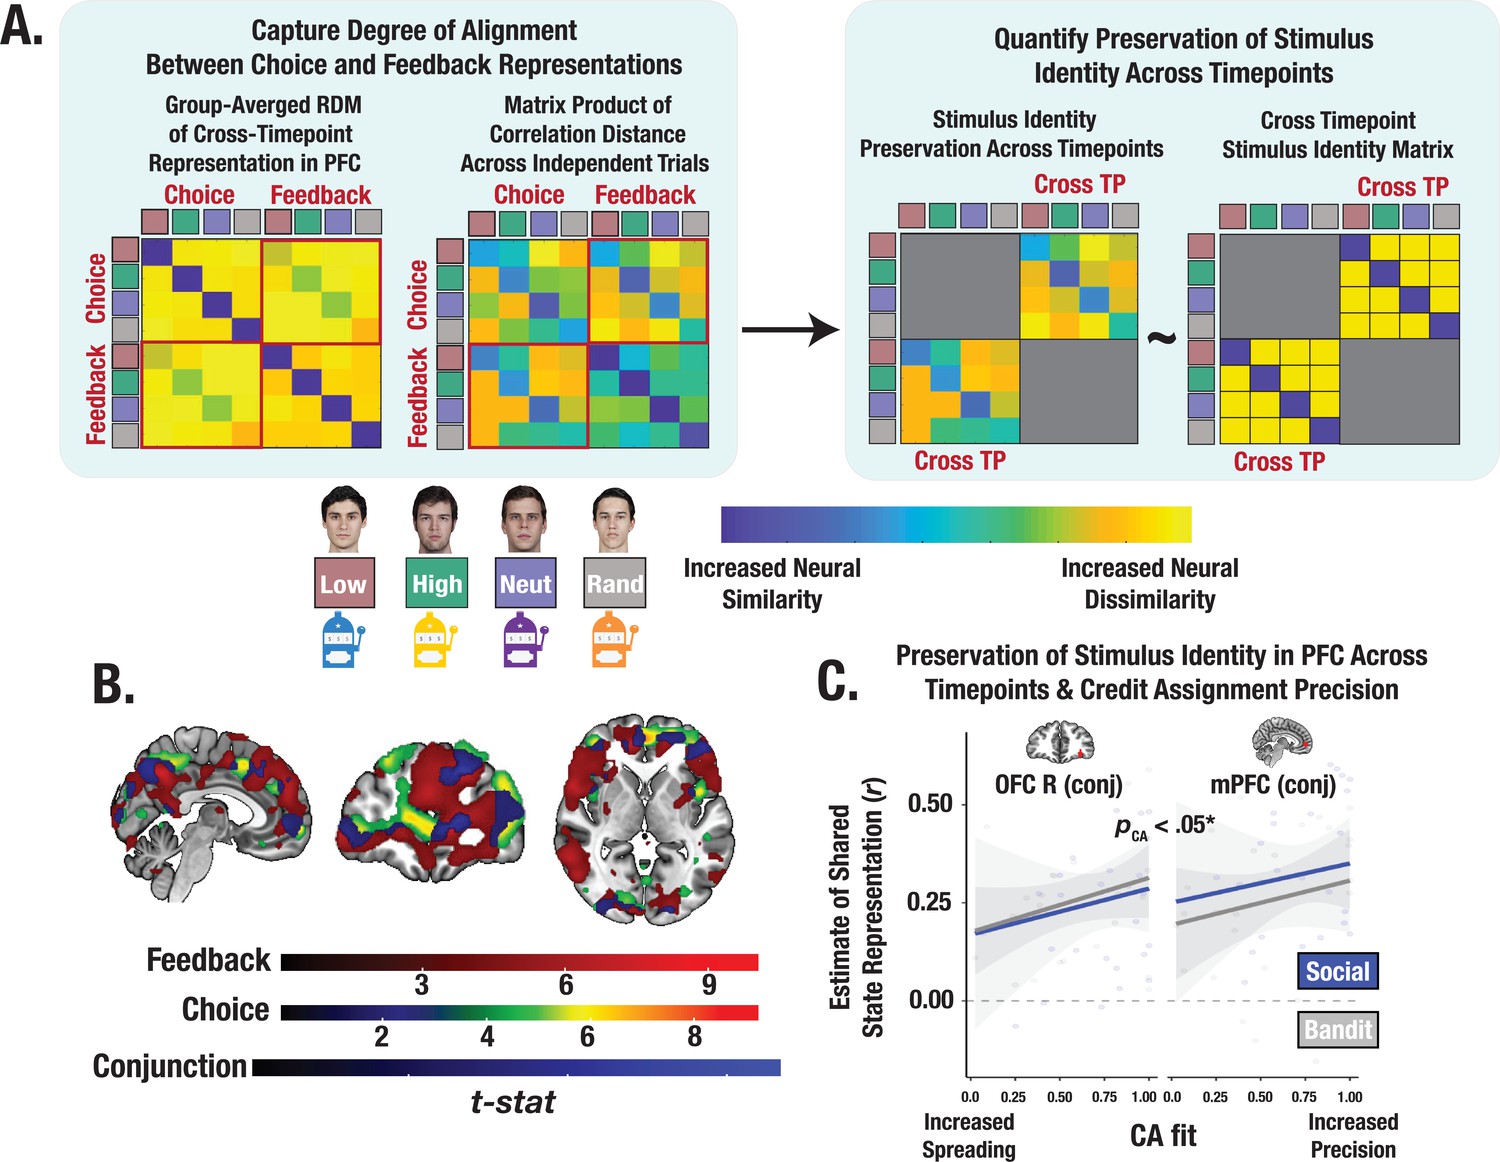
Cross-timepoint representational similarity analysis (RSA).
(A) Conceptual depiction of cross-timepoint RSA. For each participant, cross-timepoint matrices were constructed as the correlation distance between even and odd trial neural RDMs (Methods). Cross-timepoint cells from the matrix were selected and then correlated with a cross-timepoint identity matrix to estimate the degree to which the shared structure within the neural patterns across choice and feedback reflected a stimulus’ identity. (B) Task-summed group-level t-maps displaying results of conjunction contrasts (Methods). Group-level image is thresholded at the cluster-level (PFWE <.05) and at peak level (p<0.0001). (C) Predictive association between individual credit assignment estimates and the consistency of identity representational structure in mPFC and lOFC (i.e., conjunction ROIs) across choice and feedback. * Denotes the effect of CA on the pooled estimate of shared state representation across ROIs (p<0.05).
Figure 7
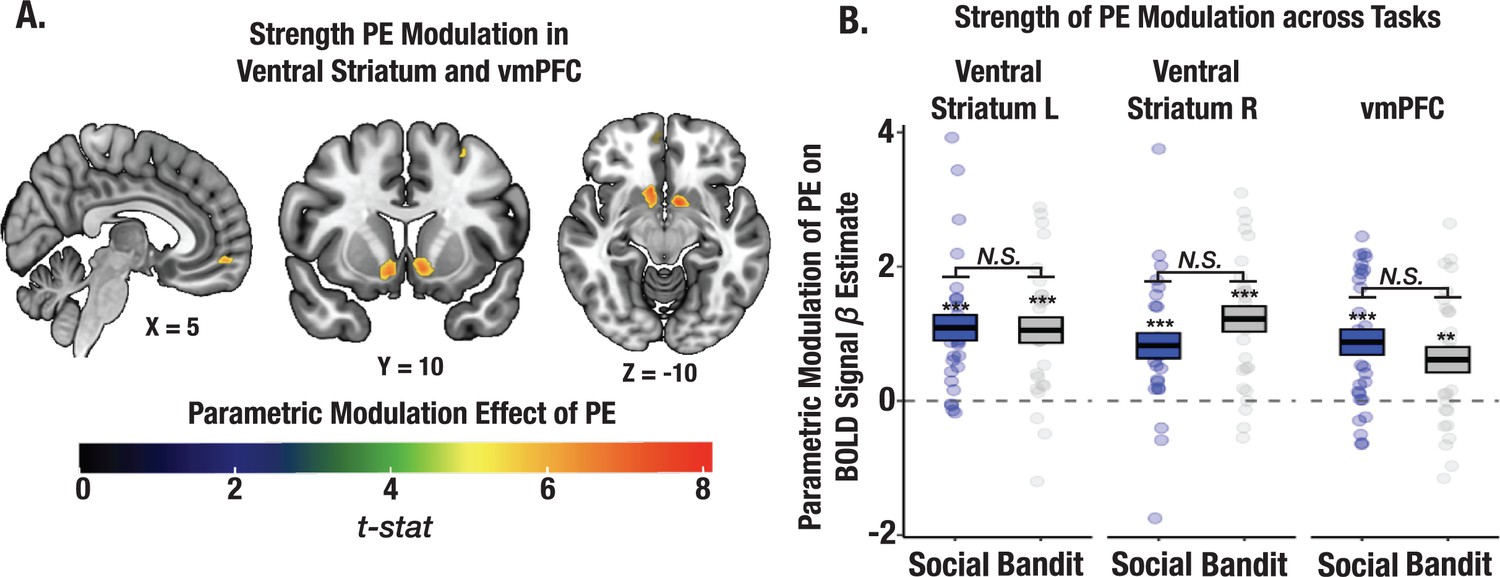
Strength of PE signaling across social and bandit tasks using parametric modulation analysis.
(A) Task-summed group-level t-map displaying the parametric modulation effect of PEs on the BOLD signal (Methods). Significant clusters were observed in the ventral striatum and vmPFC. Group-level image is thresholded at the cluster-level (PFWE <.05). (B) Despite observed learning differences in the two tasks, the magnitude of PE modulation did not differ between social and bandit tasks.
Additional files
-
Supplementary file 1
Additional tables with fMRI analysis ROI coordinates, cluster size, and peak statistics, and additional information about model parameters and performance.
(a) Choice Phase ROI coordinates. (b) Feedback Phase ROI coordinates. (c) Conjunction ROI coordinates from cross-timepoint analysis. (d) Parametric modulation ROI coordinates. (e) List of RL Models included in model comparison, including their respective free parameters indicated with the ×. V denotes valenced terms for either the learning rate (LR) or credit assignment (CA) parameters in the model. (f) Logistic RL algorithm parameters indicating model behavior at upper and lower bounds. (g) Mean AIC and SE for each model. Mean AIC for V-LR, V-CA was the max in the set. Mean values are plotted below in Figure 3—figure supplement 2. (h) Model Comparison. Model Comparison was performed by minimizing Δ AIC, which was computed as the difference between each participants best-fitting model and each model in the set (see Methods). Δ AIC was the lowest for the V-LR, V-CA model indicating that the model captured the behavioral data better than other models in the set, and in instances in which a participant’s data was better fit by another model the V-LR, V-CA model could explain the data equally as well. Δ AIC with individual points is plotted below in Figure 3—figure supplement 2.
- https://cdn.elifesciences.org/articles/84888/elife-84888-supp1-v3.docx
-
MDAR checklist
- https://cdn.elifesciences.org/articles/84888/elife-84888-mdarchecklist1-v3.pdf
Download links
A two-part list of links to download the article, or parts of the article, in various formats.
Downloads (link to download the article as PDF)
Open citations (links to open the citations from this article in various online reference manager services)
Cite this article (links to download the citations from this article in formats compatible with various reference manager tools)
Prefrontal cortex state representations shape human credit assignment
eLife 12:e84888.
https://doi.org/10.7554/eLife.84888


