ACC neural ensemble dynamics are structured by strategy prevalence
- Janelia Research Campus, Howard Hughes Medical Institute, United States
- Department of Neuroscience, Johns Hopkins University Medical School, United States
Figures
Figure 1 with 3 supplements
Strategy encoding in the ACC.
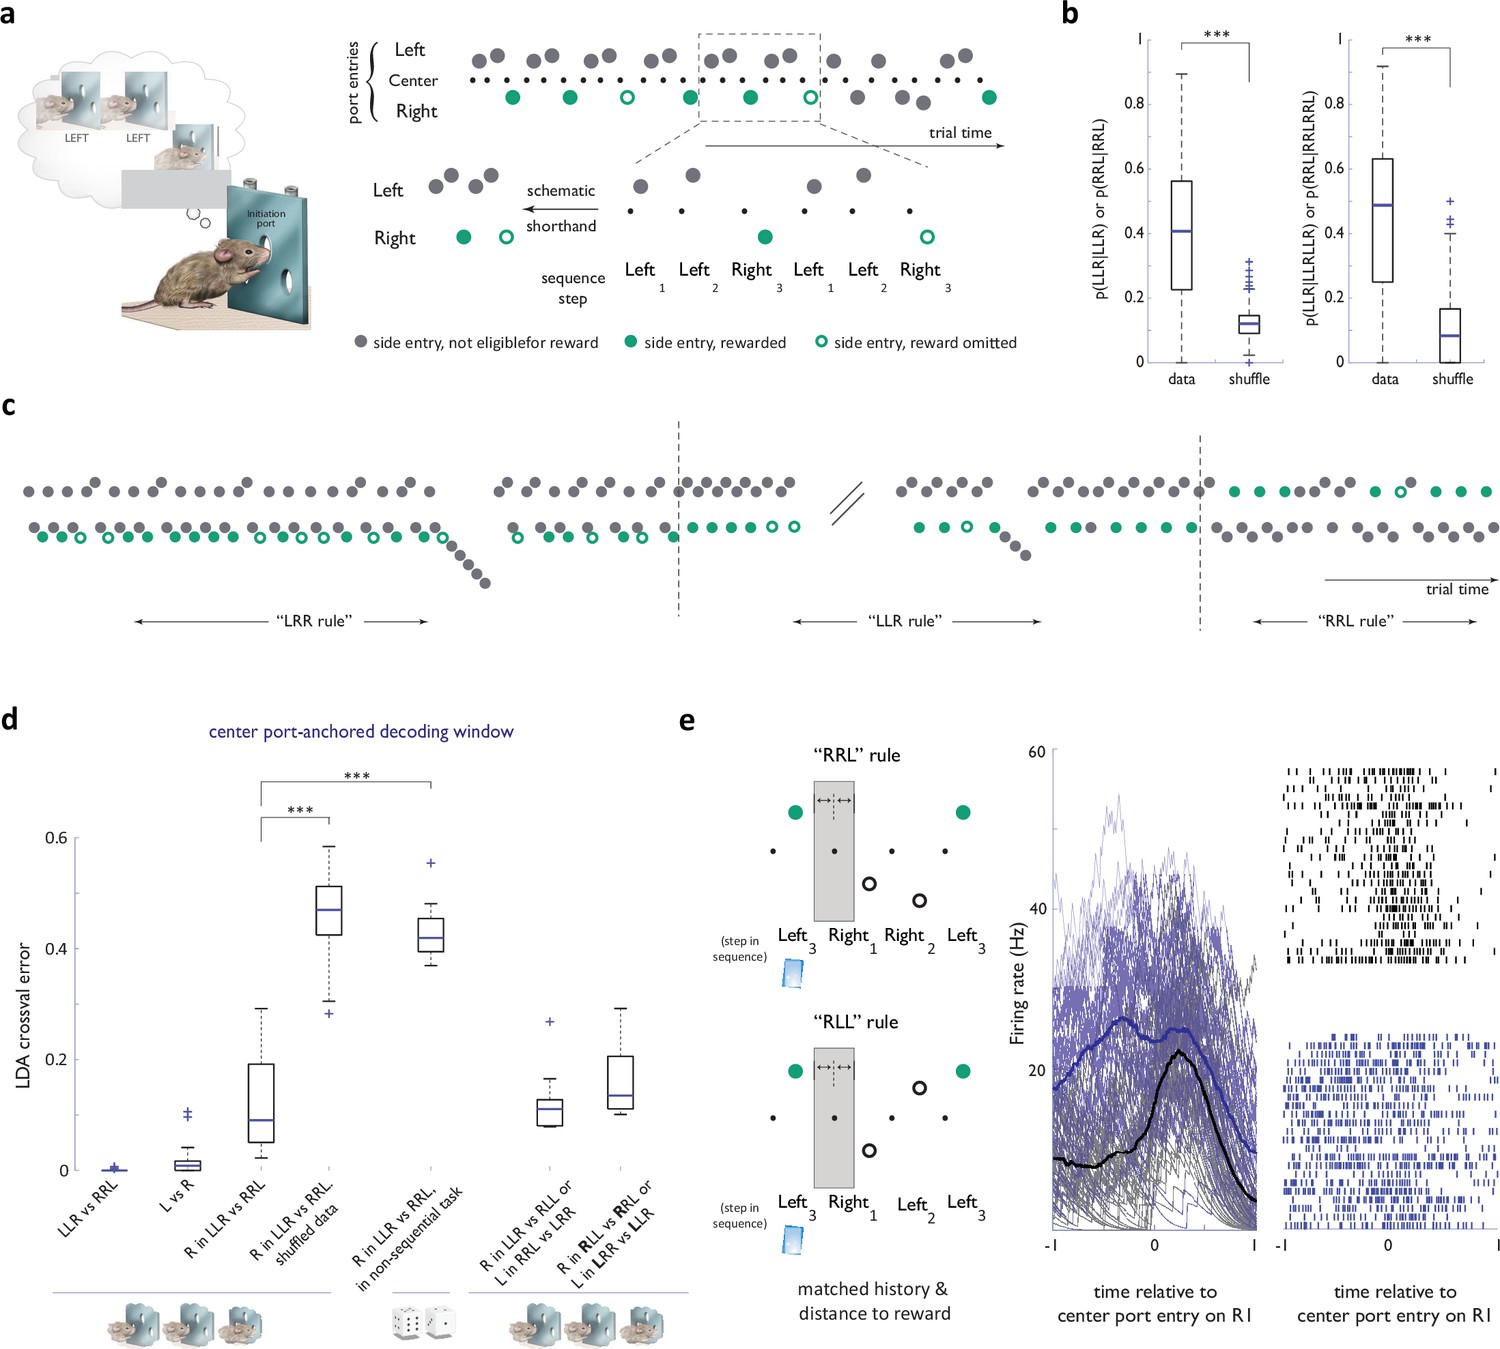
(a) Left panel: Concept of the behavioral task. After initiating at the center port, the animal is eligible to receive a reward only if his sequence of past choices conforms to a latent target sequence, like ‘Left-Left-Right’. Note that the identity of the latent target is not otherwise cued in any way. Liquid reward was delivered directly at choice ports. Right panel: Schematic of the notation used for behavioral data presentation. Note that nose port entries are omitted from schematics in other panels for simplification. (b) Probability of target sequence concatenations across the behavioral dataset. Shuffle randomized trial numbers. (c) Sample behavioral trace, in trial time, around two block transitions. (d) Cross-validated performance errors for linear classifiers trained to distinguish components of different strategies based on ACC neural activity in a decoding window anchored on center port initiation entry. n=36 sessions, N=4 animals for all basic sequence task comparisons; n=9 sessions, N=3 animals for competitor sessions; n=11 sessions, N=1 animal for circularly permuted strategies; n=8 sessions, N=3 animals for 1st R in ‘RRL’ vs ‘RLL’ (or L in ‘LLR’ vs ‘LRR’ decoding). See legend in Figure 1—figure supplement 3 for more details on the non-sequential task (e) Activity traces for an example ACC neuron in the 2 second window around center port entry on the R1 step of ‘RLL’ and ‘RRL’ sequences -a step matched both in immediate history and distance to reward. Black traces: ‘RLL’ rule; blue traces: ‘RRL’ rule. ***, p<0.001.
Figure 1—figure supplement 1
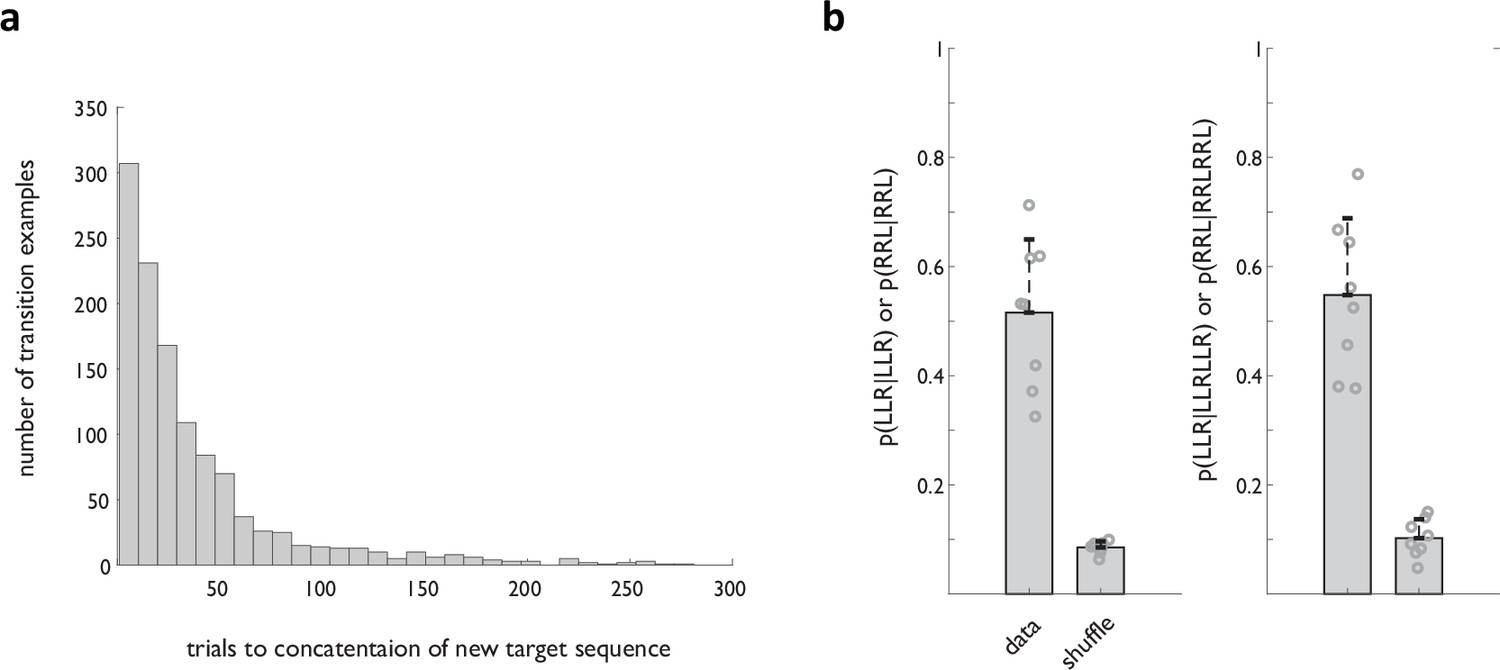
Robustness of sequencing behavior.
(a) Distribution of trials to concatenation of the new target sequence for all transitions in the dataset from the implanted animals. (b) Probability of target sequence concatenation in individual animals. See also Figure 2c for additional evidence of behavioral robustness.
Figure 1—figure supplement 2
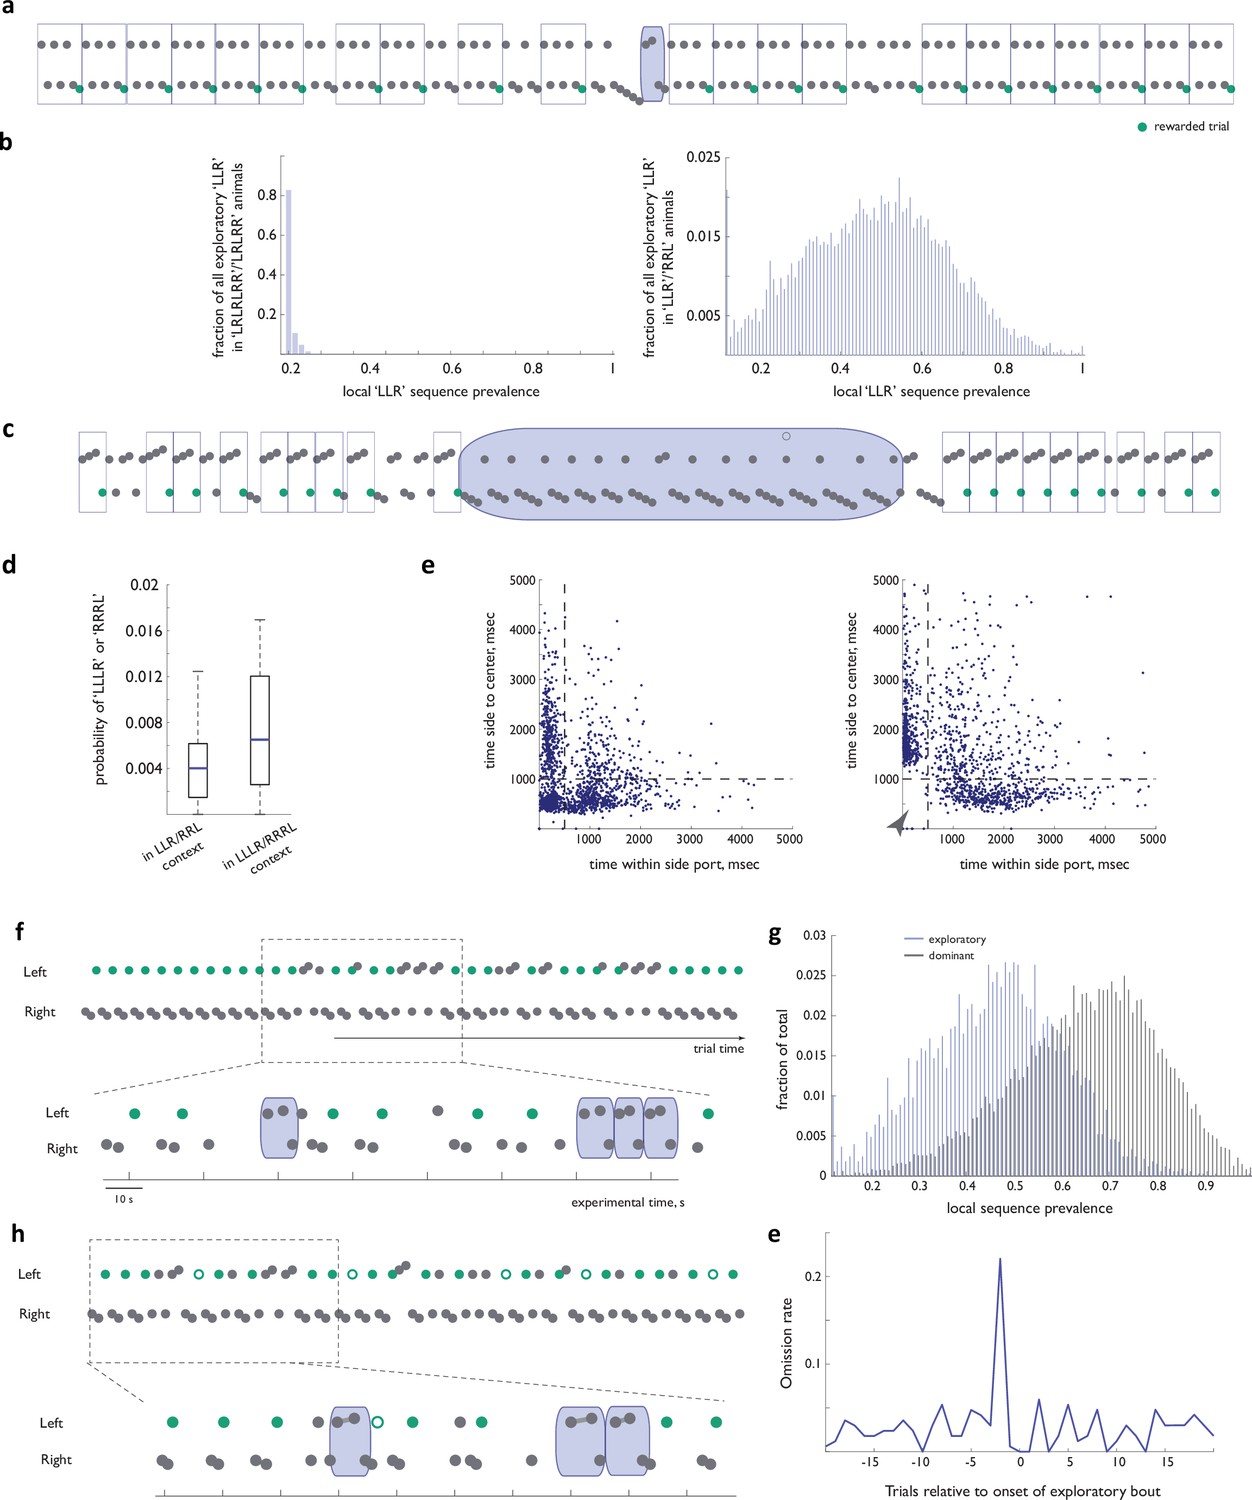
Deviations from the dominant sequence contain explorations of previously reinforced alternatives.
(a) Example behavioral trace from an animal trained on ‘LRLRLRR’ (and ‘LRLRR’) sequence that has never experienced ‘LLR’ as a latent target. Blue: a rare ‘LLR’ (b) Distribution of local sequence prevalence values for the ‘Left-Left-Right’ sequence across animals in the ‘(LR)nR’ group (left panel) and in deviations from the ‘RRL’ target in animals used in the present dataset (right panel). Note that if all deviations were mere errors of execution, we would expect to encounter ‘LLR’s in animals trained on (LR)nR with bout frequency that is on par with what we see in the dataset in this manuscript. (c) Example behavioral trace from an animal that acquired efficiency on ‘LLLR’ /’RRRL’ task after initial training on ‘LLR’/’RRL’. Note a pronounced bias in favor of longer sequences in the exploratory bout (blue). (d) Probability of ‘LLLR’ (or ‘RRRL’) in an off-target context before and after experience with ‘LLLR’/’RRRL’ as targets. (e) Side-to-center time vs within- side-port time distribution for all dominant sequence instances, for which reward was omitted. (left panel) step one in the sequence. (right panel) step three in the sequence. Note the conspicuous absence of short durations for the third sequence step (arrowhead). (f) Example behavioral trace from an animal that never experienced reward omission (i.e. the dominant sequence was always rewarded with 100% reliability) highlighting a mid-block transient exploratory bout. (g) Distribution of local sequence prevalence values for the ‘Left-Left-Right’ and ‘Right-Right-Left’ sequences across all dominant and exploratory instances in the dataset from the subset of the implanted animals that never experienced reward omission. (h) Example behavioral trace from an animal that experienced omission throughout training highlighting non omission-triggered exploration. (i) Omission rate as a function of distance from exploratory bout onset.
Figure 1—figure supplement 3
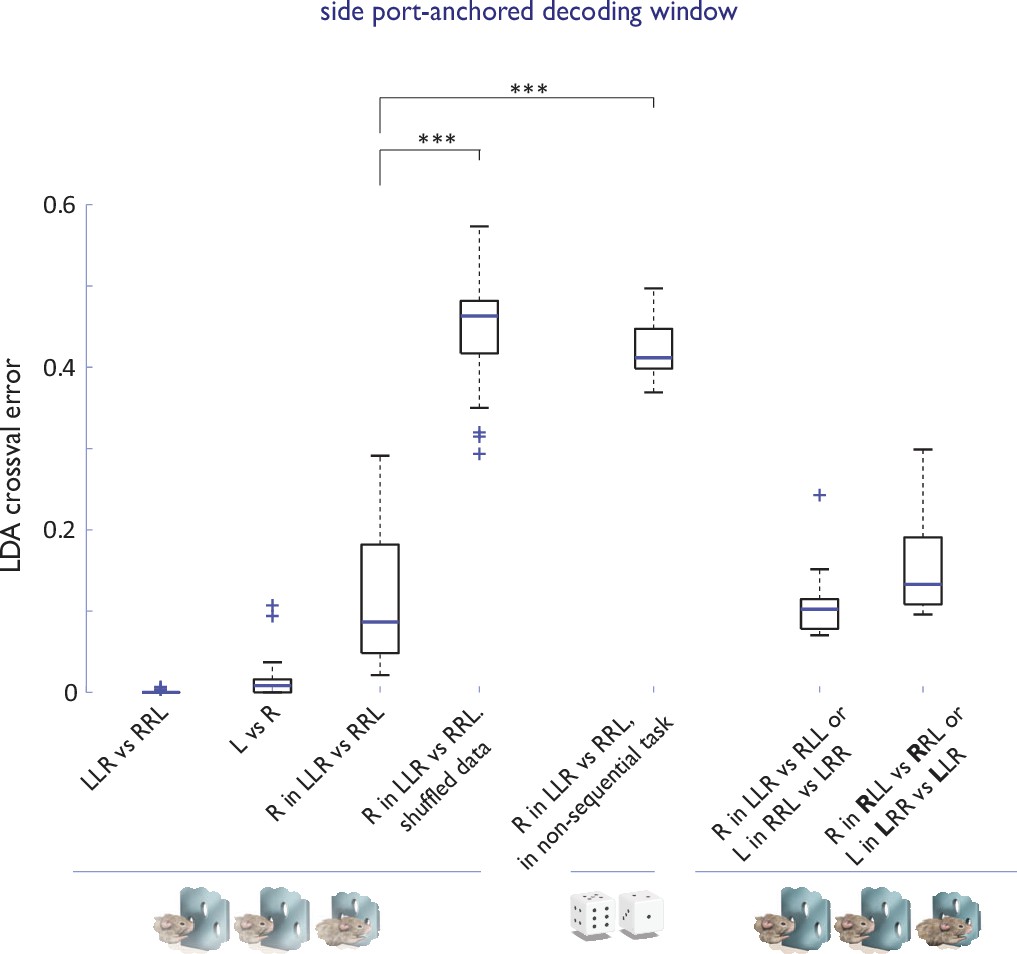
Strategy encoding in the ACC.
Cross-validated performance errors for linear classifiers trained to distinguish components of different strategies based on ACC neural activity in a decoding window anchored on side (choice) port entry. n=36 sessions, N=4 animals for all basic sequence task comparisons; n=9 sessions, N=3 animals for competitor sessions; n=11 sessions, N=1 animal for circularly permuted strategies; n=8 sessions, N=3 animals for 1st R in ‘RRL’ vs ‘RLL’ (or L in ‘LLR’ vs ‘LRR’ decoding). ***, p<0.001. Note that in the non-sequential task, animals were eligible to receive a reward at the chosen port only if their choice differed from that predicted by the computer (a virtual competitor) programmed to search the history of animal’s performance for behavioral patterns (Barraclough et al., 2004; Tervo et al., 2014). Our previous work had established that when challenged with a virtual competitor that they cannot defeat by counter-prediction, rats switch to a ‘stochastic’ mode, effectively abandoning strategic stringing together of individual choices into action sequences and making an independent choice on each trial (Tervo et al., 2014).
Figure 2
Activity of ACC neurons associated with a specific sequence of actions changes depending on whether that sequence represents the dominant strategy or is a transiently re-explored alternative.
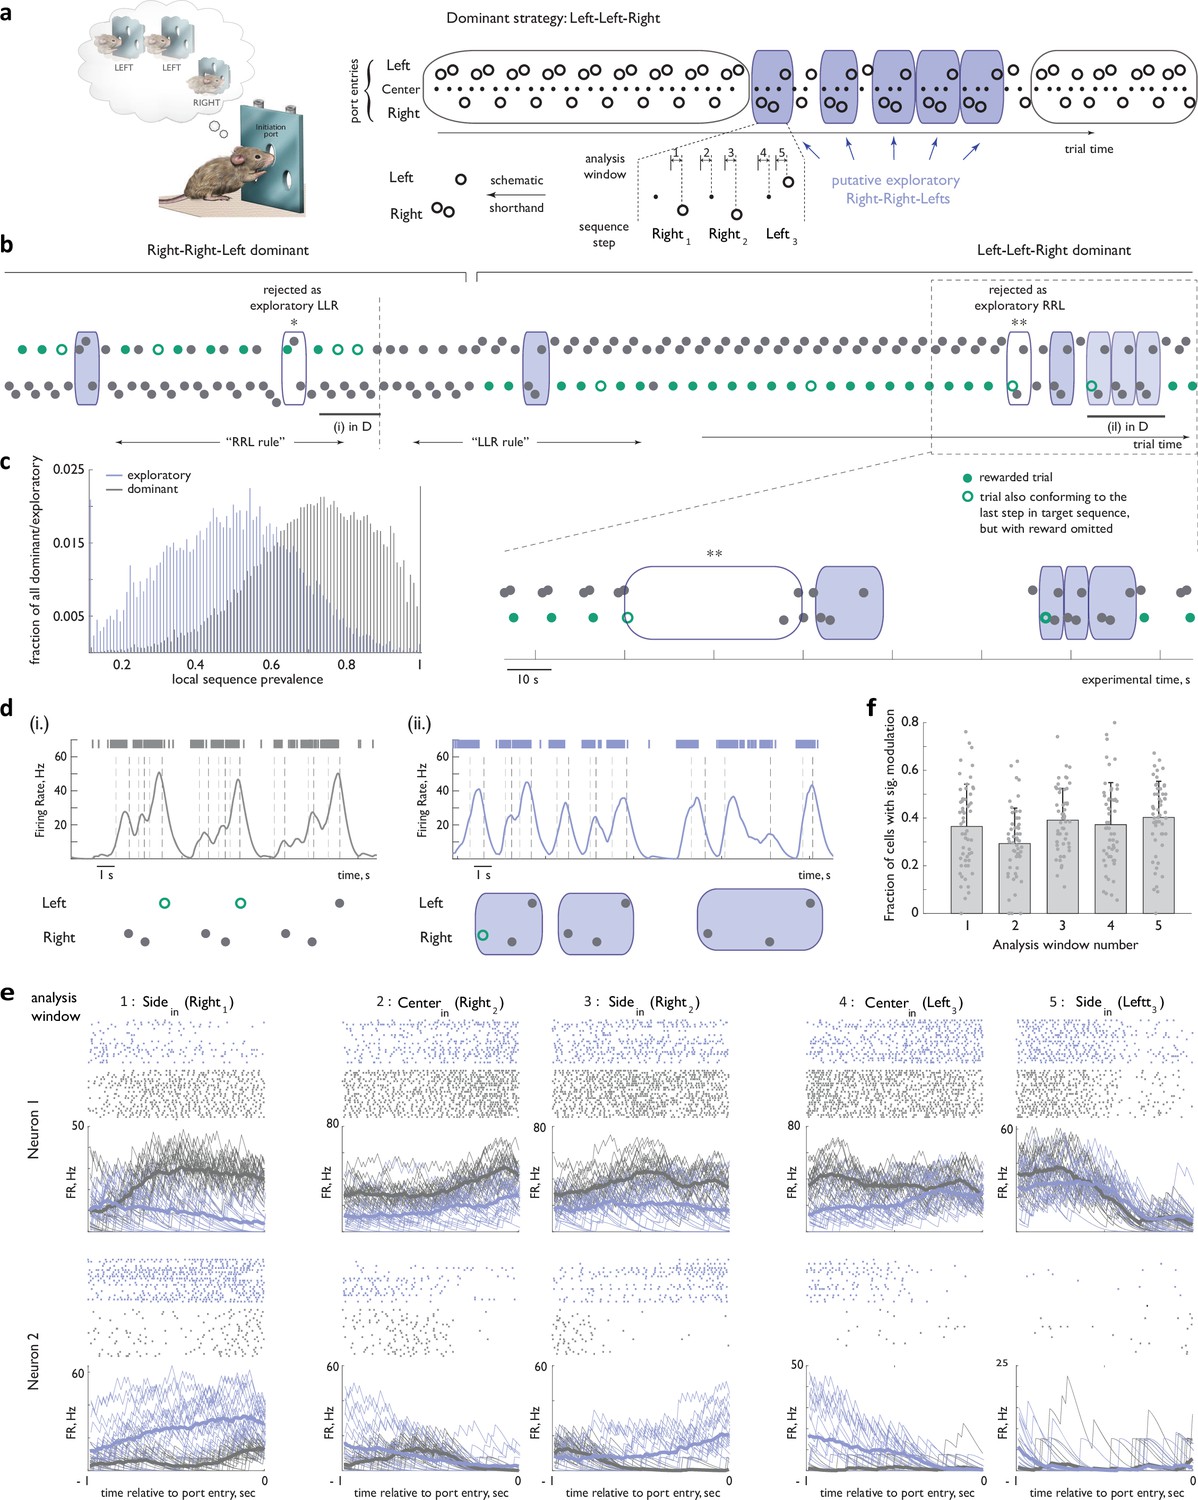
(a) Left panel: Concept of the behavioral task (same as in Figure 1). Right panel: (Top) Block-wise structure promoted the local pursuit of one dominant sequence (here, ‘Left-Left-Right’, as shown in the thought bubble) at the expense of others. The dominant strategy was occasionally interrupted by explorations of alternative sequences (here, likely ‘Right-Right-Left’, blue shading). (Bottom) Five analysis windows chosen to minimize trajectory confounds were anchored on center- and side-noseport entry events associated with each of the three steps in the sequence, with the exception of the first center port entry. The latter omission was chosen to minimize the contribution from feedback-related activity modulation associated with preceding choices. (b) Top panel: Sample behavioral trace, in trial time, around a block transition. Bottom panel: boxed region of the behavioral trace, in trial time. Note a marked preference at the beginning of the behavioral trace for ‘Right-Right-Left’ and at the end for ‘Left-Left-Right’. Putative exploratory sequences are shaded blue (see Methods for details about how exploratory sequences were identified). *, rejected as an exploratory sequence because it overlapped with the dominant sequence to its left, and did not have the temporal profile consistent with sequence marking (see text) to be rescued from the ‘discard’ group; **, rejected as a putative exploratory sequence because of an overlap with the dominant sequence to its left, and an unusually long break between putative steps 1 and 2. (c) Distribution of local sequence prevalence values for ‘Left-Left-Right’ and ‘Right-Right-Left’ across all dominant and exploratory instances in implanted animals. (d) Activity of an example ACC neuron for three concatenated unrewarded instances of ‘Right-Right-Left’ at the end of the dominant epoch in (b) (left panel) and during an exploratory bout following subsequent dominance of ‘Left-Left-Right’ (right panel). Dashed lines indicate beam breaks at port entries. Bars at the top of the panel: raw spike train. (e) Activity of two other ACC neurons from the behavioral session in (b), aligned in the five one-second analysis windows anchored on port entry events. Grey: dominant instances of ‘Right-Right-Left’ that followed an unrewarded ‘Right-Right-Left’. Blue: exploratory instances of ‘Right-Right-Left’. (f) Fraction of all recorded ACC units that displayed a significant modulation between ‘dominant’ and ‘exploratory’ contexts for each of the five analysis windows. Individual points correspond to different sessions. Error bars represent standard deviation. n=35 sessions, N=4 animals.
Figure 3 with 2 supplements
Representational transitions in ACC reflect large-scale functional reorganizations of the ACC network between inferred global behavioral contexts.
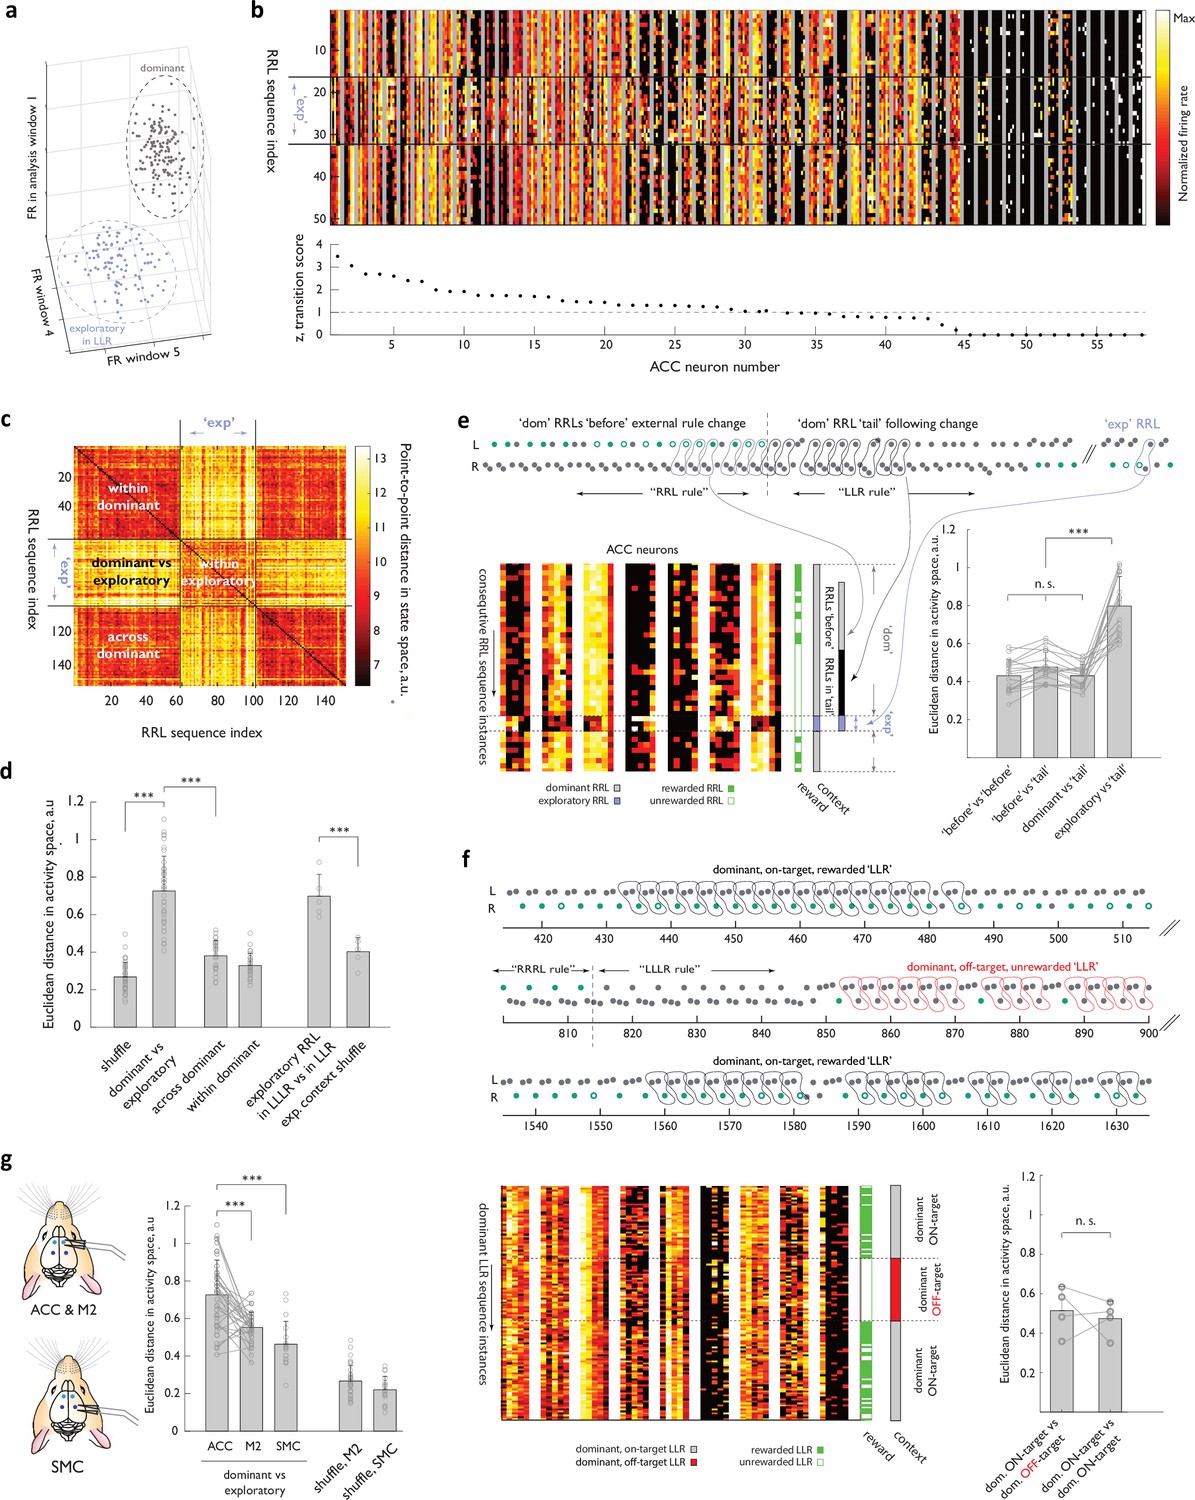
(a) Schematic of the activity state space for an individual neuron. Three of the five dimensions corresponding to the analysis windows are shown. Two clouds schematize activity of that neuron associated with a specific behavioral sequence for all dominant (grey) and exploratory (blue) instances of the sequence. (b) Heat map representations of normalized activity associated with ‘Right-Right-Left’ sequence execution of 58 simultaneously recorded ACC neurons. Different sequence instances are stacked vertically, with two ‘dominant’ blocks separated by a period when the ‘Right-Right-Left’ sequence was occasionally explored in the background of ‘Left-Left-Right’ dominance. ’exp’, ‘exploratory’ instances. Neurons are arranged according to a ‘transition score’ defined as the distance between the two cloud centroids normalized by root mean of variance within each cloud (see Methods). (c) Similarity matrix for an example session, comparing the ACC ensemble activity across ‘Right-Right-Left’ instance pairs, using Euclidean distance in the network state space. Black lines indicate the boundary between ‘dominant’ and ‘exploratory’ contexts. (d) Euclidean distance (RRL instance-to-instance) in the state space between the relevant ‘dominant’ and ‘exploratory’ clouds for the experimental ACC data, and for the control state space, where the labels of ‘dominant’ and ‘exploratory’ (or of the specific ‘exploratory’ context) were randomly shuffled across the dataset. n=35 sessions, N=4 ACC-implanted animals. (e) Behavior of the ACC ensemble during persistence of the dominant strategy past the unsignalled transition in the rewarded target.(Top panel) Example behavioral transition with a long dominant RRL ‘tail’. (Bottom left panel) Heat-map representation of the activity of 5 ACC cells for consecutive RRL instances before (i.e. when RRL dominance coincided with it being the rewarded target, ‘before’ in panel), during (when RRL continued to dominate the animal’s choices but the target sequence had changed, ‘tail’ in panel) and after the behavioral transition. Note that the later set of examples included several exploratory instances (executed much later, once another sequence had established dominance, ‘exp’ in the panel), as well as several of the subsequent instances of ‘dominant’ RRL later in the session. ‘exp’, ‘exploratory; ‘dom’, ‘dominant’. (Bottom right panel) RRL instance-to-instance Euclidean distance in the state space across these distinct epochs for all long ‘dominant tail’ examples. n=12 sessions, N=4 animals. (f) Behavior of the ACC ensemble during ‘ON-target’ and ‘OFF-target’ persistence with a dominant ‘LLR’ sequence. (Top panel) Example behavioral trace from two ‘ON-target’ epochs and one ‘OFF-target’ epoch within the same behavioral session. Note that the animal had responded to a block change and adjusted his strategy before settling into an ‘OFF-target’ persistence with ‘LLR’ (middle epoch). (Bottom left panel) Heat-map representation of the activity of nine ACC cells for LLR instances in the three epochs. (Bottom right panel) Instance-to-instance Euclidean distance in the state space between an ‘ON’ and ‘OFF’ contexts and between two ‘ON’ contexts. n=4 sessions, N=2 animals. (g) Euclidean distance between the centroids of the ‘dominant’ and ‘exploratory’ clouds for the experimental ACC, M2, and SMC data, and for the control state spaces, where the labels of ‘dominant’ and ‘exploratory’ were randomly shuffled across the dataset. n=37 sessions, N=4 ACC/M2 -implanted animals; n=18 sessions, N=3 SMC-implanted animals. Error bars represent standard deviation. n.s., not significant, ***, p<0.001.
Figure 3—figure supplement 1
Behavior at block transitions is not a function of reinforcement.
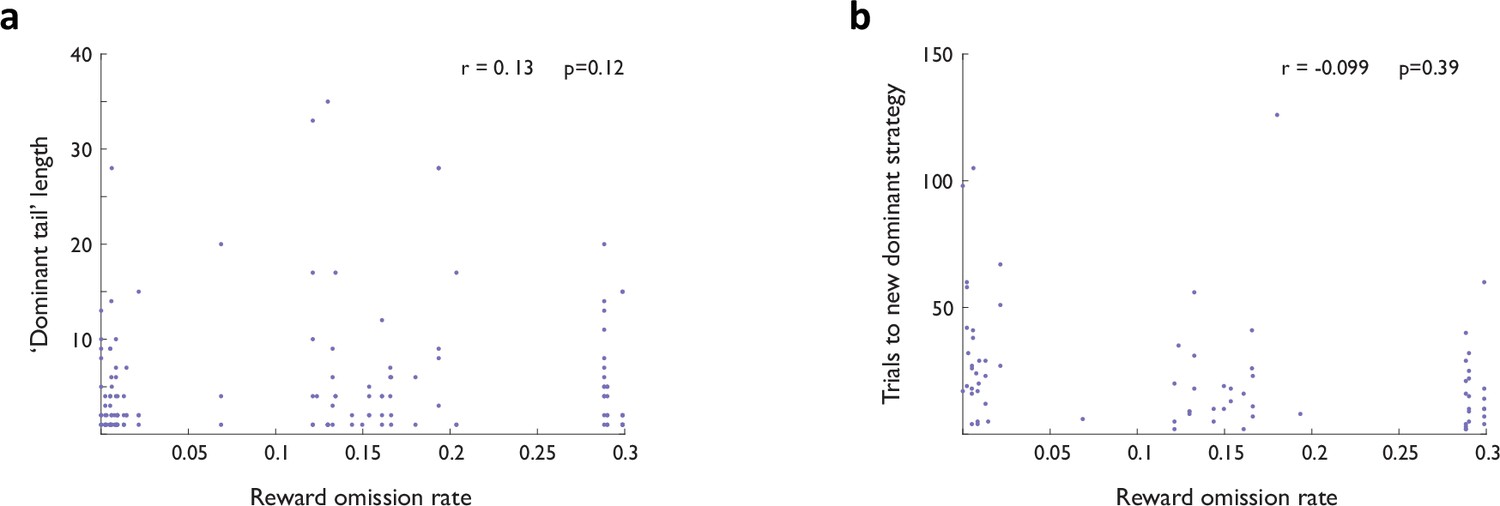
(a) Length of ‘dominant tails’ as a function of reward omission rate. (b) Number of trials until a new dominant strategy is established as a function of reward omission rate.
Figure 3—figure supplement 2
Representational transitions are less prominent in the caudal portion of the medial frontal lobe.
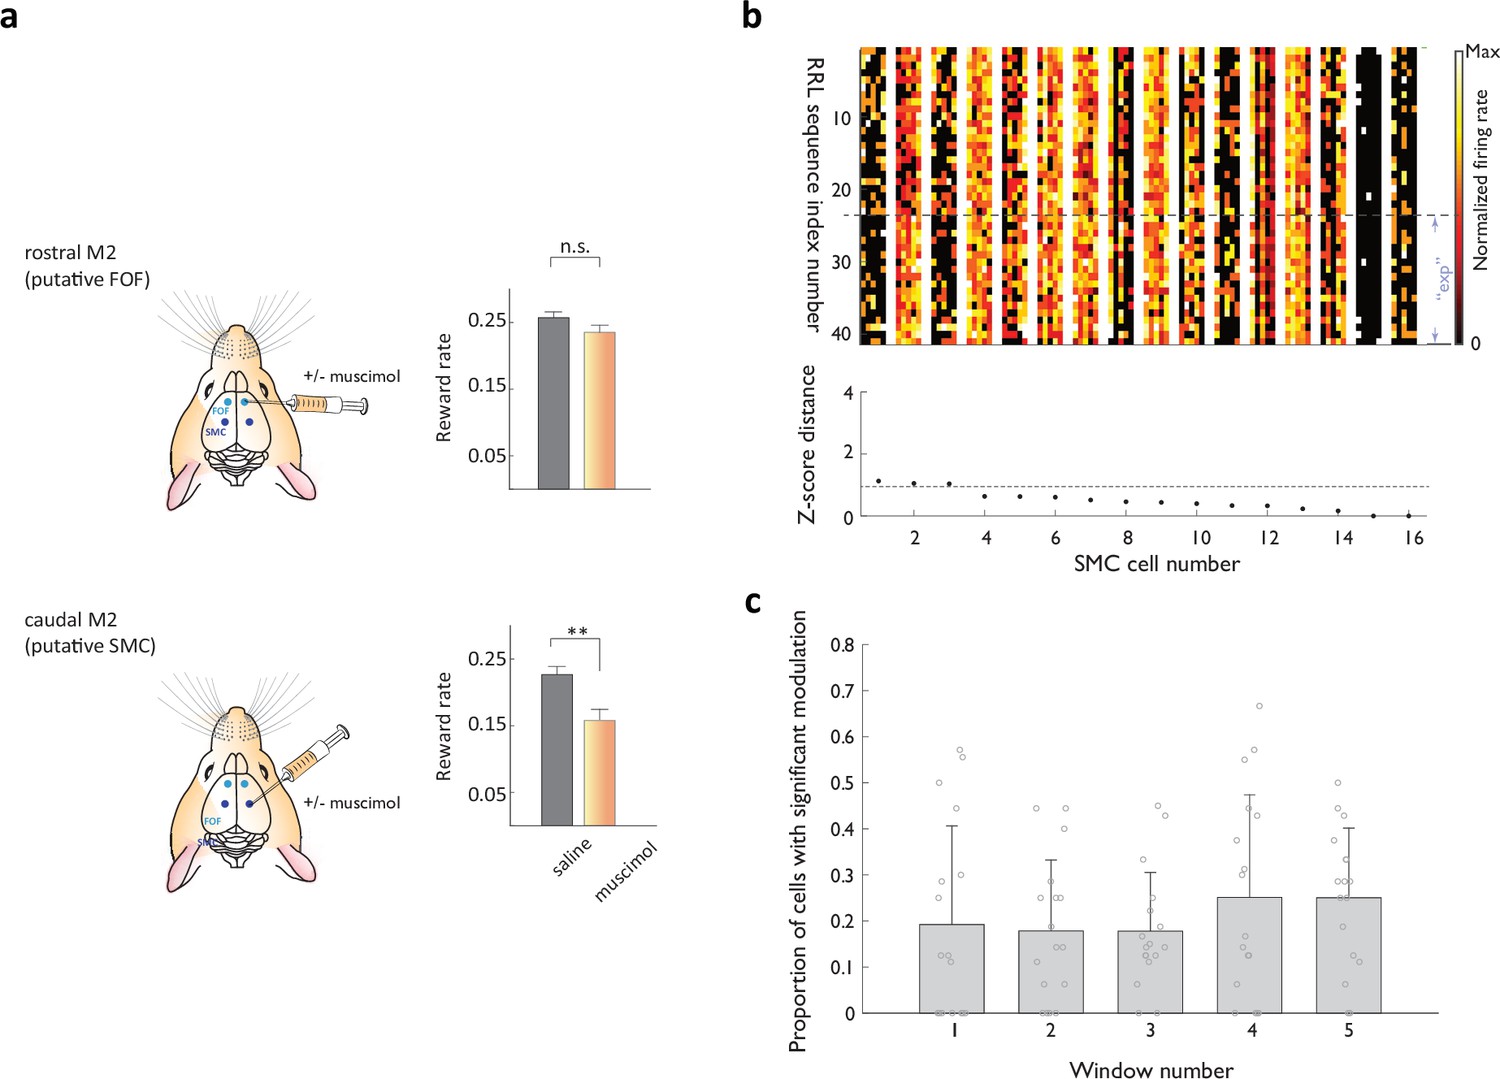
(a) Pharmacological inactivation of a putative rat homologue of the Supplementary Motor Cortex (SMC) impairs self-guided higher order action sequencing. Left panels: schematic of muscimol delivery to the rostral part of agranular secondary motor cortex M2, putatively FOF (top), or posterior part of M2, putatively SMC (bottom). Right panels: Performance on the self-guided sequence task (as average reward rate) during saline and muscimol injections in the target region. Animals sample the ‘non-preferred’ option irrespective of the relative reward rate. Note that the basic sequencing of actions pairing initiation port and side port entries to complete a trial is not impaired when the putative rat SMC is inactivated. (b) Heat map representations of normalized activity associated with ‘Right-Right-Left’ sequence execution for 16 simultaneously recorded SMC neurons. Activity profiles across different sequence instances are stacked vertically. ‘exp’- ‘exploratory’ instances. Neurons are arranged according to a ‘transition score’ defined as the distance between the two cloud centroids normalized by root mean of variance within each cloud. Transition score range reflected on the plot was chosen to match that in Figure 3b. (c) Fraction of SMC neurons displaying significant context-related transition in each of the five analysis windows.
Figure 4 with 3 supplements
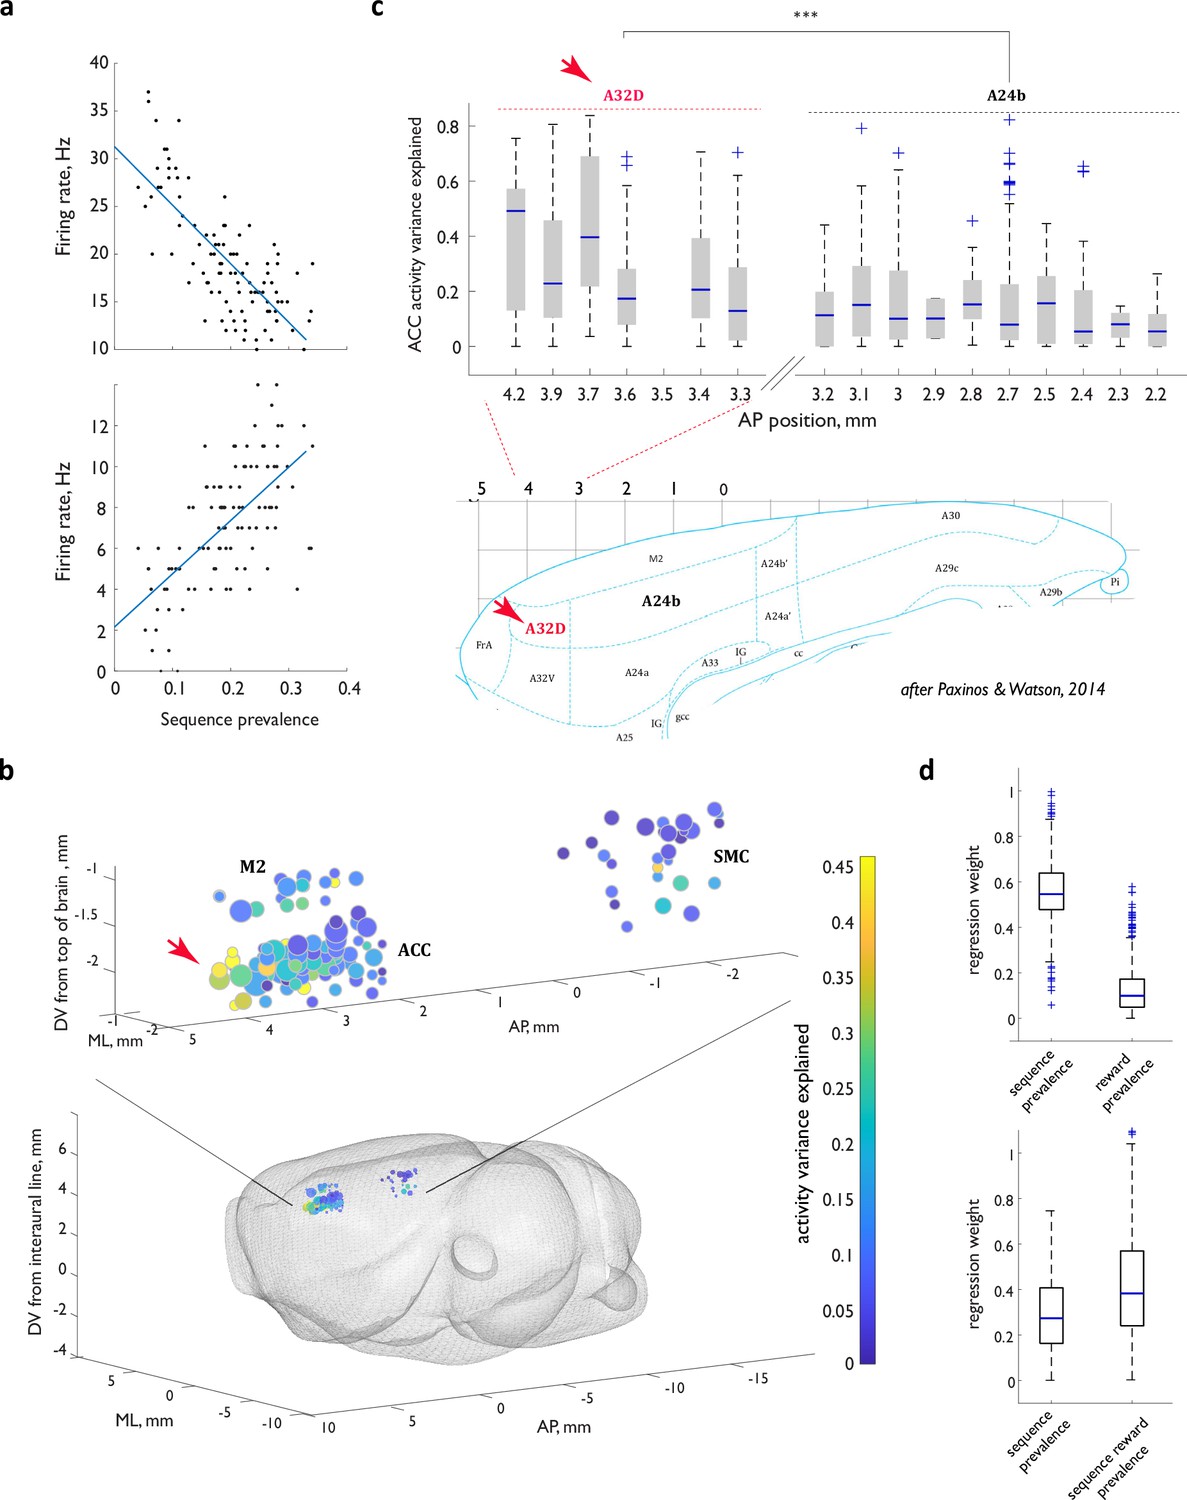
Activity of ACC neurons during sequence execution is markedly shaped by the local prevalence of the executed sequence.
(a) Firing rates as a function of local sequence prevalence for two example ACC neurons. (b) Graphic representation of the explanatory power of the linear model across the spatial extent of the recording locations. (c) Top panel: explanatory power in the rostral portion of the cingulate as a function of location along the anterior- posterior axis. Bottom panel: refence rat brain atlas section. Red arrow in (b, c) points to a cluster of the particularly strong model performance in the rostral portion of the cingulate that maps to the region homologous to the primate area 32D. (d) Regression weights for the expanded linear models that relate ACC neuron FR rates to not only sequence prevalence but also general reward prevalence (upper panel) or sequence-specific reward prevalence (lower panel). For all box-and-whisker plots, central blue line indicates the median, the bottom and top edges of the box indicate the 25th and 75th percentiles, respectively, and the whiskers extend to the most extreme data points not considered outliers. n.s., not significant; **, p<0.01; ***, p<0.001.
Figure 4—figure supplement 1
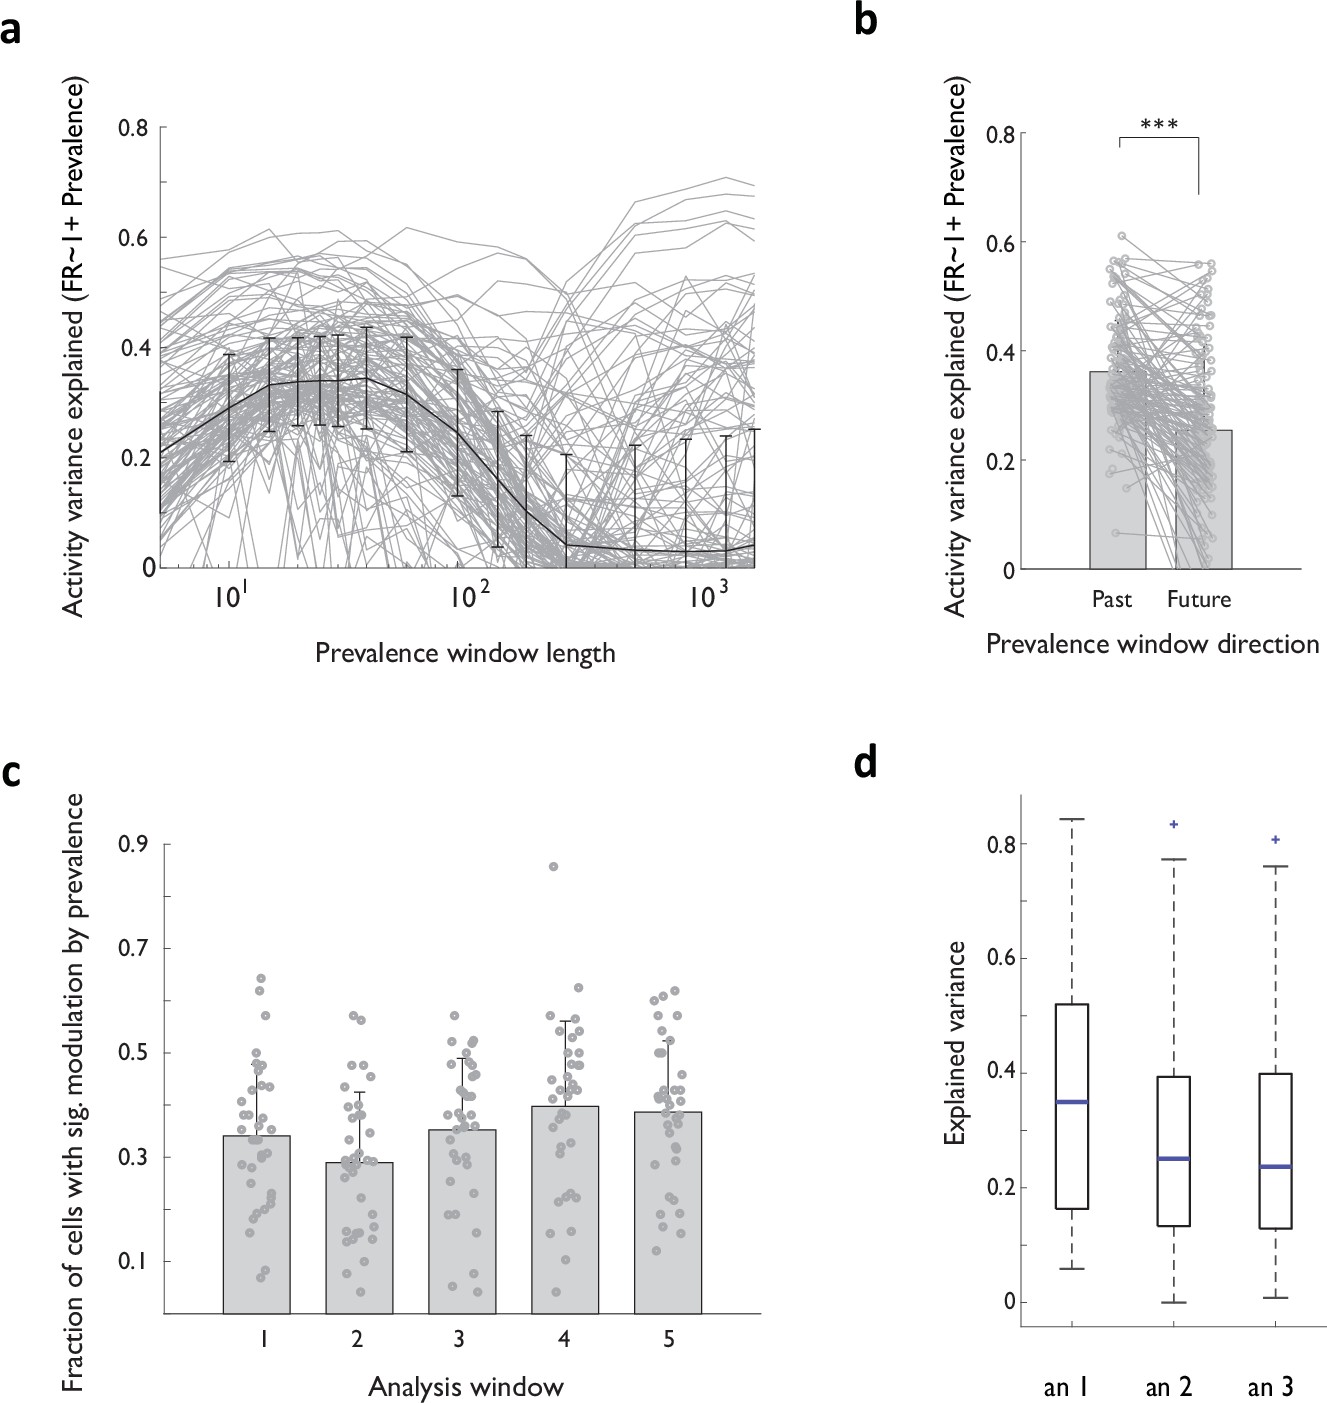
Modulation of ACC activity is best explained by prevalence in recent (within tens of trials) past, robust across analysis windows and animals.
(a) Explained variance in neural activity associated with RRL sequence execution – for models without context as a parameter – as a function of the number of trials in recent past used to estimate local RRL sequence prevalence. (b) Explained variance in neural activity associated with RRL sequence execution for models that use local sequence prevalence in recent past (Past) or in the equivalent upcoming period (Future). (c) Fraction of all recorded ACC units displaying a significant modulation by sequence prevalence for each of the five analysis windows. (d) Explained variance of A32D neural activity during sequence execution in 3 animals. Ensemble size: 16 (an 1), 73 (an 2), 128 (an 3).
Figure 4—figure supplement 2
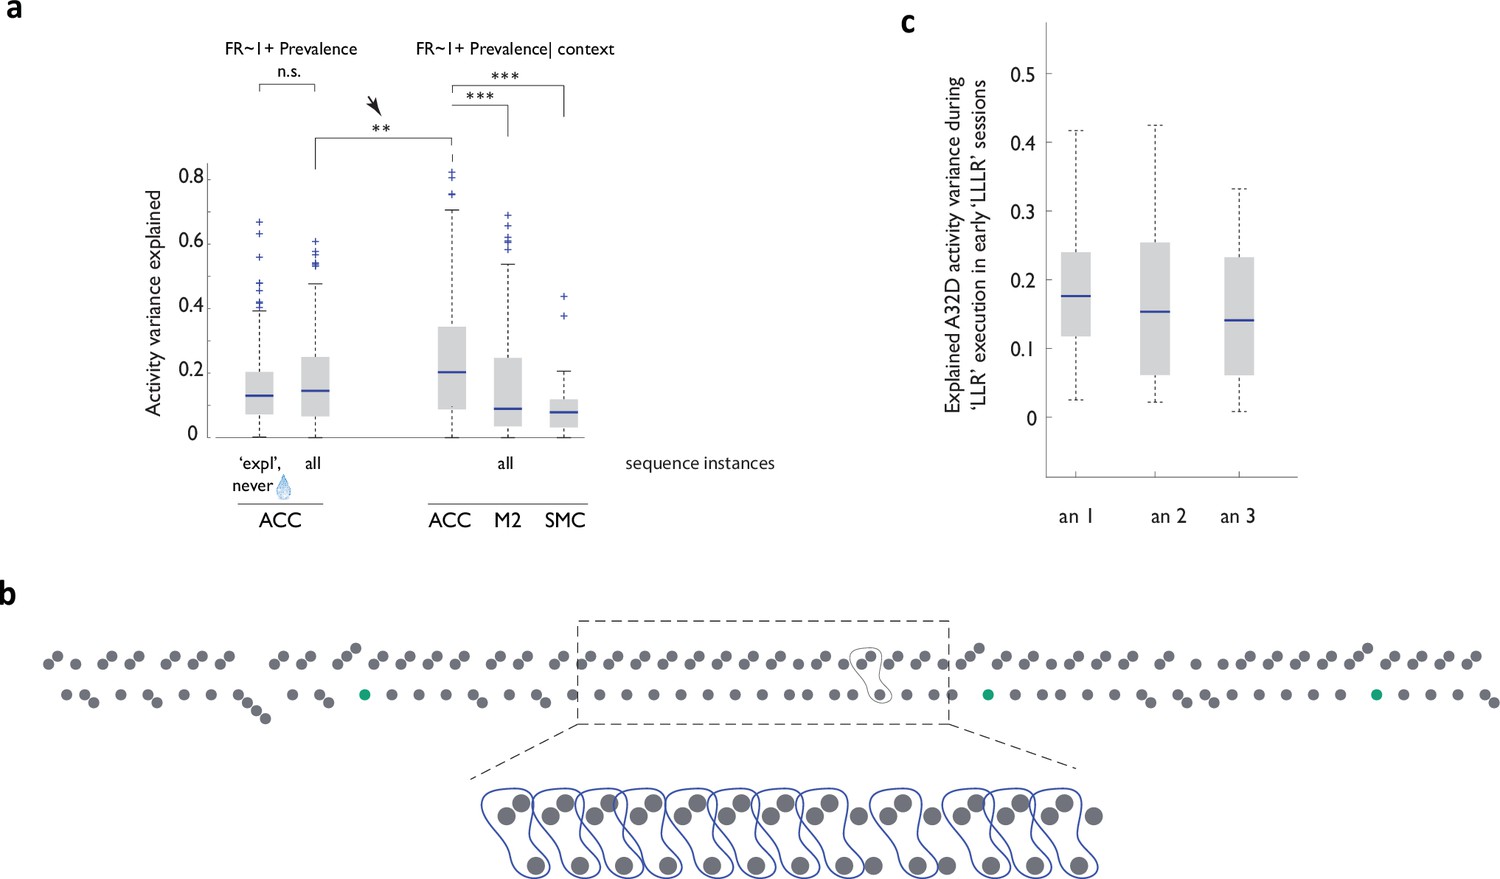
Models relating neural activity to strategy prevalence retain robustness when trained on unrewarded sequence instances and display more robust performance in ACC than in other areas of the medial frontal lobe.
(a) Cross-validated performance of linear models relating local sequence prevalence (with and without global context – ‘exploratory’ or ‘dominant’ as a fixed parameter) to ACC, M2 and SMC neural activity. exp, fit done for exploratory sequence instances only; all, fits done for all sequence instances. Arrow points to improved performance when global context is included as a parameter. (b) Example behavioral trace in an early ‘LLLR’ acquisition session. Notice persistence with the unrewarded cognate shorter sequence, ‘LLR’. (c) ACC A32D activity variance explained by unrewarded ‘LLR’ (or ‘RRL’) sequence prevalence in early ‘LLLR’/’RRRL’ acquisition sessions from three animals.
Figure 4—figure supplement 3
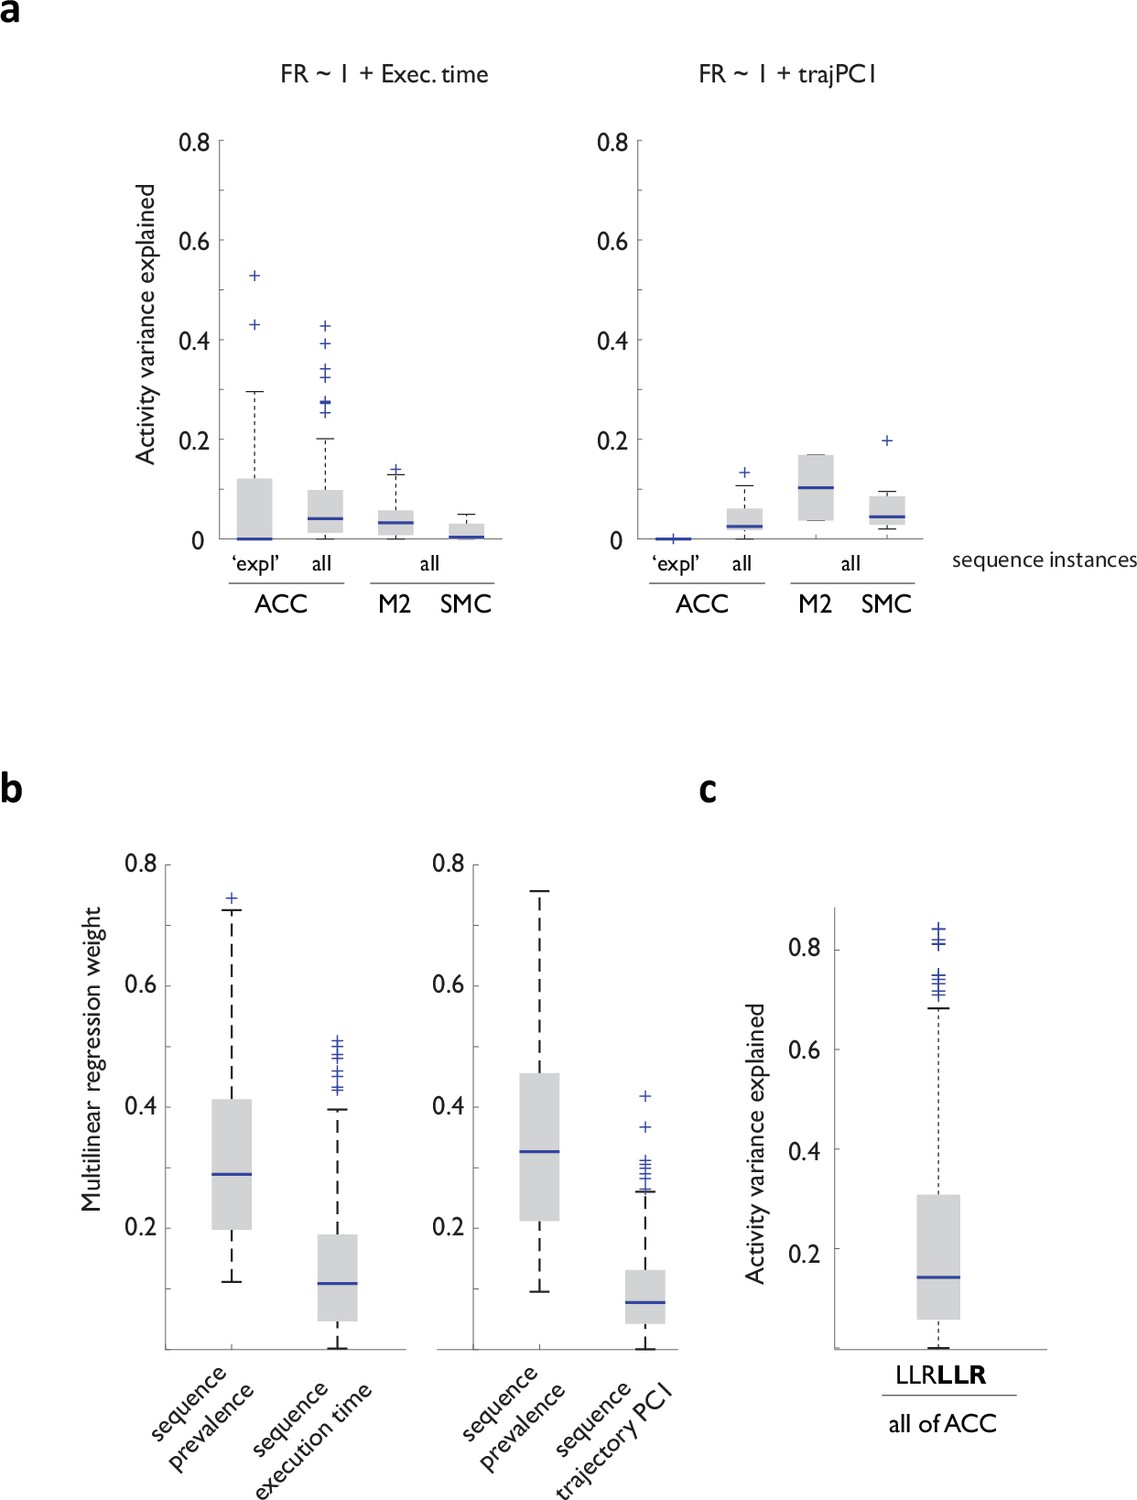
Variance of movement vigor and trajectory, or local differences in other past choices cannot account for the robustness of sequence prevalence models in explaining ACC neural activity variance.
(a) Cross-validated performance of linear models relating sequence execution time (left) or the first principal component of the associated trajectory (right) to ACC, M2, and SMC neural activity. (b) Regression weights obtained when the linear model relating sequence prevalence to firing rate was expanded to include either sequence execution time (left) or the first principal component of the associated trajectory for the dataset from area A32D. Note that to permit direct weight comparison, all parameters were z-score normalized to zero mean and standard deviation of 1 prior to fitting the model. (c) Cross-validated performance of the prevalence model trained on a subsample of the dataset matched in recent history.
Figure 5 with 1 supplement
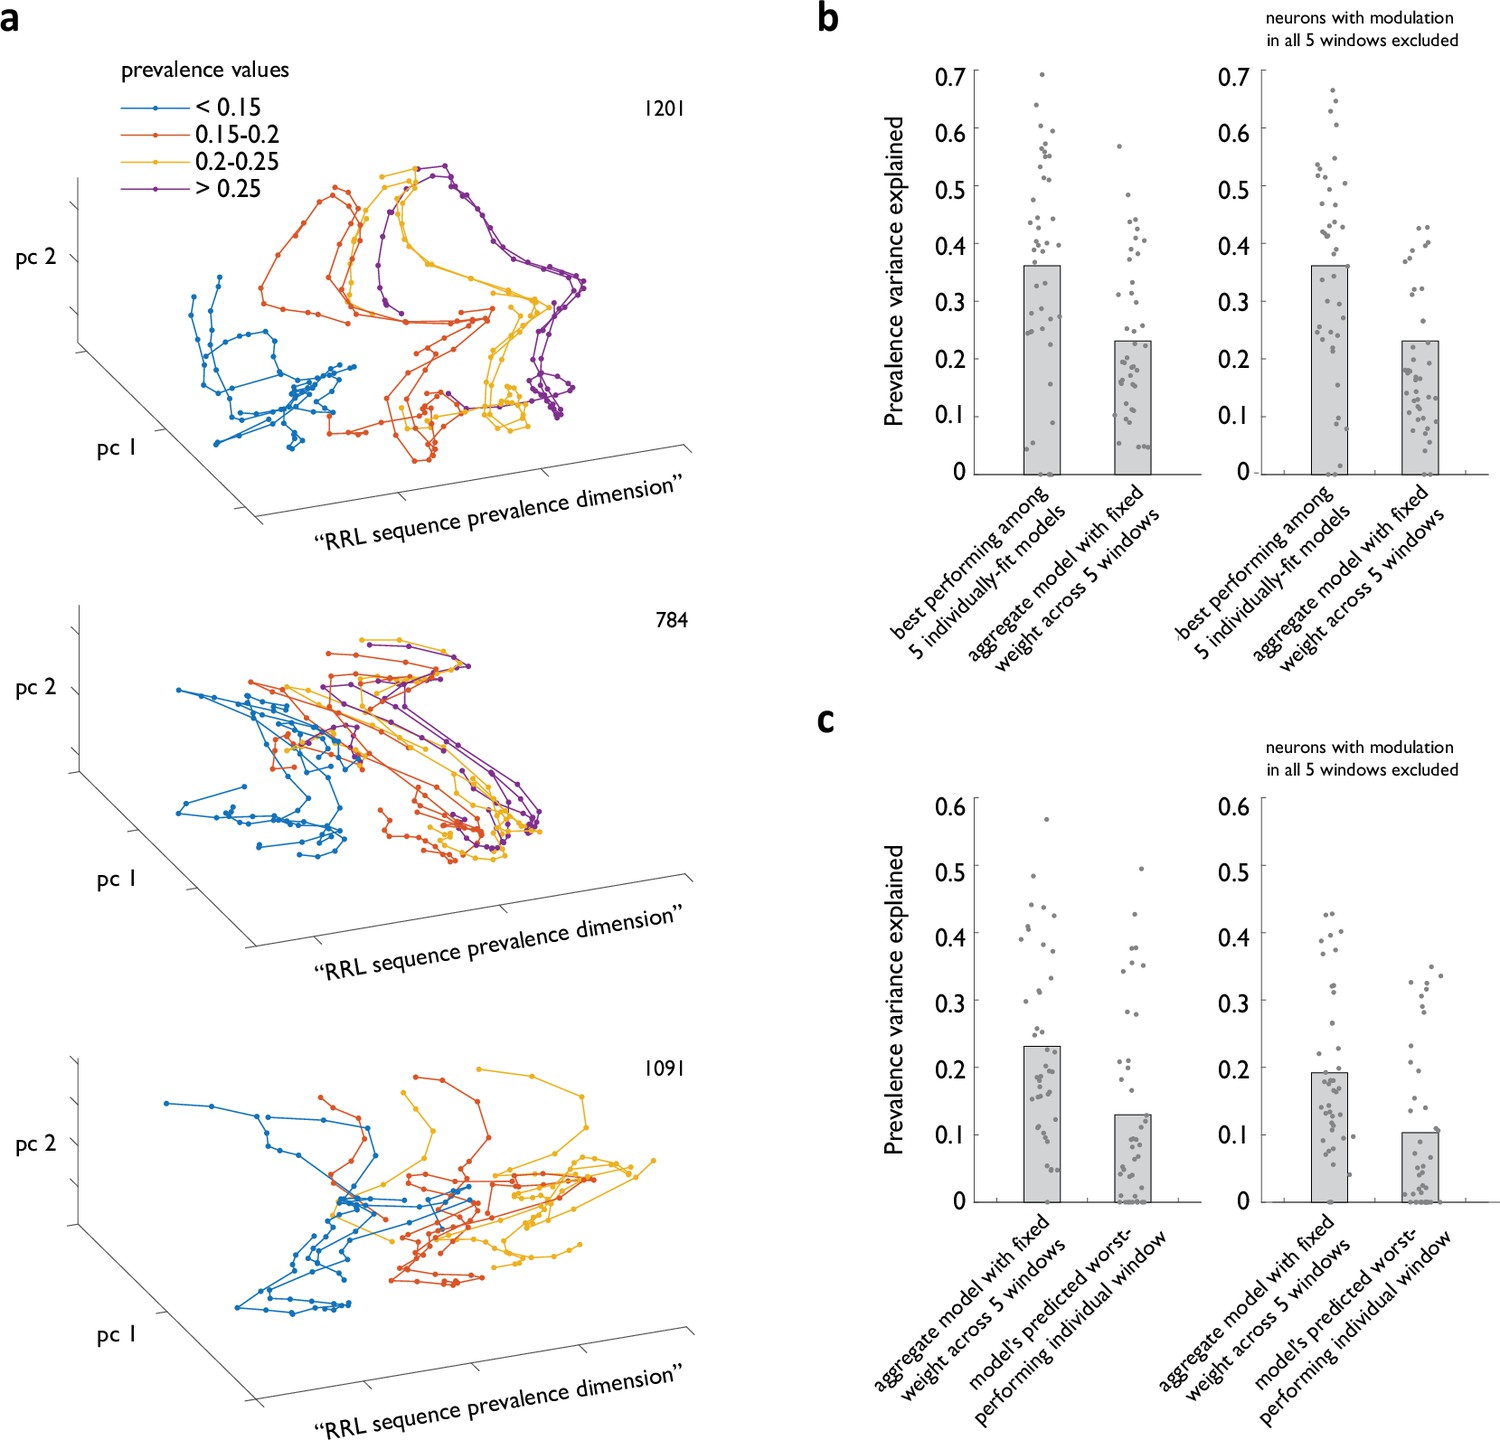
Strategy prevalence can be decoded from ACC ensemble activity throughout sequence execution.
(a) Examples from three different animals of ACC ensemble trajectories associated with different instances of RRL sequence execution visualized in ensemble state subspace chosen to maximize separation by local sequence prevalence. (b) Cross-validated performance of linear models relating ACC ensemble activity during RRL execution to local RRL prevalence. Shown are the performance of best of five models fit in individual analysis windows (b), the average performance of model that was constrained to always use the same weight for any given neuron in all five windows (b, c), and that model’s worst predicted performance in an individual analysis window (c). Right panels exclude from all models ACC neurons that show significant modulation by strategy prevalence in all five analysis windows.
Figure 5—figure supplement 1
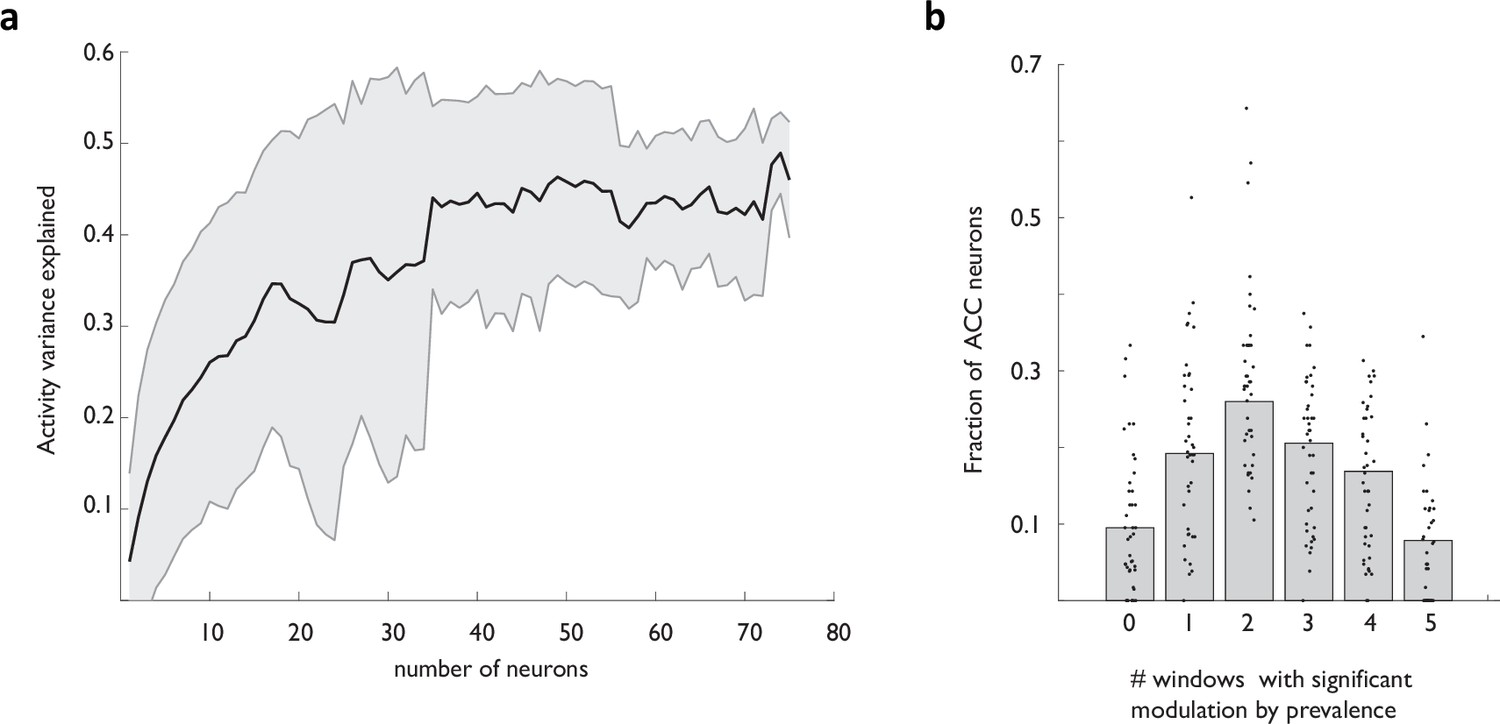
Prevalence decodability scales with the ACC ensemble size, but rarely persists throughout the temporal extent of strategy execution at the single neuron level.
(a) Explained variance of prevalence (estimated using the 20-trial window of past choices) as a function of the size of the ACC ensemble. (b) Fraction of ACC neurons displaying modulation in a specific subset of the five analysis windows.
Author response image 1
Additional files
Download links
A two-part list of links to download the article, or parts of the article, in various formats.
Downloads (link to download the article as PDF)
Open citations (links to open the citations from this article in various online reference manager services)
Cite this article (links to download the citations from this article in formats compatible with various reference manager tools)
ACC neural ensemble dynamics are structured by strategy prevalence
eLife 12:e84897.
https://doi.org/10.7554/eLife.84897


