The natural tannins oligomeric proanthocyanidins and punicalagin are potent inhibitors of infection by SARS-CoV-2
- Graduate Institute of Biomedical Sciences, China Medical University, Taiwan
- Research Center for Cancer Biology, China Medical University, Taiwan
- Department of Biological Science and Technology, College of Life Sciences, China Medical University, Taiwan
- Center for Molecular Medicine, China Medical University Hospital, China Medical University, Taiwan
- Departments of Laboratory Medicine and Internal Medicine, China Medical University Hospital, School of Medicine, China Medical University, Taiwan
- Department of Biomedical Imaging and Radiological Science, China Medical University, Taiwan
- Neuroscience and Brain Disease Center, China Medical University, Taiwan
- Institute of New Drug Development, China Medical University, Taiwan
- Cancer Biology and Precision Therapeutics Center, China Medical University, Taiwan
- Department of Biotechnology, Asia University, Taiwan
- Institute of Biochemistry and Molecular Biology, China Medical University, Taiwan
Figures
Figure 1
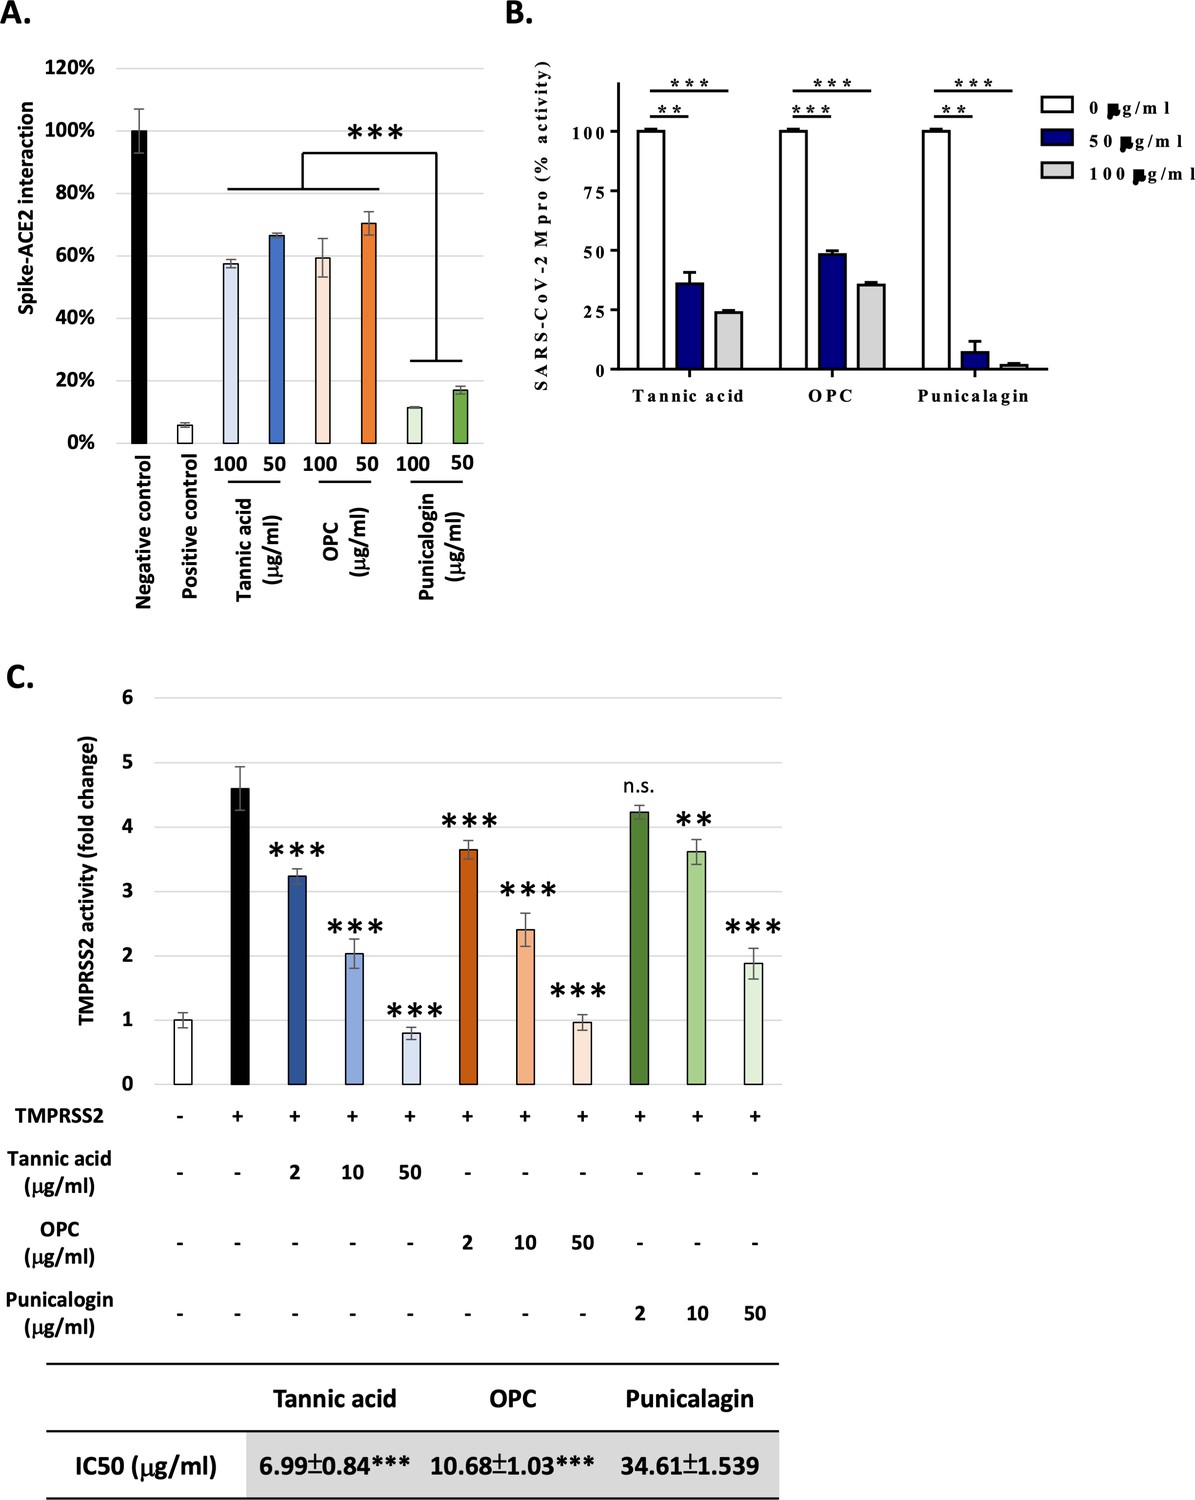
Punicalagin efficiently blocked ACE2–Spike protein interaction and repress the main protease activity, while tannic acid and oligomeric proanthocyanidins (OPC) had higher inhibition activity against TMPRSS2.
(A) The percentage of Spike–ACE2 interaction from ELISA-based assay is shown with the indicated concentration of tannic acid, OPCs, or punicalagin. All data are shown as mean ± SD (n = 3). The p-values are indicated by asterisks, ***p≤0.001.(B) The main protease enzymatic activity was measured using a FRET-based assay with the indicated concentration of tannic acid, OPCs, or punicalagin. All data are shown as mean ± SD (n = 3). The p-values are indicated by asterisks, **p≤0.01; ***p≤0.001. (C) The TMPRSS2 enzymatic activity in vivo was measured using a FRET-based assay with an increasing amount of tannic acid, OPCs, or punicalagin. All data are shown as mean ± SD (n = 3). The p-values are indicated by asterisks compared to TMPRSS22 alone group (black column). Extra-sum-of-squares F-test was performed to evaluate differences of IC50 of tannic acid or OPC compared to punicalagion. **p≤ 0.01; **p≤ 0.01; ***p≤0.001; n.s., no statistical significance.
-
Figure 1—source data 1
The table displays the inhibitory concentrations (IC50) of tannic acid, OPCs, and punicalagin for TMPRSS2 activity.
- https://cdn.elifesciences.org/articles/84899/elife-84899-fig1-data1-v1.xlsx
Figure 2
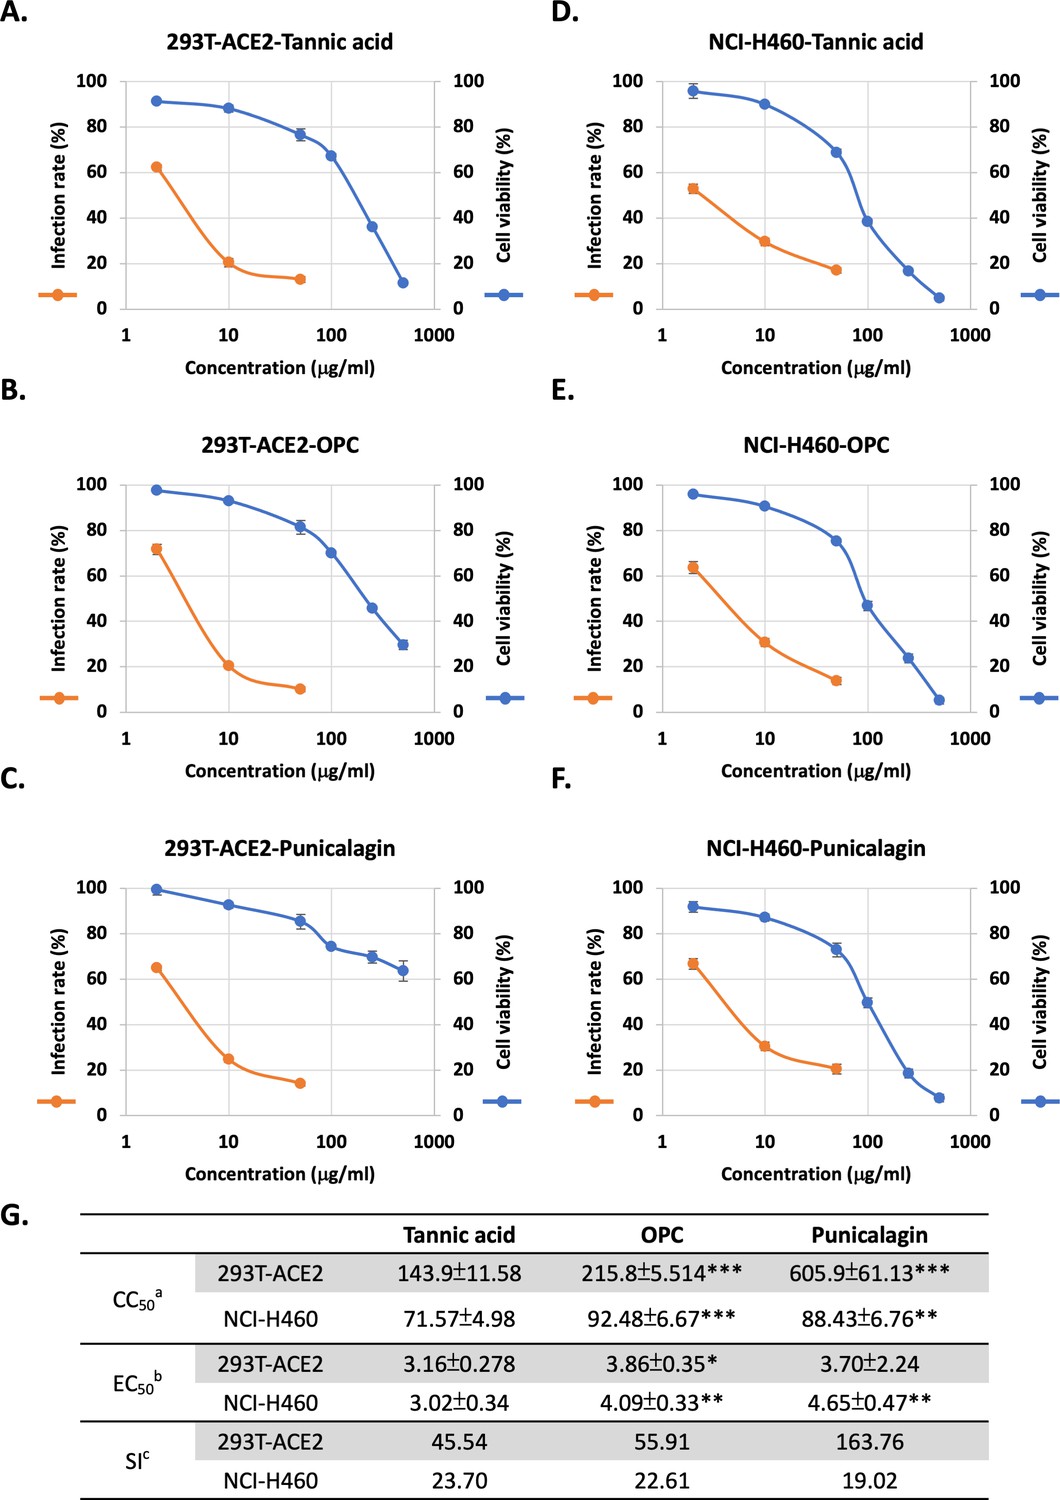
Three tannins could inhibit cell entry of Spike-viral pseudo-particles (Vpps) with low cytotoxicity in two cell lines.
(A–F) Orange line: 293T-ACE2 and NCI-H460 cells were pretreated with varying concentrations (2, 10, and 50 μg/ml) of tannic acid, oligomeric proanthocyanidins (OPCs), or punicalagin for 1 hr and infected with wild-type SARS-CoV-2 Spike Vpps. After 24 hr of infection, the infection efficiency rate was measured according to luciferase activities. Blue line: 293T-ACE2 and NCI-H460 cells were treated with different concentrations (2, 10, 50, 100, 250, and 500 μg/ml) of tannic acid, OPCs, or punicalagin, and cell viability was detected with MTT assay. All data are shown as mean ± SD (n = 3). (G) Antiviral activity of tannic acid, OPCs, and punicalagin against SARS-CoV-2 Vpps based on (A–F). aCC50 is the median cytotoxic concentration such as the dose causing 50% cell death. bEC50 is the half-maximal effective concentration such as the concentration of a compound required to inhibit SARS-CoV-2 infection by 50%. cSI is the safety index such as the ratio of CC50 to EC50. For CC50 and EC50, extra-sum-of-squares F-test was performed to evaluate differences of OPC or punicalagion compared to tannic acid. The p-values are indicated by asterisks, *p<0.05; **p≤0.01; ***p≤0.001.
-
Figure 2—source data 1
The table dispays the 50% cytotoxic concentration (CC50), 50% effective concentration (EC50), and selectivity index (SI) from the experiments in Figure 2A-F.
- https://cdn.elifesciences.org/articles/84899/elife-84899-fig2-data1-v1.xlsx
Figure 3
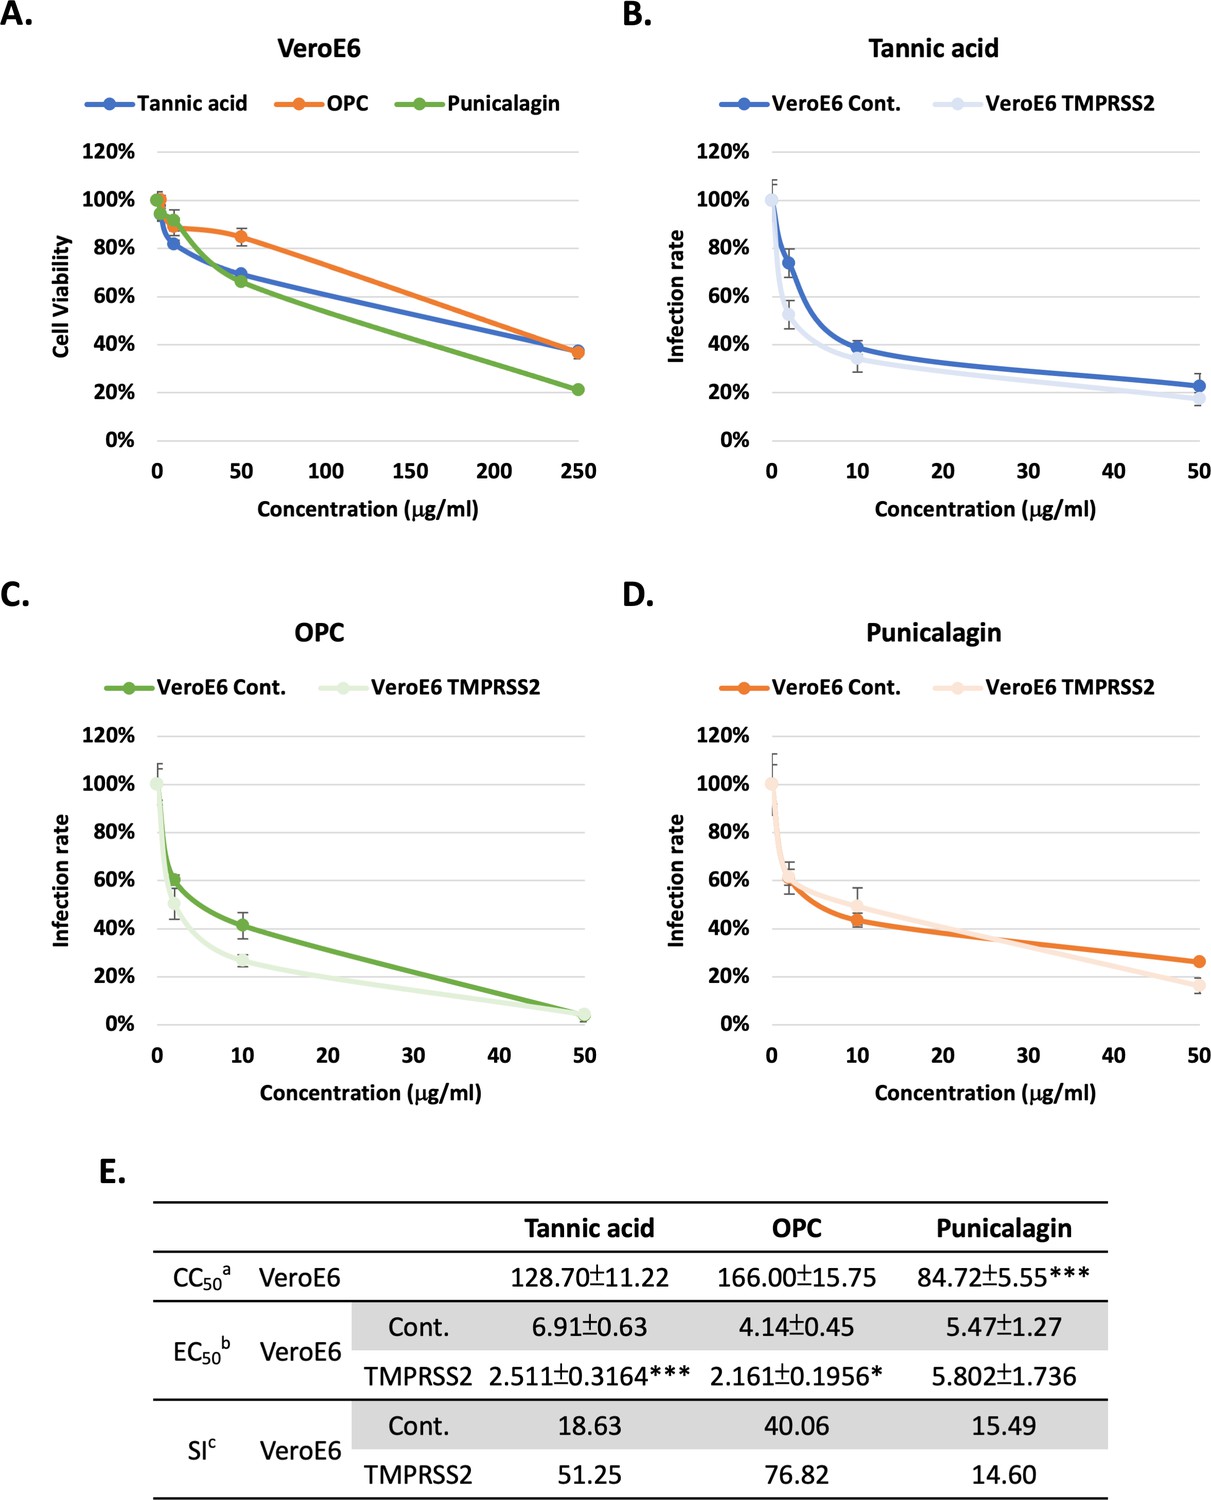
Tannic acid and oligomeric proanthocyanidins (OPC), but not punicalagin, had higher potency against viral pseudo-particles (Vpps) infection in the TMPRSS2-expressing cells.
(A) VeroE6 cells were treated with indicated concentrations (2, 10, 50, and 250 μg/ml) of tannic acid, OPCs, or punicalagin, and cell viability was detected with MTT assay. (B–D) VeroE6 cells with and without TMPRSS2 expression were pretreated with the indicated concentrations (2, 10, and 50 μg/ml) of tannic acid, OPCs, or punicalagin, and then infected with SARS-CoV-2 wild-type Spike Vpps. After 24 hr of infection, the infection efficiency rate was measured according to luciferase activities. All data are shown as mean ± SD (n = 3). (E) Antiviral activity of tannic acid, OPCs, and punicalagin against SARS-CoV-2 Vpps based on (A–D). aCC50 is the median cytotoxic concentration such as the dose causing 50% cell death. bEC50 is the half-maximal effective concentration such as the concentration of a compound required to inhibit SARS-CoV-2 infection by 50%. cSI is the safety index such as the ratio of CC50 to EC50. For CC50, extra-sum-of-squares F-test was performed to evaluate differences of OPC or punicalagion compared to tannic acid. For EC50, extra-sum-of-squares F-test was performed to evaluate differences of tannic acid, OPC, or punicalagin of overexperssing TMPRSS2 cells compared to control cells. The p-values are indicated by asterisks, *p<0.05; **p≤0.01; ***p≤0.001.
-
Figure 3—source data 1
The table dispays the 50% cytotoxic concentration (CC50), 50% effective concentration (EC50), and selectivity index (SI) from the experiments in Figure 3B-D.
- https://cdn.elifesciences.org/articles/84899/elife-84899-fig3-data1-v1.xlsx
Figure 4
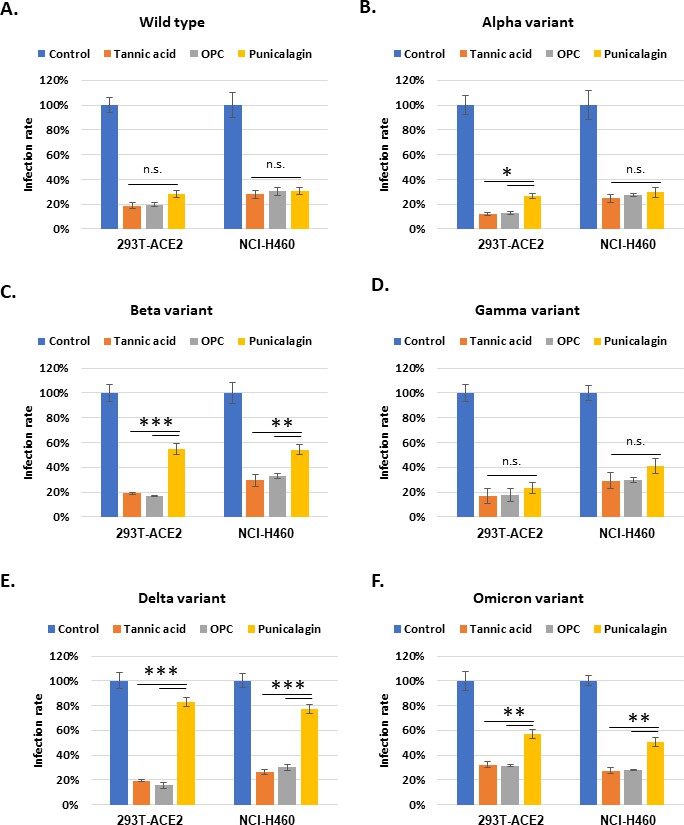
Tannic acid and oligomeric proanthocyanidins (OPCs), but not punicalagin, could maintain their inhibitory activity against different variants of viral pseudo-particles (Vpps) infection.
(A–F) 293T-ACE2 and NCI-H460 cells were pretreated with 10 mg/ml tannic acid, OPCs, or punicalagin for 1 hr and infected with SARS-CoV-2 spike Vpps of different variants. After 24 hr of infection, the infection efficiency rate was measured according to luciferase activities. All data are shown as mean ± SD (n = 3). The p-values are indicated by asterisks, *p<0.05; **p≤0.01; ***p≤0.001; n.s., no statistical significance.
Figure 5
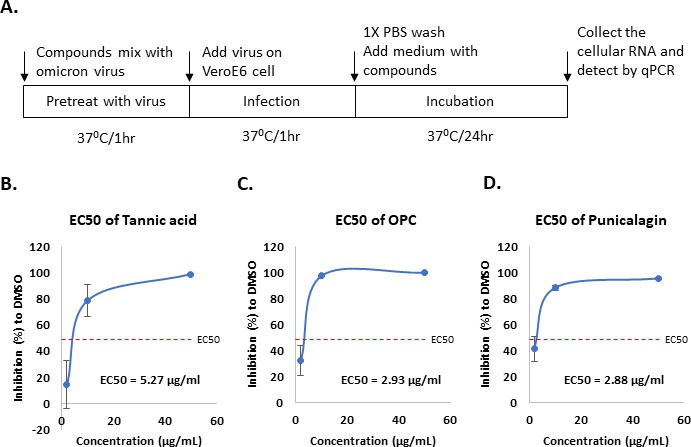
Oligomeric proanthocyanidins (OPC) and punicalagin could inhibit more effectively the infection of omicron virus compared to tannic acid.
(A) The schematic illustrates tannic acid, OPCs, or punicalagin treatment of VeroE6 cells infected with the SARS-CoV-2 omicron virus. First, viruses were premixed with tannic acid, OPCs, or punicalagin (2, 10, and 50 μg/ml) for 1 hr before incubation with cells. Cells were continuously treated with tannic acid, OPCs, or punicalagin (2, 10, and 50 μg/ml) after infection with virus mixture for another 1 hr. (B–D) The inhibition rate of tannic acid, OPCs, or punicalagin against the SARS-CoV2 omicron virus was normalized with vehicle control. All data are shown as mean ± SD (n = 3).
Figure 6
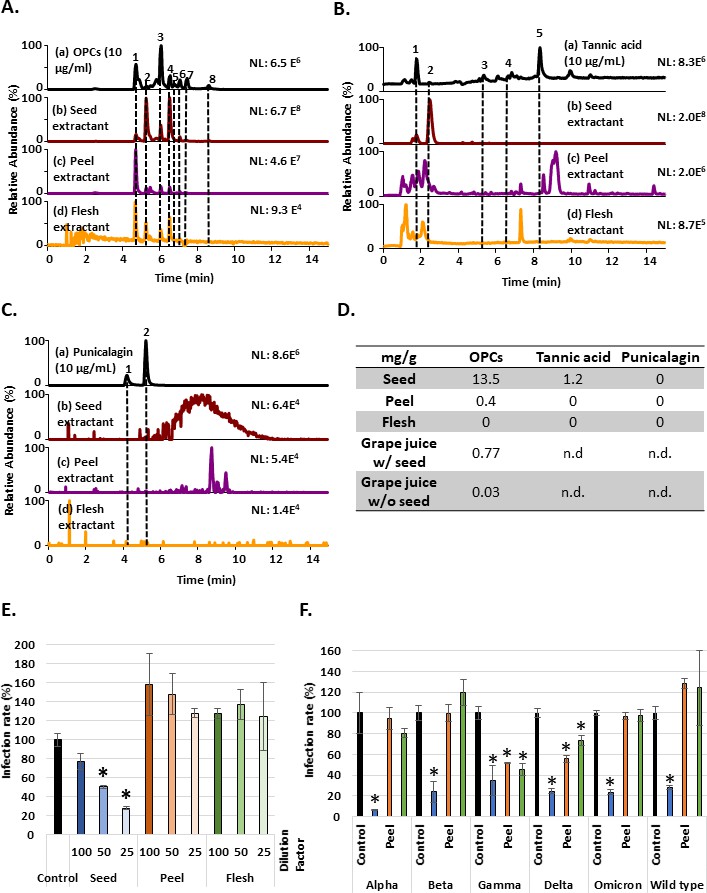
Grape seed extractant had the highest concentration of oligomeric proanthocyanidins (OPCs) and could inhibit the entry of wild-type and different variant Vpps.
(A) Mass ion chromatograms of (a) OPCs (10 μg/ml), (b) grape seed extractant, (c) grape peel extractant, and (d) grape flesh extractant. Peaks 1 and 3: dimer of catechins; peaks 2 and 4: catechins; peaks 5 and 7: dimer of catechin-catechin gallate; peak 6: trimer of catechins; peak 8: catechin gallate. (B) Mass ion chromatograms of (a) tannic acid (10 μg/ml), (b) grape seed extractant, (c) grape peel extractant, and (d) grape flesh extractant. Peak 1: gallic acid; peak 2: galloylglucose; peak 3: digalloylglucose; peak 4: trigalloylglucose; peak 5: tetragalloylglucose. (C) Mass ion chromatograms of (a) punicalagin (10 μg/ml), (b) grape seed extractant, (c) grape peel extractant, and (d) grape flesh extractant. Peak 1: α-punicalagin; peak 2: β-punicalagin. (D) Based on the mass ion chromatograms results, OPC and tannic acid concentrations (mg/g) of different parts of grape water extractant or grape juice were converted from the concentration of the standard chemicals. n.d., non-determination. (E) 293T-ACE2 cells were pretreated with a different dilution factor of grape seed, peel, or flesh extractants for 1 hr and infected with wild-type SARS-CoV-2 spike Vpps. After 24 hr of infection, the infection efficiency rate was measured according to luciferase activities. (F) 293T-ACE2 cells were pretreated with grape seed, peel, or flesh extractants for 1 hr and infected with different variants of SARS-CoV-2 spike Vpps. After 24 hr of infection, the infection efficiency rate was measured according to luciferase activities. All data are shown as mean ± SD (n = 3). The p-values are indicated by asterisks compared to the control group (black column), *p<0.05.
-
Figure 6—source data 1
The table displays the OPC and Ttannic acid concentrations (mg/g) of different parts of grape water extractant or grape juice converted from the concentrations of the standard chemicals based on the mass ion chromatogram results.
- https://cdn.elifesciences.org/articles/84899/elife-84899-fig6-data1-v1.xlsx
Figure 7
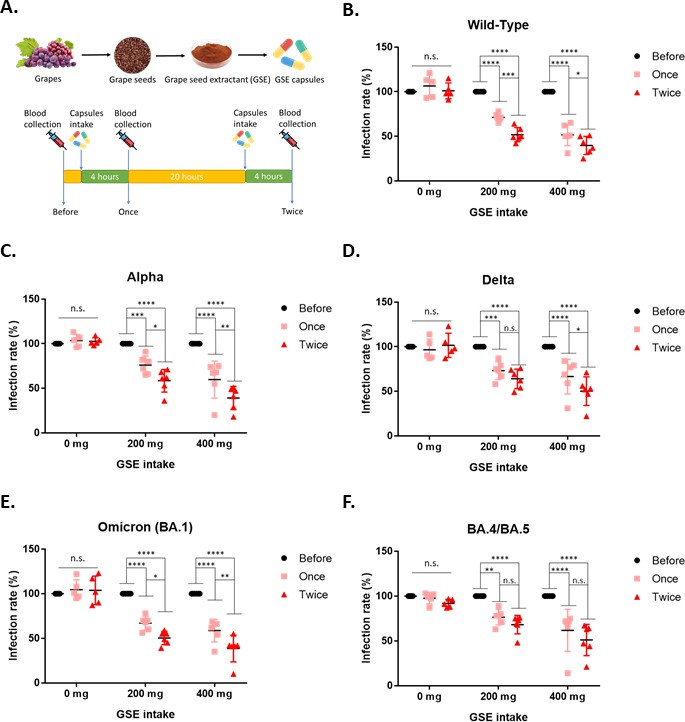
Serum from the human subjects who intake grape seed extractants had better potency to block the entry of wild-type and different variant Vpps.
(A). The schematic illustrates the timeline of blood collection. First, the baseline blood sample was collected before taking control or grape seed extract (GSE) capsules. After baseline blood sample collection, the human subjects were randomized to one of three groups to take the GSE capsule (200 mg or 400 mg), or the placebo and collected the blood at the indicated time. (B–F) Each serum sample from the human subjects was diluted 1/200 and premixed with wild-type or different variants of SARS-CoV-2 spike Vpps for 1 hr before incubation with 293T-ACE2 cells. After 24 hr of infection, the infection efficiency rate was measured according to luciferase activities. All data are shown as mean ± SD (n = 5). The p-values are indicated by asterisks, *p<0.05; **p≤0.01; ***p≤0.001; ****p≤0.0001; n.s., no statistical significance.
Additional files
Download links
A two-part list of links to download the article, or parts of the article, in various formats.
Downloads (link to download the article as PDF)
Open citations (links to open the citations from this article in various online reference manager services)
Cite this article (links to download the citations from this article in formats compatible with various reference manager tools)
The natural tannins oligomeric proanthocyanidins and punicalagin are potent inhibitors of infection by SARS-CoV-2
eLife 12:e84899.
https://doi.org/10.7554/eLife.84899


