How enhancers regulate wavelike gene expression patterns
- Division of Developmental Biology, Department of Biology, Friedrich-Alexander-Universität Erlangen-Nürnberg, Germany
- Buchmann Institute for Molecular Life Sciences (BMLS), Goethe Universität Frankfurt Am Main, Germany
- Optical Imaging Centre Erlangen (OICE), Friedrich-Alexander-Universität Erlangen-Nürnberg, Germany
- Institute of Biomedical Informatics, Graz University of Technology, Austria
- Department of Biology, University of Texas Rio Grande Valley, United States
Figures
Figure 1
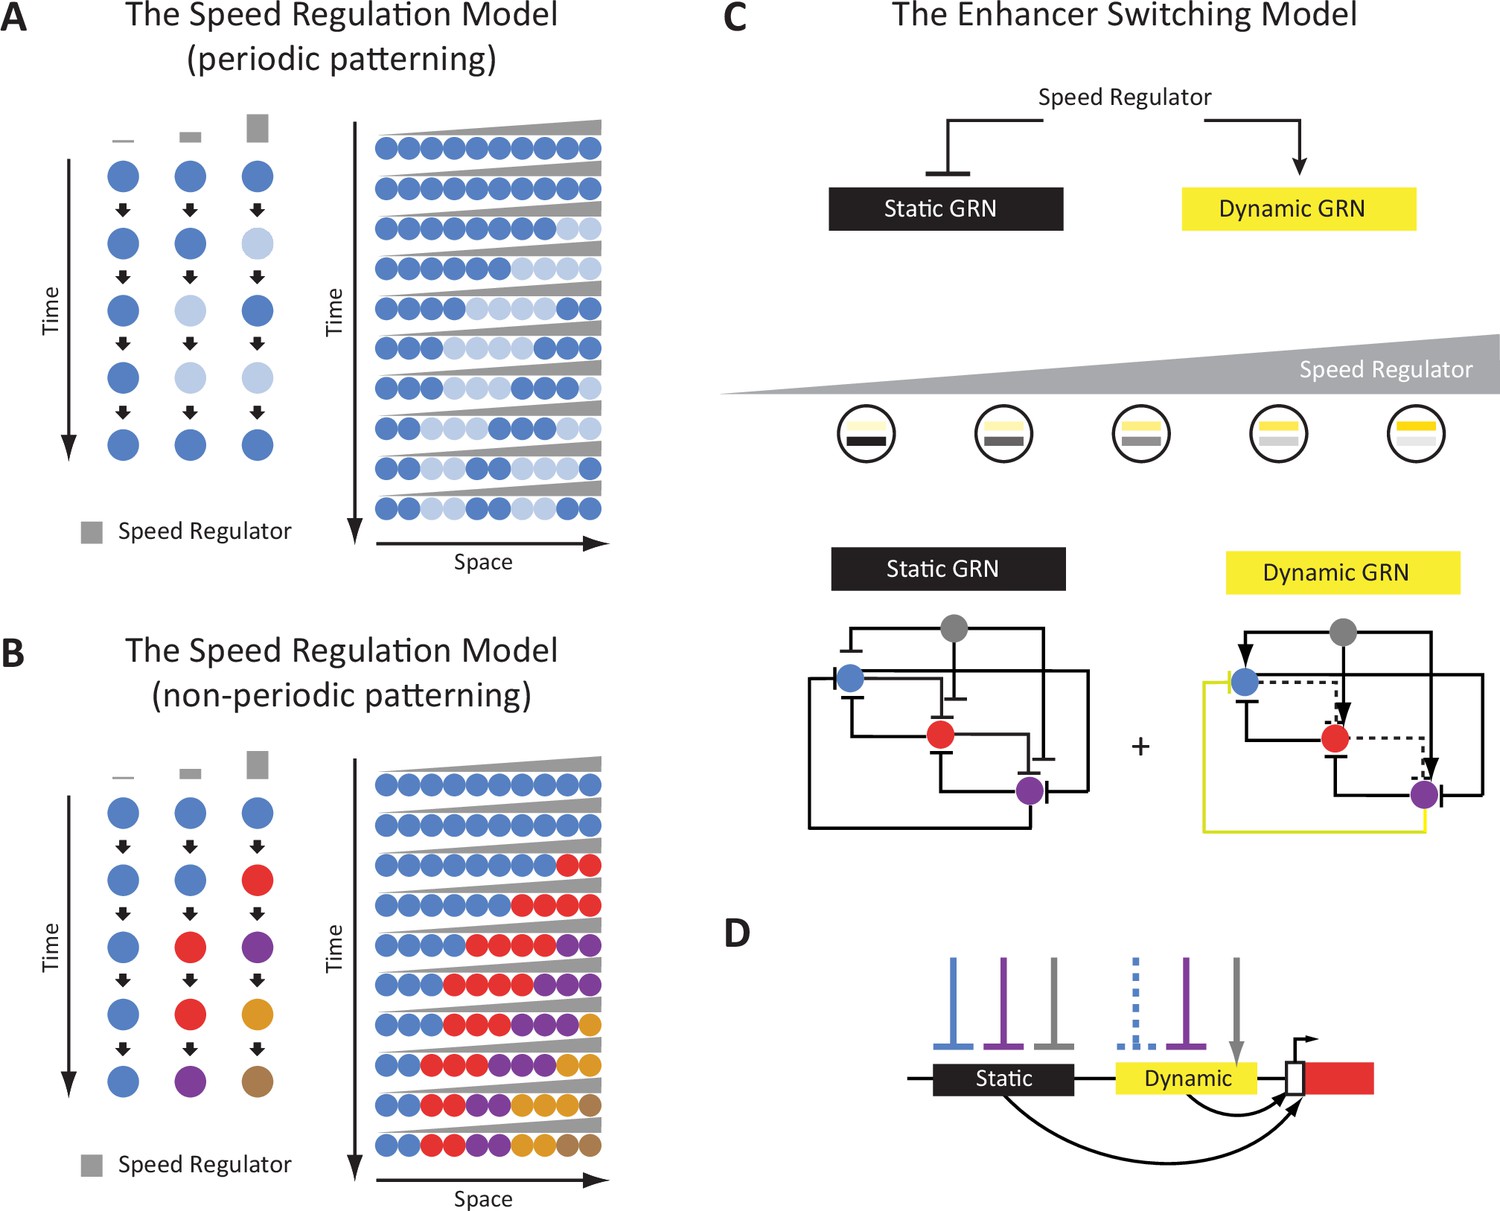
The Enhancer Switching Model as a molecular realization of the Speed Regulation Model.
(A) The Speed Regulation Model for periodic patterning. Left: Cells can oscillate between two states mediated by a molecular clock: high (shown in dark blue), and low (shown in light blue). The concentration of the speed regulator (shown in gray) modulates the speed of the molecular clock (i.e. its frequency). Right: A gradient of the speed regulator across a tissue (represented by a row of cells) induces a periodic wave that propagates from the high to the low end of the gradient. (B) The Speed Regulation Model for non-periodic patterning. Same as for the periodic case (A), except the molecular clock is replaced with a genetic cascade that mediates the sequential activation of cellular states (represented by different colors). (C) The Enhancer Switching Model, a molecular realization of the Speed Regulation model, is composed of two gene regulatory networks (GRNs): one dynamic and one static. The dynamic GRN can be either a clock (to mediate periodic patterning) or a genetic cascade (to mediate non-periodic patterning). The static GRN is a multi-stable gene circuit that mediates the stabilization of gene expression patterns. The speed regulator activates the dynamic GRN but represses the static GRN, and so a gradient of the speed regulator (shown in gray) mediates a gradual switch from the dynamic to the static GRN along the gradient. Shown are example realizations of dynamic and static GRNs, where the dynamic GRN represents either a molecular clock or a genetic cascade, depending on the absence or presence of the repressive interaction shown in yellow, respectively. (D) Separate dynamic and static enhancers encode the wiring of each gene (shown here only for the red gene) within the dynamic and static GRNs, respectively.
Figure 2 with 4 supplements
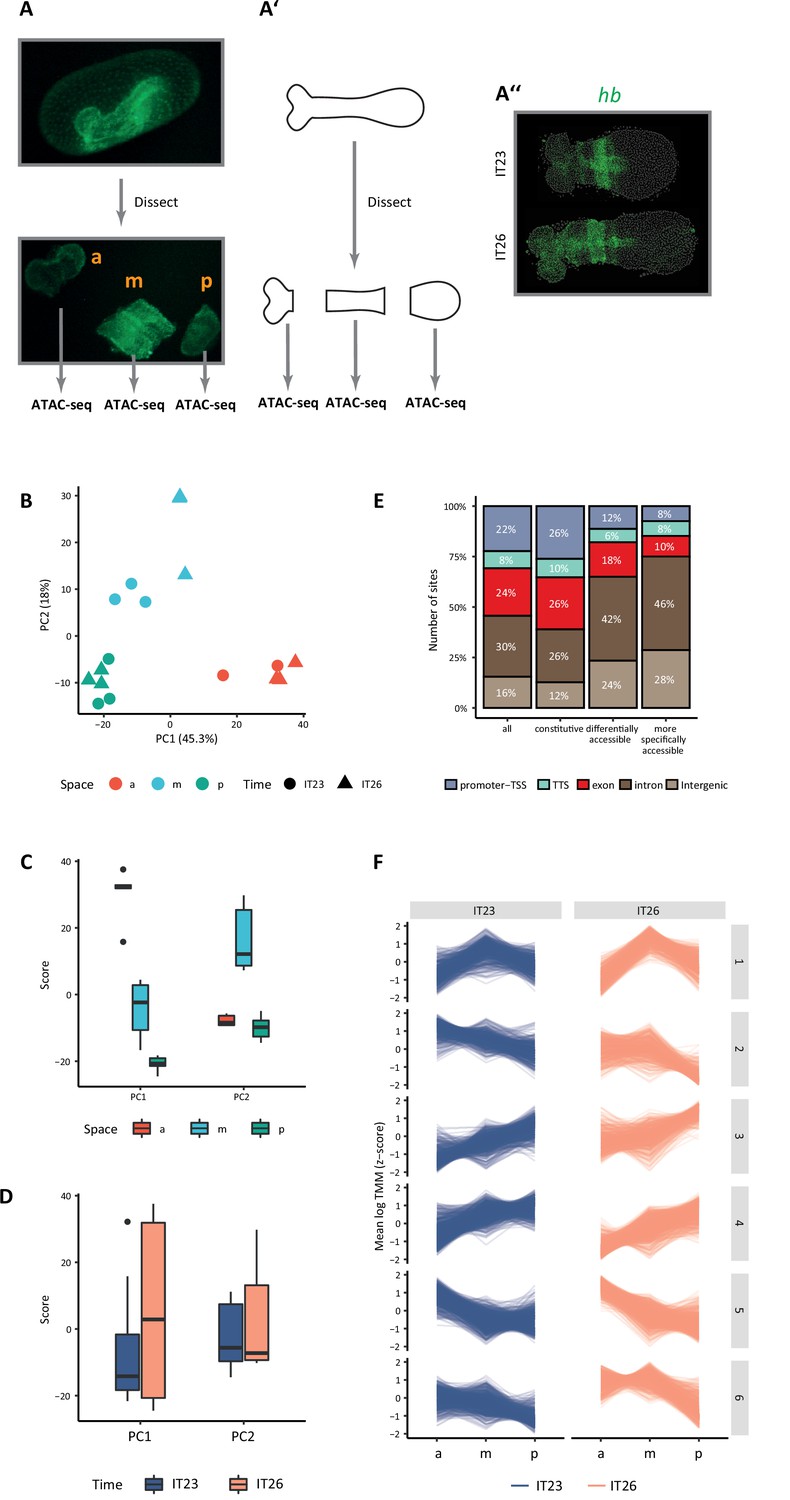
Chromatin accessibility dynamics during anterior-posterior (AP) patterning of the early Tribolium embryo.
(A) Embryos 23–26 hr after egg lay (AEL) (IT23) or 26–29 hr AEL (IT26) were dissected and cut into anterior (a), middle (m), and posterior (p) part. Up: nGFP embryo in the eggshell. Below: dissected and cut nGFP embryo. (A’) A schematic version of (A). (A’’) Representative Tribolium embryo at 23–26 hr AEL (IT23) or 26–29 hr AEL (IT26) in situ stained to visualize the expression of the gap gene hunchback (hb) (green; Hoechst in gray). (B) Principal component analysis (PCA) on the accessibility scores of the most highly accessible and variable sites in the dataset. Only the first two principal components (PC) of the data are represented. The first PC explains 45.3% of the variance in the data, and the second PC, 18.0%. (C, D) Boxplots showing the scores of PC1 and PC2 by space (C) and time (D). The thick line indicates the median (2nd quartile), while the box represents the interquartile range (IQR, 1st to 3rd quartiles). Outliers are shown as dots. (E) Genomic annotation of different classes of chromatin accessible sites: all (consensus) sites, constitutive sites (i.e. consensus sites that are not differentially accessible), all differentially accessible sites, and most specifically accessible sites (i.e. sites differentially accessible in four or more comparisons). (F) K-means clustering of accessibility scores for differentially accessible sites. Accessibility scores have been z-score scaled for each site.
Figure 2—figure supplement 1
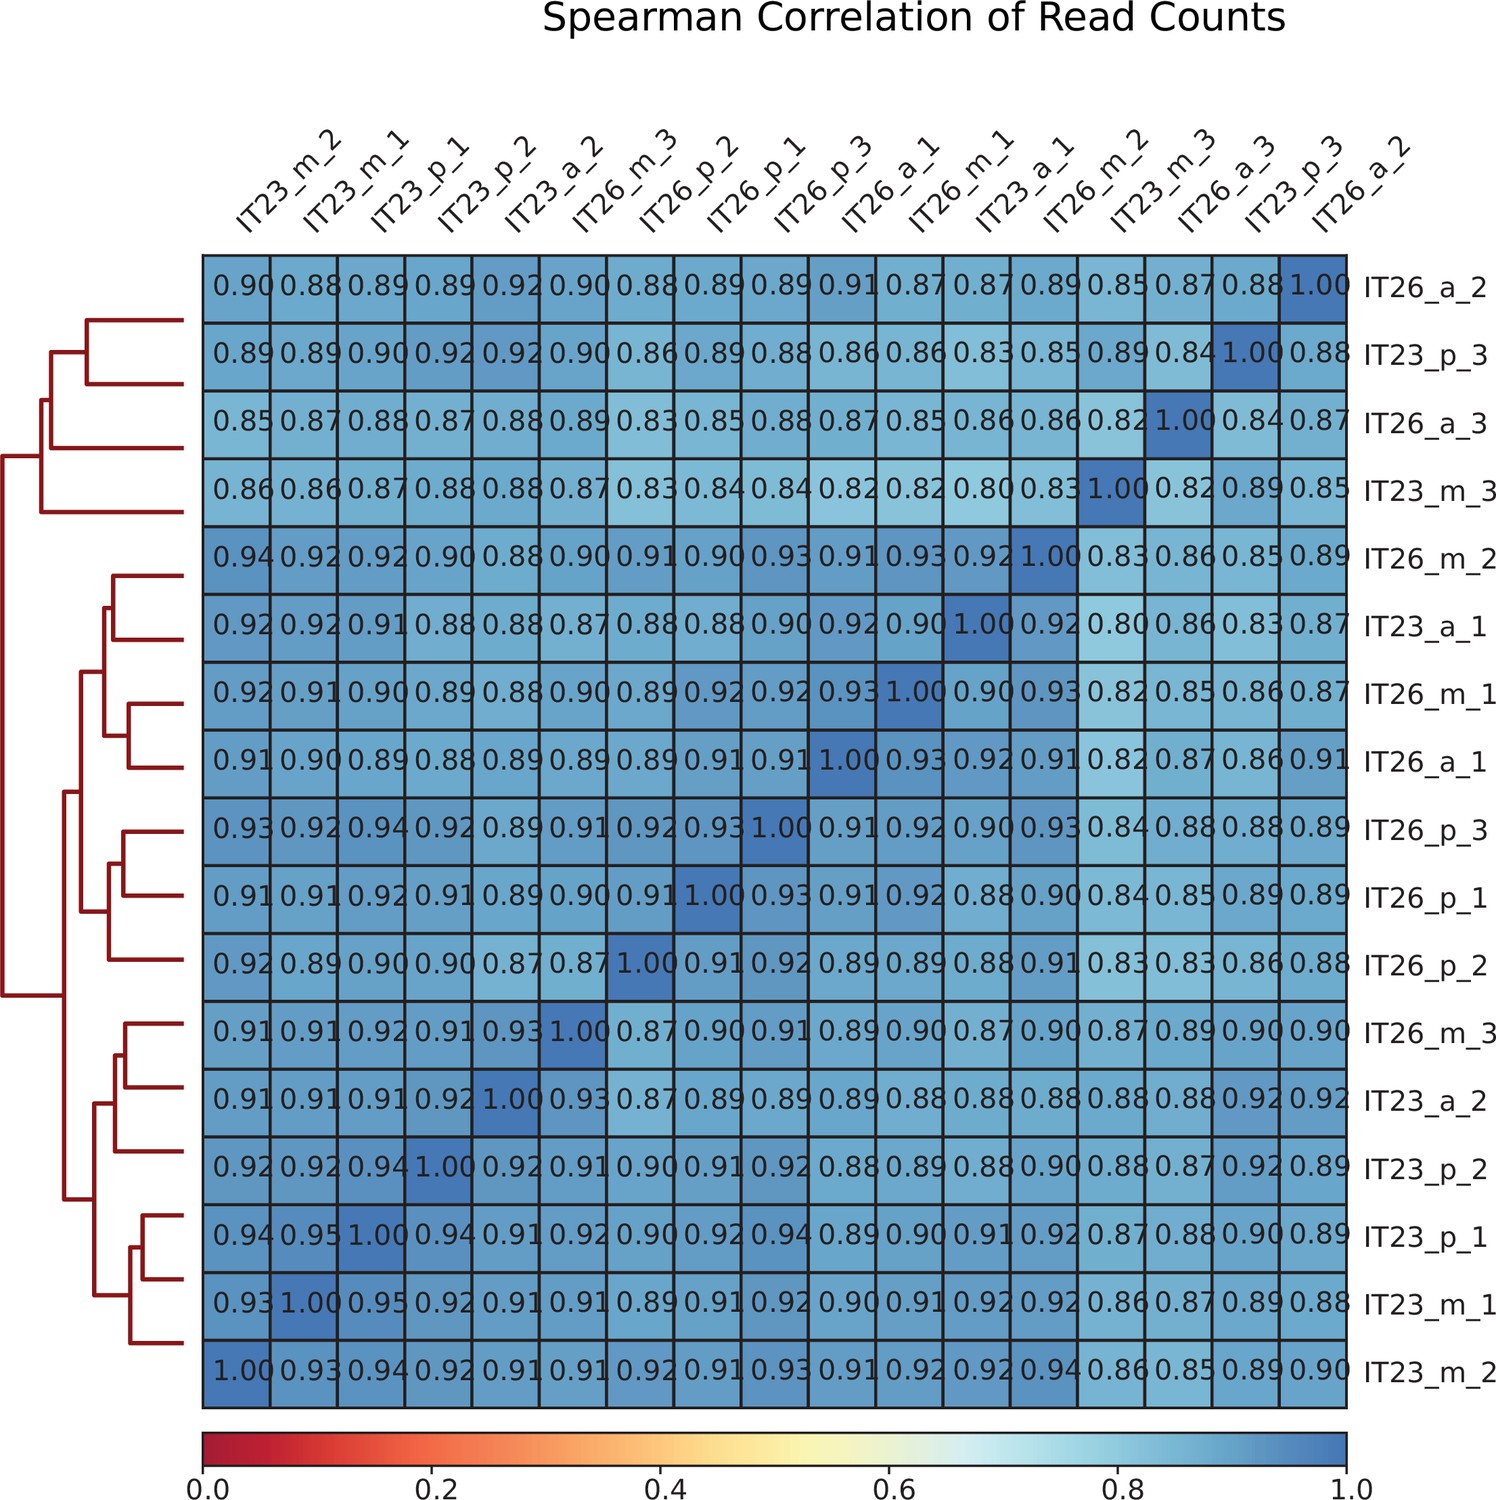
Correlation between Assay for Transposase-Accessible Chromatin with high-throughput sequencing (ATAC-seq) sequencing libraries.
Mapped sequencing reads of each biological replicate were used to calculate the correlation between pairs of replicates. The values represent the Pearson correlation coefficients between pairs of sequencing libraries.
Figure 2—figure supplement 2
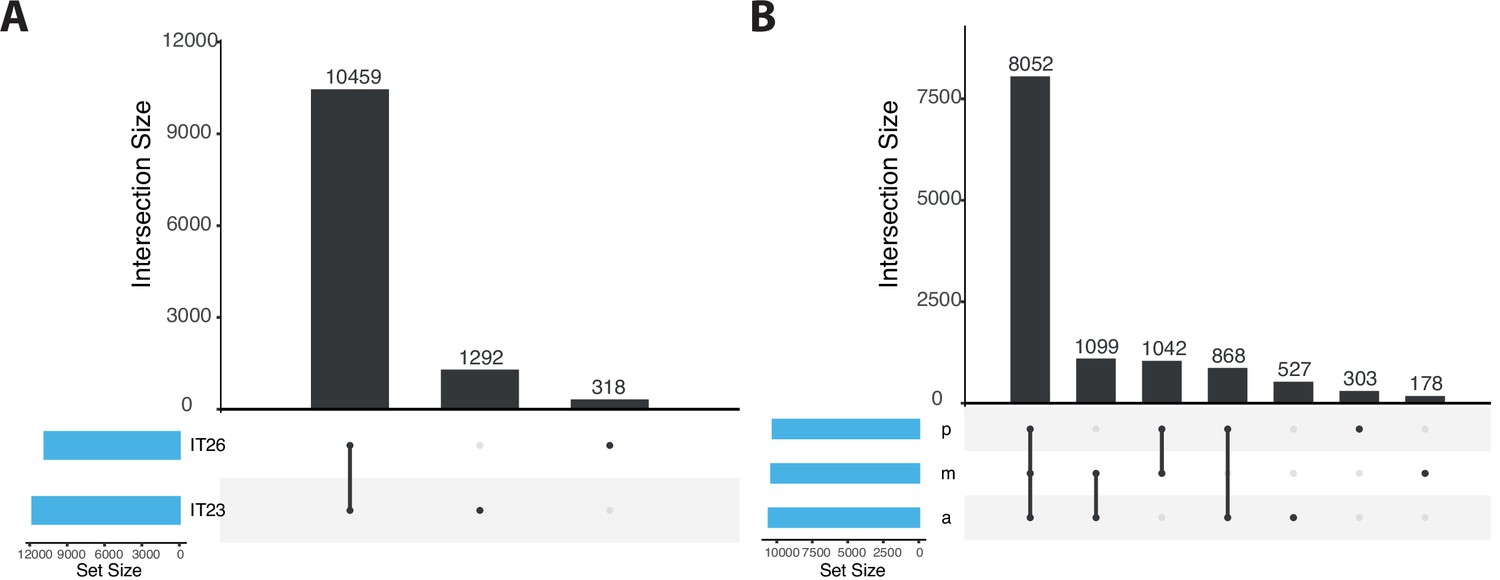
Upset plot comparing the number of sites identified in samples corresponding to IT23 and IT26 as well as along the anterior-posterior (AP) axis.
(A) Plot corresponding to IT23 and IT26. (B) Plot corresponding to samples along the AP axis (a, m, and p). The number of sites in each of the sets considered is represented by the width of the bars in the bar chart at the bottom left. Each bar in the bar chart at the top represents the number of sites in an intersection. The intersection is indicated by filled circles below each bar. Note that the intersection sets are disjoint.
Figure 2—figure supplement 3
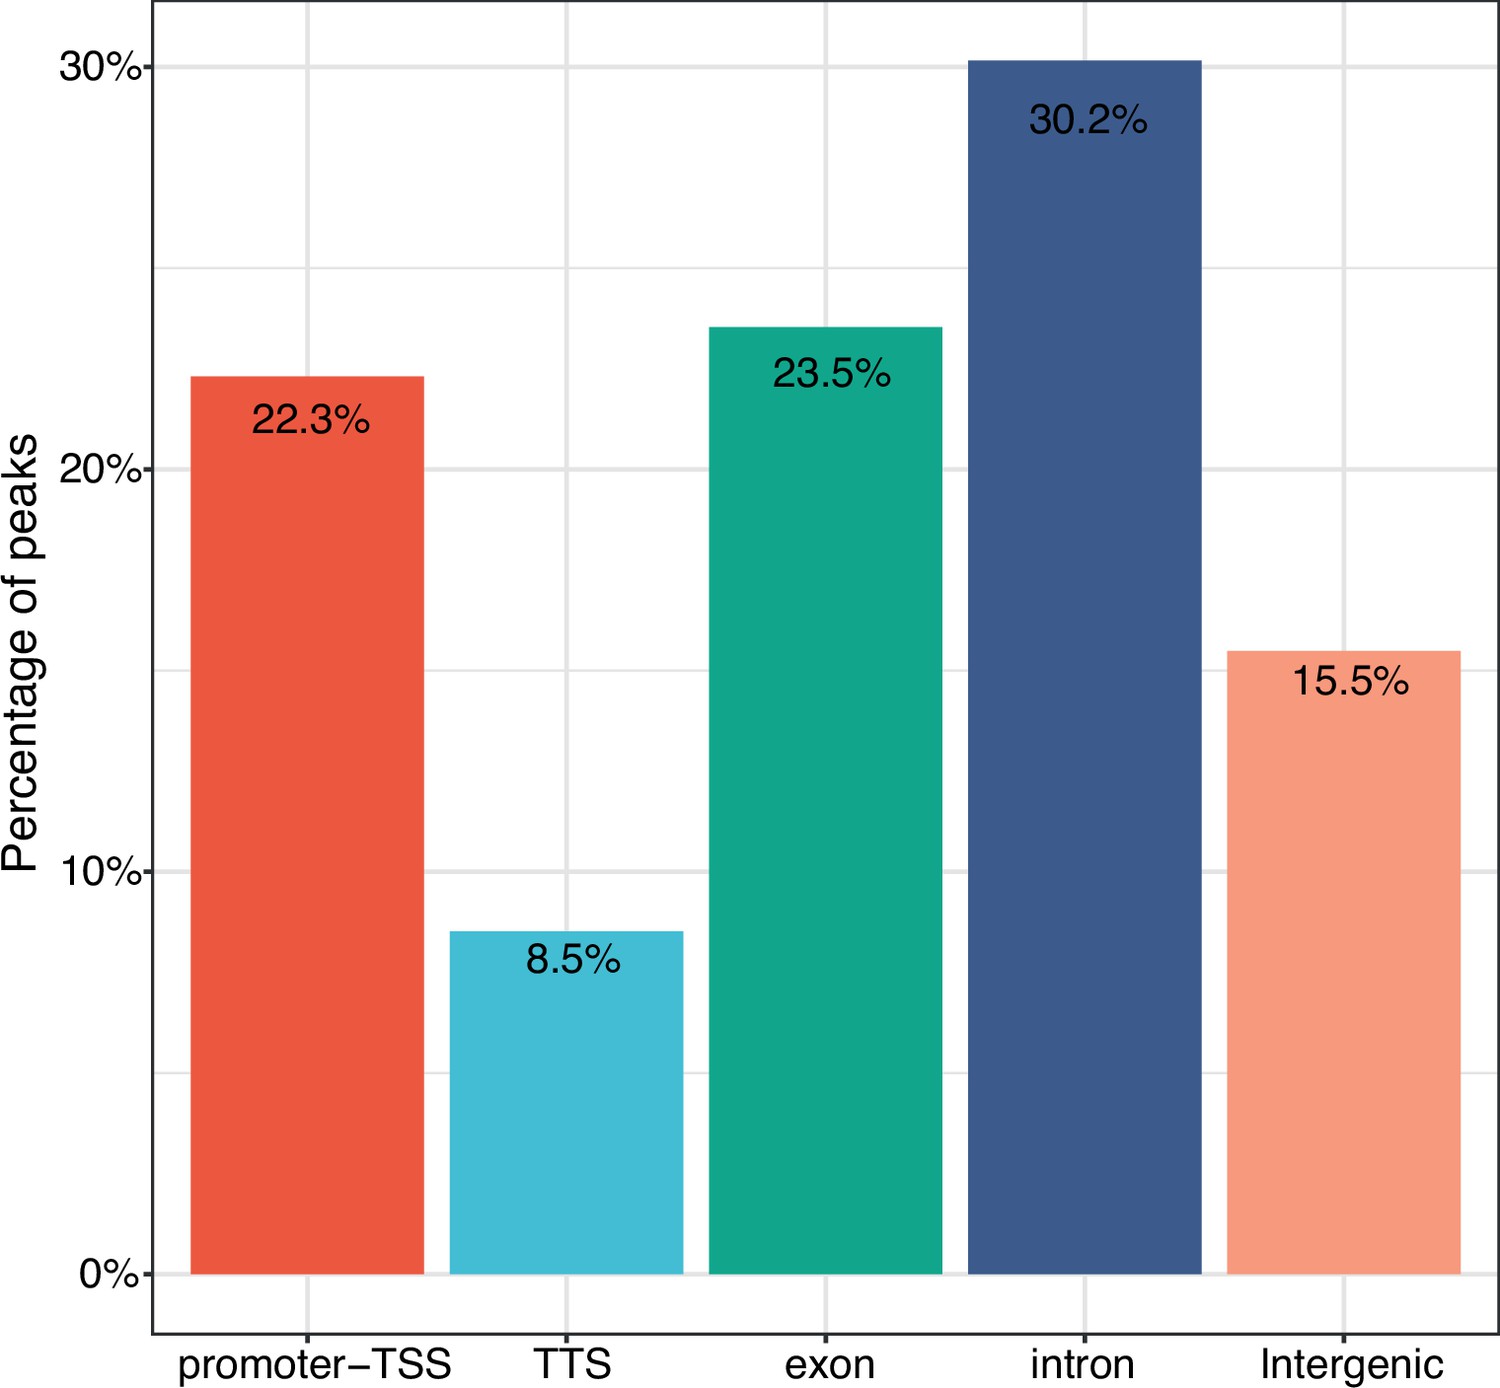
Annotation of consensus sites.
A total of 12,069 consensus sites were analyzed. Consensus sites overlap with promoter-TSS (22.3%), TSS (8.5%), exons (23.5%), introns (30.2%), and intergenic regions (15.5%), respectively. TSS: Transcription Start Site.
Figure 2—figure supplement 4
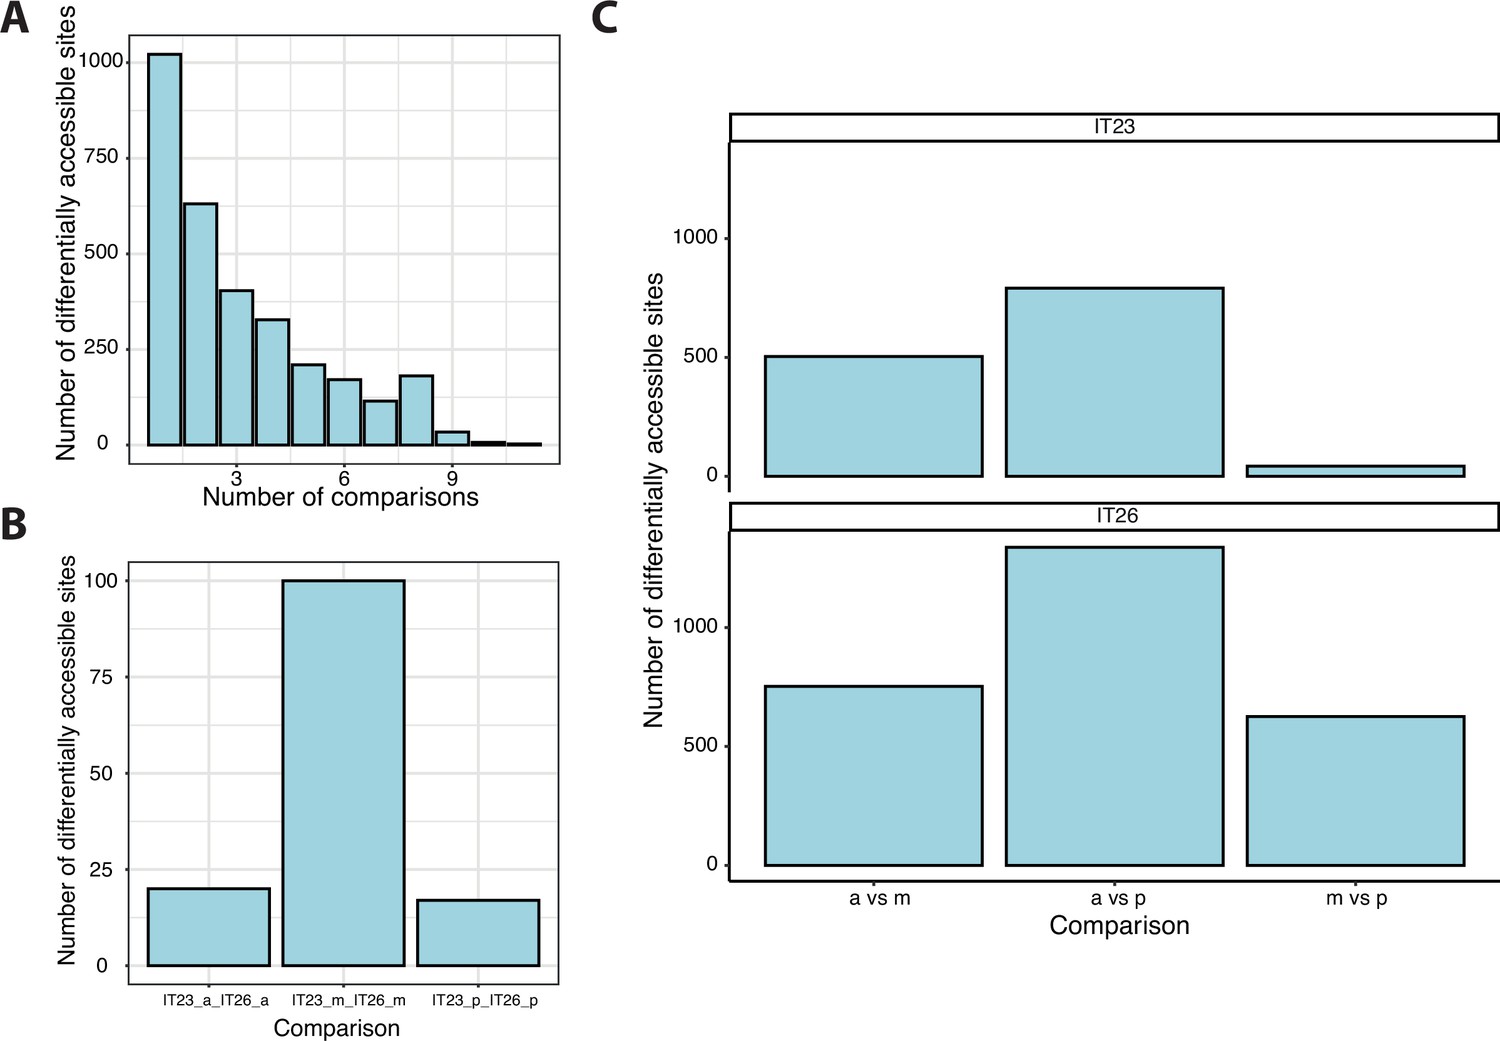
Analysis of differentially accessible sites.
(A) The accessibility of sites was compared between three different parts of the germband (anterior, middle, and posterior) at two-time points (IT23 and IT26). All possible 15 comparisons were considered. A total of 3106 sites were differential accessible. (B) For the same part of the embryo, 132 sites were differentially accessible between two-time points. (C) A total of 2109 sites were differentially accessible between two different parts of the germband at a given time point.
Figure 3 with 1 supplement
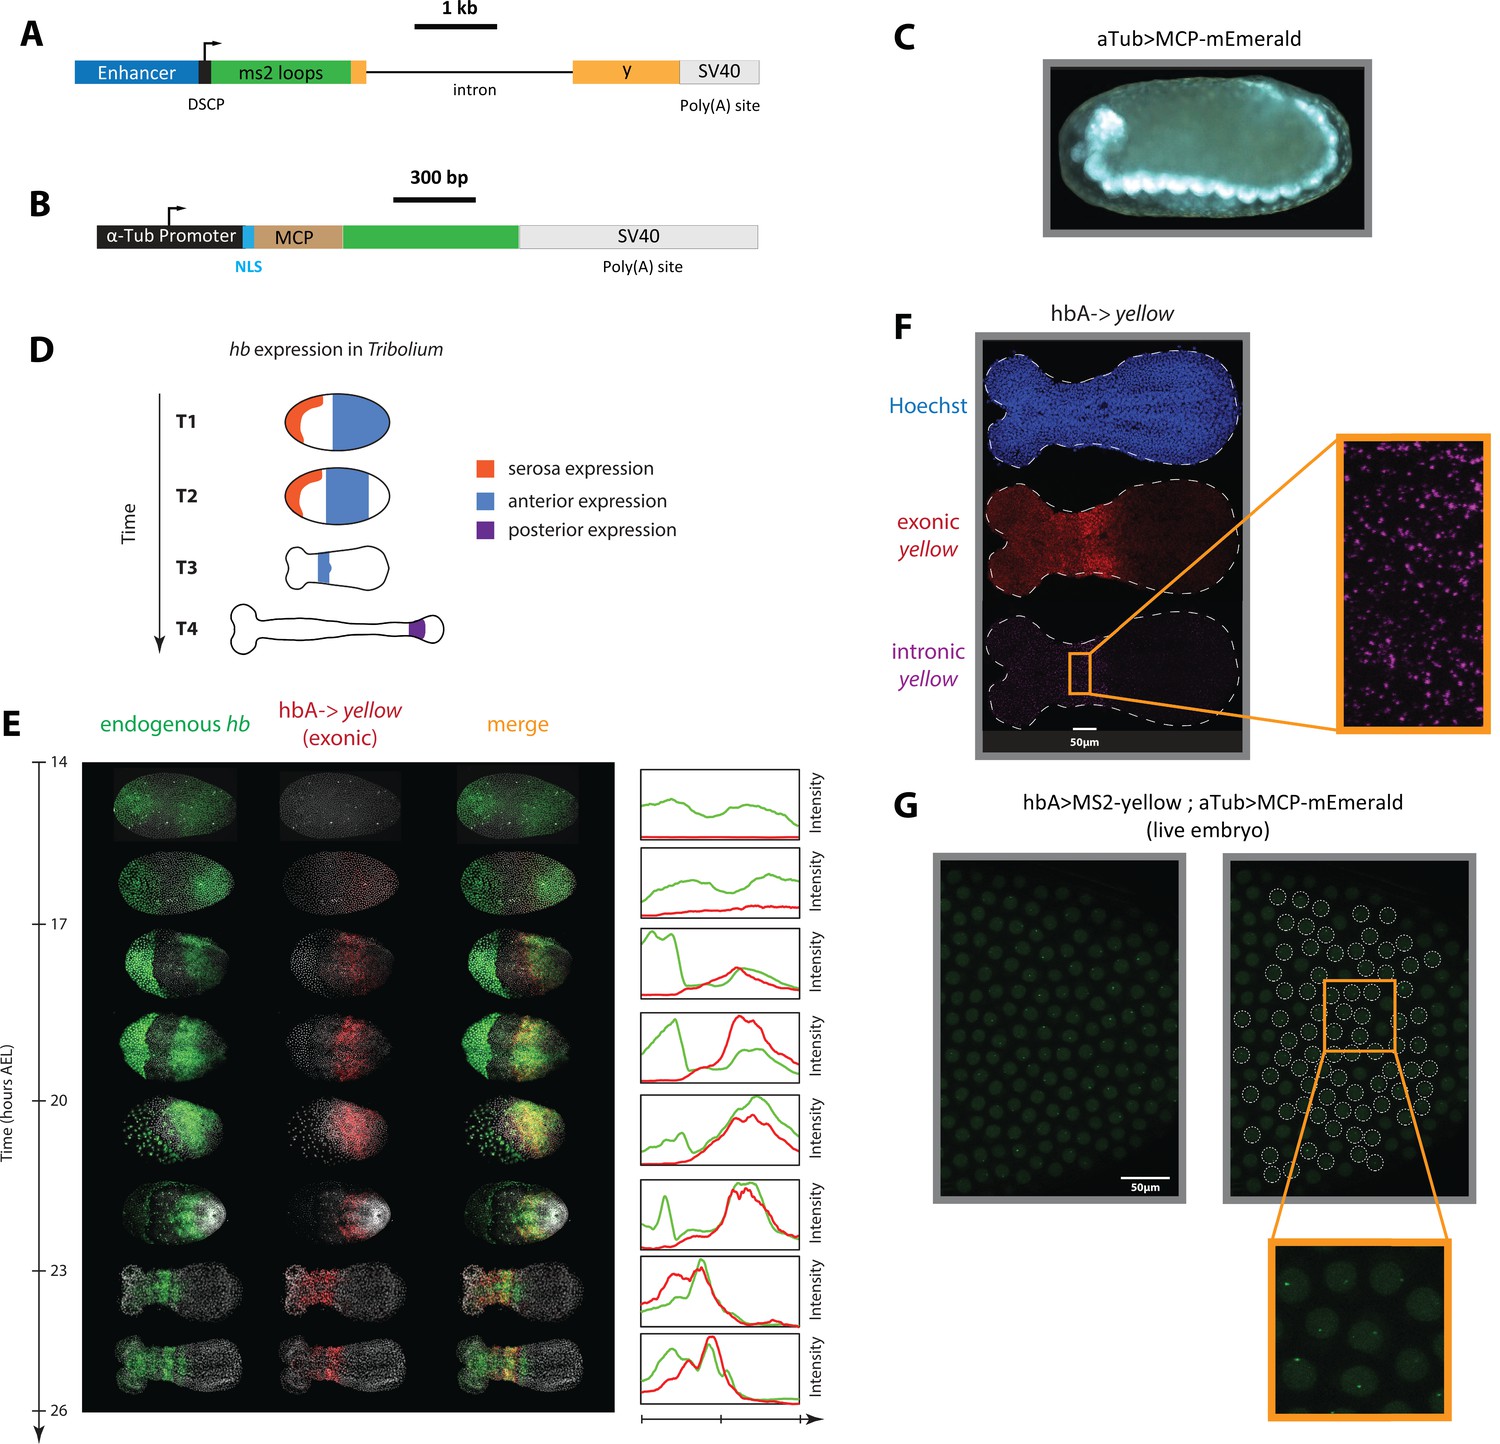
An MS2-MCP enhancer reporter system to visualize enhancer activity in fixed and live Tribolium embryos tested using the Tribolium hb enhancer hbA.
(A) Our enhancer reporter construct: An enhancer of interest is placed upstream of a Synthetic Core Promoter (DSCP), followed by 24 tandem repeats of MS2 stem-loops, the gene yellow, then an SV40 poly(A) tail. (B) The aTub >MCP-mEmerald construct: ubiquitous alpha-tubulin promoter was placed upstream of an nuclear localization signal (NLS) and an MCP-mEmerald fusion, followed by an SV40 poly(A) tail. (C) Overview image of an aTub >MCP-mEmerald embryo at the germband stage. (D) A schematic showing hb expression in Tribolium. In the early blastoderm, hunchback (hb) is expressed in the serosa (orange) and as a cap in the posterior half of the embryo (blue) (T1) that eventually resolves into an expression band in the anterior (blue in T2 and T3). Later during the germband stage (T4), the anterior expression (blue) fades and a new hb expression arises in the posterior (purple). (E) Spatiotemporal dynamics of endogenous hb (green) and reporter gene yellow (red) expression in hbA->yellow Tribolium embryos. Left panel: Time-staged embryos from 14 to 26 hr after egg lay (AEL) at 24 °C, in which mRNA transcripts (hb: green, yellow: red) were visualized using in situ hybridization chain reaction (HCR) staining. Nuclear staining (Hoechst) is in gray. Right panel: Fluorescence signal along the dorsal-ventral axis was summed up to generate intensity distribution plots along the anterior-posterior (AP) axis. (F) Detection of de novo transcription via in situ HCR staining of intronic yellow. Nuclear staining (Hoechst): blue; exonic yellow (yellow mRNA): red; intronic yellow: purple. Embryo outline is shown in a dashed line. (G) Live imaging snapshot of a hbA >MS2-yellow; aTub >MCP-mEmerlad Tribolium embryo. Diffuse mEmerald signal is observed in nuclei (outlined in a white dashed line). mEmerald fluorescence is enriched at transcription sites (bright puncta: MS2-MCP signal). In all embryos shown: posterior to the right.
Figure 3—figure supplement 1
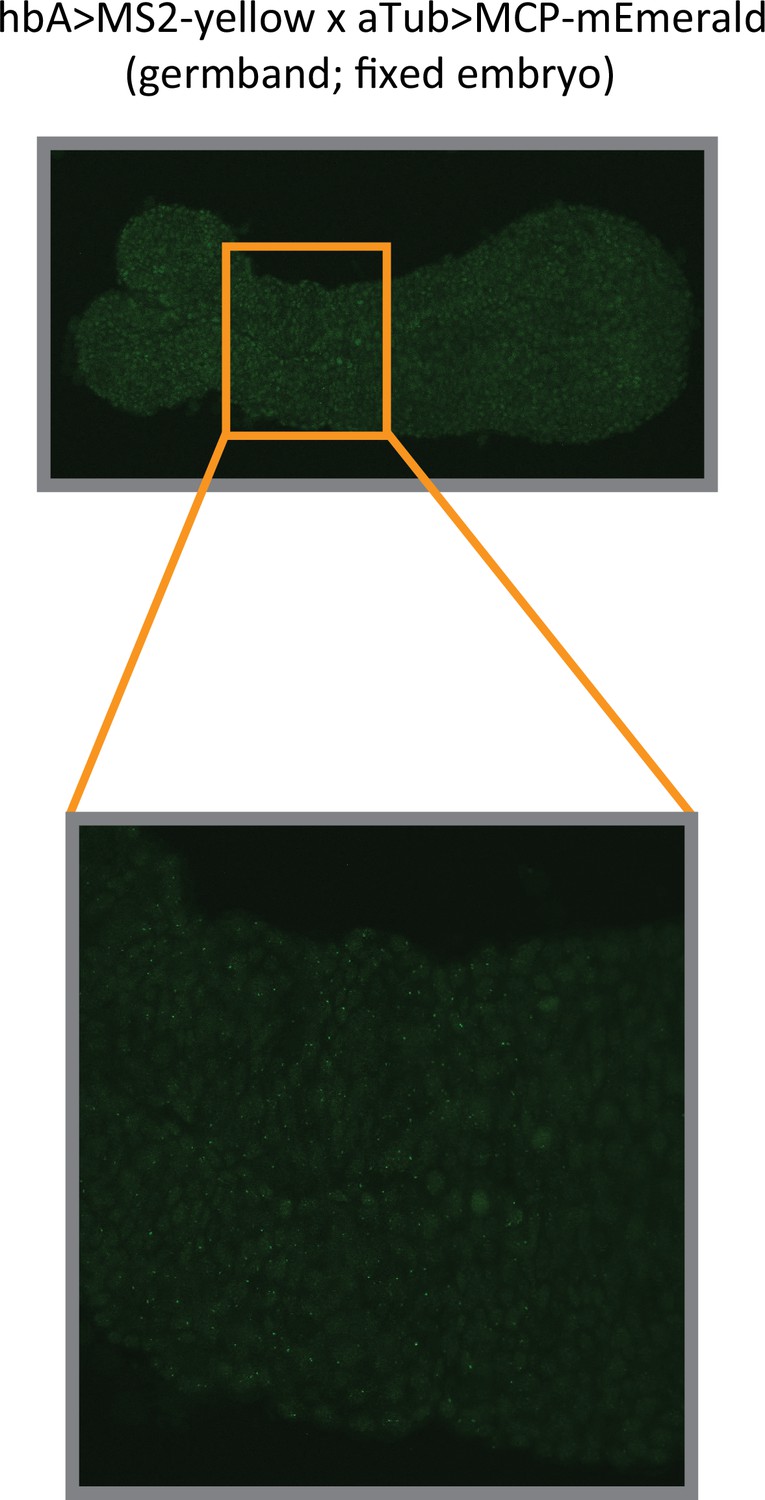
Analysis of hbA enhancer activity on a fixed embryo.
Images of a fixed hbA >MS2-yellow; aTub >MCP-mEmerlad Tribolium embryo in the germband stage (upper image: overview; lower image: close-up view of the indicated region in the overview image). The bright mEmerald puncta (MS2-MCP signal at active transcription sites) refine into a stripe resembling the yellow expression of the hbA enhancer reporter visualized using in situ hybridization chain reaction (HCR) staining (compare to Figure 3E).
Figure 4 with 1 supplement
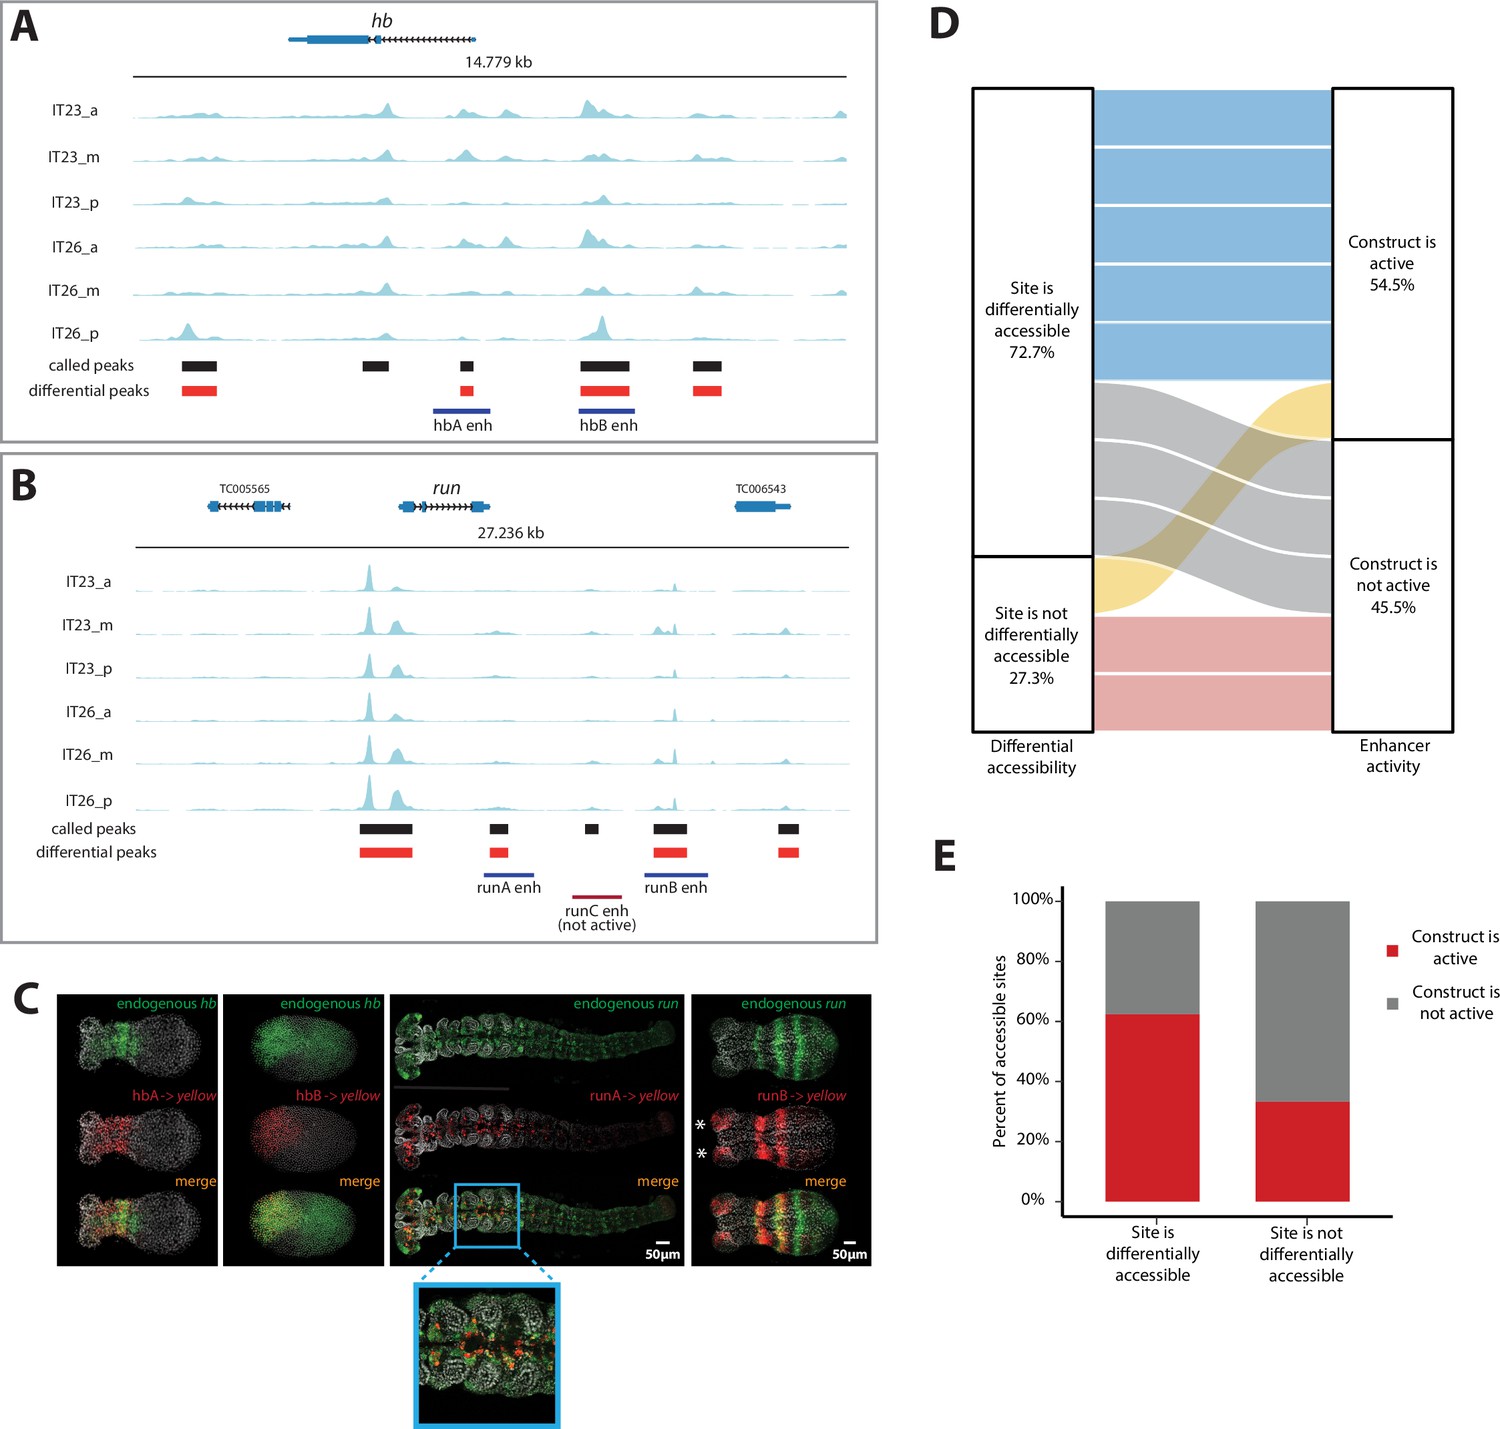
Correlation of enhancer activity with differential accessibility.
(A, B) The Assay for Transposase-Accessible Chromatin (ATAC) profiles (two-time points (IT23, IT26) with three embryo regions (a, m, p) per time point) for hunchback (hb) (A) and run (B). Tested enhancer regions at these loci are shown as boxes underneath the ATAC profiles. Differential accessible sites match well with active enhancer regions (purple boxes; red box: not active enhancer construct). ATAC tracks were created with pyGenomeTracks. (C) Enhancer reporter constructs for active enhancer regions are shown in (A) and (B), in which mRNA transcripts were visualized using in situ hybridization chain reaction (HCR) staining (endogenous gene expression: green, reporter gene expression: red, merge: yellow). Nuclear staining (Hoechst) is in gray. hbA drives reporter gene expression in a stripe (embryo in germband stage shown). hbB drives reporter gene expression in the serosa (embryo in blastoderm stage shown). runA drives reporter gene expression in a subset of the endogenous run CNS expression (embryo in late germband stage shown). runB drives reporter gene expression in stripes outside of the most posterior part of the embryo (embryo in germband stage shown). Posterior to the right. (D) The correlation between differential accessibility and construct activity was determined. Eleven enhancer constructs were analyzed: 54.5% of constructs (six constructs) were active and 45.5% of constructs were not active (five constructs). Five out of six active constructs are associated with sites that are differentially accessible, while one active construct overlaps with a site that is not differentially accessible. Two out of five not active constructs match sites that are not differentially accessible, while the remaining three not active constructs are associated with sites that are differentially accessible (see Figure 4—figure supplement 1 for details). (E) Enhancer prediction efficiency of our enhancer prediction method based on differential peak analysis. Same enhancer constructs were analyzed as in (D). About 60% of analyzed differential peaks were associated with active enhancer construct regions whereas in about 40% of analyzed cases, differential peaks could be found at not active enhancer construct regions. In contrast, about 70% of analyzed non-differential peaks were associated with not active enhancer construct regions. About 30% of analyzed non-differential peaks are associated with active enhancer construct regions.
Figure 4—figure supplement 1
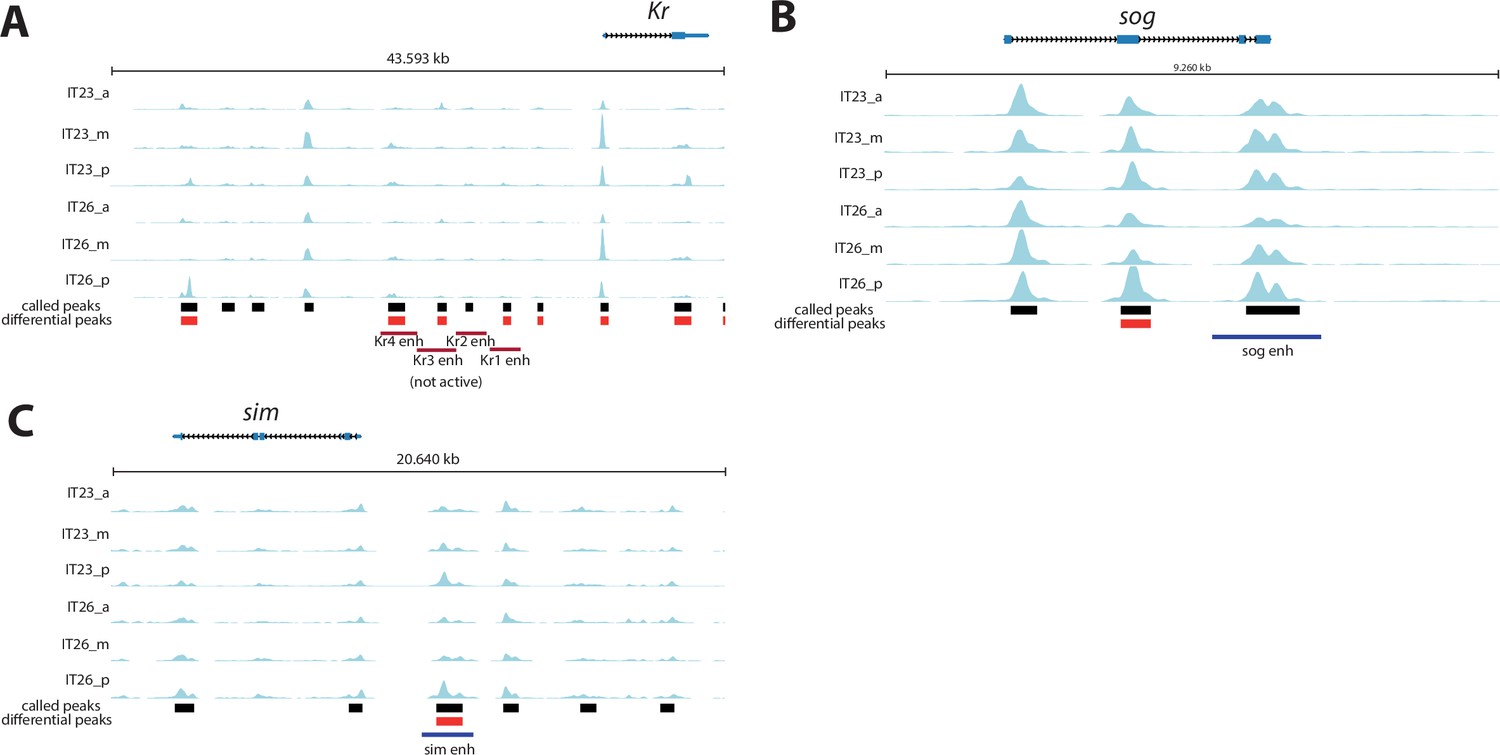
Genomic tracks of analyzed enhancer reporter constructs.
Genomic tracks of analyzed enhancer reporter constructs. Assay for Transposase-Accessible Chromatin (ATAC) profiles (two-time points (IT23, IT26) with three embryo regions (a, m, p) per time point) are shown for (A) Kruppel (Kr), (B) short gastrulation (sog), and (C) single-minded (sim). Analyzed enhancer regions at these loci are shown as purple (active enhancer region) or red (not active enhancer region) boxes underneath the ATAC profiles. KrA enh - KrD enh were tested in Tribolium in this work. Other enhancer regions were evaluated in a cross-species context in Drosophila (Cande et al., 2009). Differential accessible sites match well with active enhancer region of sim (C). No differential accessible site overlaps with the previously described active enhancer region of sog (B). Not active KrB enh region is not overlapping with differential accessible sites, while overlaps are observed between differential accessible sites and not active KrA enh, KrC enh, and KrD enh regions (A). ATAC tracks were created with pyGenomeTracks.
Figure 5 with 1 supplement
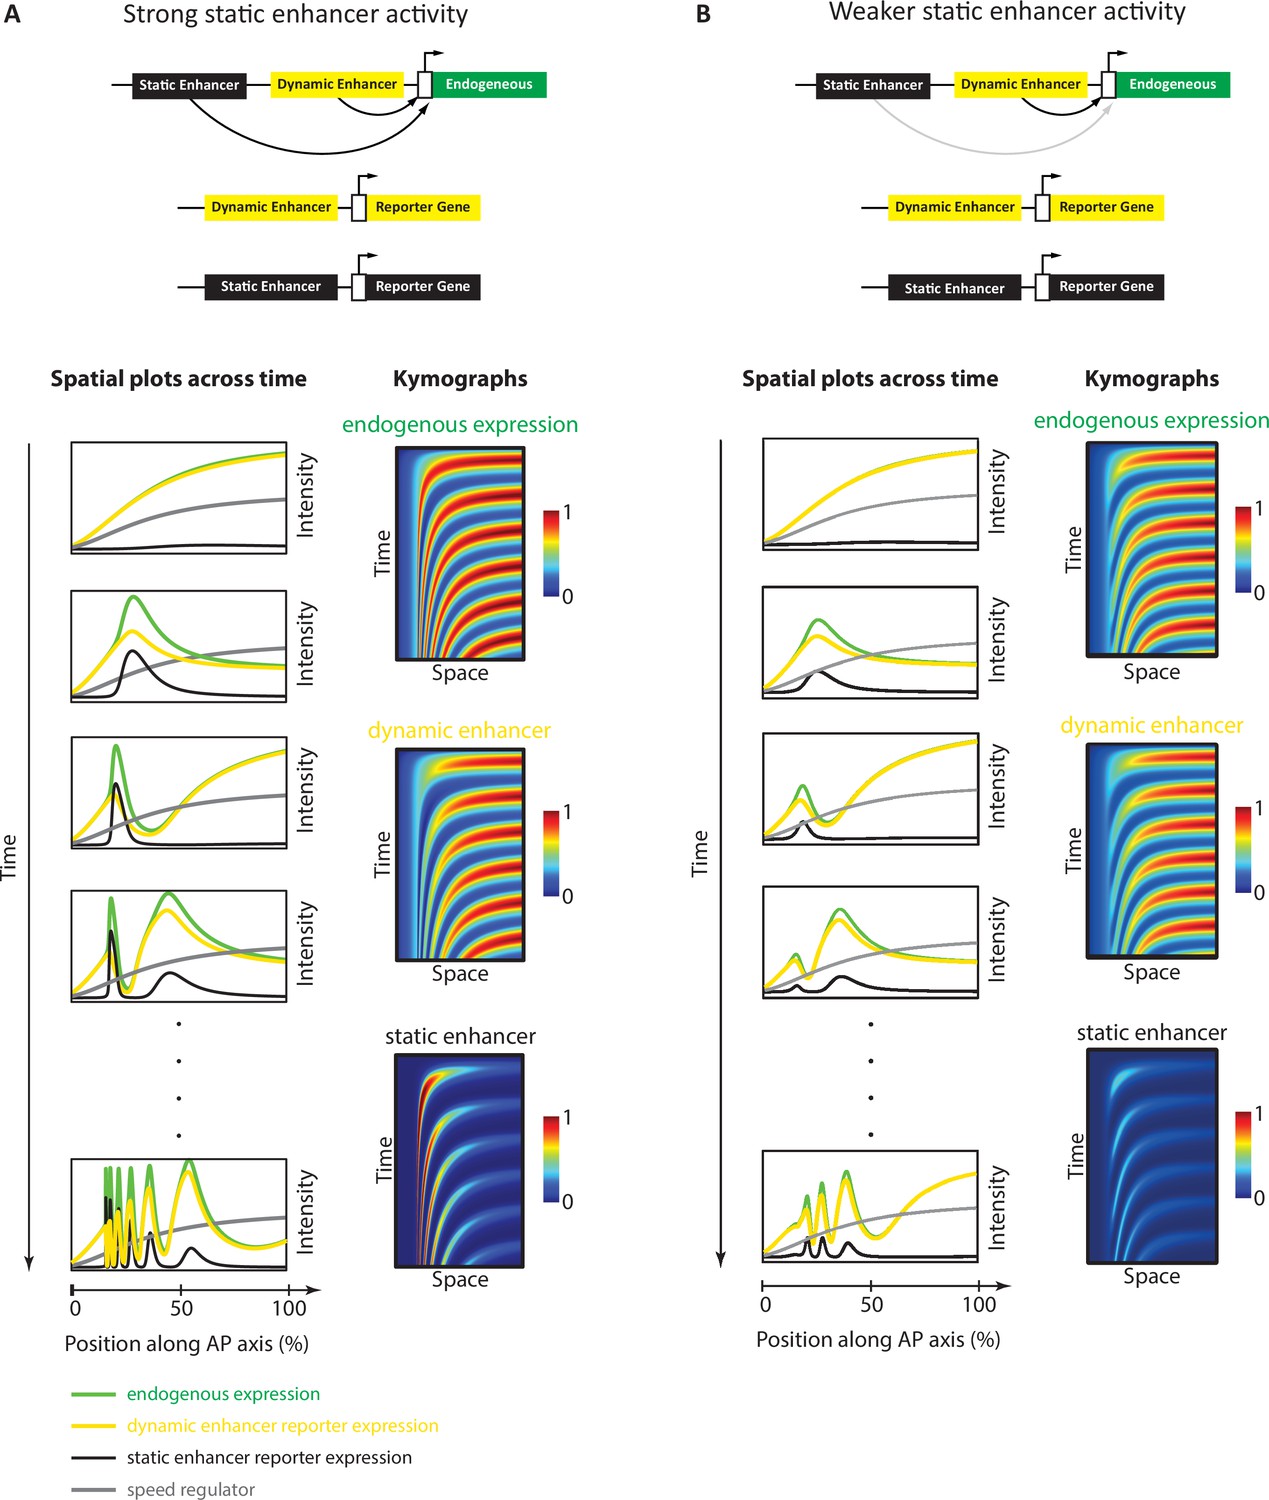
Simulation of the Enhancer Switching model with different static enhancer strengths.
Shown are simulation outputs of the Enhancer Switching model for a reporter gene driven by dynamic (yellow) or static (black) enhancers, as well as an endogenous gene driven by both dynamic and static enhancers (green). Two versions of the model were simulated and contrasted: with strong (A) vs weak (B) static enhancer activity. (A) Model simulation with strong static enhancer activity. Each wave of the endogenous gene expression follows first the dynamics of the dynamic enhancer and switches along space (in the tapering direction of the speed regulator, shown in gray) and time to the dynamics of the static enhancer to form a stable expression domain. (B) Model simulation with a weaker static enhancer: dynamic enhancer activity resembles endogenous gene expression pattern. Left panels: spatial plots across time. Right panels: Kymographs.
Figure 5—figure supplement 1
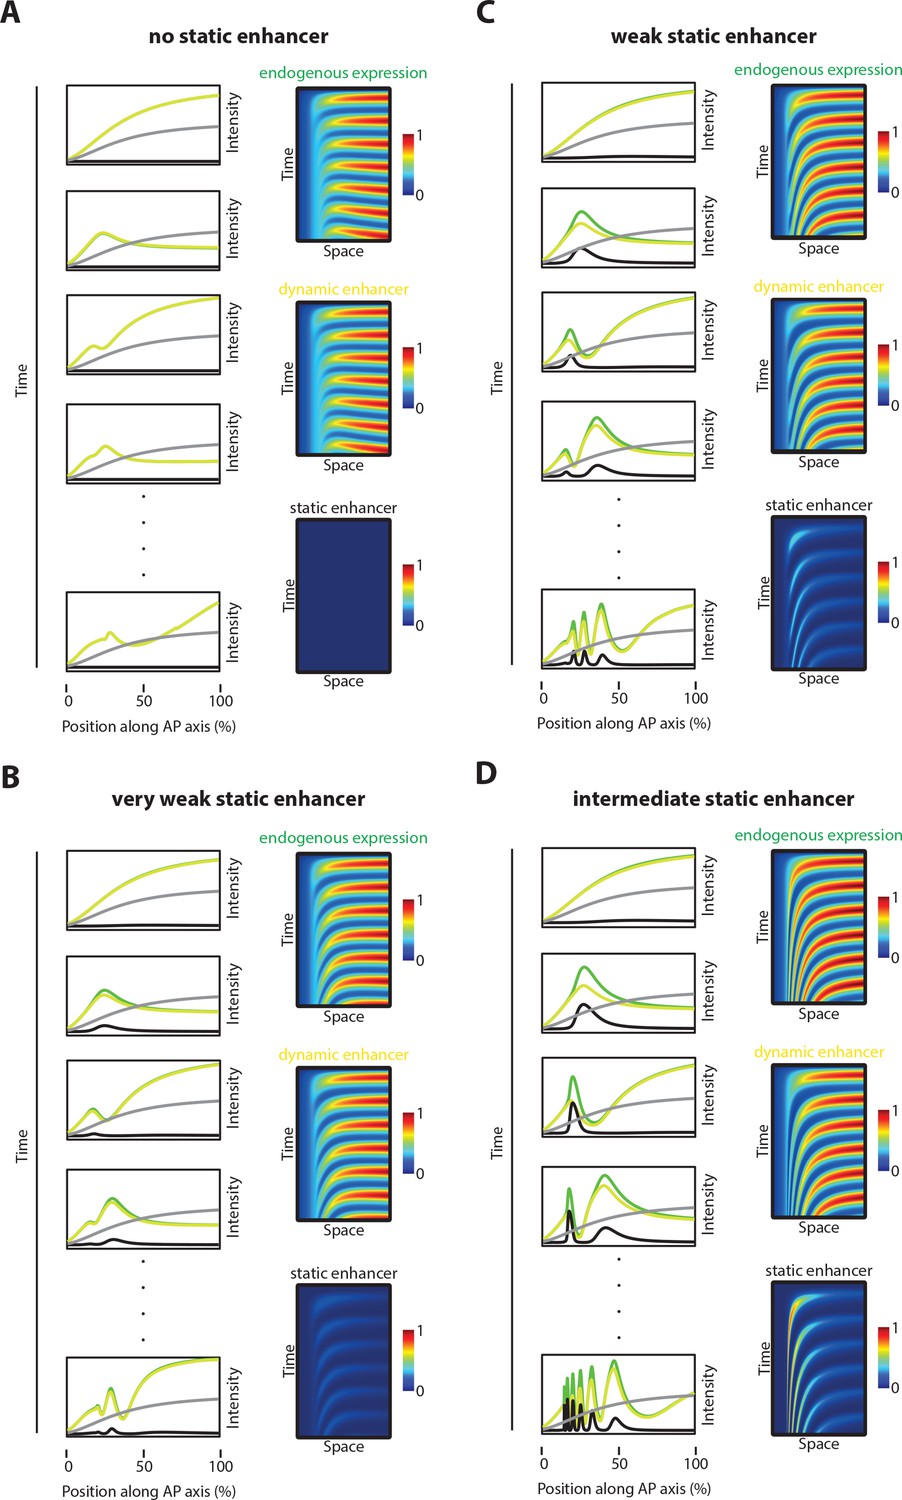
Simulations with different static enhancer strengths.
Computational simulation of reporter gene expression driven by dynamic (yellow) or static enhancer (black), respectively as well as endogenous gene expression (green) driven by both, dynamic and static enhancer. Analyzed was the spatiotemporal pattern of gene expression. (A) No static enhancer: dynamic enhancer strength d=3, static enhancer strength c=0 (same as in Figure 7B, deleted static enhancer). Each wave of the endogenous gene expression follows the dynamics of the dynamic enhancer. Due to the lack of static enhancer activity, endogenous gene expression waves fail to stabilize as stable expression domains. (B) Very weak static enhancer: d=3, c=0.5. Each wave of the endogenous gene expression follows the dynamics of the dynamic enhancer. Due to very weaker static enhancer activity, dynamic enhancer activity resembles the whole gene expression pattern (compare to Figure 5B). Endogenous gene expression waves are impaired in forming stable expression domains. (C) Weak static enhancer: d=3; c=1. Dynamics of the endogenous gene expression are mainly governed by dynamic enhancer activity. Weak static enhancer activity stabilizes endogenous gene expression waves as stable expression domains. (D) Intermediate strong static enhancer: d=3, c=1.5. Each wave of the endogenous gene expression follows first the dynamics of the dynamic enhancer and switches along space to the dynamics of the intermediate strong static enhancer to form a stable expression domain. Left panel: Intensity plots. The speed regulator is shown in gray. Right panel: Kymographs.
Figure 6 with 1 supplement
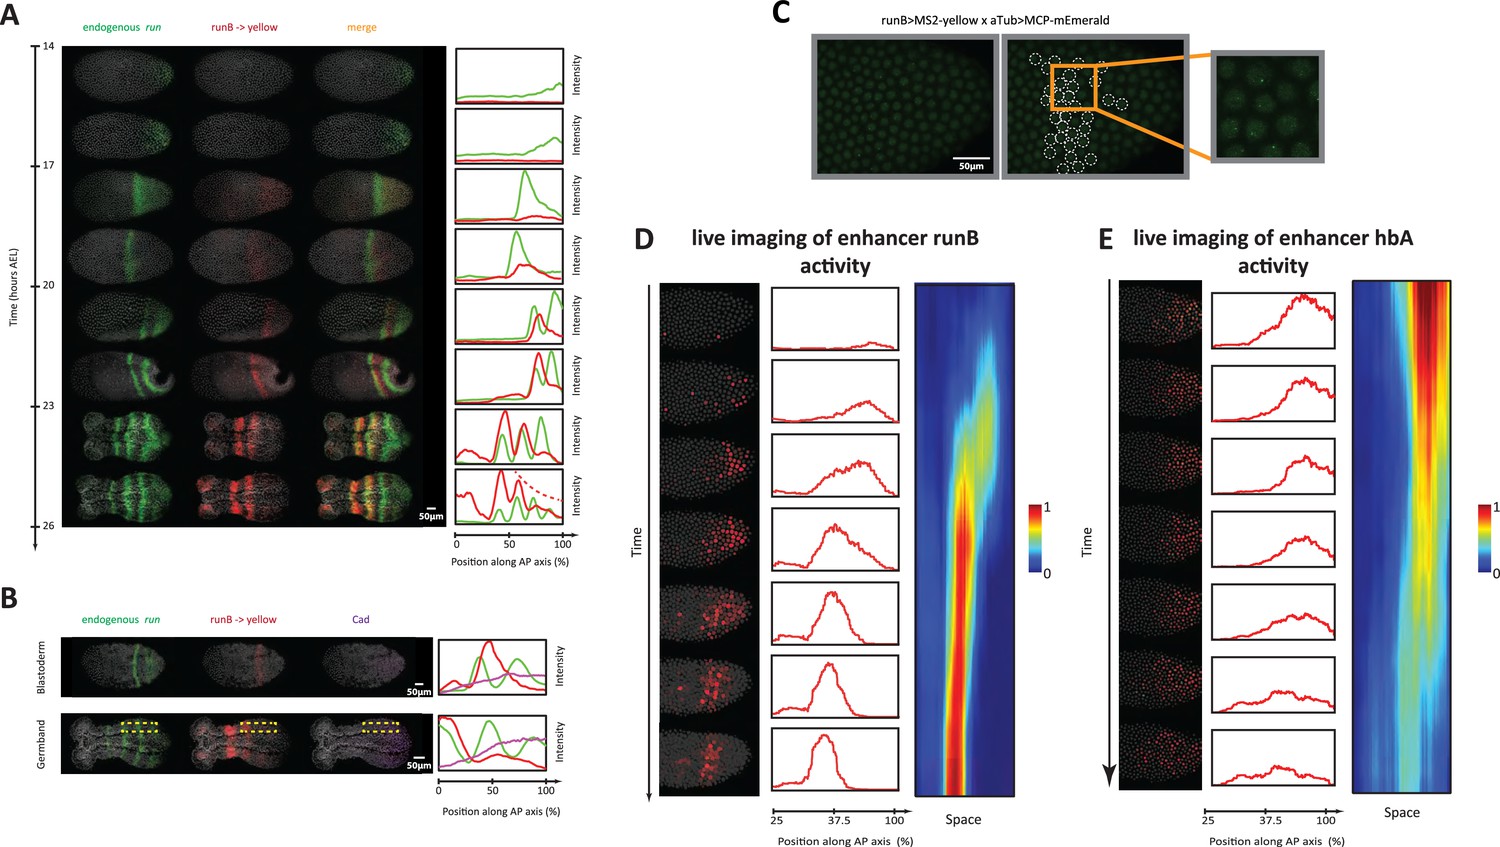
Analysis of enhancer activity dynamics using the MS2-MCP live imaging system.
(A) Shown are spatiotemporal dynamics of endogenous run (green) and the reporter gene yellow (red) expression in runB->yellow embryos. Left panel: Time-staged embryos from 14 to 26 hr after egg lay (AEL) at 24 °C, in which mRNA transcripts (run: green, yellow: red) were visualized using in situ hybridization chain reaction (HCR) staining. Nuclear staining (Hoechst) is in gray. Right panel: Intensity distribution plots along the AP axis. Both run and runB->yellow are expressed in waves that propagate from posterior to anterior. runB->yellow expression wave, however, starts weak posteriorly and progressively increases in strength as it propagates towards the anterior, until it eventually overlaps with the stabilized run stripes anteriorly. (B) Left panel: in situ HCR staining for endogenous run (green) and reporter gene yellow expression (red) combined with antibody staining for Cad proteins (purple) in a runB->yellow blastoderm embryo (upper row) and a runB->yellow germband embryos (lower row). Nuclear staining (Hoechst) is in gray. Right panel: Intensity distribution plots along the AP axis for yellow expression in a whole Tribolium blastoderm (upper panel), and within the region indicated in dashed yellow in a Tribolium germband. Cad forms a posterior-to-anterior gradient in both balstoderm and germband embryos. runB activity increases progressively as Cad concentration drops towards anterior. (C) Live imaging snapshot of a runB >MS2-yellow; aTub >MCP-mEmerlad Tribolium embryo. Diffuse mEmerald signal is observed in nuclei. mEmerald fluorescence is enriched at transcription sites (bright puncta: MS2-MCP signal). Left panel: original snap shot; Middle: nuclei that exhibit MS2-MCP signal are outlined in white circles; Right: A close-up to nuclei with MS2-MCP signal. (D, E) Tracking estimated mRNA activity driven by runB (D) and hbA (E). Left panels (in both (D) and (E)): Snapshots across time from live embryo movies in which nuclei (shown in gray) are tracked and MS2 signals are averaged over time (using a moving average filter with a length of 10 movie frames) to estimate mRNA activity (shown in red). Middle panel: Intensity distribution plots along space for representative images in left panel. Right panel: A kymograph showing estimated mRNA activities of enhancer reporters across space and time. In all embryos shown: posterior to the right.
Figure 6—figure supplement 1
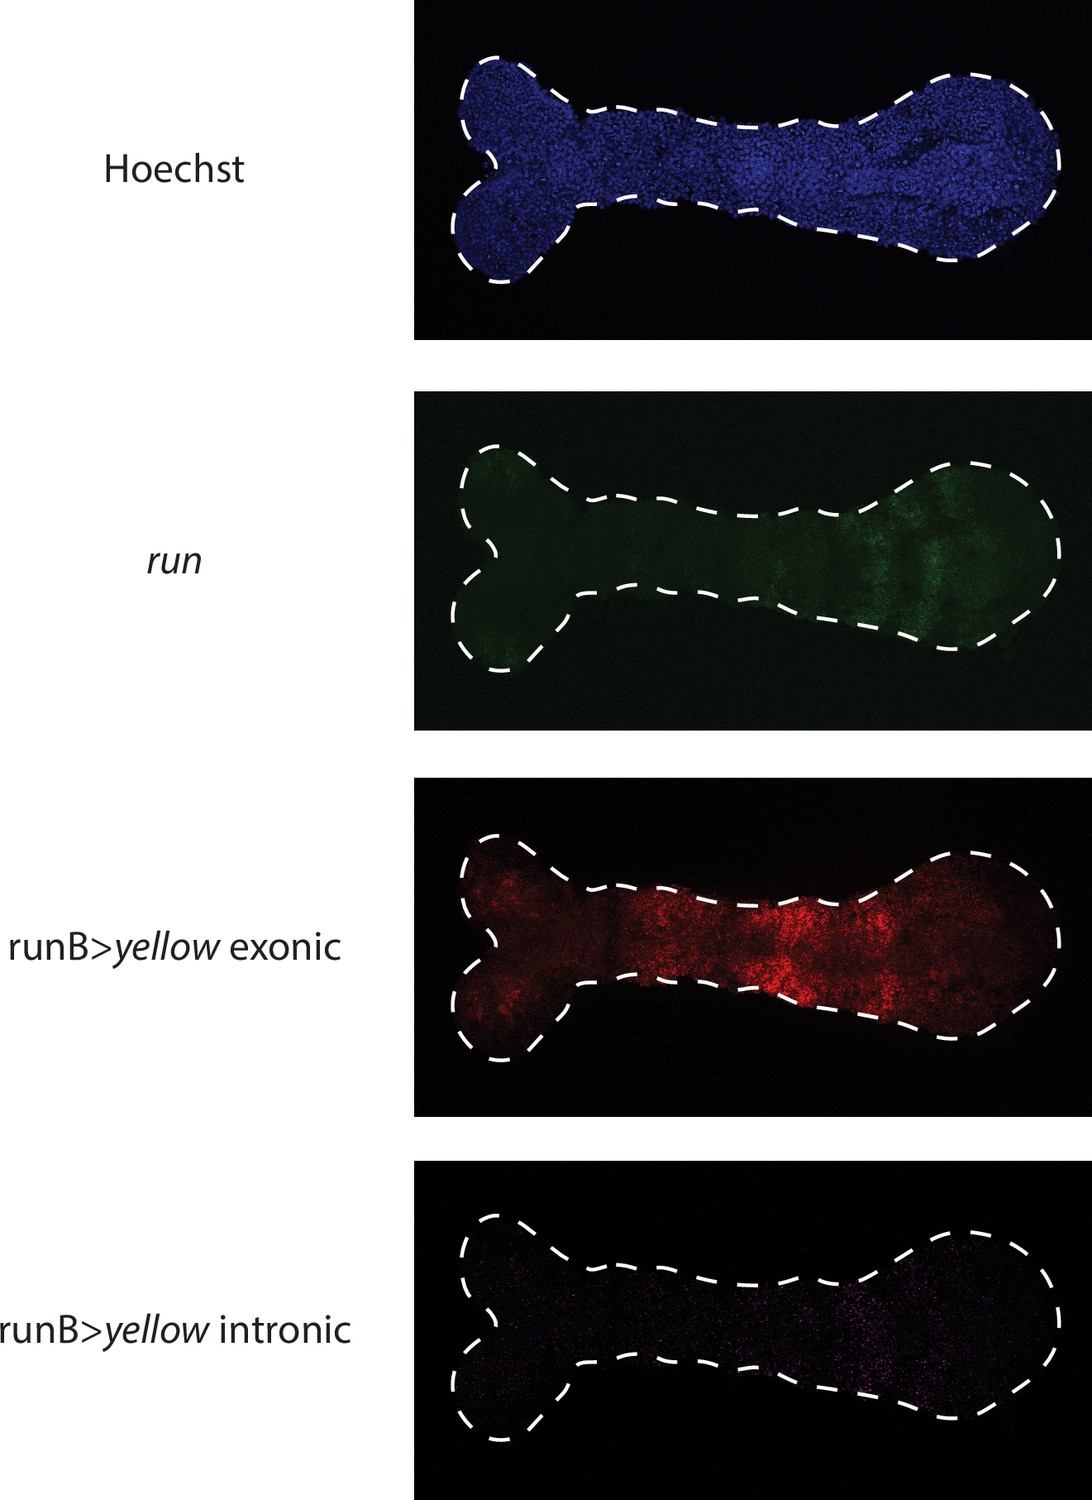
Visualizing runB >yellow expression waves in the germband using exonic vs intronic probes.
runB expression waves resemble more those of endogeneous run (shown in green) when visualized using intronic (shown in purple) in situ probes than exonic (shown in red) probes.
Figure 7
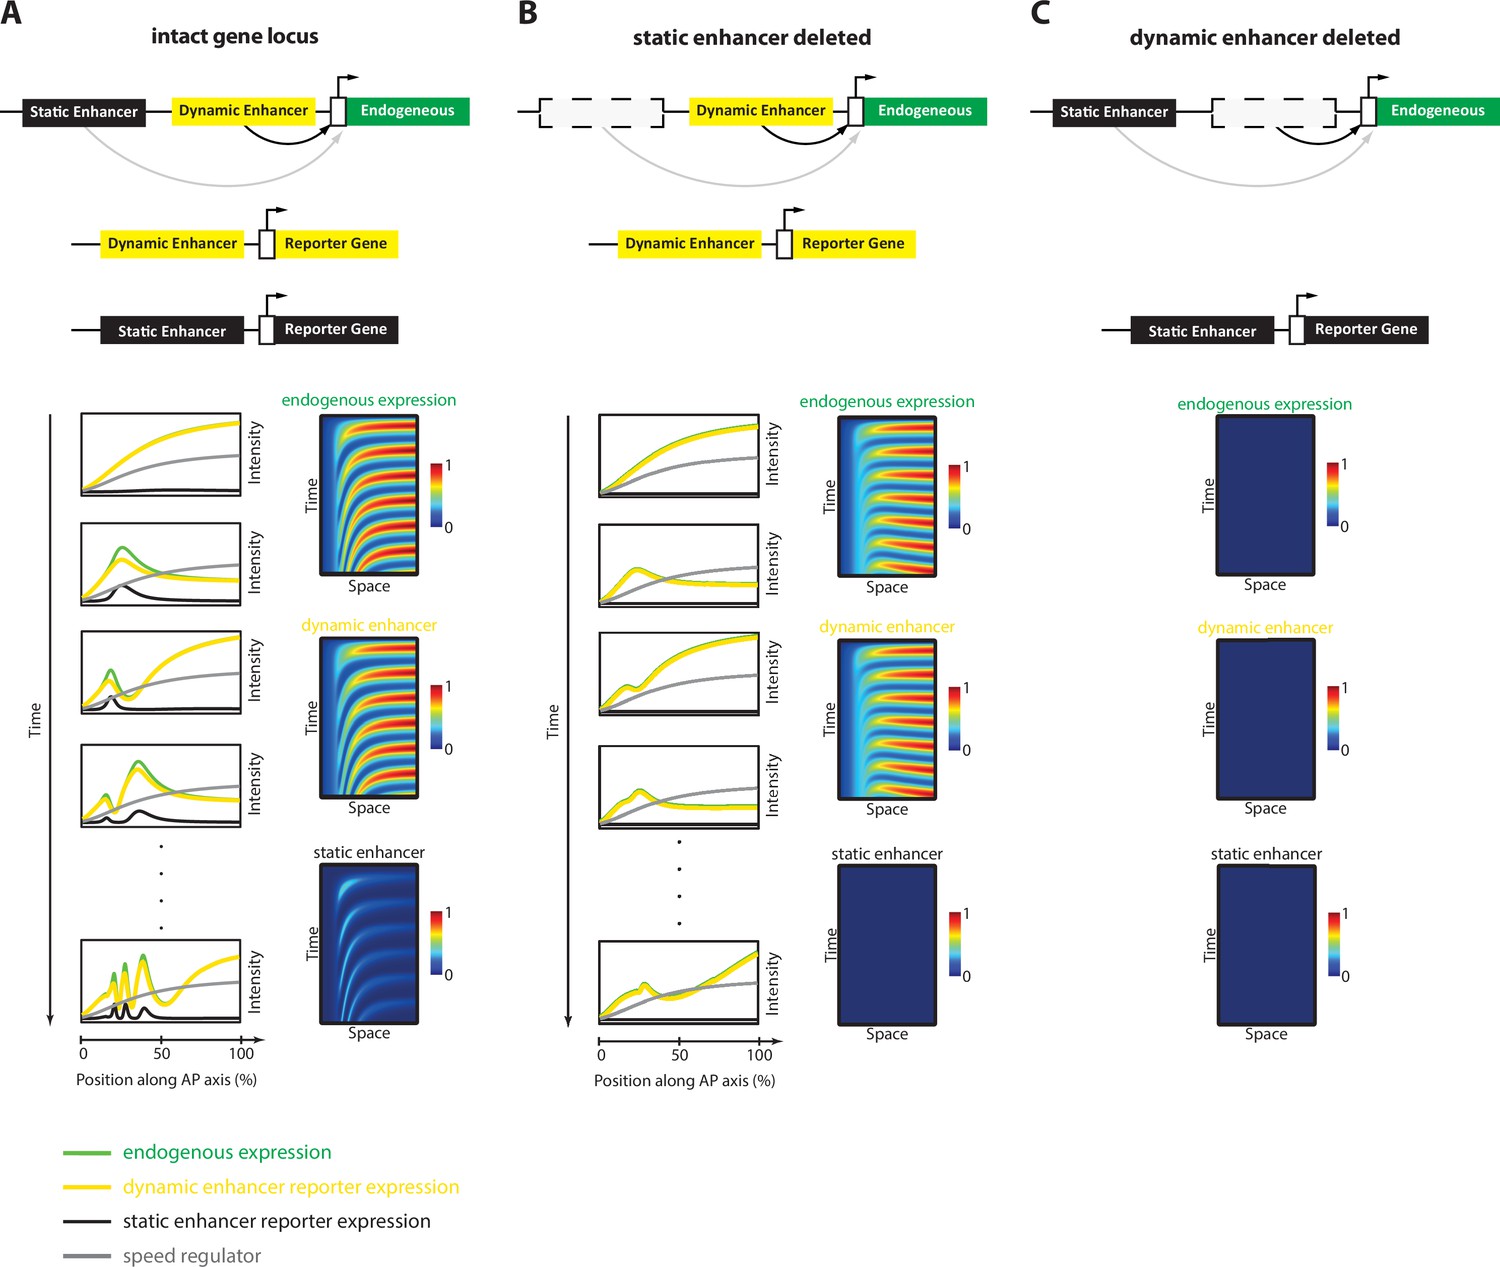
Simulation of the Enhancer Switching Model with deleted enhancers.
Shown simulation outputs of the Enhancer Switching model under three experimental conditions: (A) an intact locus, (B) a locus in which the static enhancer is deleted, and (C) a locus in which the dynamic enhancer is deleted.
Videos
Video 1
MS2 live imaging of hbA enhancer reporter.
Live imaging of a ‘hbA >MS2-yellow; aTub >MCP-mEmerlad’ Tribolium embryo during the blastoderm stage. Nuclear localization signal (NLS) signal within the aTub >MCP-mEmerald construct mediates a weak and diffuse mEmerald signal within nuclei. Upon transcription, MS2 loops within the hbA >MS2-yellow construct recruit MCP-mEmerald fusion proteins at transcription sites, resulting in mEmerald bright puncta. Here bright mEmerald puncta are observed throughout the posterior end of the blastoderm, reflecting transcriptional activity of enhancer hbA in the early Tribolium embryo. Posterior to the right.
Video 2
Simulation of the Enhancer Switching Model with strong static enhancer activity.
Shown are the outputs of a computer simulation of the Enhancer Switching model with strong static enhancer activity. Activity dynamics of reporter genes driven by the dynamic and static enhancers are shown in yellow and black, respectively. Activity dynamics of endogenous gene expression driven by both the dynamic and static enhancers are shown in green. Speed regulator gradient is shown in gray.
Video 3
Simulation of the Enhancer Switching Model with weak static enhancer activity.
Shown are the outputs of a computer simulation of the Enhancer Switching model with weak static enhancer activity. Activity dynamics of reporter genes driven by the dynamic and static enhancers are shown in yellow and black, respectively. Activity dynamics of endogenous gene expression driven by both the dynamic and static enhancers are shown in green. Speed regulator gradient is shown in gray.
Video 4
MS2 live imaging of runB enhancer reporter.
Live imaging of a ‘runB >MS2-yellow; aTub >MCP-mEmerlad’ Tribolium embryo during the blastoderm stage. Nuclear localization signal (NLS) signal within the aTub >MCP-mEmerald construct mediates a weak and diffuse mEmerald signal within nuclei. Upon transcription, MS2 loops within the runB >MS2-yellow construct recruit MCP-mEmerald fusion proteins at transcription sites, resulting in mEmerald bright puncta. Here bright mEmerald puncta are observed initially to be distributed as a posterior cap that eventually propagates towards the anterior to form a stable band. Posterior to the right.
Video 5
Estimated mRNA transcription driven by enhancer runB in the early Tribolium embryo.
Shown is a live imaging movie of a ‘runB >MS2-yellow; aTub >MCP-mEmerlad’ embryo (same as in Video 4) computationally processed to show an estimation of accumulated mRNA abundance driven by enhancer runB (red) as well as MS2-mEmerald signal (reflecting de novo transcription; green). Posterior to the right.
Video 6
Plots of estimated mRNA transcription dynamics driven by enhancer runB across space and time.
Shown is a dorsoventral projection of a tracked spatiotemporal activity of enhancer runB (same embryo as in Video 4). Horizontal axis: anterior-posterior (AP) axis; posterior to the right.
Video 7
Estimated mRNA transcription driven by enhancer hbA in the early Tribolium embryo.
Shown is a live imaging movie of a ‘hbA >MS2-yellow; aTub >MCP-mEmerlad’ embryo (same as in Video 4) computationally processed to show an estimation of accumulated mRNA abundance driven by enhancer hbA (red) as well as MS2-mEmerald signal (reflecting de novo transcription; green). Posterior to the right.
Video 8
Plots of estimated mRNA transcription dynamics driven by enhancer hbA across space and time.
Additional files
-
Supplementary file 1
List of used primers.
frw: forward, rev: reverse.
- https://cdn.elifesciences.org/articles/84969/elife-84969-supp1-v2.docx
-
MDAR checklist
- https://cdn.elifesciences.org/articles/84969/elife-84969-mdarchecklist1-v2.docx
Download links
A two-part list of links to download the article, or parts of the article, in various formats.
Downloads (link to download the article as PDF)
Open citations (links to open the citations from this article in various online reference manager services)
Cite this article (links to download the citations from this article in formats compatible with various reference manager tools)
How enhancers regulate wavelike gene expression patterns
eLife 12:e84969.
https://doi.org/10.7554/eLife.84969


