Brain structure and function link to variation in biobehavioral dimensions across the psychopathological continuum
- Department of Psychiatry, Radboud University Nijmegen Medical Centre, Netherlands
- Department of Cognitive Neuroscience, Radboud University Nijmegen Medical Centre, Netherlands
- Donders Institute for Brain, Cognition and Behavior, Radboud University Nijmegen, Netherlands
- Pro Persona Mental Health Care, Depression Expertise Center, Netherlands
- Oxford Centre for Functional Magnetic Resonance Imaging of the Brain (FMRIB), University of Oxford, United Kingdom
Figures
Figure 1
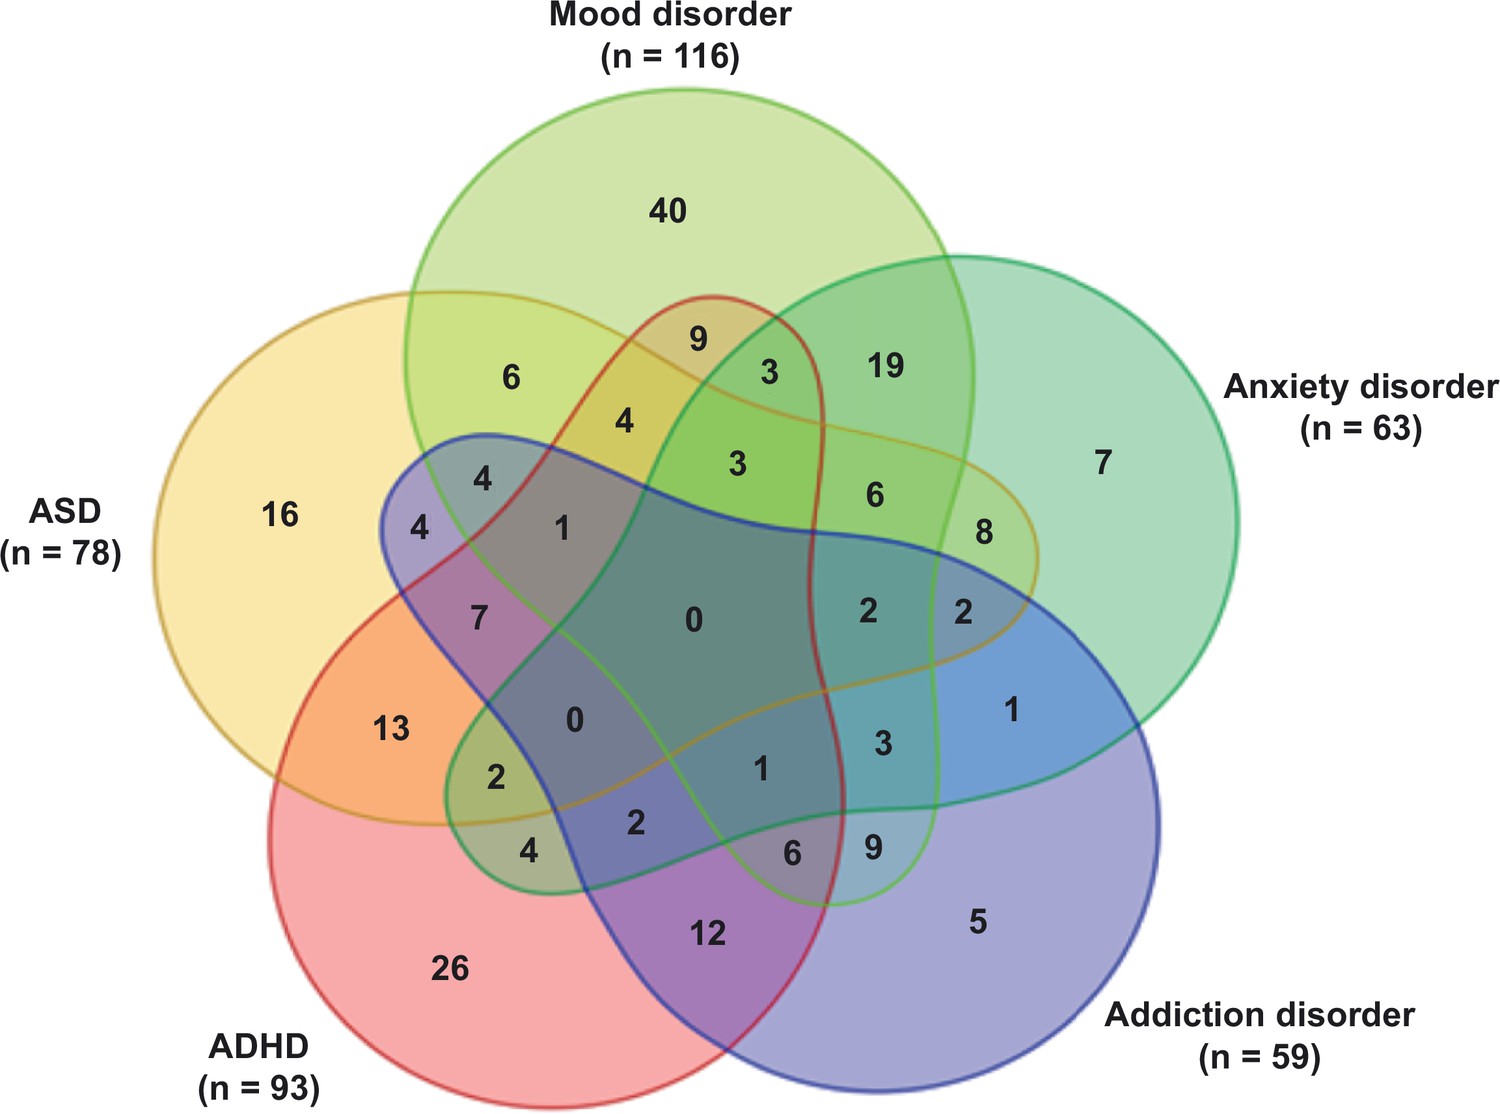
Venn diagram displaying the distribution of the psychiatric patients over the different diagnostic categories: mood disorder, anxiety disorder, addiction disorder, attention-deficit hyperactivity disorder (ADHD), and autism spectrum disorder (ASD).
All diagnoses in this Venn diagram represent current diagnoses.
Figure 2

Data processing pipeline.
(A). Experimental design: subjects entered the scanner after a 45 min acclimatization period outside the scanner. The whole MIND-Set MRI protocol consists of a series of scans, of which we selected the following scans for the present study: two structural scans: T1 structural scan and diffusion tensor imaging (DTI) scan. Furthermore, we selected three functional scans, representing a baseline resting-state scan (rest), the scan during stress induction with an aversive movie clip (stress scan), and the resting-state scan directly after the stress induction, which will be referred to as the stress-aftermath scan. (B) The relevant features were extracted from the selected scans. From the structural scans: voxel-based morphometry (VBM), fractional anisotropy (FA), and mean diffusivity (MD). From each functional scan, we extracted the whole-brain spatial maps of our networks of interest: default mode network (DMN), executive control network (ECN), and frontoparietal network (FPN). (C) These features were used as input in the linked ICA algorithm. (D) Spearman correlations were performed between the subject loadings of each independent component and all the (bio)behavioral measures of interest (i.e. symptom questionnaires, demographics, other biobehavioral measures). (This figure is inspired by the figure of Llera et al., 2019.)
Figure 3
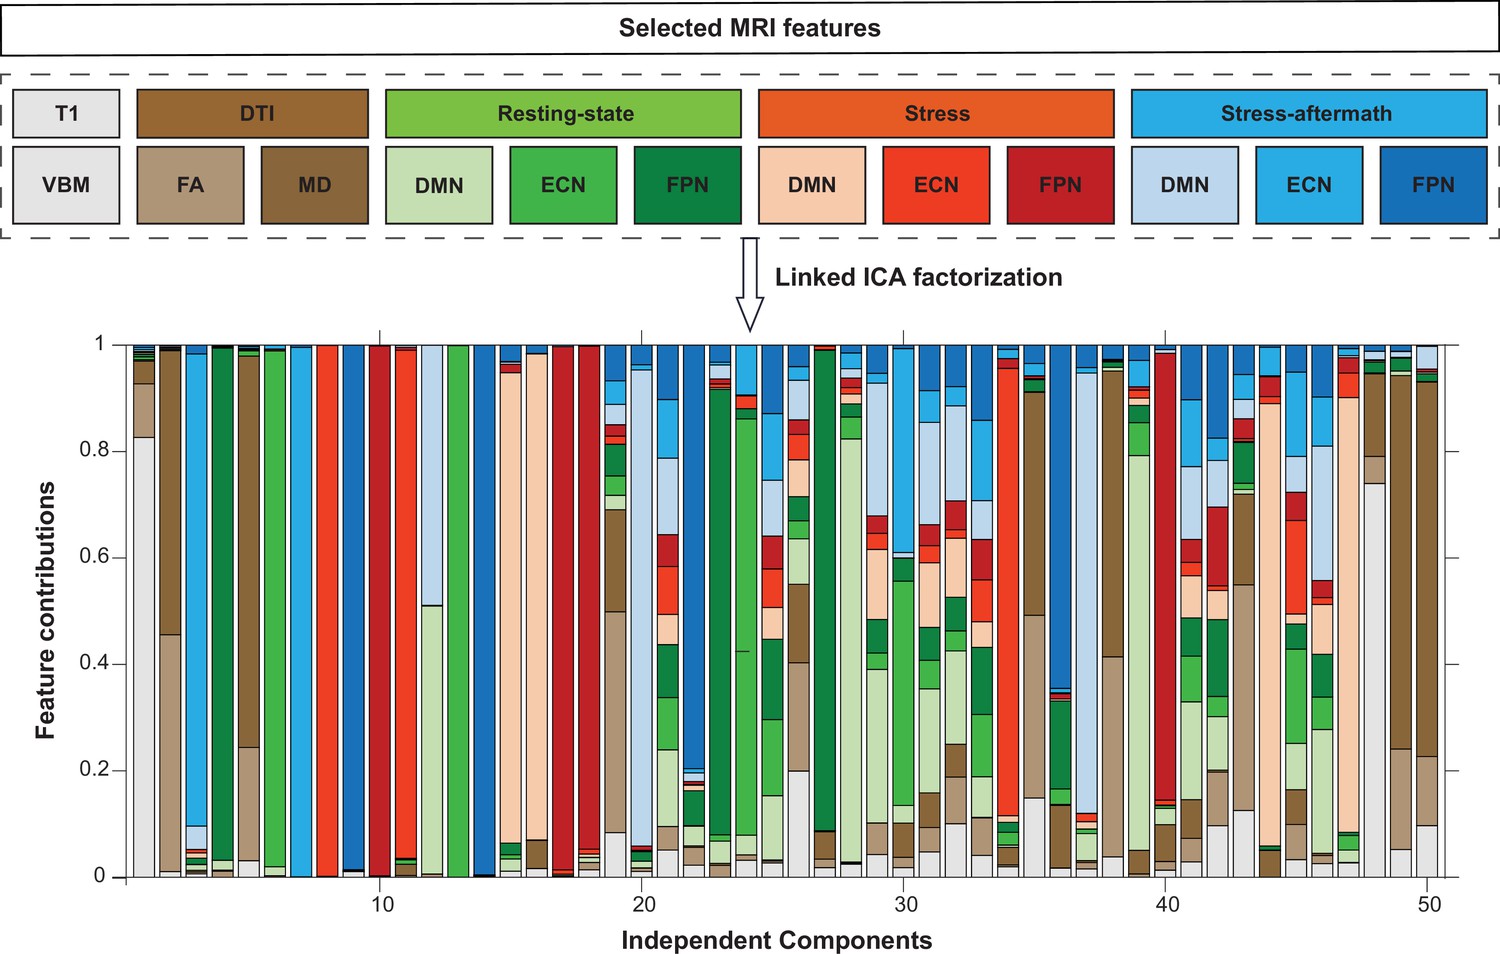
Linked independent component analysis (ICA) decomposition.
Linked ICA was used to simultaneously factorize the selected MRI features into 50 independent components. The stacked bargraph displays to what extent these independent components are driven by the different imaging features. DMN: default mode network; DTI: diffusion tensor imaging scan; ECN: executive control network; FA: fractional anisotropy; FPN: frontoparietal network; MD: mean diffusivity; VBM: voxel-based morphometry.
Figure 4
Multimodal component 32 (IC32).
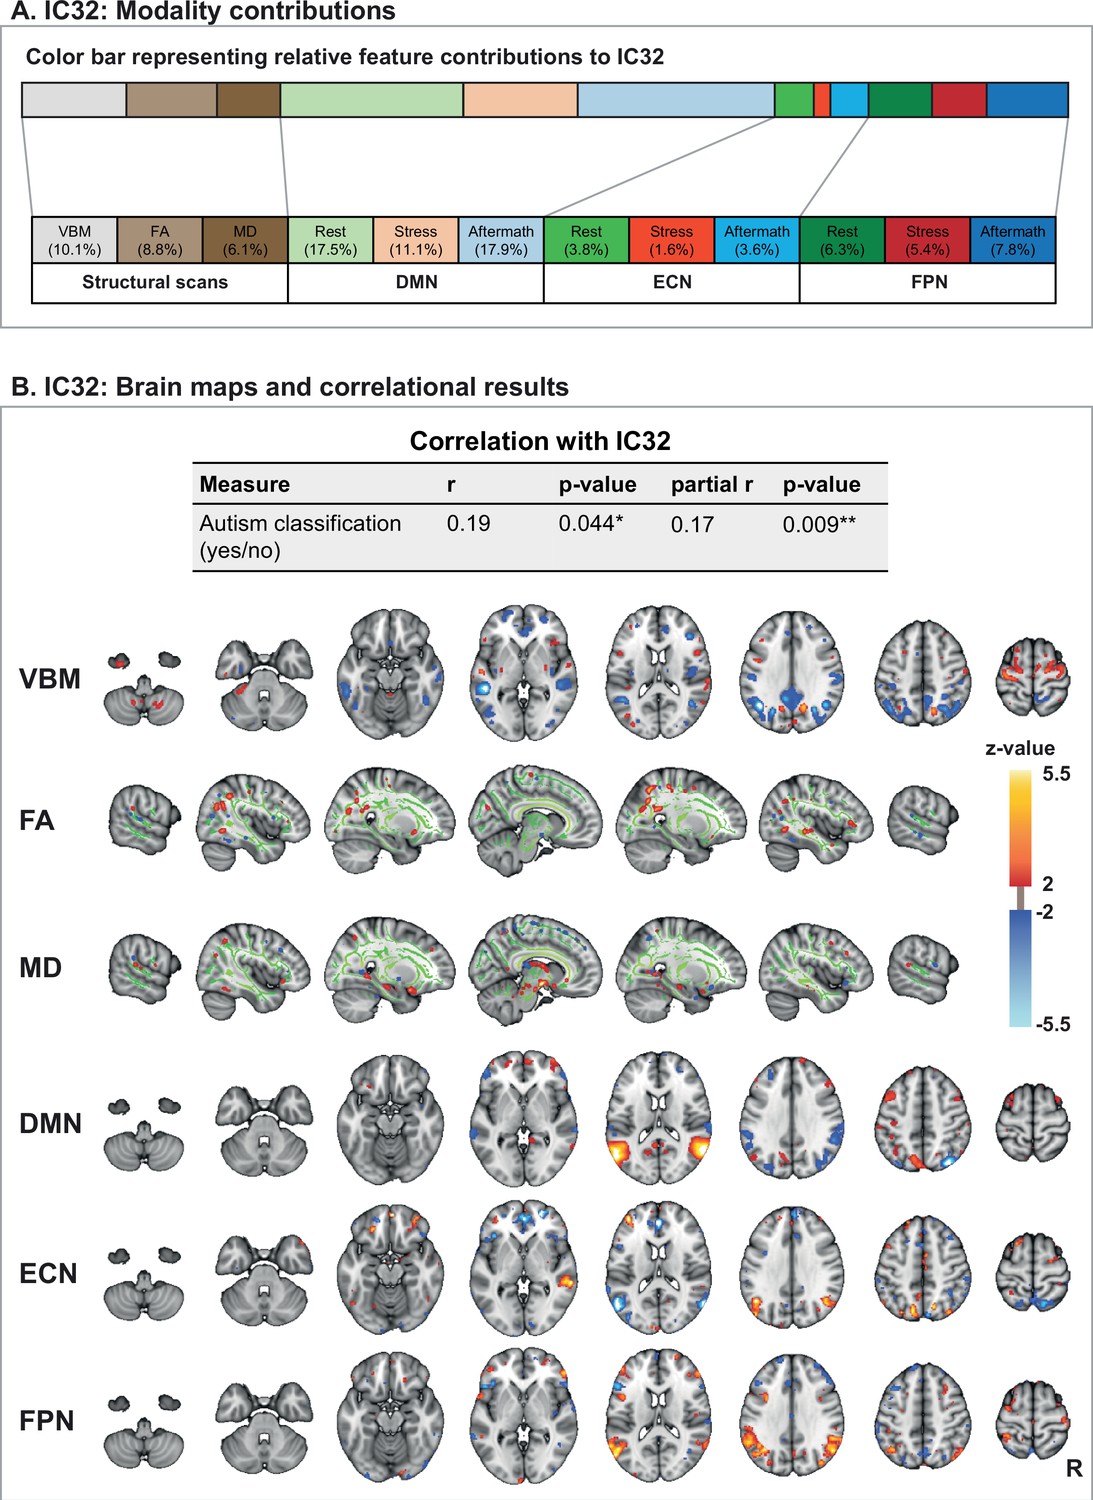
(A) Modality contributions to IC32. The color bar is a graphical representation of the relative contribution of the 12 feature modalities to IC32. The numbers below state the exact percentages of the different modality contributions. (B) The subject loadings on IC32 have a significant correlation with a psychiatric classification of autism (yes/no). This component is a multimodal component, with contributions from all 12 features. From top to bottom, we visualize voxel-based morphometry (VBM), fractional anisotropy (FA), mean diffusivity (MD), and the spatial maps for the following networks: the default mode network (DMN), executive control network (ECN), and frontoparietal network (FPN). Since the three functional networks of interest showed similar spatial configurations during the different functional scans (i.e. resting-state, stress, and stress-aftermath scan), we only display the spatial maps from one functional scan here (i.e. the stress-aftermath scan). Note: in this figure, the right side of the brain is displayed on the right side of the image. R: right.
-
Figure 4—source data 1
Correlation for IC32.
- https://cdn.elifesciences.org/articles/85006/elife-85006-fig4-data1-v2.xlsx
Figure 5

ECN-stress aftermath component (IC7) and DMN-stress component (IC15).
(A) Independent component 7 (IC7) is driven by the executive control network (ECN) during the stress-aftermath scan (99.5%). This component reflects the connectivity of the ECN with itself and with the right frontoparietal network (FPN) and has significant (partial) Spearman correlations with several symptoms and other measures of interest. For this component, we used the 10th and 90th percentiles for thresholding, for display purposes, since the underlying distribution was not z-distributed. (B) Independent component 15 (IC15) is mainly driven by the default mode network (DMN) during the stress scan (88.4%). IC15 negatively correlates with the fear of losing control/losing one’s mind under stress (mental incapacitation concerns subscale). In this figure, the right side of the brain is displayed on the right side of the image.ASI: Anxiety Sensitivity Index;BRIEF-A: Behavior Rating Inventory Executive Function – Adult; HRV: heart rate variability; IDS: Inventory of Depressive Symptomatology Self Report; R: right; SF: Short Form-20; WHODAS: WHO-Disability Assessment Schedule 2.0. Cave: in general, a higher score on a questionnaire reflects more severe symptoms/problems, except for the SF subscales ‘experienced health’ and ‘physical functioning,’ for which this is reversed.
-
Figure 5—source data 1
Correlations for IC7 and IC15.
- https://cdn.elifesciences.org/articles/85006/elife-85006-fig5-data1-v2.xlsx
Appendix 1—figure 1
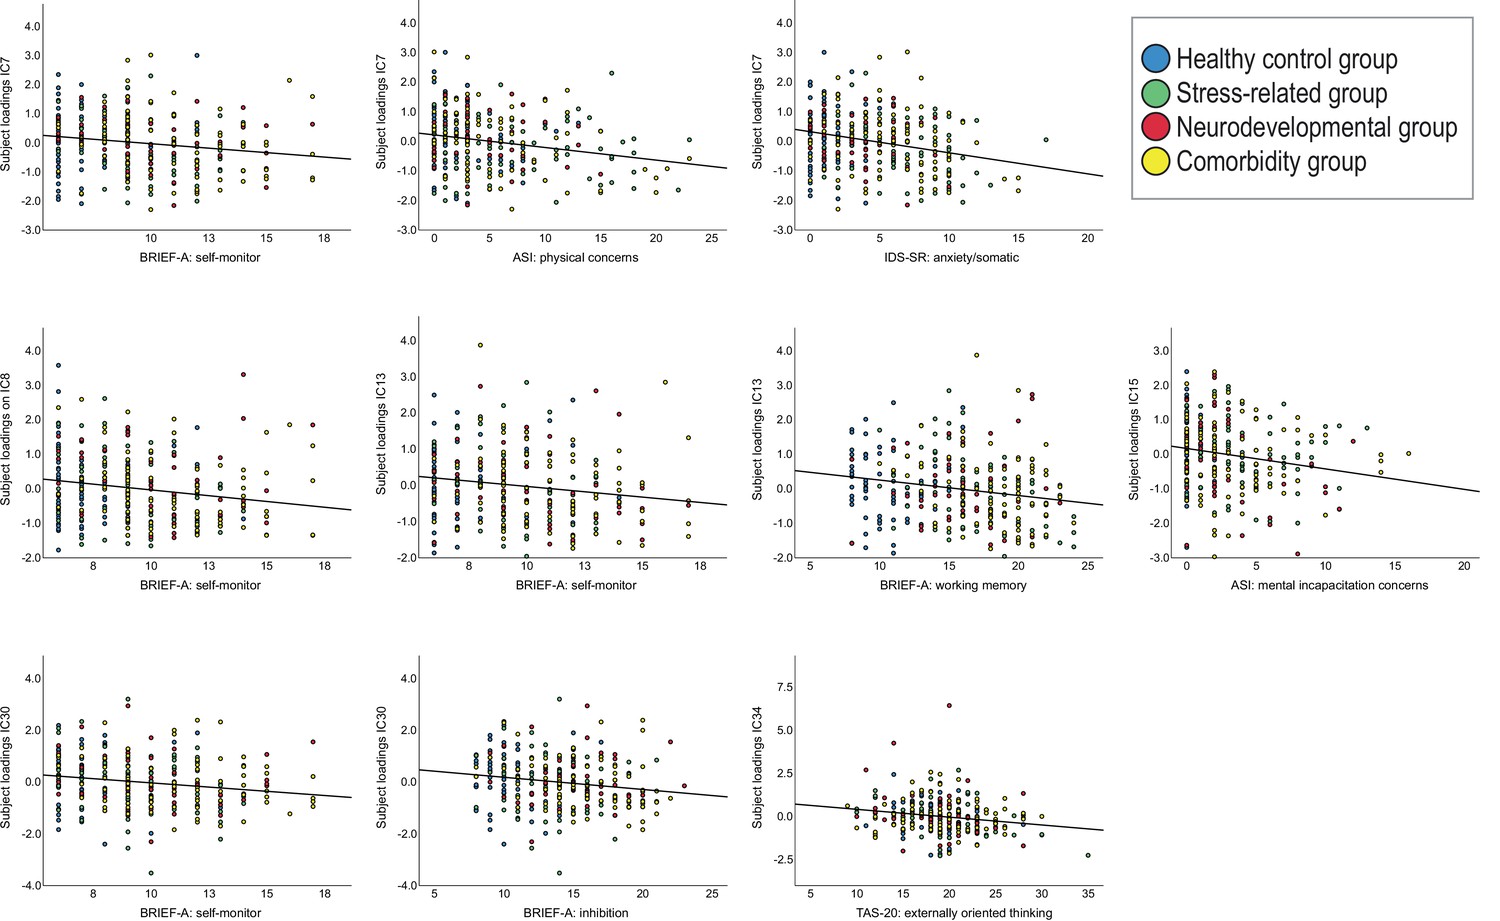
Scatterplots displaying the relationships between the symptom dimensions and independent components (ICs).
Appendix 1—figure 2
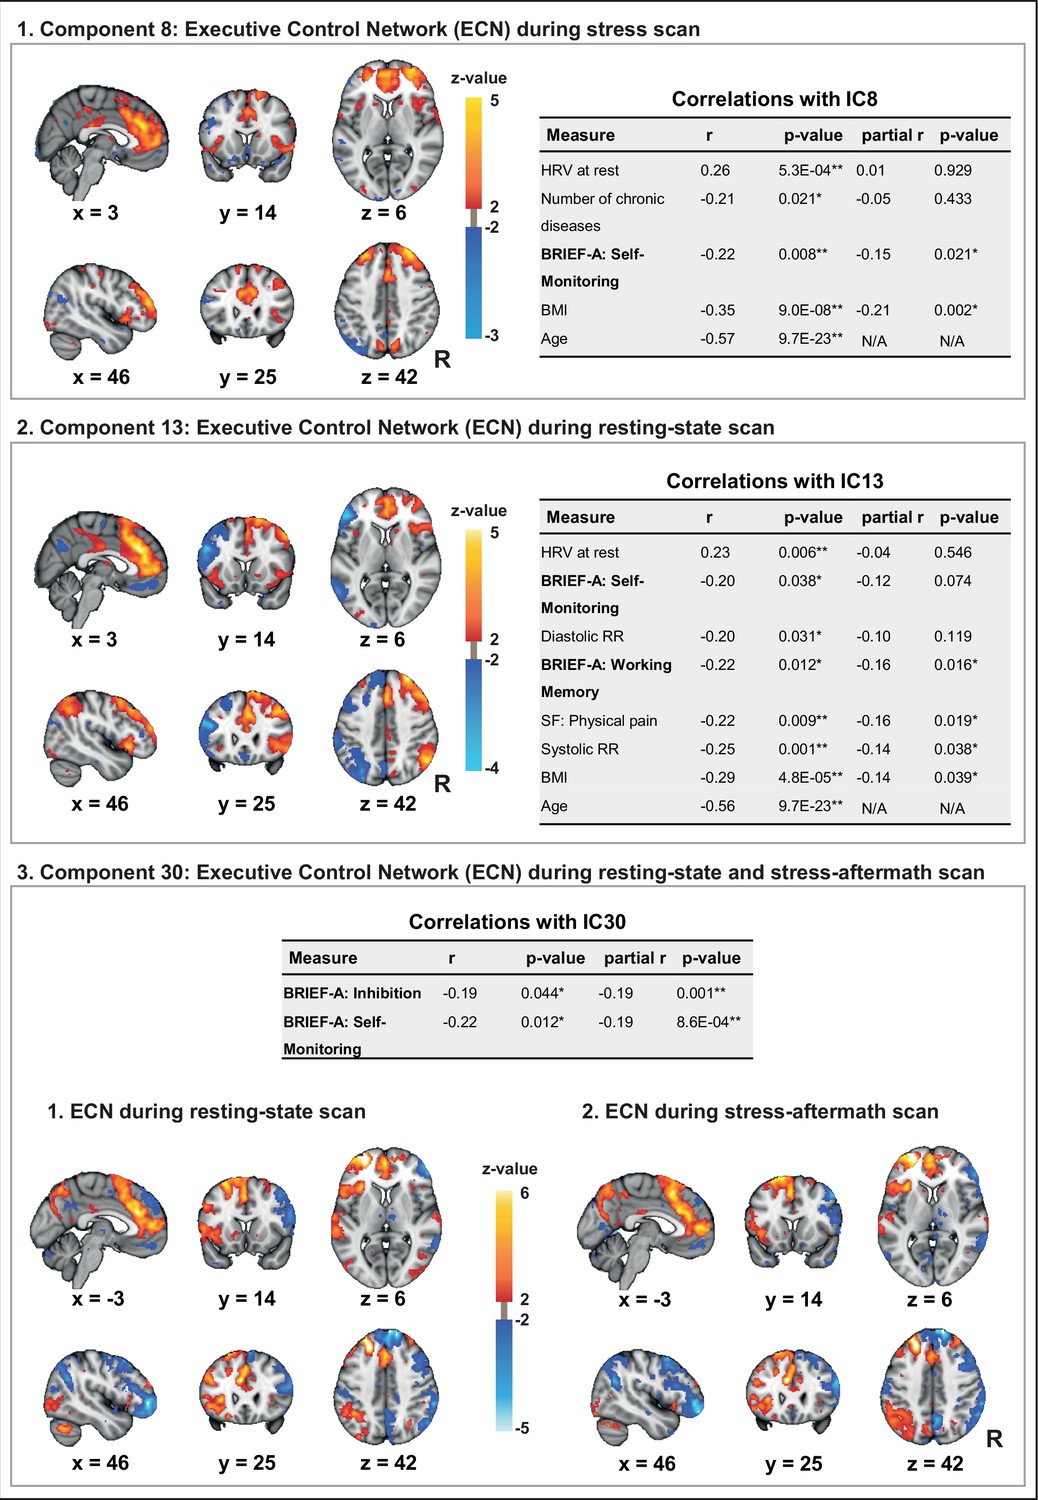
The components displayed here have important similarities with independent component 7 since all these components reflect connectivity of the executive control network (ECN) with itself and with the frontoparietal network (FPN).
(1) Independent component 8 is driven by the ECN during the stress scan (99.8%). (2) Independent component 13 is driven by the ECN during the resting-state scan (99.9%). (3) Independent component 30 is mainly driven by the ECN during the resting-state scan (42.2%) and stress-aftermath scan (38.3%). For all components in this figure, we used the 10 and 90 percentiles for thresholding, for display purposes, since the underlying distribution was not z-distributed. In this figure, the right side of the brain is displayed on the right side of the image. R: right.
-
Appendix 1—figure 2—source data 1
Correlations for IC8, IC13, and IC30.
- https://cdn.elifesciences.org/articles/85006/elife-85006-app1-fig2-data1-v2.xlsx
Appendix 1—figure 3
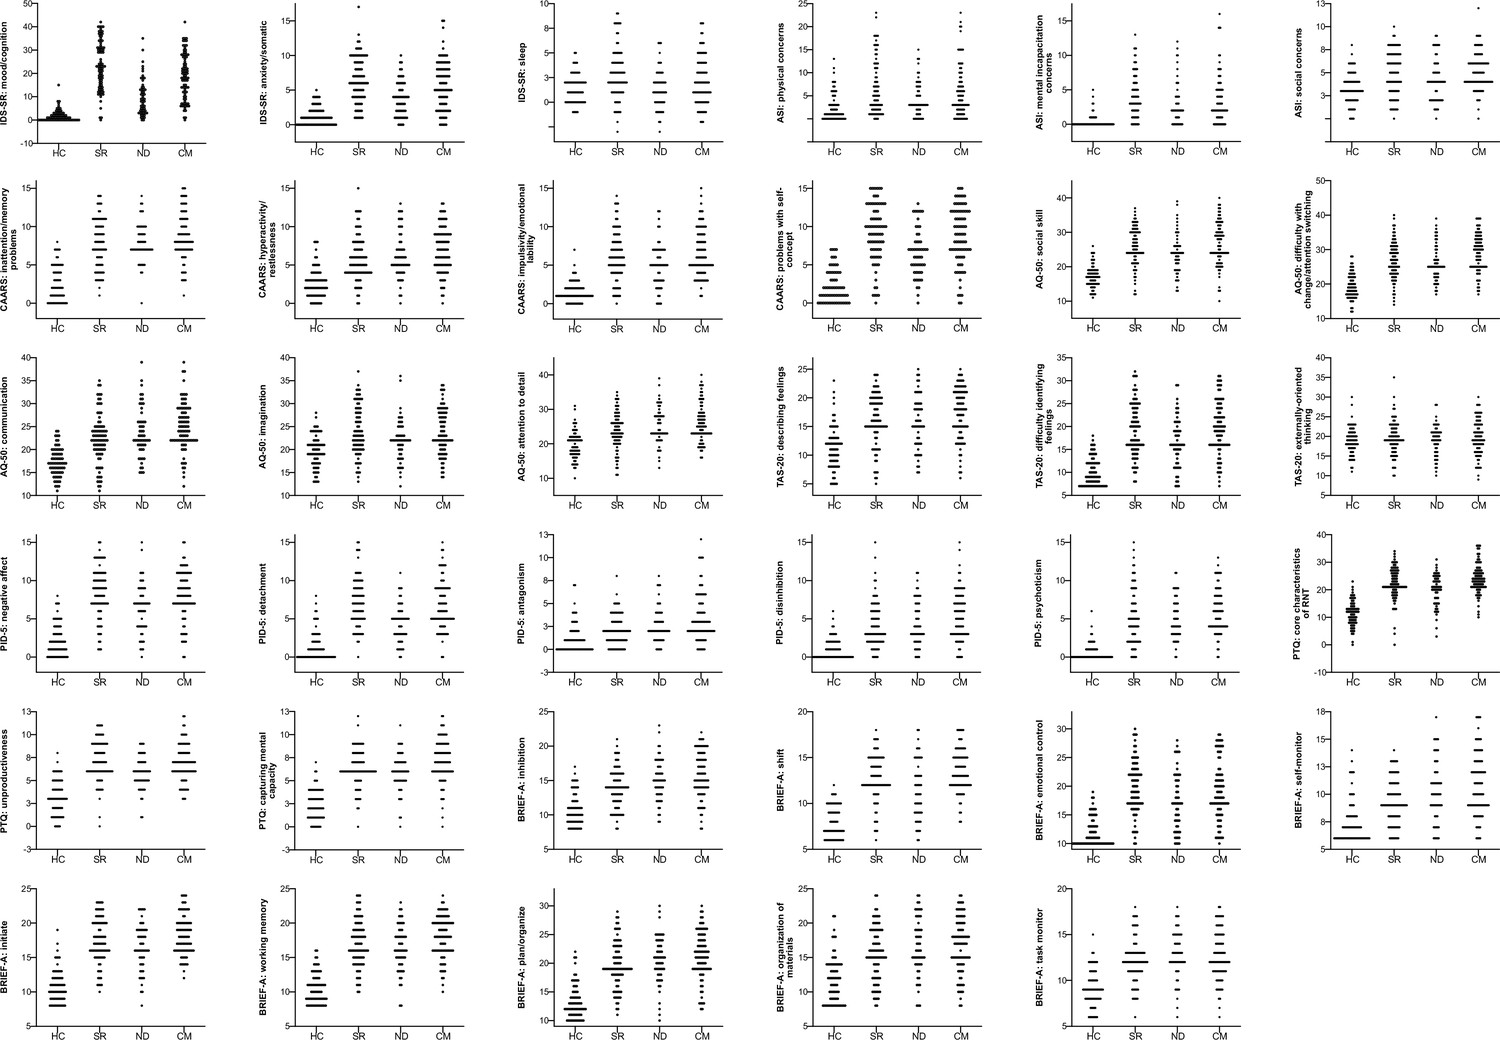
Dot plots for symptom dimensions across the subgroups.
ASI: Anxiety Sensitivity Index; AQ-50: Autism spectrum Quotient-50; BRIEF-A: Behavior Rating Inventory Executive Function – Adult; CAARS: Conners’ Adult ADHD Rating Scale; CM: comorbidity group; HC: mentally healthy controls; IDS-SR: Inventory of Depressive Symptomatology Self Report; ND: neurodevelopmental group; PID-5: Personality Inventory for DSM-5-Short Form; PTQ: Perseverative Thinking Questionnaire; RNT: repetitive negative thinking; SR: stress-related group; TAS-20: Toronto Alexithymia Scale-20.
Appendix 1—figure 4
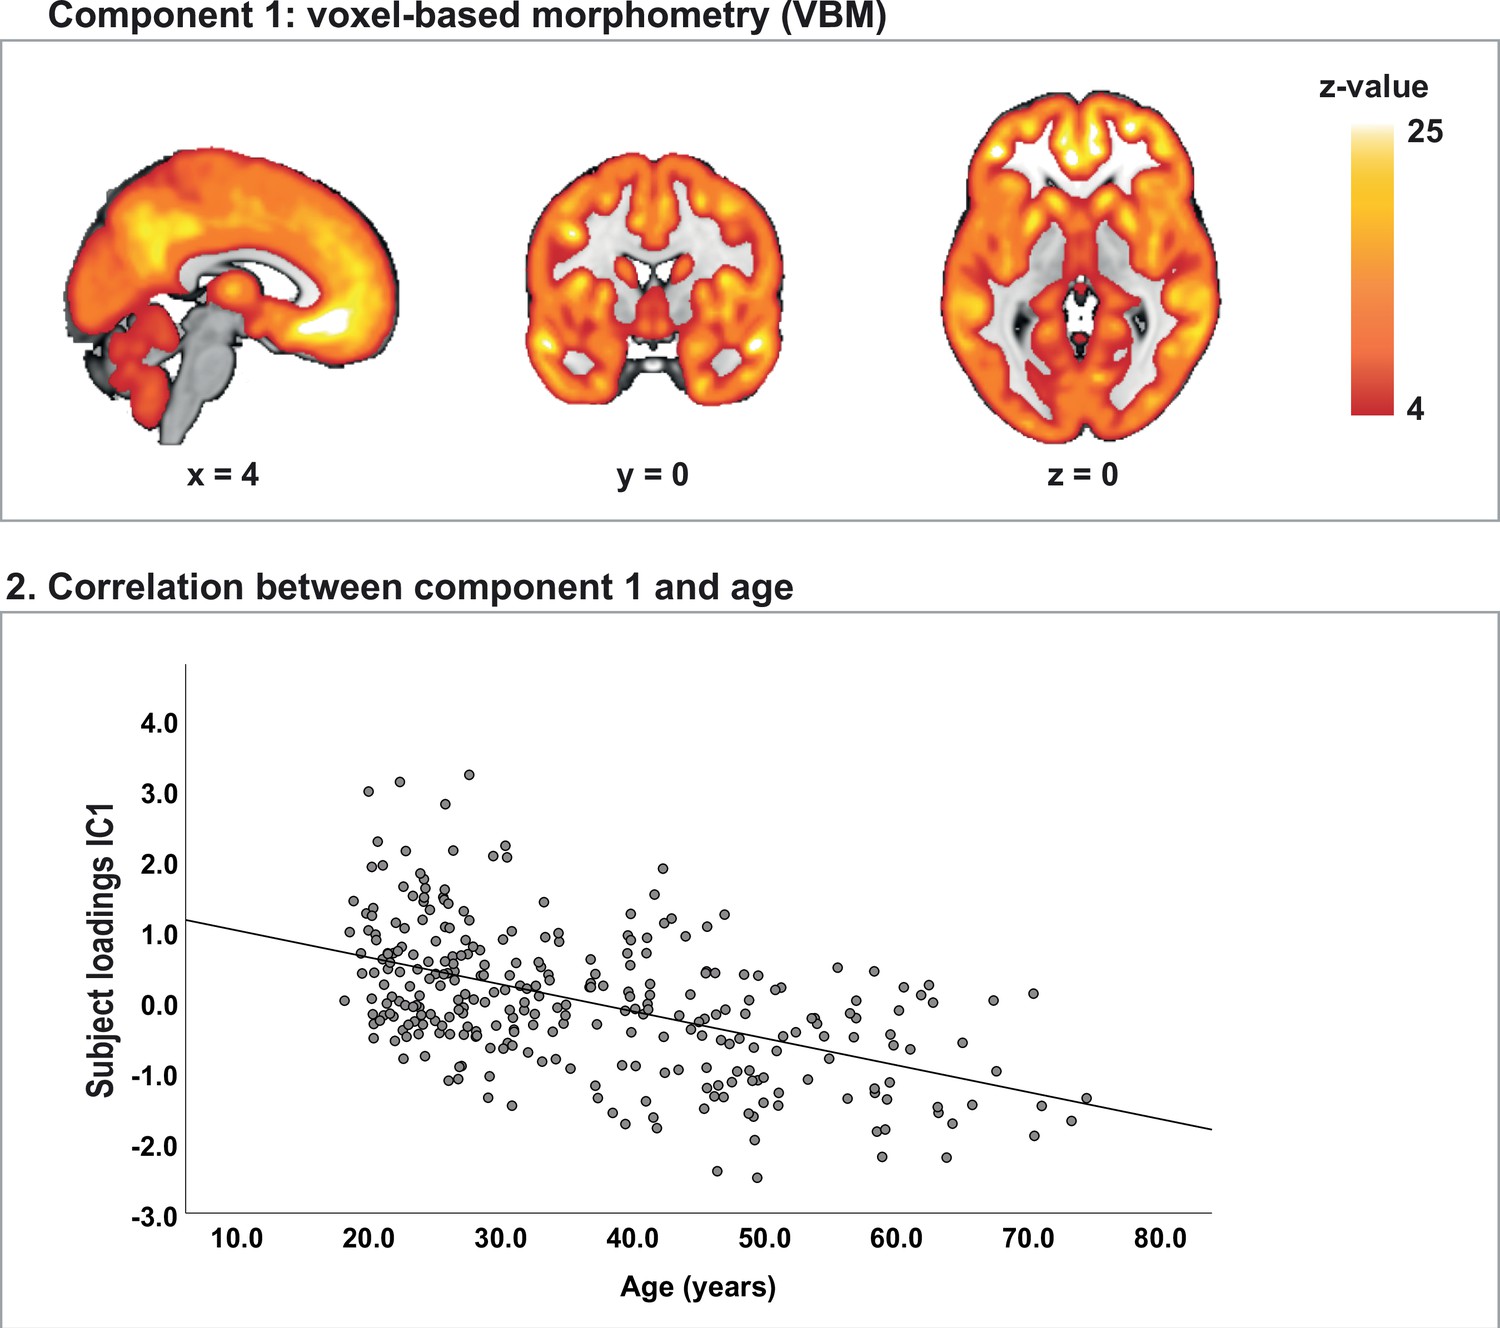
Test for direction of correlational results.
(1) Independent component 1 (IC1) is driven by the voxel-based morphometry (VBM) modality (82.7%) and reflects global gray matter volume.(2) The subject loadings on IC1 were negatively correlated with age (rs = –0.50, p=9.7E-18).
Tables
Table 1
Demographics and clinical characteristics.
| Total subject group(n = 295) | Patients(n = 225) | Healthy controls(n = 70) | |
|---|---|---|---|
| Demographics | |||
| Age (years) (median, range) | 32 (18–74) | 32 (18–74) | 32 (20–70) |
| Sex, % male (M/F) | 56.6% (167/128) | 59.6% (134/91) | 47.1% (33/37) |
| Level of education No (n = .., (%)) Low (n = .., (%)) Middle (n = .., (%)) High (n = .., (%)) | 1 (0.0%) 41 (13.9%) 125 (42.4%) 128 (43.4%) | 1 (0.0%) 37 (16.4%) 103 (45.8%) 84 (37.3%) | 0 (0.0%) 4 (5.7%) 22 (31.4%) 44 (62.9%) |
| Symptom questionnaires | |||
| IDS-SR (median, range) | |||
| Mood/cognition | 13 (0–42) | 18 (0–42) | 1 (0–15) |
| Anxiety/somatic | 4 (0–17) | 5 (0–17) | 1 (0–5) |
| Sleep | 2 (−3–9) | 2 (−3–9) | 1 (−1–5) |
| ASI (median, range) | |||
| Physical concerns | 3 (0–23) | 4 (0–23) | 1 (0–13) |
| Mental incapacitation concerns | 2 (0–16) | 3 (0–16) | 0 (0–5) |
| Social concerns | 4 (0–12) | 5 (0–12) | 3 (0–8) |
| PTQ (median, range) | |||
| Core characteristics | 21 (0–36) | 22 (0–36) | 12 (0–23) |
| Unproductiveness | 6 (0–12) | 7 (0–12) | 3 (0–8) |
| Capturing mental capacity | 6 (0–12) | 6 (0–12) | 2 (0–7) |
| CAARS (median, range) | |||
| Inattention/memory problems | 7 (0–15) | 8 (0–15) | 2 (0–8) |
| Hyperactivity/restlessness | 5 (0–15) | 6 (0–15) | 2 (0–8) |
| Impulsivity/emotional lability | 5 (0–15) | 6 (0–15) | 1 (0–7) |
| Problems with self-concept | 7 (0–15) | 8 (0–15) | 2 (0–7) |
| AQ-50 (median, range) | |||
| Social skill | 24 (10–40) | 25 (10–40) | 17 (11–26) |
| Difficulty with change/attention switching | 25 (12–40) | 27 (14–40) | 19 (12–28) |
| Communication | 22 (11–39) | 23 (11–39) | 17 (11–24) |
| Imagination | 22 (12–37) | 22 (12–37) | 19.5 (13-28) |
| Attention to detail | 23 (10–40) | 24 (11–40) | 19.5 (10–31) |
| TAS-20 (median, range) | |||
| Difficulty describing feelings | 15 (5–25) | 17 (5–25) | 11 (5–23) |
| Difficulty identifying feelings | 16 (7–32) | 18 (7–32) | 9 (7–18) |
| Externally oriented thinking | 19 (9–35) | 19 (9–35) | 19 (11–30) |
| PID-5 (median, range) | |||
| Negative affect | 7 (0–15) | 8 (0–15) | 2 (0–8) |
| Detachment | 5 (0–15) | 6 (0–15) | 1 (0–8) |
| Antagonism | 2 (0–12) | 2 (0–12) | 1 (0–7) |
| Disinhibition | 3 (0–15) | 4 (0–15) | 0.5 (0–6) |
| Psychoticism | 4 (0–15) | 5 (0–15) | 0 (0–6) |
| BRIEF-A (median, range) | |||
| Inhibition | 14 (8–23) | 15 (8–23) | 10 (8–17) |
| Shift | 12 (6–18) | 13 (6–18) | 7.5 (6-12) |
| Emotional control | 17 (10–30) | 18 (10–30) | 11 (10–19) |
| Self-monitor | 9 (6-17) | 10 (6–17) | 7 (6-14) |
| Initiate | 16 (8–24) | 17 (8–24) | 10 (8–19) |
| Working memory | 16 (8–24) | 17 (8–24) | 10 (8–16) |
| Plan/organize | 19 (10–30) | 20 (10–30) | 12 (10–22) |
| Organization of materials | 15 (8–24) | 16 (8–24) | 12 (8–21) |
| Task monitor | 12 (6–18) | 12 (6–18) | 9 (6-15) |
-
ASI: Anxiety Sensitivity Index, AQ-50: Autism spectrum Quotient-50, BRIEF-A: Behavior Rating Inventory Executive Function – Adult, CAARS: Conners’ Adult ADHD Rating Scale, F: female, IDS-SR: Inventory of Depressive Symptomatology Self Report, M: male, PID-5: Personality Inventory for DSM-5-Short Form, PTQ: Perseverative Thinking Questionnaire, TAS-20: Toronto Alexithymia Scale-20.
Appendix 1—table 1
Symptom measures.
| Topic | Questionnaire | Abbreviation questionnaire | Questionnaire subscales (n = 35) | Reference for questionnaire subscales |
|---|---|---|---|---|
| Depressive symptoms | Inventory of Depressive Symptomatology Self Report | IDS-SR | 1.Mood/cognition 2.Anxiety/somatic 3.Sleep | Wardenaar et al., 2010 |
| Anxiety sensitivity | Anxiety Sensitivity Index | ASI | 1.Physical concerns 2.Mental incapacitation concerns 3.Social concerns | Rodriguez et al., 2004 |
| Attention-deficit hyperactivity disorder symptoms | Conners’ Adult ADHD Rating Scale | CAARS | 1.Inattention/memory problems 2.Hyperactivity/restlessness 3.Impulsivity/emotional lability 4.Problems with self-concept | Conners et al., 1999 |
| Autistic traits | Autism spectrum Quotient-50 | AQ-50 | 1.Social skill 2.Difficulty with change/attention switching 3.Communication 4.Imagination 5.Attention to detail | Hoekstra et al., 2008 |
| Alexithymia | Toronto Alexithymia Scale-20 | TAS-20 | 1.Describing feelings 2.Difficulty identifying feelings 3.Externally oriented thinking | Bagby et al., 1994 |
| Personality traits | Personality Inventory for DSM-5-Short Form | PID-5-B-Adult | 1.Negative affect 2.Detachment 3.Antagonism 4.Disinhibition 5.Psychoticism | Krueger et al., 2012 |
| Repetitive negative thinking (RNT) | Perseverative Thinking Questionnaire | PTQ | 1.Core characteristics of RNT 2.Unproductiveness 3.Capturing mental capacity | Ehring et al., 2011 |
| Behavioral regulation | Behavior Rating Inventory Executive Function – Adult | BRIEF-A | 1.Inhibition 2.Shift 3.Emotional control 4.Self-monitor 5.Initiate 6.Working memory 7.Plan/organize 8.Organization of materials 9.Task monitor | Hocking et al., 2015 |
Appendix 1—table 2
Demographics and biobehavioral measures of interest*.
| Topic | Measures for correlational analysis (n = 45) | Assessment | Description of measure | Reference for background information |
|---|---|---|---|---|
| Demographics | Age | Demographics standard questionnaire | Age in years | Stronks et al., 2013 |
| Sex | Male/female | |||
| Level of education | 4 levels: no, low, middle, high | Ikram et al., 2015, Stronks et al., 2013 | ||
| Anthropometric measure | BMI | Weight scale and stadiometer | BMI = weight/(length^2) (weight in kilogram, length in meter) | van Eijndhoven et al., 2021 |
| Biological/ physiological measures | Systolic blood pressure | Blood pressure band | Systolic blood pressure (mmHg) | van Eijndhoven et al., 2021 |
| Diastolic blood pressure | Diastolic blood pressure (mmHg) | |||
| Heart rate during resting-state scan | Infrared pulse oximeter in MRI scanner | Heart rate in beats per minute (BPM) during the resting-state scan Calculated using in-house software | van Oort et al., 2020, see also Figure 1 for moment of measurements | |
| Stress-induced change in heart rate (stress – neutral) | Stress-induced change in heart rate (BPM): during stress movie minus during neutral movie | |||
| Heart rate variability (HRV) during resting-state scan | HRV is calculated using the a trimmed version (trimming lowest and highest 10% of values) of the root mean square of successive differences (rMSSD) | Shaffer and Ginsberg, 2017 | ||
| Stress-induced change in HRV | Stress-induced change in trimmed rMSSD score (see above): during stress movie minus during neutral movie | |||
| Baseline cortisol | Salivette for saliva cortisol | Saliva cortisol level during acclimatization period (20 min before scanning) | Kirschbaum and Hellhammer, 1994, van Oort et al., 2020 | |
| Cortisol after stress induction | Saliva cortisol level ±25 min after the start of the stress induction | Kirschbaum and Hellhammer, 1994, van Oort et al., 2020 | ||
| Hair cortisol | Hair sample from scalp | Hair sample from scalp (>3 cm length) | Staufenbiel et al., 2015 | |
| Somatic disorders | Number of chronic somatic disorders | Statistics Netherlands questionnaire (CBS) | Number of chronic disorders including hypertension, for which a participant is under treatment from a doctor and/or for which the participant uses medication | Bekhuis et al., 2016 |
| Subjective stress | Subjective stress at baseline in scanner | In-house questionnaire | Subjective stress rating on an eleven-point rating scale (0–10) directly after the resting-state scan | See Figure 1 of van Oort et al., 2020 |
| Stress-induced change in subjective stress | Subjective stress rating (see above): stress minus control condition | |||
| Trauma history | 1.Emotional neglect 2.Psychological abuse 3.Physical abuse 4.Sexual abuse | NEMESIS-childhood trauma questionnaire | NEMESIS-trauma questionnaire: 4 subscales, one score (0–2) for each domain described in column 2 | Hovens et al., 2010 |
| Psychiatric classification | Current mood disorder (yes/no) | SCID-I | The Structured Clinical interview for DSM-IV Axis I Disorders (SCID-I): current depression and/or dysthymia (yes/no) | First et al., 1996 |
| Current anxiety disorder (yes/no) | SCID-I | Current DSM-IV anxiety disorder according to SCID-I: panic disorder, agoraphobia, social phobia, specific phobia, obsessive compulsive disorder, posttraumatic stress disorder, generalized anxiety disorder and/or anxiety disorder not otherwise specified (yes/no) | ||
| ASD (yes/no) | NIDA | Dutch Interview for ASD in Adults (NIDA): autism spectrum disorder (ASD) (yes/no) | Vuijk, 2014 | |
| ADHD (yes/no) | DIVA 2.0 | Diagnostic Interview for ADHD in Adults version 2.0: ADHD (yes/no) | Kooij and Francken, 2010, Ramos-Quiroga et al., 2019 | |
| Addiction disorder (yes/no) | MATE-Crimi | Measurements in the Addictions for Triage and Evaluation and Criminality (MATE-Crimi): addiction disorder (yes/no) | Schippers et al., 2010; Schippers and Broekman, 2012 | |
| Psychiatrically healthy (yes/no) | See diagnostic instruments stated above | Psychiatrically healthy control subject or psychiatric patient (with one or more disorders described above) | See also van Eijndhoven et al., 2021 for extensive description of the diagnostic, classification process | |
| Substance use | Level of smoking | MATE-Crimi | Not smoking, light smoker, heavy smoker | van Eijndhoven et al., 2021 |
| Cannabis use (yes/no) | In-house questionnaire | Used cannabis last 7 d before scanning (yes/no) | N/A | |
| Alcohol consumption | In-house questionnaire | Number of standard units of alcohol used in the 7 d before scanning | N/A | |
| Medication | Antipsychotic (yes/no) | Medication verification: anamnesis and medication list from pharmacy Medication grouping based on ATC code | Antipsychotics (N05A) (only lithium (N05AN) is excluded from this category) (yes/no) | https://www.whocc.no/atc/structure_and_principles/ (last checked date June 7, 2021) |
| Anxiolytic, hyponotic and/or sedative (yes/no) | Anxiolytics (N05B), hypnotics and sedatives (N05C) and/or promethazine (R06AD02) (yes/no) | |||
| Antidepressant (yes/no) | Antidepressants (N06A) (yes/no) | |||
| Central-acting sympathicomimetic (yes/no) | Central-acting sympathicomimetics (N06BA) (yes/no) | |||
| Functional limitations | 1.Cognition 2.Mobiity 3.Self-care 4.Getting along 5.Life activities 6.Participation | WHODAS | WHO-Disability Assessment Schedule 2.0 (WHODAS 2.0): 6 existing subscales of this questionnaire, covering different domains of functioning (see column 2). | Chwastiak and Von Korff, 2003 |
| General health | 1.Physical functioning 2.Role fulfillment 3.Social functioning 4.Mental health 5.Experienced health 6.Physical pain | SF-20 | Short Form-20 (SF-20): 6 existing subscales of this questionnaire, covering different domains of health (see column 2) | Stewart et al., 1989 |
-
ADHD: attention-deficit hyperactivity disorder; BMI: body mass index; N/A: not applicable.
-
*
See also van Eijndhoven et al., 2021 for extensive description of the measures in this table and for the diagnostic, classification process.
Appendix 1—table 3
Use of psychotropic medication at the time of the MRI scan.
| Healthy controls(n = 70) | Combined patient group*(n = 225) | Stress-related group (n = 84) | Neurodevelopmental group (n = 55) | Comorbidity group (n = 86) | |
|---|---|---|---|---|---|
| Current medication use† | |||||
| Antidepressant (n = ..) | 0 | 84 | 41 | 9 | 34 |
| Antipsychotic (n = ..) | 0 | 28 | 16 | 2 | 10 |
| Central-acting sympathicomimetic‡ (n = ..) | 0 | 21 | 2 | 6 | 13 |
| Anxiolytic, hyponotic and/or sedative (yes/no) (daily use) (n = ..) | 0 | 27 | 12 | 2 | 13 |
| Mood stabilizer (n = ..) | 0 | 3 | 3 | 0 | 0 |
-
*
The combined patient group consists of all patients that were included in this study, and can be subdivided in the stress-related, neurodevelopmental and comorbidity group.
-
†
Number of participants using the type of medication stated below. Grouping of medication is based on ATC code (see Appendix 1—table 2 for an extensive description of the medication groups). The mood stabilizer group is added to this table, but was not used in the correlational analysis, given the low number of patients using this type of medication (i.e. valproic acid [n=1] and lithium [n=2]).
-
‡
The central-acting sympathomimetic drugs represent the use of psychostimulants.
Additional files
-
Supplementary file 1
Correlations between biobehavioral measures of interest.
- https://cdn.elifesciences.org/articles/85006/elife-85006-supp1-v2.xlsx
-
Supplementary file 2
Correlations between independent components from linked ICA decompositions and biobehavioral measures of interest.
- https://cdn.elifesciences.org/articles/85006/elife-85006-supp2-v2.xlsx
-
MDAR checklist
- https://cdn.elifesciences.org/articles/85006/elife-85006-mdarchecklist1-v2.docx
-
Appendix 1—figure 2—source data 1
Correlations for IC8, IC13, and IC30.
- https://cdn.elifesciences.org/articles/85006/elife-85006-app1-fig2-data1-v2.xlsx
Download links
A two-part list of links to download the article, or parts of the article, in various formats.
Downloads (link to download the article as PDF)
Open citations (links to open the citations from this article in various online reference manager services)
Cite this article (links to download the citations from this article in formats compatible with various reference manager tools)
Brain structure and function link to variation in biobehavioral dimensions across the psychopathological continuum
eLife 12:e85006.
https://doi.org/10.7554/eLife.85006


