Molecular basis of interactions between CaMKII and α-actinin-2 that underlie dendritic spine enlargement
- Department of Neuroscience, Physiology and Pharmacology, University College London, United Kingdom
Figures
Figure 1 with 2 supplements
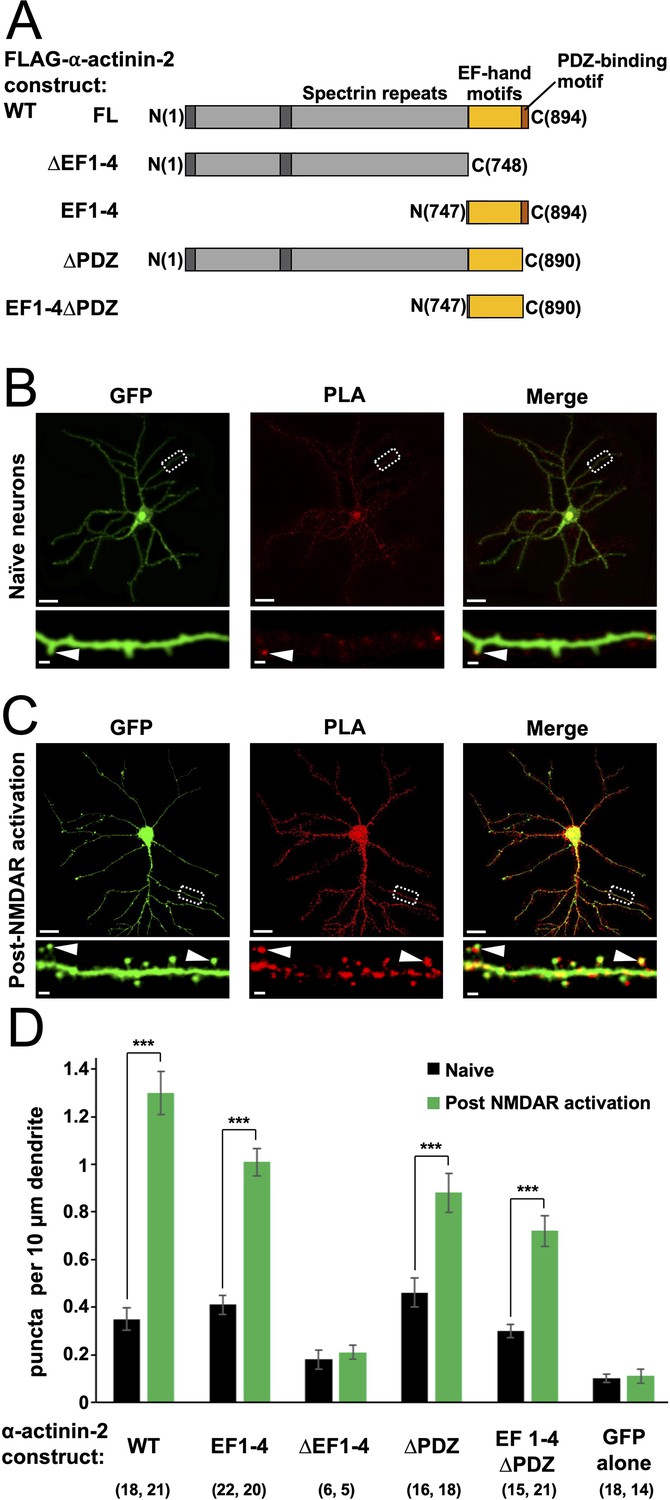
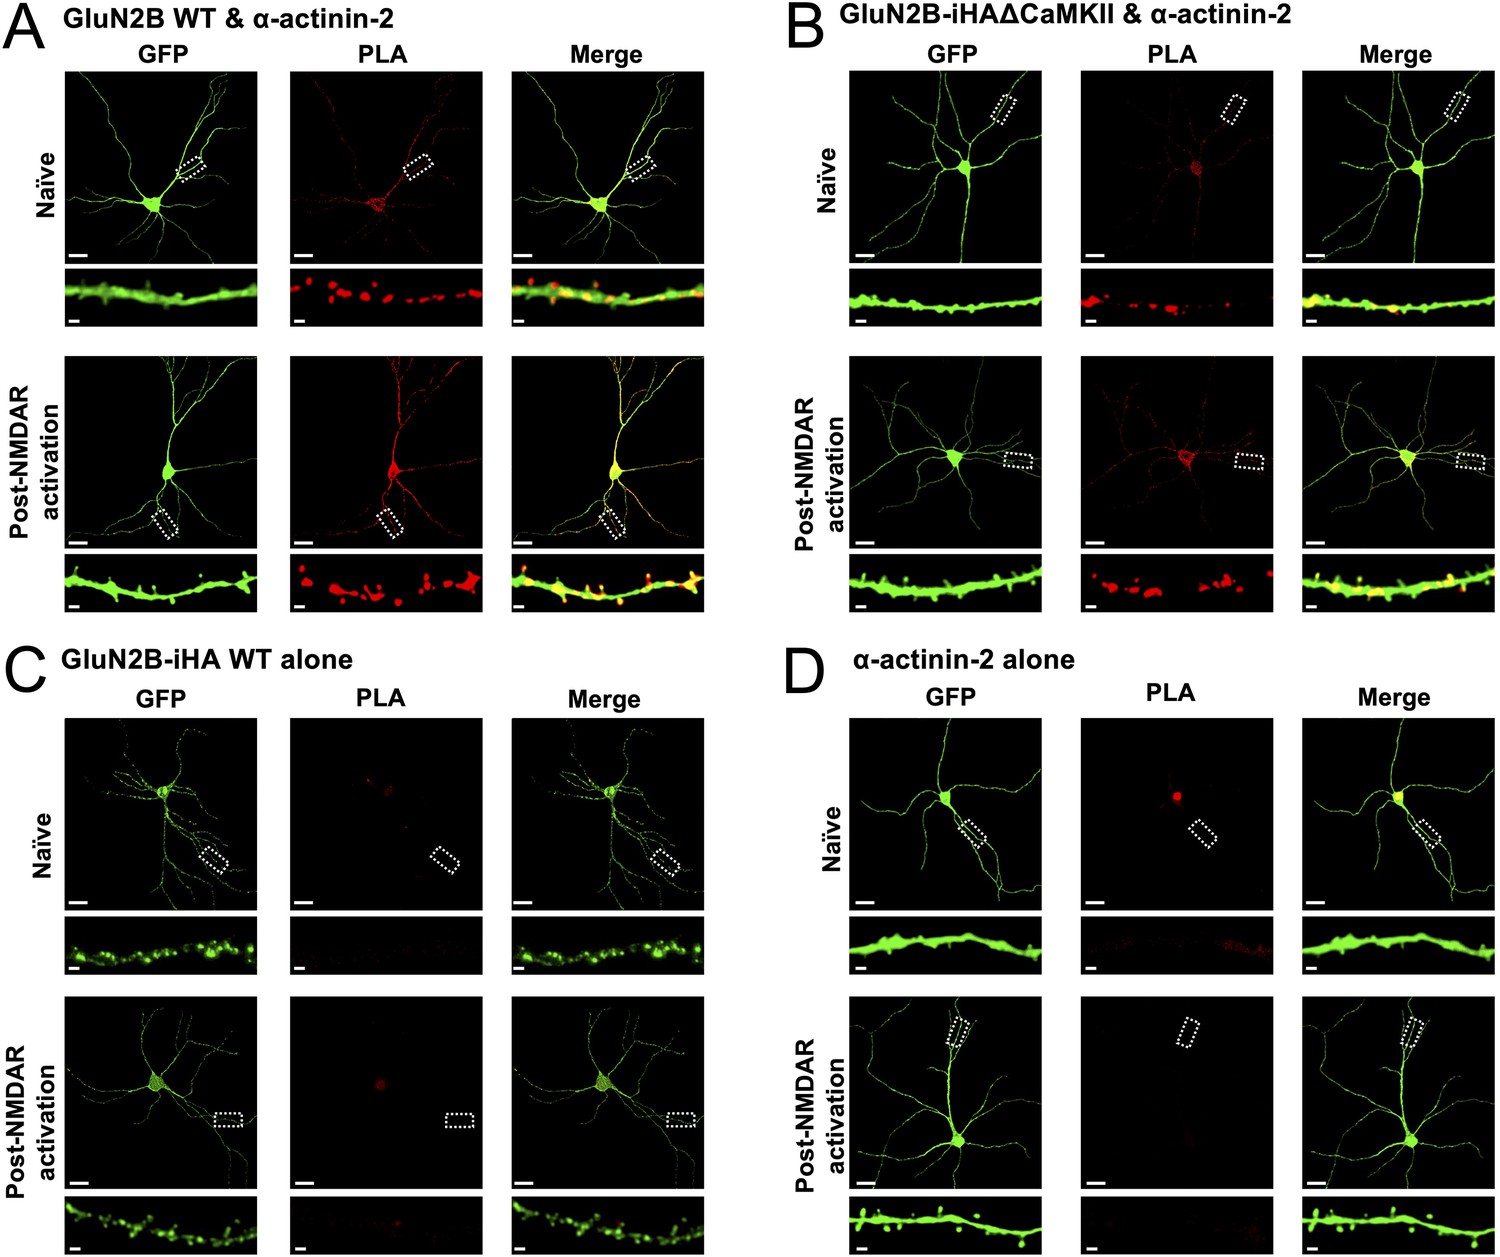
Changes in association of α-actinin-2 and calmodulin-dependent protein kinase II (CaMKII) following NMDA receptor (NMDAR) activation.
(A) Topologies of α-actinin-2 constructs expressed in neurons. (B) and (C) show anti-GFP immunofluorescence (left column) and anti-CaMKII⍺/anti-FLAG proximity ligation assay (PLA) puncta (middle column) in primary hippocampal neurons expressing FLAG-α-actinin-2 wild-type (WT) with GFP either before (B) or after (C) NMDAR activation. Scale bars are 20 μm (whole neuron images) and 1 μm (dendrite close-ups). (D) Quantitation of PLA puncta per 10 μm dendrite before (black) and after (green) NMDAR activation for the full range of α-actinin-2 constructs. Data are presented as the mean ± standard error (SE) and were collected from three independent cultures with the exception of ∆EF1–4 (one culture). The number of neurons analysed for each construct is shown in parentheses. Statistical comparisons were performed using unpaired two-tailed Student’s t-tests (***p < 0.001).
-
Figure 1—source data 1
Full proximity ligation assay (PLA) dataset.
- https://cdn.elifesciences.org/articles/85008/elife-85008-fig1-data1-v3.xlsx
Figure 1—figure supplement 1

Proximity ligation assay (PLA) imaging of calmodulin-dependent protein kinase IIα (CaMKIIα) association with fragments of α-actinin-2.
Each panel shows anti-GFP immunofluorescence (left columns) and anti-CaMKIIα/anti-FLAG PLA puncta (middle columns) in primary hippocampal neurons either before (upper row) or after (lower row) NMDA receptor (NMDAR) activation. The images correspond to transfections with GFP alone (A), or GFP in combination with either α-actinin-2 EF1–4 (B), ∆EF1–4 (C), ∆PDZ (D), or EF1–4 ∆PDZ (E). Scale bars correspond to 20 μm (whole neuron images) and 1 μm (dendrite close-ups).
Figure 1—figure supplement 2

Frequency of FLAG-α-actinin-2/calmodulin-dependent protein kinase II (CaMKII) puncta by spine type.
The plot shows the proportion of stubby, thin and mushroom-type spines containing proximity ligation assay (PLA) puncta after fixing primary hippocampal neurons either before (black) or 4 hr after NMDA receptor (NMDAR) activation (green). The proportion of PLA-positive spines was greater in mushroom-type spines compared to either stubby type (p=4 × 10⁻⁶ naive, p=3 × 10⁻¹⁰ post-NMDAR activation using two-tailed paired t-tests) or thin type (p=2 × 10⁻⁵ pre, p=1 × 10⁻¹⁰ post).
-
Figure 1—figure supplement 2—source data 1
Full dataset for anti-FLAG/anti-calmodulin-dependent protein kinase IIα (anti-CaMKIIα) proximity ligation assay (PLA) puncta frequency by spine type in neurons expressing FLAG-α-actinin-2.
- https://cdn.elifesciences.org/articles/85008/elife-85008-fig1-figsupp2-data1-v3.xlsx
Figure 2 with 2 supplements
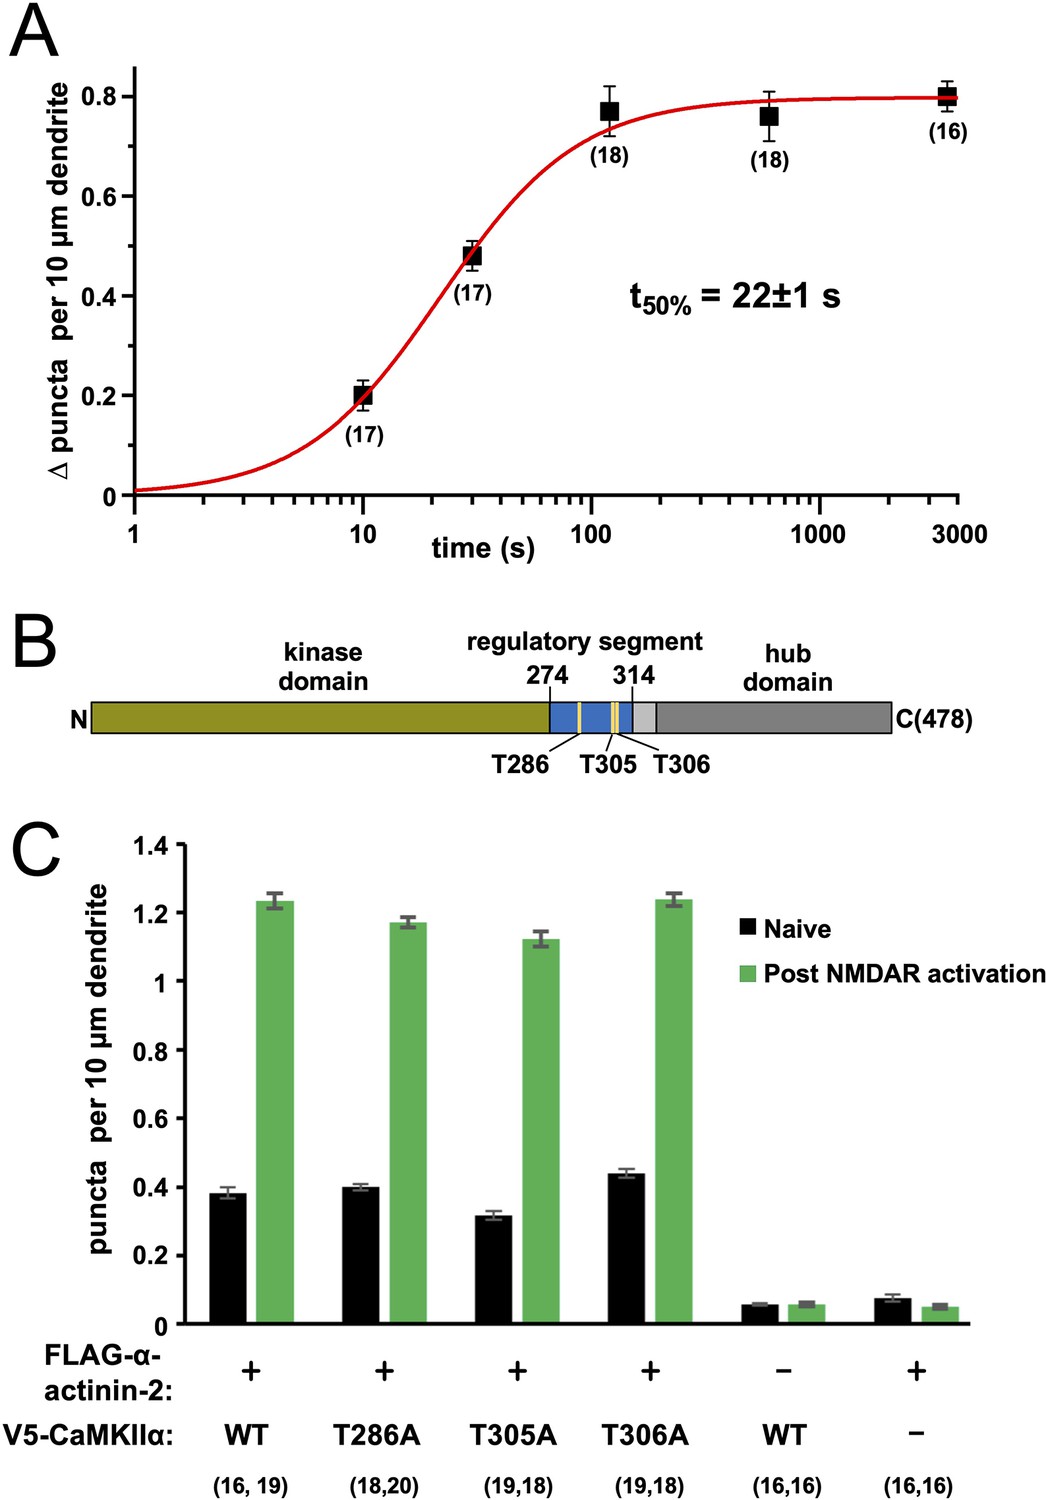
Time dependence and effect of phosphorylation site mutations on calmodulin-dependent protein kinase IIα (CaMKIIα)-α-actinin-2 association.
(A) Plot showing change in anti-FLAG-α-actinin-2/CaMKIIα proximity ligation assay (PLA) puncta density in neurons fixed a different times following NMDA receptor (NMDAR) activation. The data were fit to a Hill function with max = 0.80±0.01, n=1.4±0.1, and t50%=22±1 s. (B) Topology of CaMKIIα showing positions of three regulatory threonines in the context of the kinase domain (green), regulatory segment (blue), linker (light grey), and hub domain (dark grey). (C) Quantitation of PLA puncta per 10 μm dendrite before (black) and after (green) NMDAR activation in neurons expressing different combinations of FLAG-α-actinin-2 and V5-CaMKIIα variants. For panels (A) and (C), data are presented as the mean ± SE, and the number of neurons analysed for each condition is shown in parentheses. Neurons were imaged deriving from three independent cultures for each condition.
-
Figure 2—source data 1
Full proximity ligation assay (PLA) datasets for time course experiments, and experiments with calmodulin-dependent protein kinase IIα (CaMKIIα) phosphorylation site mutants.
- https://cdn.elifesciences.org/articles/85008/elife-85008-fig2-data1-v3.xlsx
Figure 2—figure supplement 1

Proximity ligation assay (PLA) imaging of calmodulin-dependent protein kinase IIα (CaMKIIα) association with α-actinin-2 PLA in neurons fixed at different time-points after NMDA receptor (NMDAR) activation.
Each panel shows anti-GFP immunofluorescence (left columns) and anti-CaMKIIα/anti-FLAG PLA puncta (middle columns) in primary hippocampal neurons transfected with GFP and FLAG-α-actinin-2. Neurons were fixed either before NMDAR activation (panel (A)) or at different time-points from the start of NMDAR activation (panels (B–F)), as indicated. Scale bars correspond to 20 μm (square panels) and 1 μm (dendrite close-ups).
Figure 2—figure supplement 2

Proximity ligation assay (PLA) imaging of α-actinin-2 association with wild-type and phospho-null variants of calmodulin-dependent protein kinase IIα (CaMKIIα).
Each panel shows anti-GFP immunofluorescence (left columns) and anti-V5/anti-FLAG PLA puncta (middle columns) in primary hippocampal neurons either before (top row) or after (bottom row) NMDA receptor (NMDAR) activation. All neurons expressed GFP. The first four panels correspond to imaging of neurons expressing FLAG-α-actinin-2 in combination with either wild-type (WT) (A), T286A (B), T305A (C), or T306A (D) variants of V5-CaMKIIα. The last two panels correspond to control imaging experiments performed in neurons transfected with one or the other of WT V5-CaMKIIα (E) or FLAG-α-actinin-2 (F). Scale bars correspond to 20 μm (square panels) and 1 μm (dendrite close-ups).
Figure 3 with 2 supplements
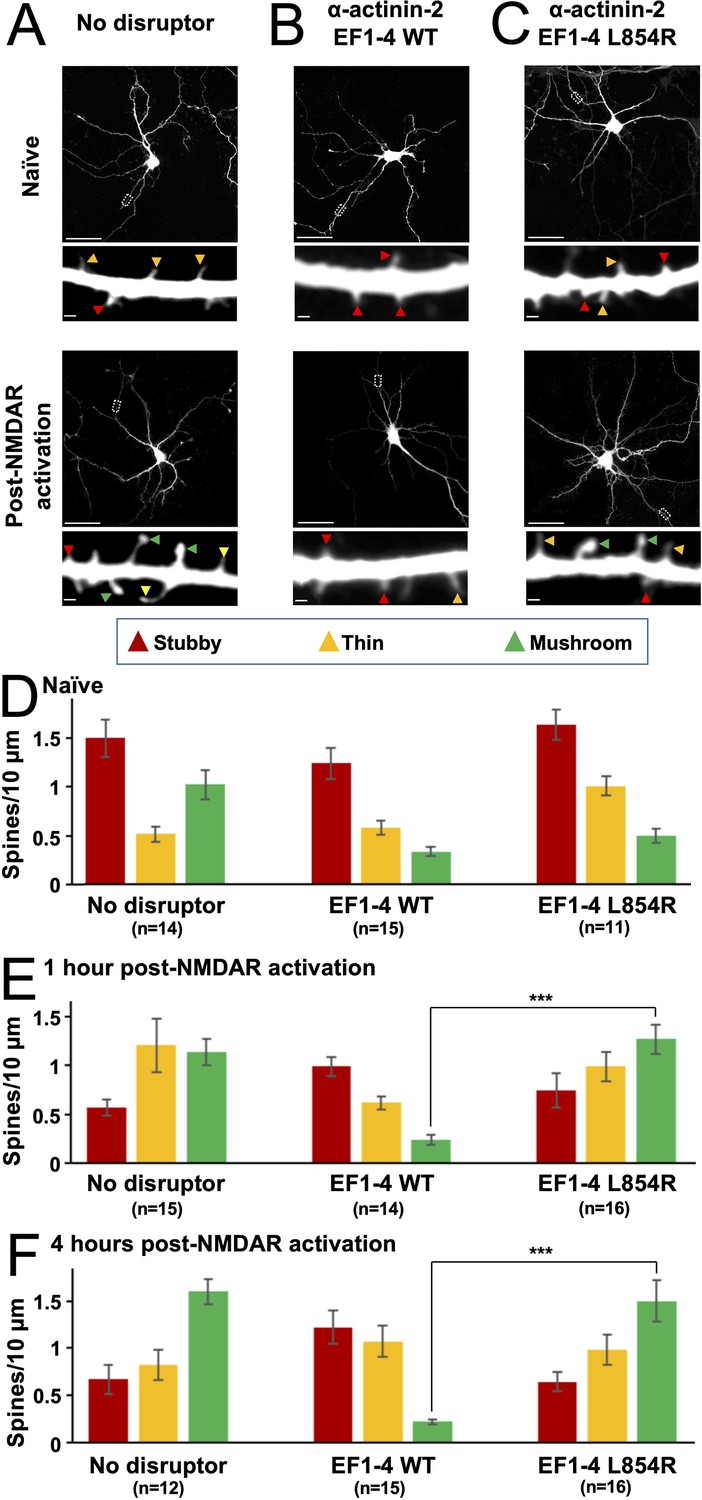
Effect of EF hand disruptors on changes in spine morphology following NMDA receptor (NMDAR) activation.
Panels (A–C) show GFP imaging of primary hippocampal neurons transfected with either GFP alone (A), or GFP in combination with α-actinin-2 EF1–4 wild-type (WT) (B) or L854R (C). For (A–C), the upper rows show imaging of naïve synapses, and the lower rows show imaging 4 hr after NMDAR activation. Stubby (red), thin (orange), and mushroom (green) type synapses are highlighted with arrows. Scale bars correspond to 20 μm (whole neuron images) and 1 μm (dendrite close-ups). Panels (D–F) show quantification of spine types across the three conditions either before NMDAR activation (D), 1 hr after NMDAR activation (E), or 4 hr after activation (F). Data are presented as mean ± SE spines per 10 μm dendritic length. The number of neurons analysed for each condition is shown in parentheses. Neurons were imaged deriving from three independent cultures for each condition. Red, orange, and green bars indicate stubby, thin, and mushroom spine numbers, respectively. In panels E and F, statistical comparisons were performed using unpaired two-tailed Student’s t-tests (***p < 0.001).
-
Figure 3—source data 1
Full spine classification dataset.
- https://cdn.elifesciences.org/articles/85008/elife-85008-fig3-data1-v3.xlsx
Figure 3—figure supplement 1
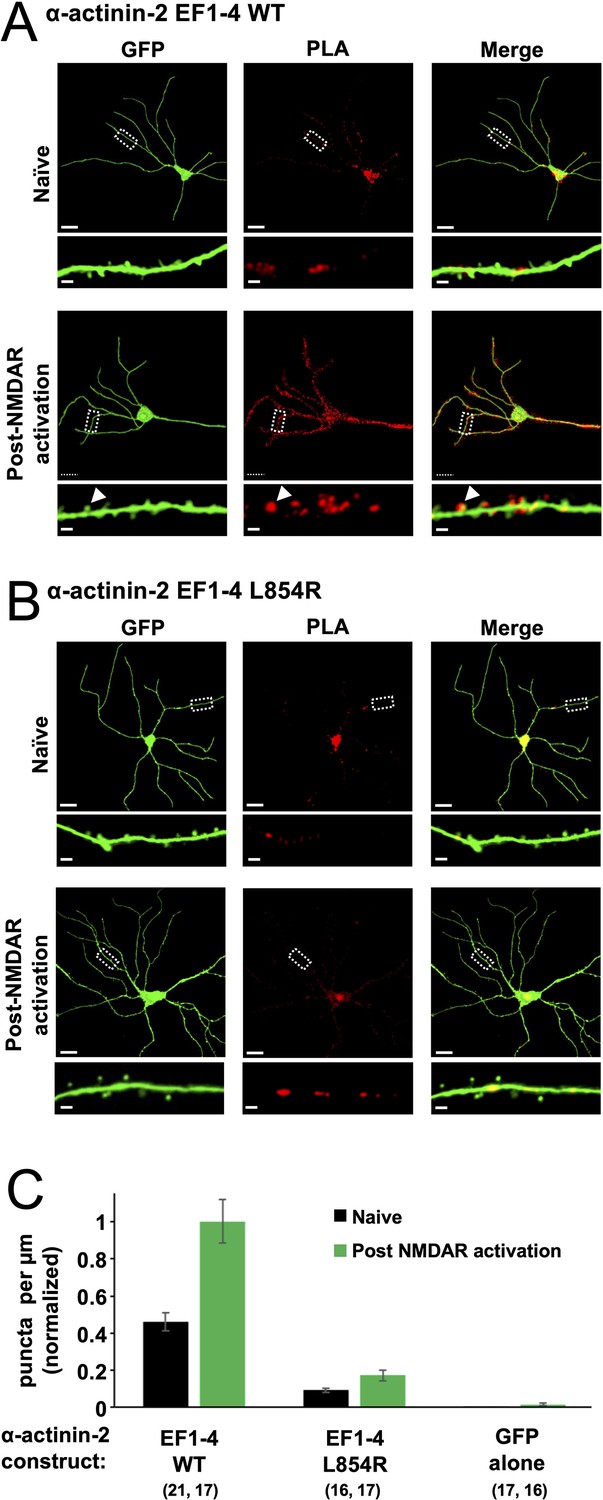
Proximity ligation assay (PLA) imaging of calmodulin-dependent protein kinase IIα (CaMKIIα) association with α-actinin-2 EF1–4 disruptors.
The first two panels show imaging following transfections with GFP in combination with either wild-type (WT) (A) or L854R (B) α-actinin-2 EF1–4. Each panel shows anti-GFP immunofluorescence (left columns) and anti-CaMKIIα/anti-FLAG PLA puncta (middle columns) in primary hippocampal neurons either before (upper row) or after (lower row) NMDA receptor (NMDAR) activation. Scale bars correspond to 20 μm (whole neuron images) and 1 μm (dendrite close-ups). (C) Quantitation of dendritic PLA puncta density before (black) and after (green) NMDAR activation. Data are normalised to EF1–4 WT post NMDAR activation. The number of neurons analysed for each construct is shown in parentheses. PLA puncta density was reduced by 80% pre-activation (p=2.4 × 10⁻⁷) and 83% post NMDAR activation (p=2.0 × 10⁻⁷) in neurons expressing EF1–4 L854R compared to the WT variant.
-
Figure 3—figure supplement 1—source data 1
Full proximity ligation assay (PLA) dataset for comparison of wild-type (WT) and L854R disruptor variants.
- https://cdn.elifesciences.org/articles/85008/elife-85008-fig3-figsupp1-data1-v3.xlsx
Figure 3—figure supplement 2
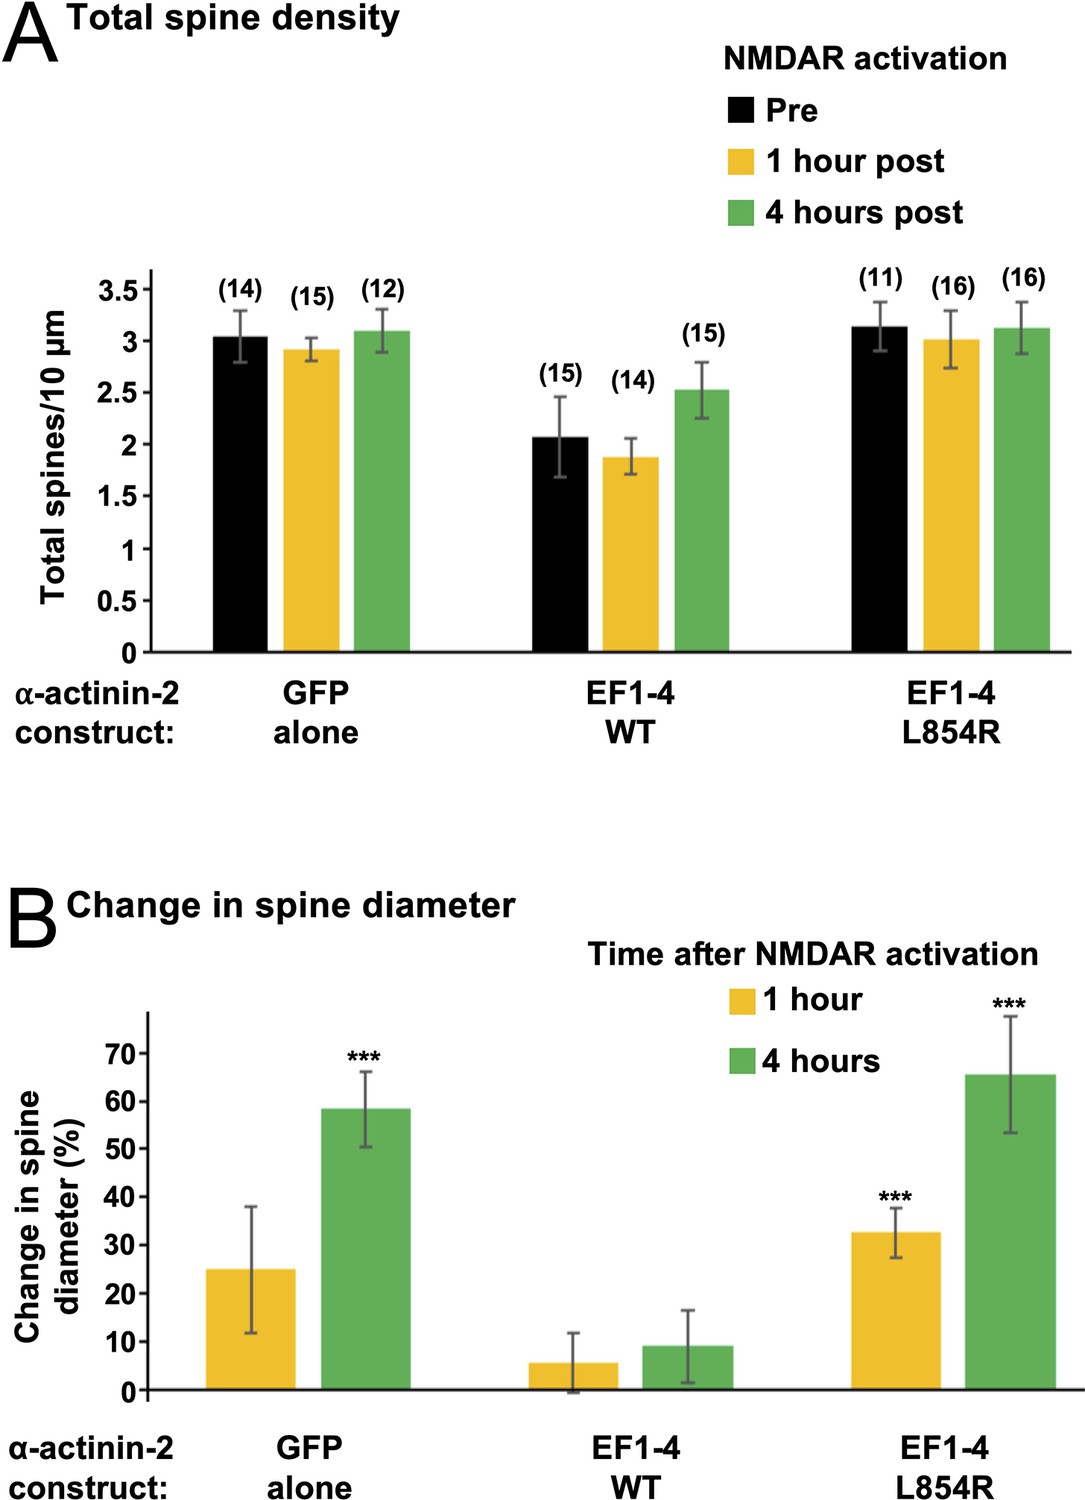
Effect of EF hand disruptors on total spine density and average spine diameter.
(A) Total spine density in primary hippocampal neurons transfected with either GFP alone or GFP in combination with either wild-type (WT) or L854R α-actinin-2 EF1–4. Mean spine number ± SE per 10 µm dendrite is shown before NMDA receptor (NMDAR) activation (black), and 1 hr (orange) and 4 hr (green) after activation. Numbers of neurons analysed for each condition are shown in parentheses. Before NMDAR activation, neurons expressing EF1–4 WT had 32% fewer spines than those expressing GFP alone (p=0.0013); and 34% fewer total spines than those expressing the L854R variant (p=5.33 × 10⁻⁵). (B) Changes in spine diameter (mean ± SE) are shown either 1 (orange) or 4 (green) hr after NMDAR activation.
-
Figure 3—figure supplement 2—source data 1
Full dataset for total spine number and changes in spine diameter for disruptor experiments.
- https://cdn.elifesciences.org/articles/85008/elife-85008-fig3-figsupp2-data1-v3.xlsx
Figure 4 with 1 supplement
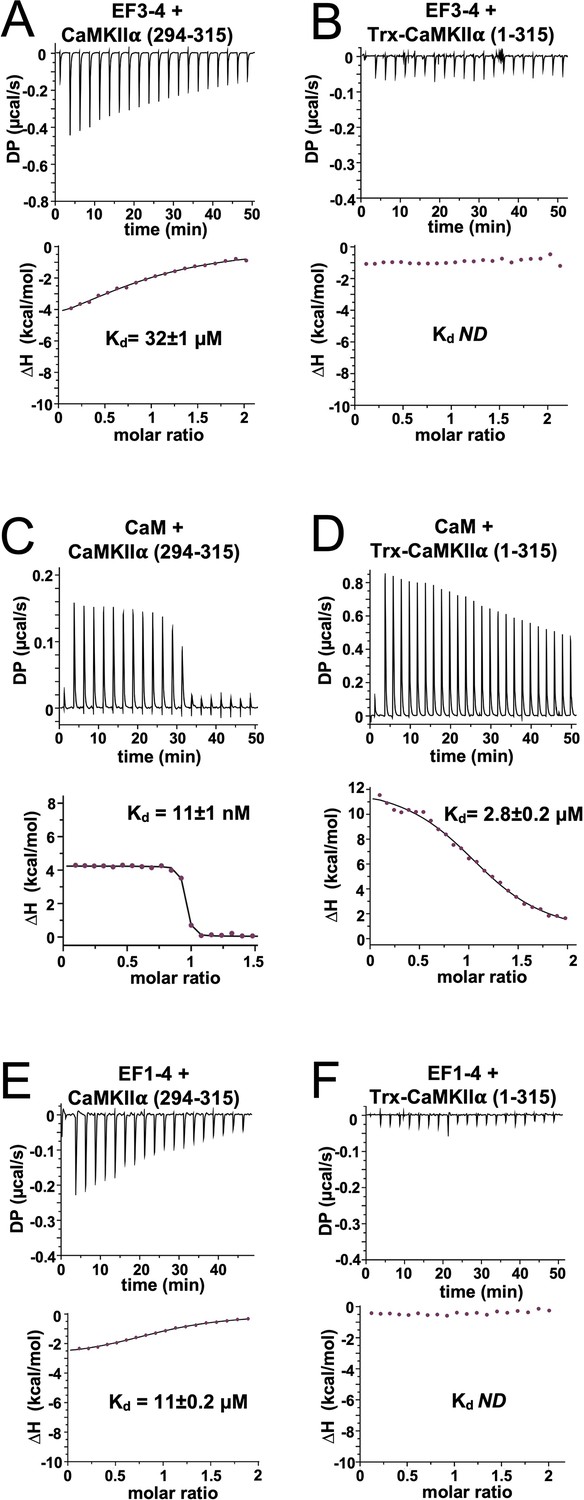
Isothermal titration calorimetry of interactions with the calmodulin-dependent protein kinase IIα (CaMKIIα) regulatory segment.
Representative isotherms showing binding of α-actinin-2 EF3–4 to (A) peptide corresponding to CaMKII⍺ regulatory segment (294–315) and (B) a construct (1–315) corresponding to the kinase and regulatory segment regions of CaMKIIα. Binding of CaM and α-actinin-2 EF1–4 to the same two CaMKII regions are shown in panels (C) and (D) and (E) and (F), respectively. In all cases, the top sub-panels show the raw power output (µcal/s) per unit time; the bottom sub-panels show the integrated data including a line of best fit to a single site binding model. Stated Kd values are averages from experimental replicates. ND = not determined.
-
Figure 4—source data 1
Full isothermal titration calorimetry (ITC) dataset.
- https://cdn.elifesciences.org/articles/85008/elife-85008-fig4-data1-v3.xlsx
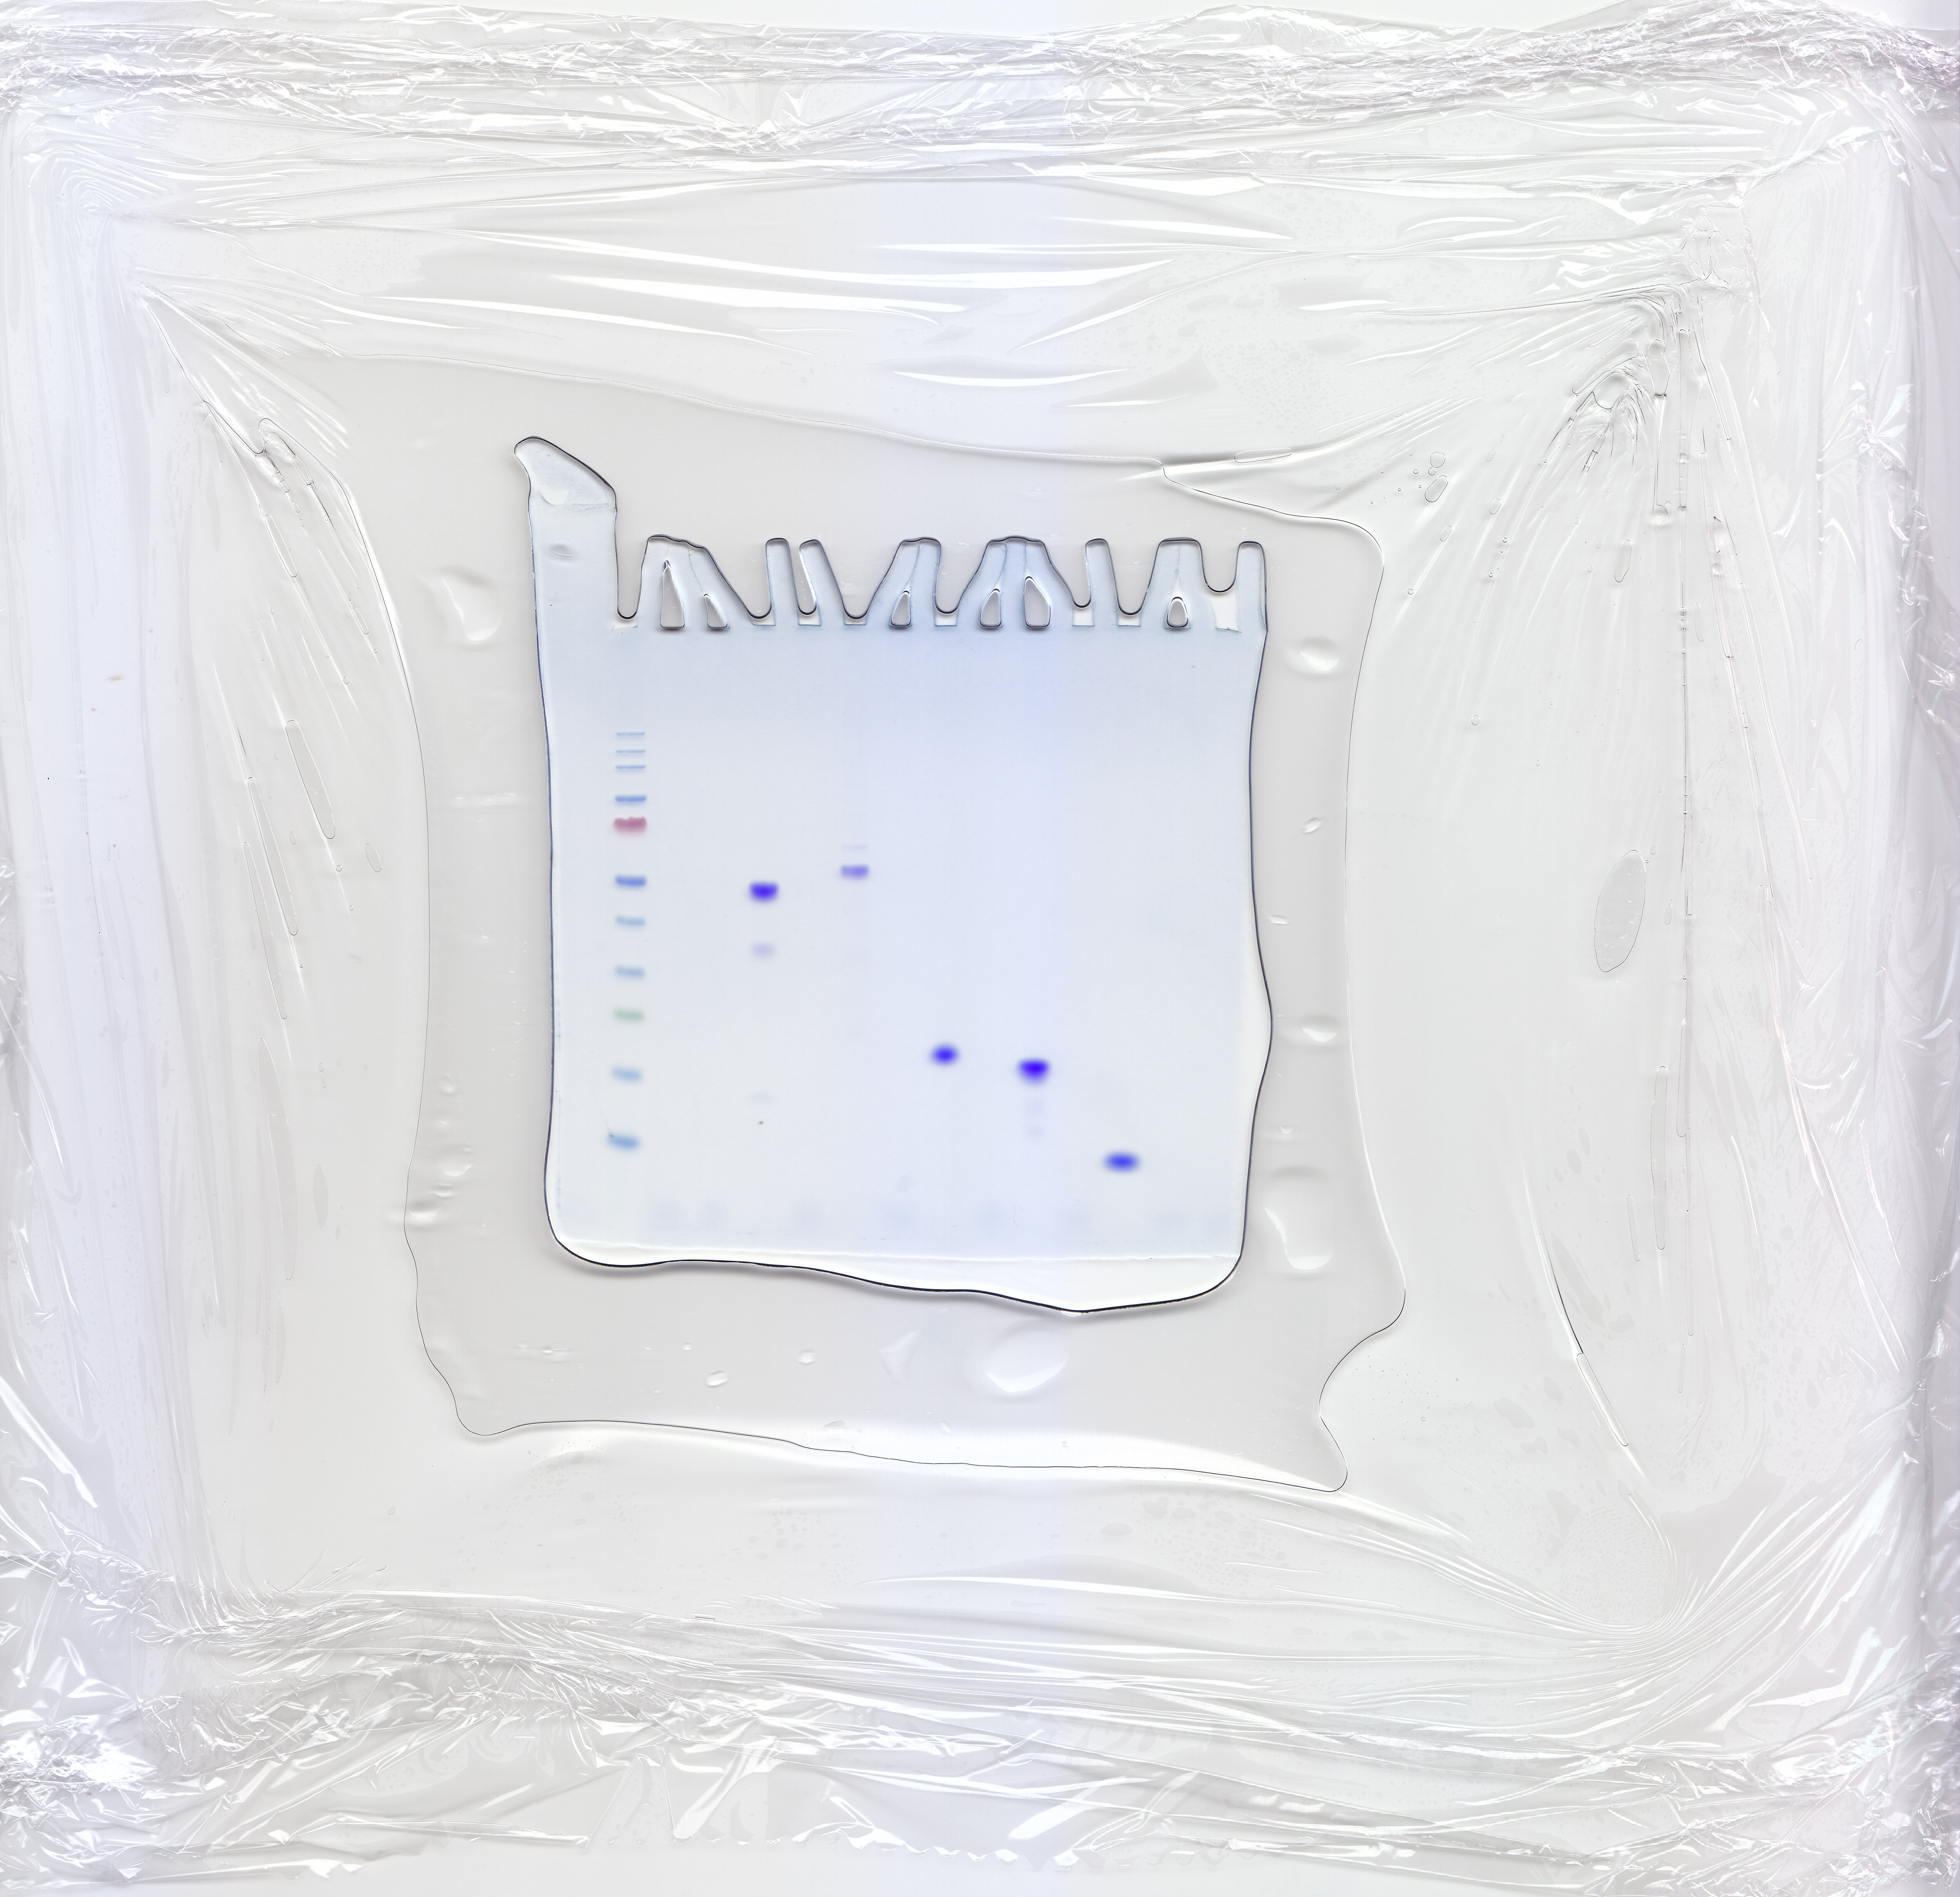
Figure 4—figure supplement 1
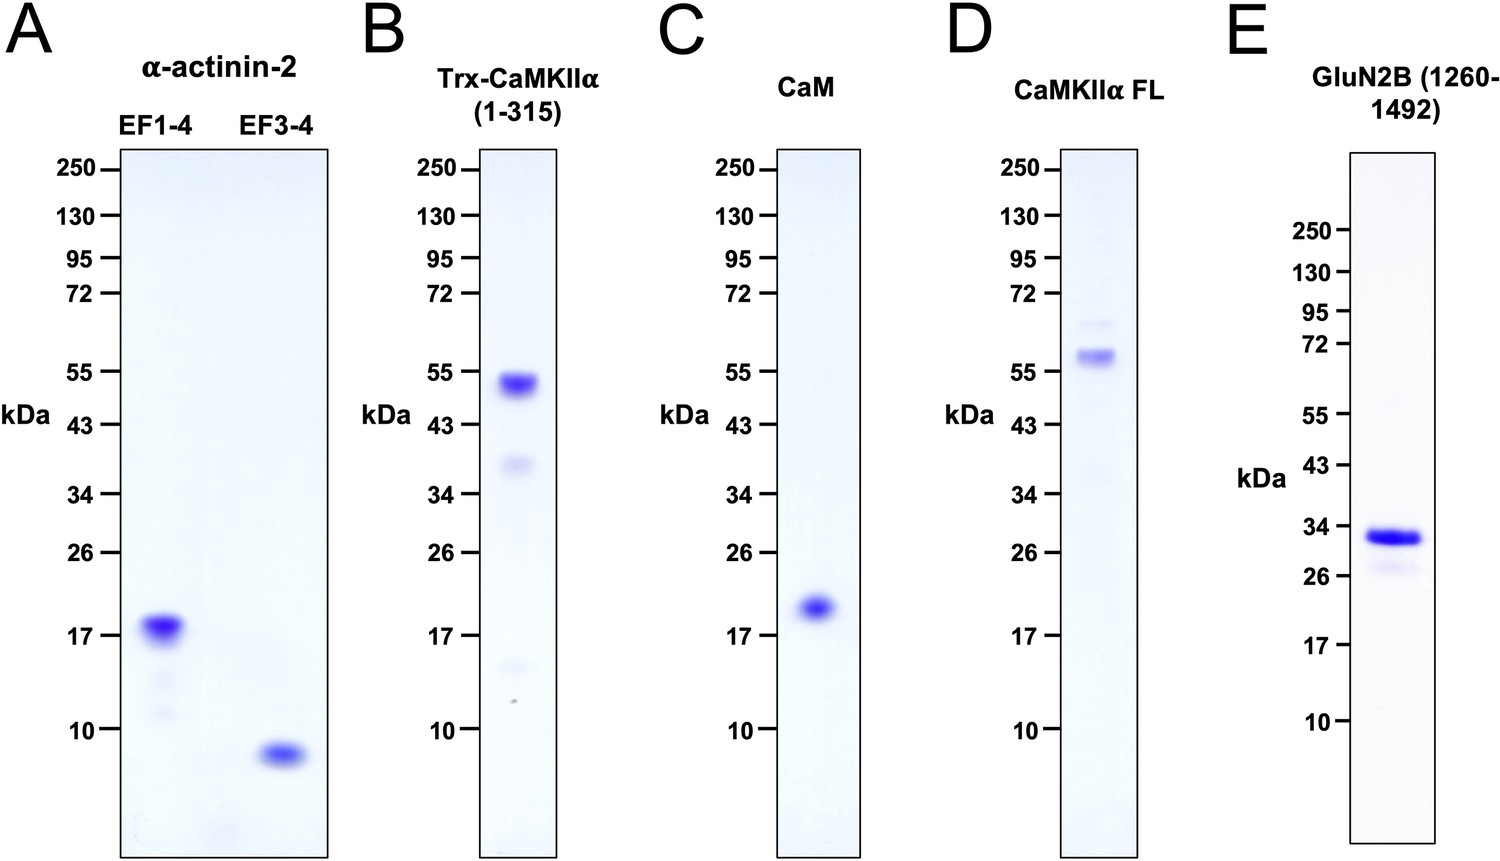
Purified proteins.
Coomassie-stained 4–12% polyacrylamide gels are shown for purified EF1–4/EF3–4 fragments of α-actinin-2 (A), Trx-CaMKIIα 1–315 (B), CaM (C), full-length CaMKIIα (D), and GluN2B 1260–1492 (E).
-
Figure 4—figure supplement 1—source data 1
Uncropped Coomassie-stained gels.
- https://cdn.elifesciences.org/articles/85008/elife-85008-fig4-figsupp1-data1-v3.pdf
-
Figure 4—figure supplement 1—source data 2
Raw image for panels (A–D).
- https://cdn.elifesciences.org/articles/85008/elife-85008-fig4-figsupp1-data2-v3.jpg
-
Figure 4—figure supplement 1—source data 3
Raw image for panel (E).
- https://cdn.elifesciences.org/articles/85008/elife-85008-fig4-figsupp1-data3-v3.tif
Figure 5 with 2 supplements
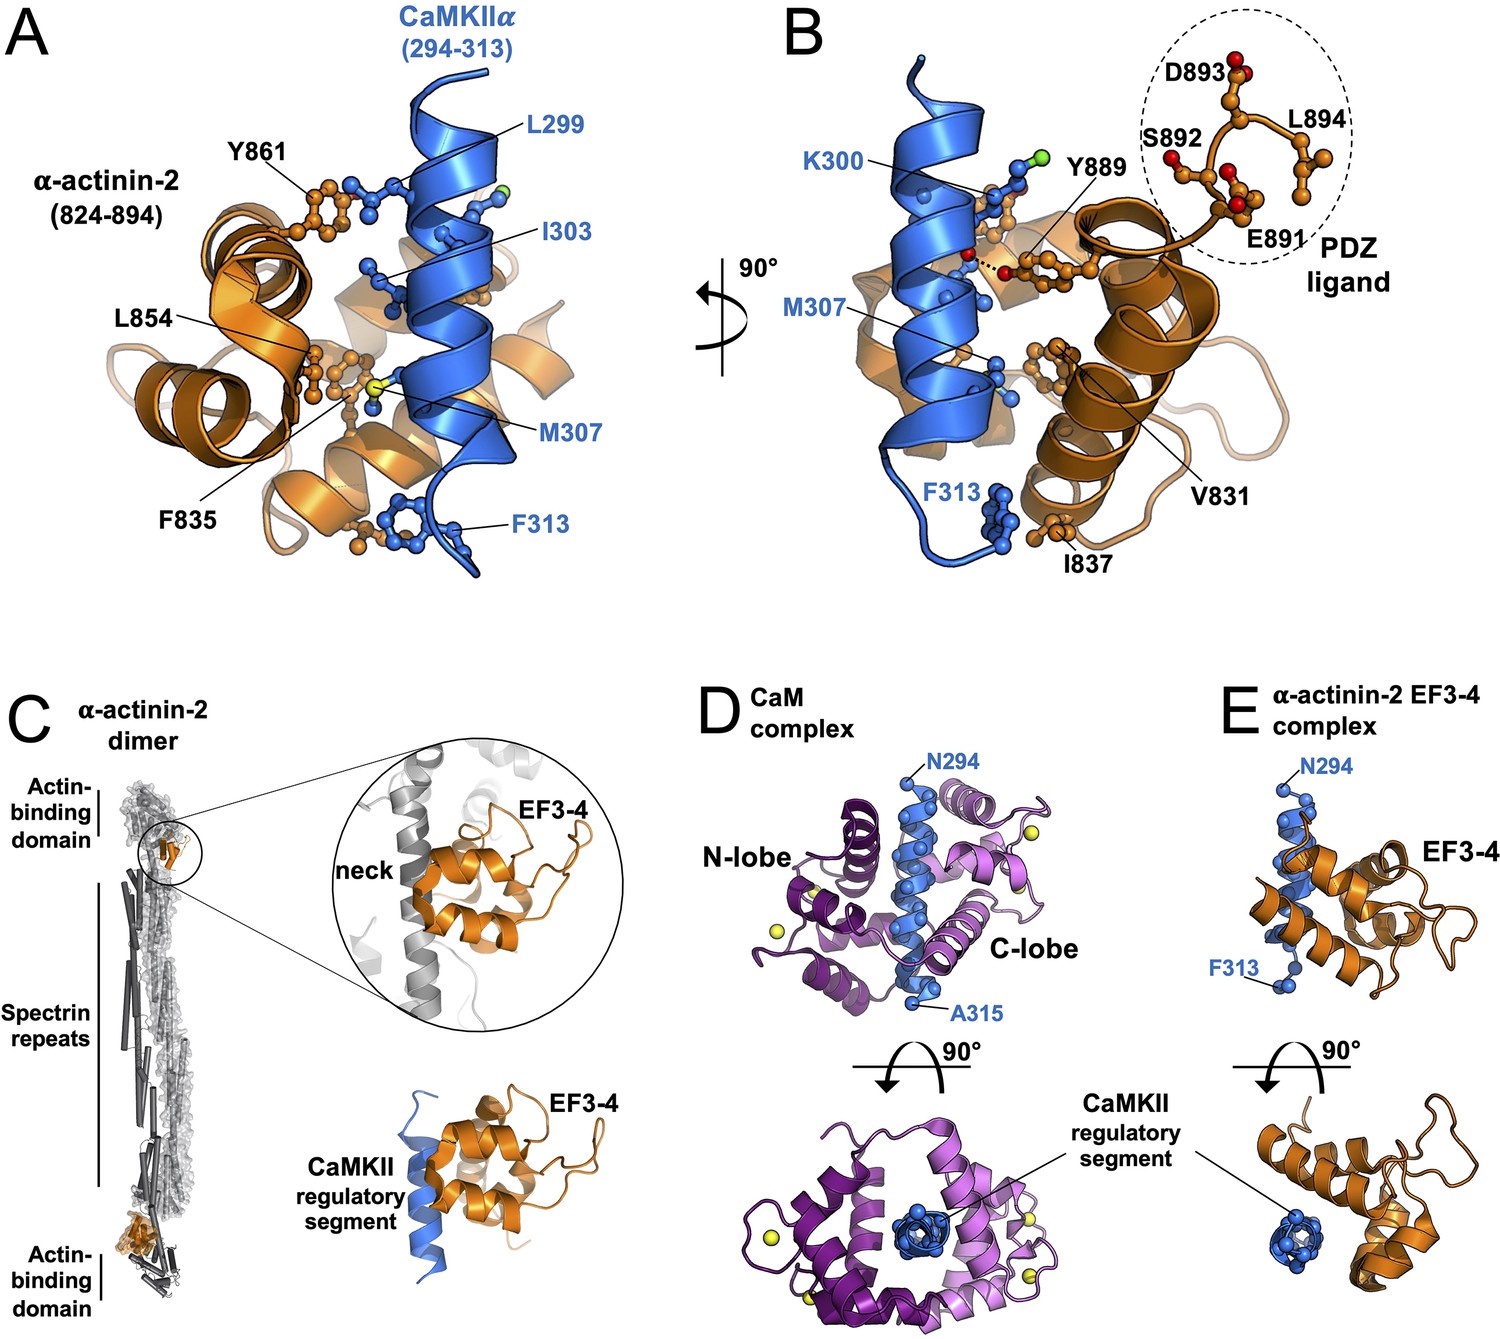
Structure of the core α-actinin-2-calmodulin-dependent protein kinase IIα (CaMKIIα) interface.
Panels (A) and (B) show two views of the complex between α-actinin-2 EF3–4 (orange) and a peptide corresponding to the CaMKIIα regulatory segment (blue). The C-terminal tetrapeptide that is a ligand for PDZ domain-containing proteins including densin-180 is highlighted. (C) Comparison of α-actinin-2-EF3–4 domain association with the neck region (grey) in α-actinin-2 dimers (1H8B) and the CaMKII regulatory segment (6TS3). The structures were aligned through the EF3–4 domain. Panels (D) and (E) show two views comparing CaM (D) and α-actinin-2 EF3–4 (E) association with the CaMKIIα regulatory segment. The structures were aligned through the regulatory segment. For the CaM complex (2WEL), the N-lobe is coloured dark purple; the C-lobe is violet.
Figure 5—figure supplement 1
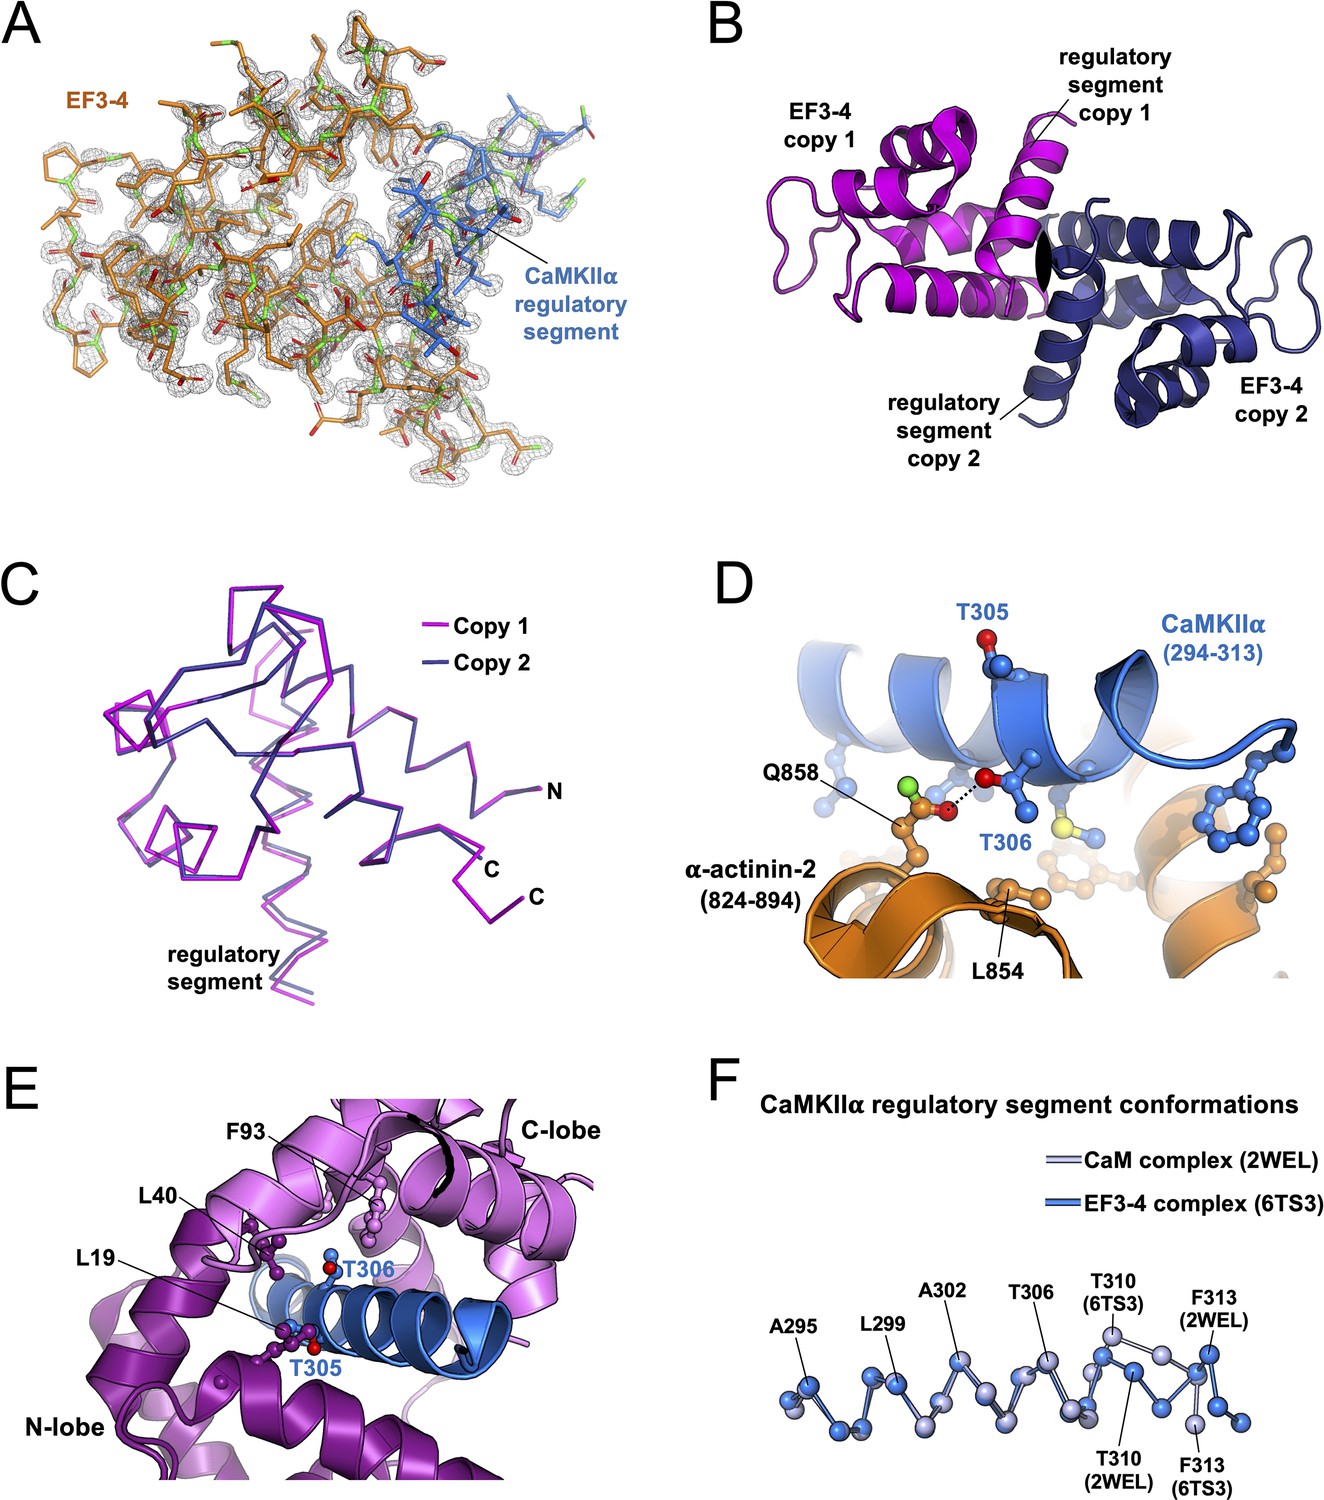
Additional features of the ⍺-actinin-2 EF3–4-calmodulin-dependent protein kinase IIα (CaMKIIα) regulatory segment crystal structure.
(A) 2Fo-Fc electron density map contoured at 1.5σ and clipped within 1.5 Å of the polypeptides (chains A and C). (B) Asymmetric unit showing two copies of the EF3–4-CaMKIIα regulatory segment complex related to each other by a twofold rotational symmetry axis. (C) Superimposition of the two copies of the complex. The first copy (chains A and C) is shown in magenta; the second copy (chains B and D) in dark blue. The two copies align with RMSD = 0.202 Å for all atoms encompassing α-actinin-2 822–891 and CaMKIIα 294–310. Panels (D) and (E) show close-ups highlighting the positions of CaMKIIα threonines 305 and 306 in complex with either EF3–4 complex (D) or CaM (E). (F) Aligned Cα conformations of the CaMKIIα regulatory segment in complex with either EF3–4 (light blue) or CaM (dark blue).
Figure 5—figure supplement 2

Calorimetry with calmodulin-dependent protein kinase IIα (CaMKIIα) 299–315 peptide.
Representative isotherms are shown for titrations of the peptide with (A) α-actinin-2 EF3–4 and (B) CaM. The top sub-panels show the raw power output (µcal/s) per unit time; the bottom sub-panels show the integrated data including a line of best fit to a single site binding model. Stated Kd values are averages from three replicates.
Figure 6 with 3 supplements
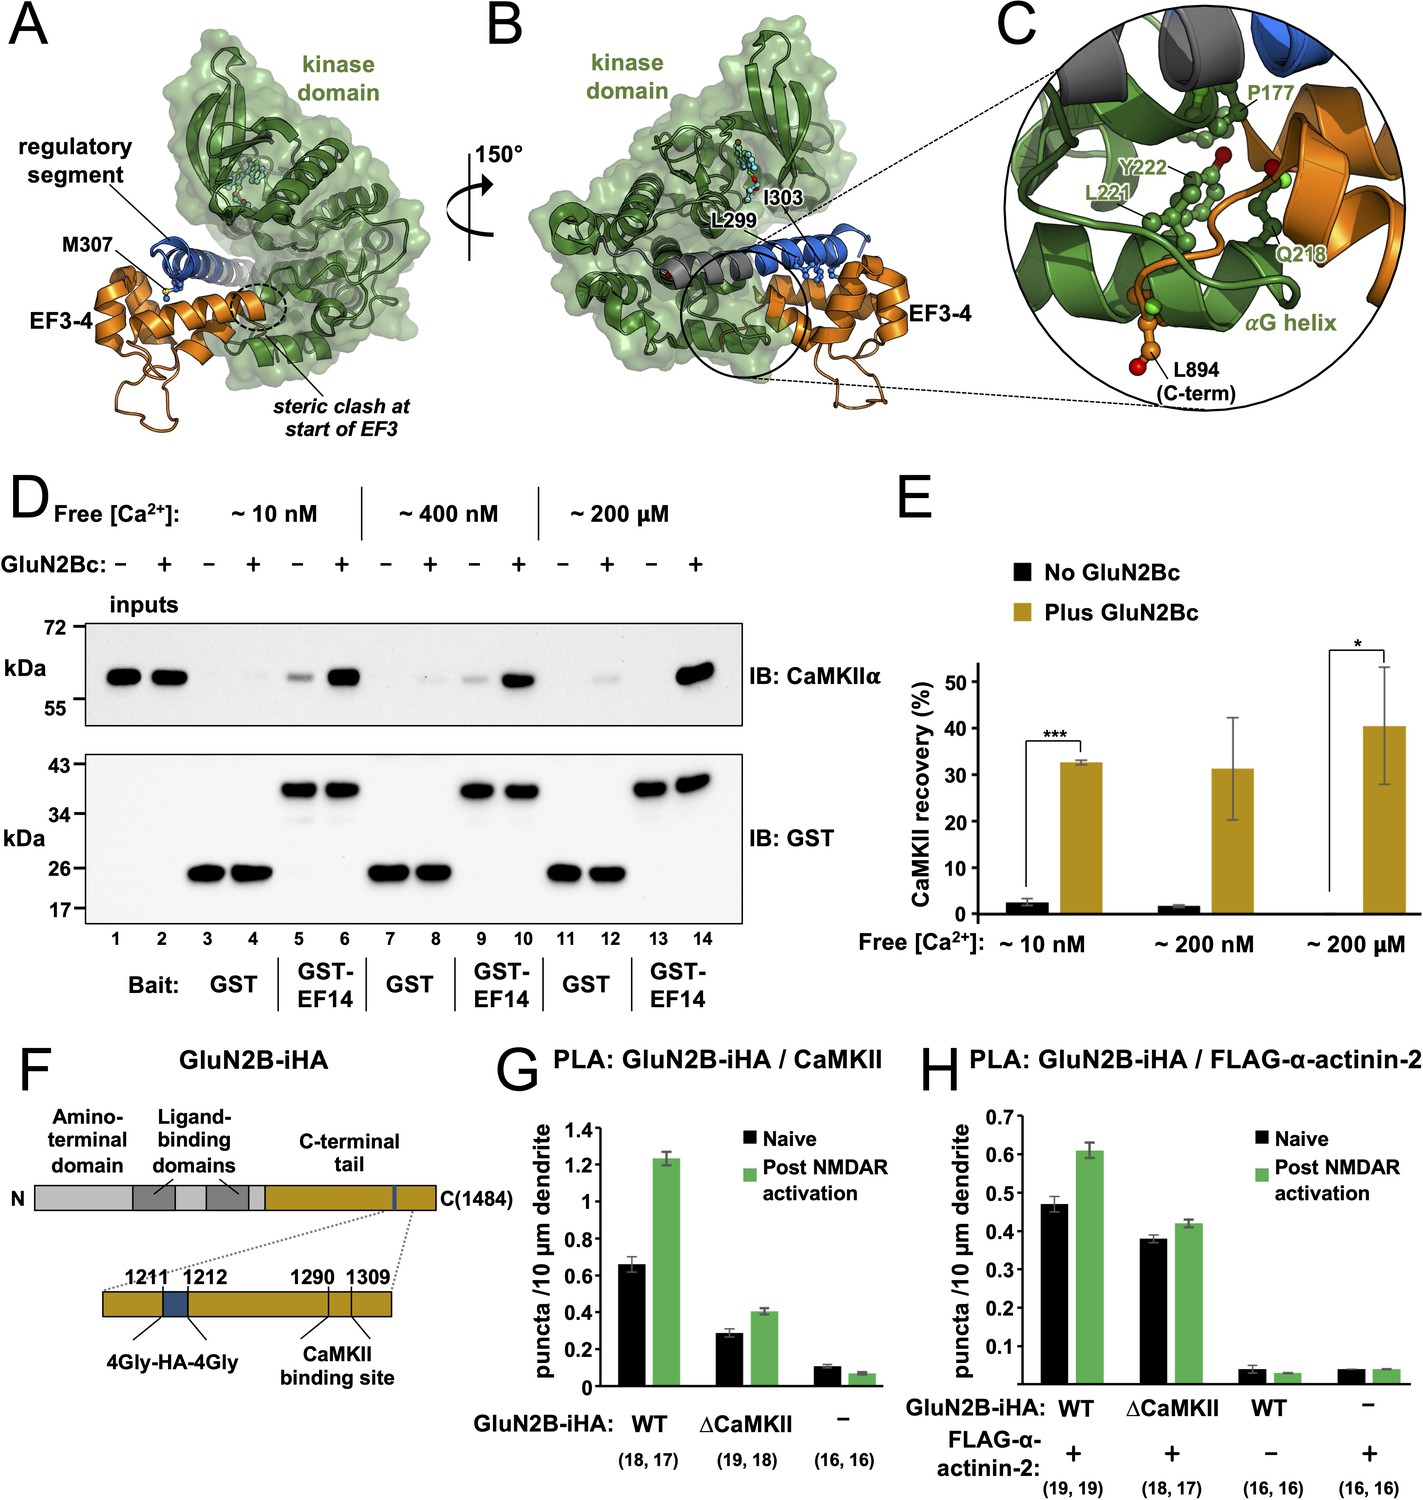
Effect of GluN2B on access to the regulatory segment.
Panels (A) and (B) show two views of the superimposition of the α-actinin-2-regulatory segment complex (6TS3) over the structure of calmodulin-dependent protein kinase IIα (CaMKIIα) 1–299 (2VZ6). The structures were aligned using positions 294–299 of the regulatory segment. Regions of steric incompatibility between the kinase (green) and EF3–4 domain (orange) are highlighted. Panel (C) shows a close-up highlighting steric clashing in the vicinity of the CaMKIIαG helix. (D) Pull-down of purified CaMKIIα with magnetic beads charged with either GST or GST-EF1–4. CaMKII pull-down was compared ± GluN2Bc fragment, and at different final free Ca2+ concentrations, as indicated. CaMKIIα and GST/GST-EF14 were detected by anti-CaMKIIα (upper) and anti-GST (lower) immunoblots (IBs). (E) Densitometry for pull-down experiments shown in the preceding panel showing CaMKII recovery at each free Ca2+ concentration either with (gold) or without (black) GluN2Bc (n=3 for all conditions). Statistical comparisons were performed using unpaired two-tailed Student’s t-tests (*p < 0.05, ***p < 0.001). (F) Domain topology of GluN2B showing the location of the internal HA tag and CaMKII binding site within the C-terminal tail (gold). (G) Quantitation of anti-HA/anti-CaMKII proximity ligation assay (PLA) puncta per 10 μm dendrite before (black) and after (green) NMDA receptor (NMDAR) activation in neurons expressing GluN2B-iHA variants as indicated. (H) Quantitation of anti-HA/anti-FLAG PLA puncta per 10 μm dendrite before (black) and after (green) NMDAR activation in neurons expressing combinations of GluN2B-iHA variants and FLAG-α-actinin-2 as indicated. For panels (G) and (H), data are presented as the mean ± SE, and the number of neurons analysed for each condition is shown in parentheses. Neurons were imaged deriving from three independent cultures for each condition.
-
Figure 6—source data 1
Densitometry breakdown for calmodulin-dependent protein kinase II (CaMKII) pull-down experiments and full proximity ligation assay (PLA) dataset for experiments investigating interactions with GluN2B.
- https://cdn.elifesciences.org/articles/85008/elife-85008-fig6-data1-v3.xlsx
-
Figure 6—source data 2
Uncropped immunoblots.
- https://cdn.elifesciences.org/articles/85008/elife-85008-fig6-data2-v3.zip
-
Figure 6—source data 3
Raw image for anti-calmodulin-dependent protein kinase II (anti-CaMKII) immunoblot.
- https://cdn.elifesciences.org/articles/85008/elife-85008-fig6-data3-v3.zip
-
Figure 6—source data 4
Raw image for anti-GST immunoblot.
- https://cdn.elifesciences.org/articles/85008/elife-85008-fig6-data4-v3.zip
Figure 6—figure supplement 1

Modelling relative orientations of kinase and EF3–4 domains relative to the regulatory segment.
(A) Alignment of all atoms for calmodulin-dependent protein kinase IIα (CaMKIIα) positions 294–299 in crystal structures 2VZ6 and 6TS3. Cα atoms are shown as spheres. Panels (B) and (C) show two views of the superimposition of the α-actinin-2-regulatory segment complex (6TS3) onto the structure of CaMKIIα (3SOA-β7 linker and hub domain are not shown). The structures were aligned through positions 294–305 of the regulatory segment.
Figure 6—figure supplement 2

Proximity ligation assay (PLA) imaging of calmodulin-dependent protein kinase IIα (CaMKIIα) association with variants of GluN2B.
Each panel shows anti-GFP immunofluorescence (left columns) and anti-CaMKIIα/anti-HA PLA puncta (middle columns) in primary hippocampal neurons either before (top row) or after (bottom row) NMDA receptor (NMDAR) activation. The images correspond to neurons transfected with wild-type (WT) GluN2B-iHA (A), GluN2B-iHA ∆CaMKII (B), or GFP only (C). Scale bars correspond to 20 μm (square panels) and 1 μm (dendrite close-ups).
Figure 6—figure supplement 3
Proximity ligation assay (PLA) imaging of α-actinin-2 association with GluN2B variants.
Each panel shows anti-GFP immunofluorescence (left columns) and anti-FLAG/anti-HA PLA puncta (middle columns) in primary hippocampal neurons either before (top row) or after (bottom row) NMDA receptor (NMDAR) activation. All neurons expressed GFP. The panels correspond to neurons additionally expressing GluN2B-iHA wild-type (WT) and FLAG-α-actinin-2 (A), GluN2B-iHA ∆CaMKII and FLAG-α-actinin-2 (B), GluN2B-iHA WT only (C), and FLAG-α-actinin-2 only (D). Scale bars correspond to 20 μm (square panels) and 1 μm (dendrite close-ups).
Figure 7
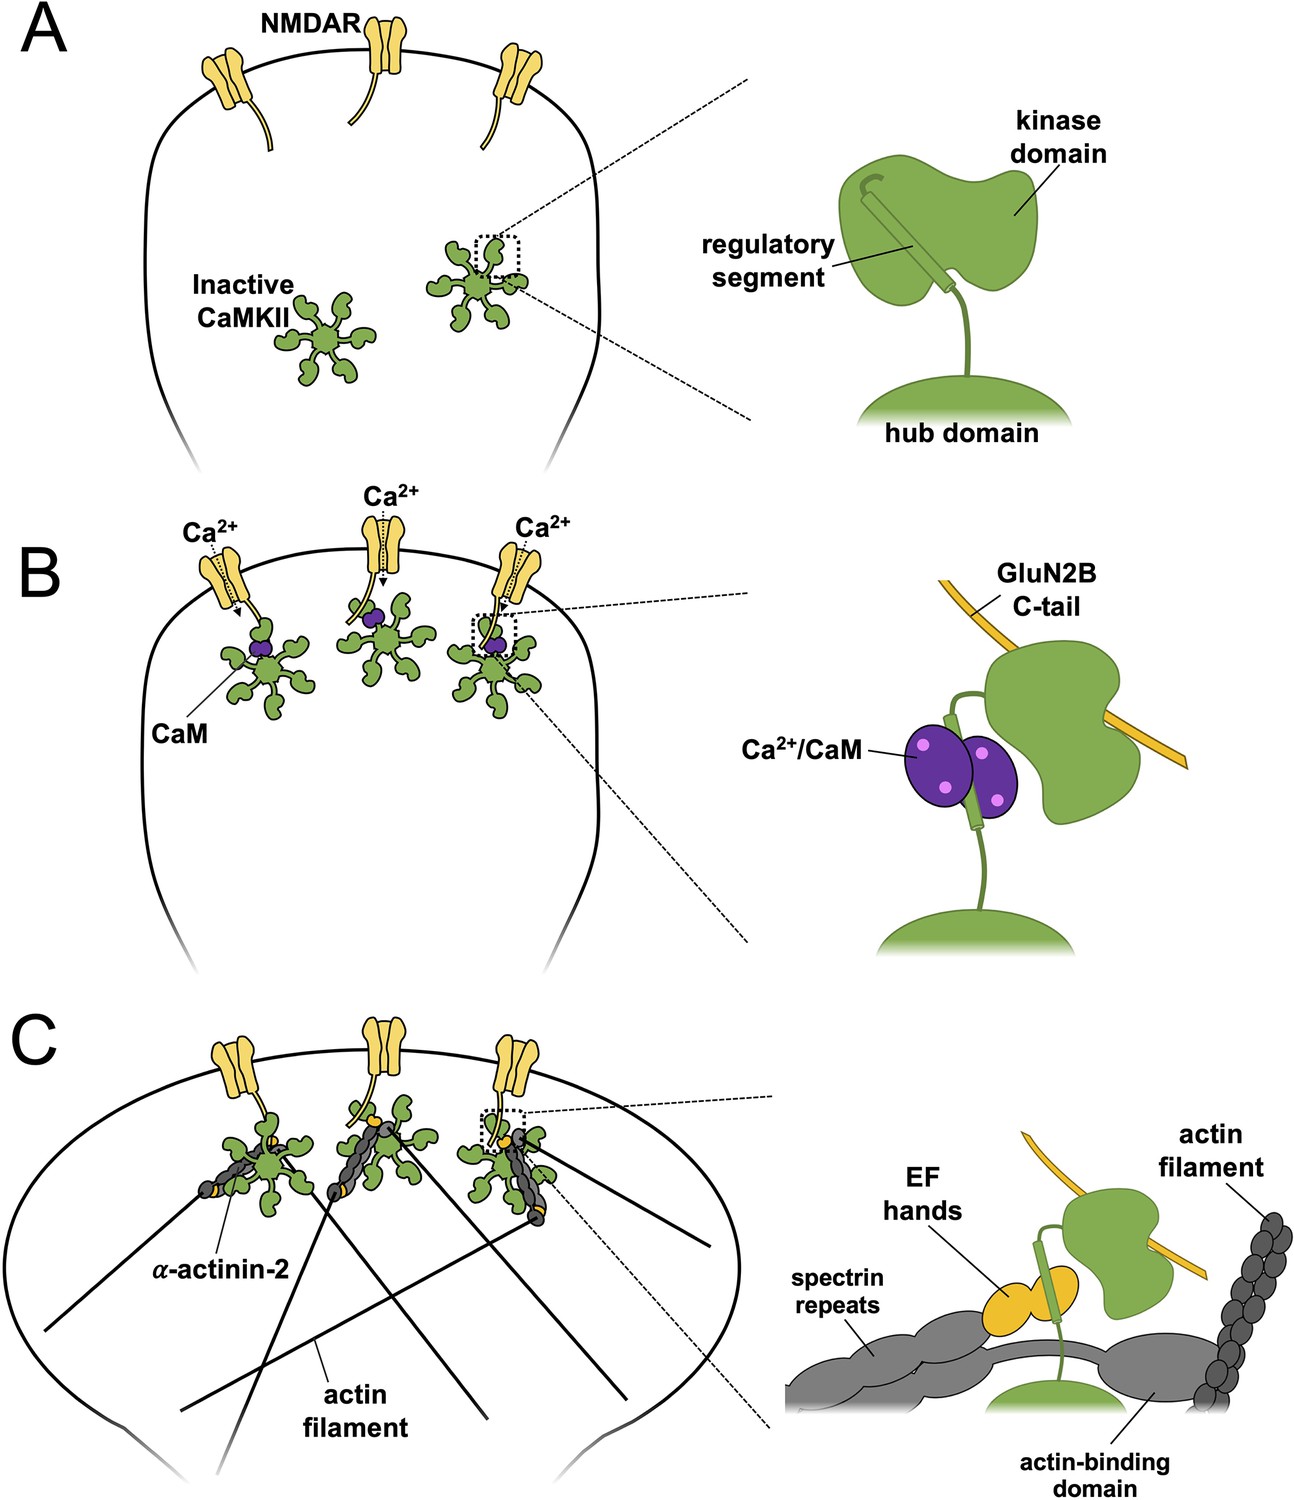
Model of actinin-calmodulin-dependent protein kinase II (CaMKII) dynamics underlying structural long-term potentiation (LTP).
A three-stage model is presented with close-up illustrations of protein interactions involving CaMKII on the right for each stage. (A) In naïve synapses prior to Ca2+ entry, the CaMKII regulatory segment associates with the kinase domain and is largely inaccessible to α-actinin-2. (B) Ca2+ influx through NMDA receptors (NMDARs) triggers binding of Ca2+/CaM (purple) to the regulatory segment, enabling docking of the kinase domain to the C-terminal tail of GluN2B (gold) subunits. (C) Following return of spine [Ca2+] to baseline levels, Ca2+/CaM dissociates whereas CaMKII-NMDAR interactions persist. This combination enables α-actinin-2 to dock to the kinase domain, thereby linking the kinase to the actin cytoskeleton in support of spine enlargement.
Tables
Table 1
Thermodynamic parameters for interactions between α-actinin-2 and calmodulin-dependent protein kinase IIα (CaMKIIα) constructs.
| Cell | Syringe | Reps | N | Kd (μM) | ΔH (kcal/mol) | –TΔS (kcal/mol) |
|---|---|---|---|---|---|---|
| EF3–4 | CaMKIIα 294–315 | 3 | 0.98±0.04 | 32±0.9 | –6.7±0.06 | 0.61±0.06 |
| CaMKIIα 1–315 | EF3–4 | 3 | ND | ND | ND | ND |
| EF1–4 | CaMKIIα 294–315 | 3 | 0.98±0.01 | 11±0.2 | –3.0±0.005 | –3.7±0.01 |
| CaMKIIα 1–315 | α-Actinin-2 EF1–4 | 3 | ND | ND | ND | ND |
| CaM | CaMKIIα 294–315 | 3 | 0.99±0.03 | 0.011±0.0007 | 4.3±0.2 | –14.6±0.2 |
| CaMKIIα 1–315 | CaM | 2 | 1.06±0.02 | 2.8±0.2 | 11.3±0.1 | –18.5±0.07 |
| EF3–4 | CaMKIIα 299–315 | 3 | 0.66±0.02 | 17.8±1.5 | –11±0.5 | 4.7±0.6 |
| CaM | CaMKIIα 299–315 | 3 | 1±0.01 | 0.047±0.001 | 4.51±0.04 | –14±0.05 |
Appendix 1—key resources table
| Reagent type (species) or resource | Designation | Source or reference | Identifiers | Additional information |
|---|---|---|---|---|
| Strain, strain background (Escherichia coli) | TOP10 chemically competent | Life Technologies | Cat# C404003 | |
| Strain, strain background (Escherichia coli) | BL21 (DE3) | Thermo Fisher Scientific | Cat# EC0114 | |
| Strain, strain background (Escherichia coli) | BL21 Tuner (DE3) pLysS | Merck | Cat# 70624 | |
| Strain, strain background (Escherichia coli) | BL21 Star (DE3) | Thermo Fisher Scientific | Cat# C601003 | |
| Cell line (Homo sapiens) | HEK293T | ATCC | Cat# CRL-3216 | Verified using STR profiling, Mycoplasma-tested |
| Biological sample (Rattus norvegicus) | Sprague-Dawley rat | UCL breeding colony | Not applicable | |
| Antibody | Rabbit polyclonal anti-GFP | Sigma-Aldrich | Cat# SAB4301138; RRID:AB_2750576 | 10 μg/mL |
| Antibody | Goat polyclonal anti-FLAG | Novus | Cat# NB600-344; RRID:AB_10000565 | 5 μg/mL |
| Antibody | Rabbit polyclonal anti-GST | Merck | Cat# G7781; RRID:AB_259965 | 0.2 μg/mL |
| Antibody | Mouse monoclonal anti-CaMKIIα | Santa Cruz Biotechnology | Cat# sc-32288; RRID:AB_626787 | 0.2 μg/mL for IB; 0.5 μg/mL for ICC |
| Antibody | Rabbit polyclonal anti-HA | Abcam | Cat# ab9110; RRID:AB_307019 | 2 μg/mL |
| Antibody | Mouse monoclonal anti-V5 | Invitrogen | Cat# MA5-15253; RRID: AB_10977225 | 2 μg/mL |
| Antibody | Goat polyclonal anti-rabbit HRP-linked secondary antibody | Cell Signaling Technology | Cat# 7074 S; RRID:AB_2099233 | 0.5 μg/mL |
| Antibody | Goat polyclonal anti-mouse HRP secondary antibody | Thermo Fisher Scientific | Cat# 32230; RRID:AB_1965958 | 0.5 μg/mL |
| Antibody | Goat polyclonal anti-rabbit Alexa Fluor-405 | Thermo Fisher Scientific | Cat# A-31556; RRID:AB_221605 | 4 μg/mL |
| Antibody | Duolink In Situ PLA Probe, Donkey Polyclonal Anti-Goat PLUS | Merck | Cat# DUO92003 | At 1x final concentration according to the manufacturer’s guidelines. |
| Antibody | Duolink In Situ PLA Probe, Donkey Polyclonal Anti-Mouse MINUS | Merck | Cat# DUO92004 | At 1x final concentration according to the manufacturer’s guidelines. |
| Antibody | Duolink In Situ PLA Probe, Donkey Polyclonal Anti-Rabbit MINUS | Merck | Cat# DUO92005 | At 1x final concentration according to the manufacturer’s guidelines. |
| Antibody | Rabbit anti-GFP | Sigma-Aldrich | Cat# SAB4301138; RRID:AB_2750576 | 10 μg/mL |
| Antibody | Goat anti-FLAG | Novus | Cat# NB600-344; RRID:AB_10000565 | 5 μg/mL |
| Antibody | Rabbit anti-GST | Merck | Cat# G7781; RRID:AB_259965 | 0.2 μg/mL |
| Antibody | Mouse anti-CaMKIIα | Santa Cruz Biotechnology | Cat# sc-32288; RRID:AB_626787 | 0.2 μg/mL for IB; 0.5 μg/mL for ICC |
| Antibody | Rabbit anti-HA | Abcam | Cat# ab9110; RRID:AB_307019 | 2 μg/mL |
| Antibody | Mouse anti-V5 | Invitrogen | Cat# MA5-15253; RRID: AB_10977225 | 2 μg/mL |
| Antibody | Goat anti-rabbit HRP-linked secondary antibody | Cell Signaling Technology | Cat# 7074 S; RRID:AB_2099233 | 0.5 μg/mL |
| Antibody | Goat anti-mouse poly-HRP secondary antibody | Thermo Fisher Scientific | Cat# 32230; RRID:AB_1965958 | 0.5 μg/mL |
| Antibody | Goat anti-rabbit Alexa Fluor-405 | Thermo Fisher Scientific | Cat# A-31556; RRID:AB_221605 | 4 μg/mL |
| Recombinant DNA reagent | pIRES2-EGFP | Clontech | Cat# 6029-1 | |
| Recombinant DNA reagent | pIRES2-EGFP-FLAG-α-actinin-2 construct series (1–894; 1–748; 747–894; 747–890; 1–890; 747–894 L854R) | This study | Not applicable | Contact MGG to obtain this vector |
| Recombinant DNA reagent | pcDNA3.1-6His-CaMKIIα | This study | Not applicable | Contact MGG to obtain this vector |
| Recombinant DNA reagent | pIRES2-EGFP-V5-CaMKIIα (WT, T286A, T305A, and T306A variants) | This study | Not applicable | Contact MGG to obtain this vector |
| Recombinant DNA reagent | pET28-6His-GST-Tev- actinin-2 EF3–4 (827–894) | This study | Not applicable | Contact MGG to obtain this vector |
| Recombinant DNA reagent | pNH-TrxT-6His-Trx-Tev-CaMKIIα (1–315) | This study | Not applicable | Contact MGG to obtain this vector |
| Recombinant DNA reagent | pGEX6P1-α-actinin-2 EF1–4 (747–894) | This study | Not applicable | Contact MGG to obtain this vector |
| Recombinant DNA reagent | pGEX6P1-GluN2B (1260–1492) | This study | Not applicable | Contact MGG to obtain this vector |
| Recombinant DNA reagent | pET28-CaM (untagged) | Patel et al., 2017 | Not applicable | Contact MGG to obtain this vector |
| Recombinant DNA reagent | pCI-EGFP-NR2B | Andres Barria and Robert Malinow/Addgene | RRID:Addgene_45447 | |
| Recombinant DNA reagent | pEGFP-NR2B vector | Stefano Vicini/Addgene | RRID:Addgene_17925 | |
| Recombinant DNA reagent | pEGFP-NR2B-iHA (WT and ΔCaMKII variants) | This study | Not applicable | Contact MGG to obtain this vector |
| Recombinant DNA reagent | pNH-TrxT | Opher Gileadi/Addgene | RRID:Addgene_26106 | |
| Recombinant DNA reagent | pET3d-6His-α-actinin-2 | Kristina Djinović-Carugo (de Ribeiro et al., 2014) | Not applicable | |
| Chemical compound, drug | Lipofectamine 2000 | Thermo Fisher Scientific | Cat# 11668019 | |
| Chemical compound, drug | Polyethylenimine (linear, MW25000) | Polysciences | Cat# 23966 | |
| Chemical compound, drug | Duolink In Situ Detection Reagents Red | Merck | Cat# DUO92008 | |
| Chemical compound, drug | Pierce Glutathione Magnetic Agarose Beads | Thermo Fisher Scientific | Cat# 78601 | |
| Chemical compound, drug | DMEM, high glucose, pyruvate | Thermo Fisher Scientific | Cat# 41966029 | |
| Chemical compound, drug | Trypsin | Thermo Fisher Scientific | Cat# 25300054 | |
| Chemical compound, drug | Penicillin/Streptomycin | Thermo Fisher Scientific | Cat# 15140122 | |
| Chemical compound, drug | GlutaMAX | Thermo Fisher Scientific | Cat# 35050061 | |
| Chemical compound, drug | DPBS, no calcium, no magnesium | Thermo Fisher Scientific | Cat# 14190144 | |
| Chemical compound, drug | Neurobasal-A medium | Thermo Fisher Scientific | Cat# 10888022 | |
| Chemical compound, drug | B27 supplement | Gibco | Cat# 17504044 | |
| Chemical compound, drug | Poly-L-Lysine | Sigma-Aldrich | Cat# P2636 | |
| Chemical compound, drug | Complete, Mini, EDTA-free Protease Inhibitor Cocktail | Roche | Cat# 11836170001 | |
| Software, algorithm | ImageJ (version 1.52) | NIH | RRID:SCR_003070 | |
| Software, algorithm | NeuronStudio | Rodriguez et al., 2008 | https://icahn.mssm.edu; RRID:SCR_013798 | |
| Software, algorithm | Origin | OriginLab | RRID:SCR_014212 |
Additional files
-
Supplementary file 1
Data collection and refinement statistics.
- https://cdn.elifesciences.org/articles/85008/elife-85008-supp1-v3.docx
-
Supplementary file 2
Oligonucleotide primers sequences.
Primer sequences are shown (5’ to 3’).
- https://cdn.elifesciences.org/articles/85008/elife-85008-supp2-v3.docx
-
MDAR checklist
- https://cdn.elifesciences.org/articles/85008/elife-85008-mdarchecklist1-v3.docx
Download links
A two-part list of links to download the article, or parts of the article, in various formats.
Downloads (link to download the article as PDF)
Open citations (links to open the citations from this article in various online reference manager services)
Cite this article (links to download the citations from this article in formats compatible with various reference manager tools)
Molecular basis of interactions between CaMKII and α-actinin-2 that underlie dendritic spine enlargement
eLife 12:e85008.
https://doi.org/10.7554/eLife.85008


