Prolonged T-cell activation and long COVID symptoms independently associate with severe COVID-19 at 3 months
- School of Cellular and Molecular Medicine, University of Bristol, United Kingdom
- Academic Respiratory Unit, North Bristol NHS Trust, United Kingdom
- Diabetes and Metabolism, Bristol Medical School, University of Bristol, United Kingdom
- Bristol Veterinary School, University of Bristol, United Kingdom
- University Hospitals Bristol and Weston NHS Foundation Trust, United Kingdom
- Department of Paediatric Immunology and Infectious Diseases, Bristol Royal Hospital for Children, United Kingdom
- School of Population Health Sciences, University of Bristol, United Kingdom
Figures
Figure 1 with 2 supplements
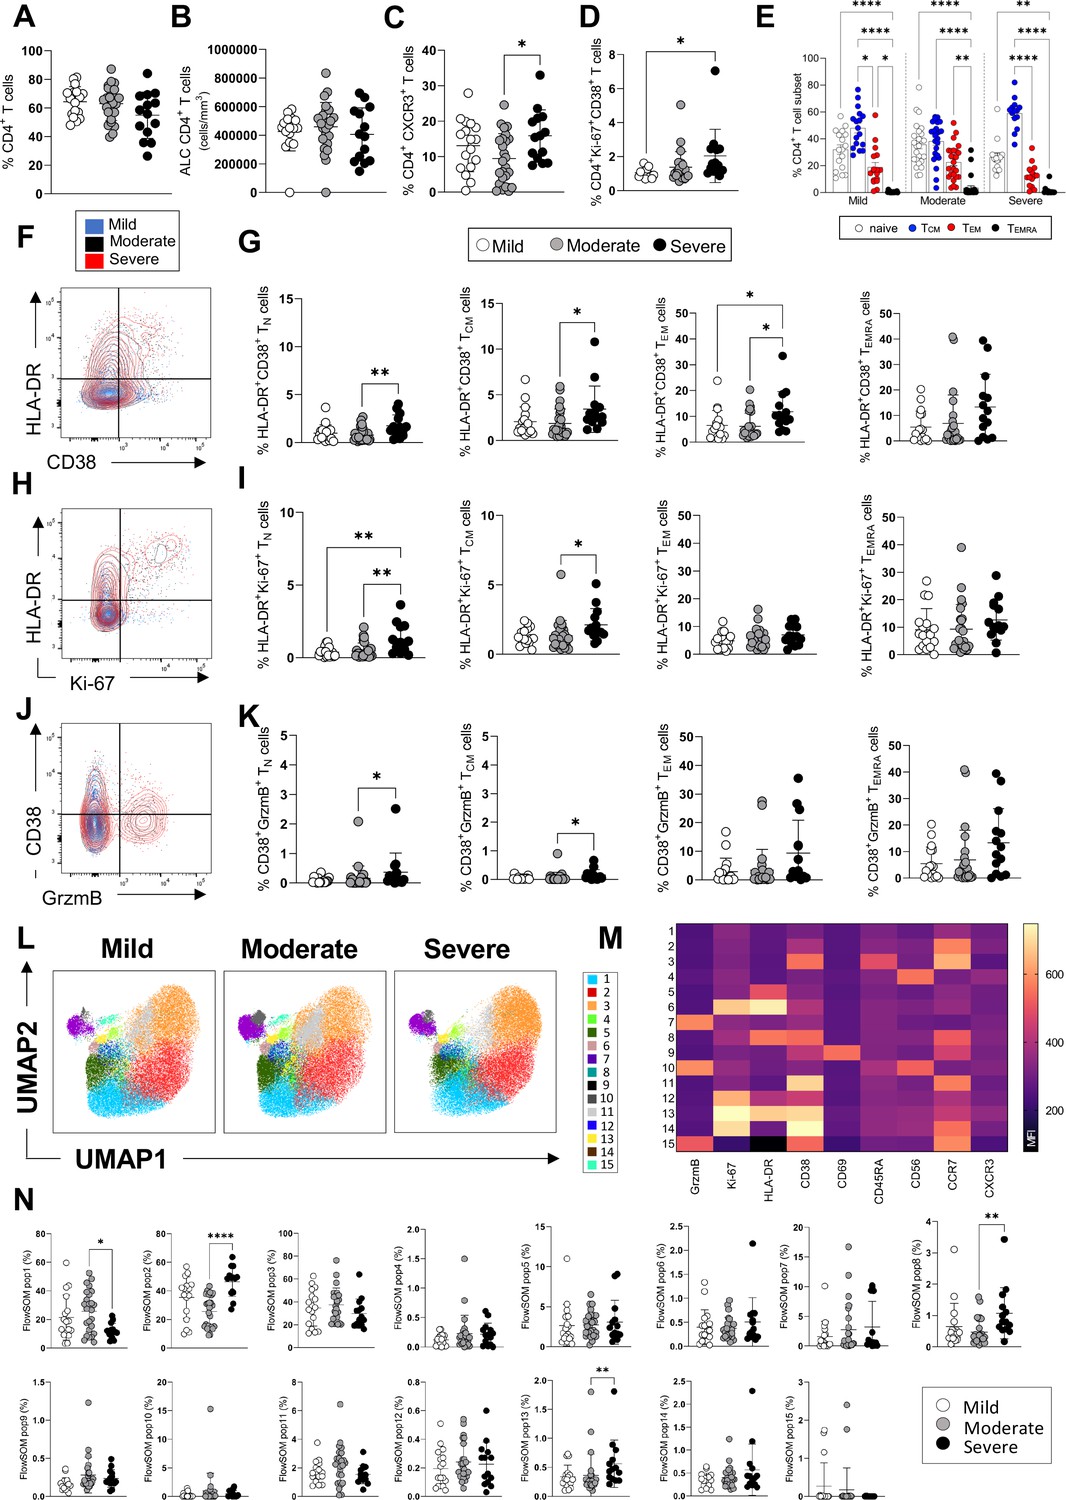
CD4+ T-cell profiles in convalescent coronavirus disease-19 (COVID-19) patients at 3 months post admission.
(A–D) Percentage of CD4+ T-cells within the CD3+ gate (A), absolute number of CD4+ T-cells (cells/mm3) (B), and percentages of CD4+ T-cells expressing CXCR3 (C) and co-expressing Ki67/CD38 (D) are shown in mild, moderate, and severe patients. (E) Percentages of naïve (CCR7+ CD45RA+), T central memory (TCM, CCR7+ CD45RA-), T effector memory (TEM, CCR7- CD45RA-), and T effector memory RA re-expressing (TEMRA, CCR7- CD45RA+) CD4+ T-cells are shown for patients with mild, moderate, and severe disease. (F) Flow cytometry plot showing a representative staining from a mild, moderate, and severe patient of HLA-DR and CD38 expression in CD4+ TEM cells (overlaid and shown respectively in blue, black, and red). (G) Percentages of activated HLA-DR+CD38+ CD4+ T-cells within naïve, TCM, TEM, and TEMRA cells. (H) Flow cytometry plot with a representative staining from a mild, moderate, and severe patient of HLA-DR and Ki67 expression in CD4+ TEM cells. (I) Percentages of proliferating HLA-DR+ Ki67+ CD4+ T-cells within naïve, TCM, TEM, and TEMRA cells. (J) Flow cytometry plot with a representative staining from a mild, moderate, and severe patient of HLA-DR and granzyme B (GrzmB) expression in CD4+ TEM cells. (K) Percentages of proliferating HLA-DR+ GrzmB+ CD4+ T-cells within naïve, TCM, TEM, and TEMRA cells. (L) Unsupervised uniform manifold approximation and projection (UMAP) analysis showing the FlowSOM clusters in mild (N=17), moderate (N=25), and severe (N=14) patients. Plots are gated on CD4+ T-cells. (M) Heatmap with the expression of each analysed marker within the FlowSOM populations shown as mean fluorescence intensity (MFI). (N) Summary of the percentage of CD4+ T-cells within the indicated FlowSOM populations in mild, moderate, and severe patients. Data in graphs are visualised as mean ± SEM. Statistics are calculated by one-way ANOVA (Kruskal-Wallis test) with Dunn’s correction for multiple testing.
Figure 1—figure supplement 1

Gating strategy used to identify CD4+, CD8+, and TCR-γδ T-cells, NK cells, and monocytes.
Figure 1—figure supplement 2

Dynamic changes of immune populations and inflammatory markers in coronavirus disease-19 (COVID-19) patients at acute illness, 3 and 8 months post admission.
(A–F) Lymphocyte (A–C) and neutrophil (D–F) counts during acute illness, at 3 and 8 months post admission in patients with mild (A, D), moderate (B, E), and severe (C, F) disease. (G–L) Albumin (G–I) and CRP (J–L) levels during acute illness, at 3 and 8 months post admission in patients with mild (G, J), moderate (H, K), and severe (I, L) disease. Data from mild (acute: N=17; 3 months: N=17; 8 months: N=10), moderate (acute: N=32; 3 months: N=32; 8 months: N=21), and severe (acute: N=14; 3 months: N=14; 8 months: N=11) patients are indicated with white, grey, and black symbols. Data are shown as a mean ± SD; *p<0.05, **p≤0.01, ***p≤0.001. Statistics were calculated by one-way ANOVA, with Geisser-Greenhouse correction for multiple testing.
Figure 2 with 2 supplements
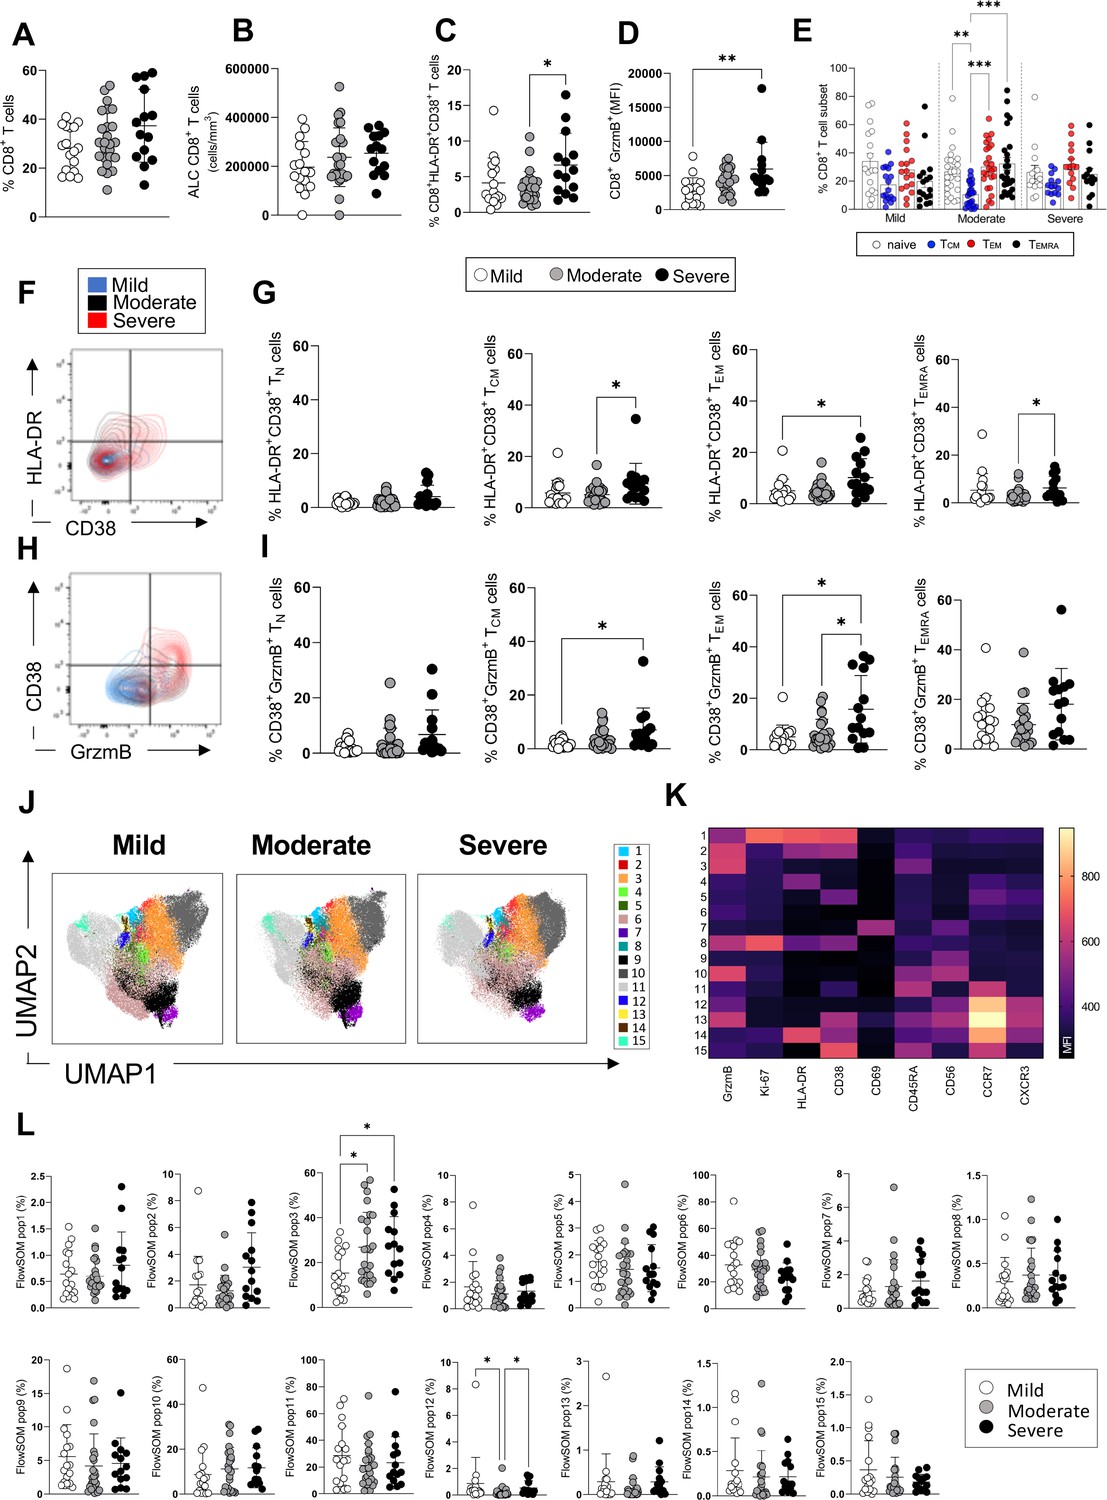
CD8+ T-cell profiles in convalescent coronavirus disease-19 (COVID-19) patients at 3 months post admission.
(A–D) Percentage of CD8+ T-cells within the CD3+ gate (A), absolute number of CD8+ T-cells (cells/mm3) (B), and percentages of CD8+ T-cells co-expressing the activation markers HLA-DR/CD38 (C) or granzyme B (D, shown as mean fluorescence intensity [MFI]) are shown in mild, moderate, and severe patients. (E) Percentages of naïve (CCR7+ CD45RA+), T central memory (TCM, CCR7+ CD45RA-), T effector memory (TEM, CCR7- CD45RA-), and T effector memory RA re-expressing (TEMRA, CCR7- CD45RA+) CD8+ T-cells in patients with mild, moderate, and severe disease. (F) Flow cytometry plot with a representative staining from a mild, moderate, and severe patient (overlaid and shown respectively in blue, black, and red) of HLA-DR and CD38 expression in CD8+ TEM cells. (G) Percentages of activated HLA-DR+ CD38+ CD8+ T-cells within naïve, TCM, TEM, and TEMRA cells. (H) Flow cytometry plot with a representative staining from a mild, moderate, and severe patient of HLA-DR and granzyme B (GrzmB) expression in CD8+ TEM cells. (I) Percentages of proliferating HLA-DR+ GrzmB+ CD8+ T-cells within naïve, TCM, TEM, and TEMRA cells. (J) Unsupervised uniform manifold approximation and projection (UMAP) analysis showing the FlowSOM clusters in mild (N=17), moderate (N=25), and severe (N=14) patients. Plots are gated on CD8+ T-cells. (K) Heatmap with MFI levels for each analysed marker within the FlowSOM populations. (L) Summary of percentage of CD8+ T-cells within the indicated FlowSOM populations in mild, moderate, and severe patients. Data in the graphs are shown as mean ± SEM. Statistics were calculated by one-way ANOVA (Kruskal-Wallis test) with Dunn’s correction for multiple testing.
Figure 2—figure supplement 1
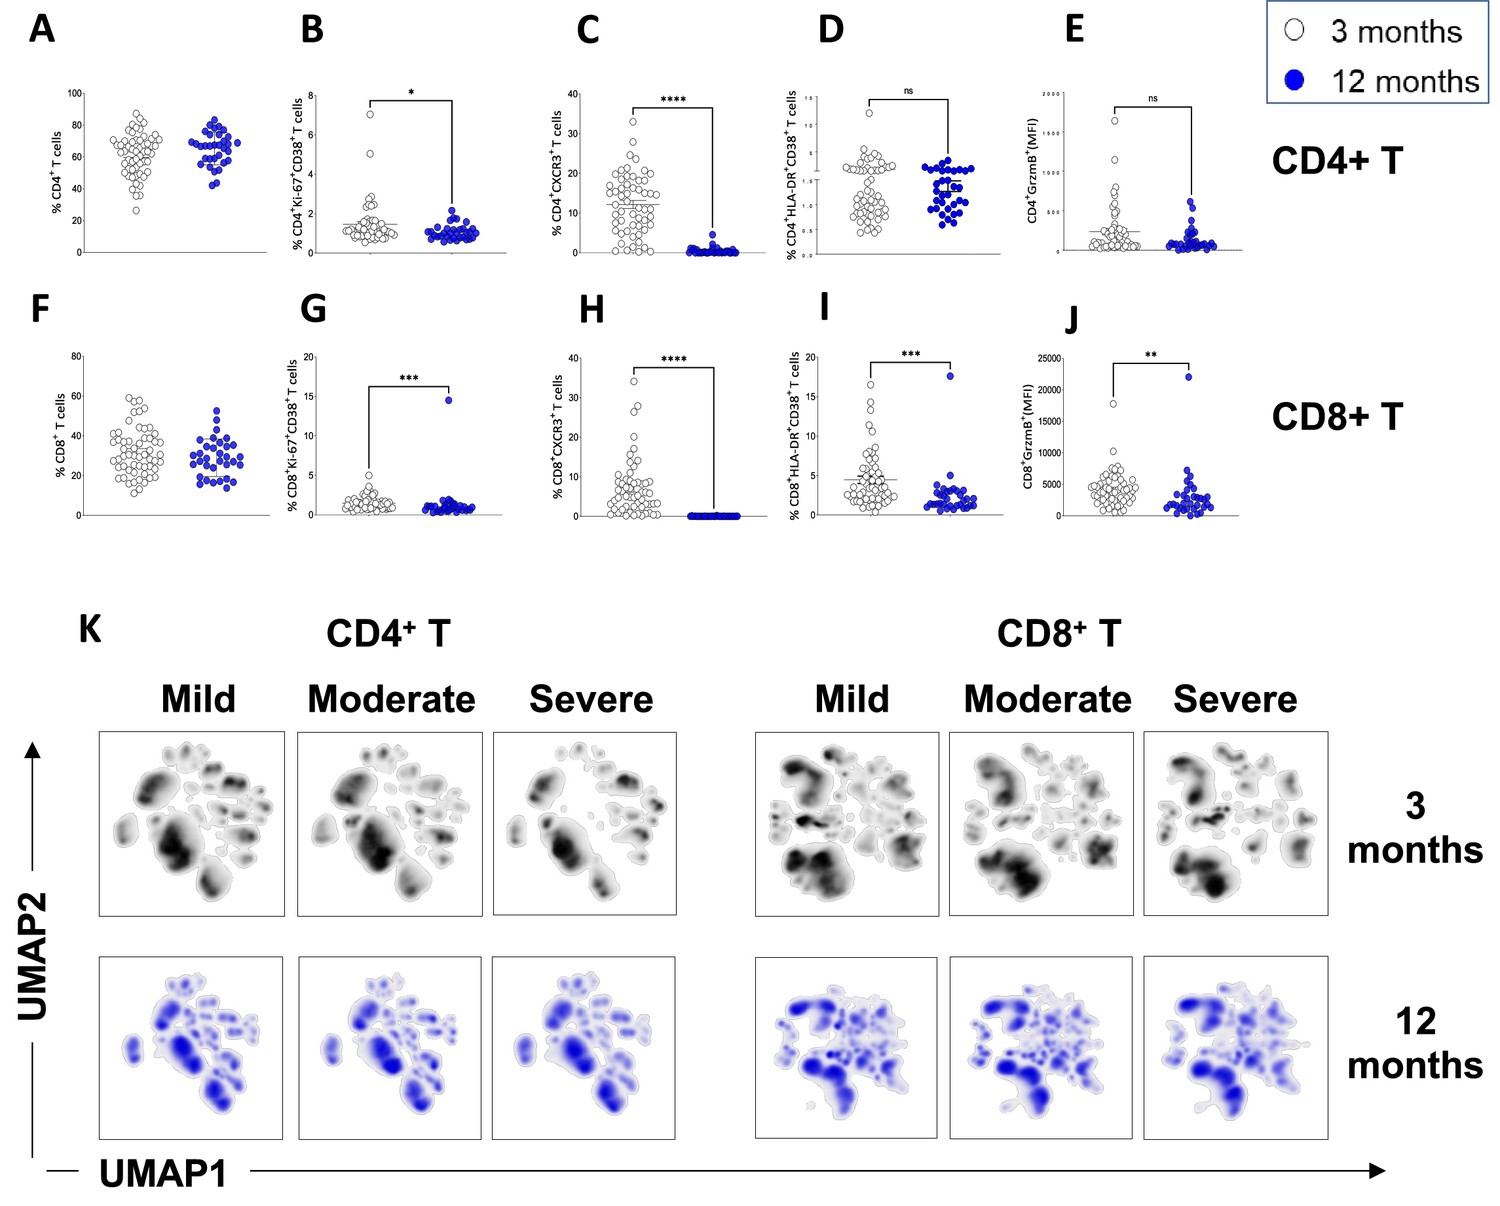
Resolution of T-cell activation at 12 months.
(A–E) CD4+ T-cells in convalescent coronavirus disease-19 (COVID-19) patients at 3 and 12 months. Shown are the percentages of CD4+ T-cells within the CD3+ gate (A) and the percentages of CD4+ T-cells that are Ki67+ CD38+ (B), CXCR3+ (C), HLA-DR+CD38+ (D) and granzyme B+ (shown as mean fluorescence intensity [MFI]) (E).(F–J) CD8+ T-cells in convalescent COVID-19 patients at 3 and 12 months. Shown are the percentages of CD8+ T-cells within the CD3+ gate (F) and the percentages of CD8+ T-cells that are Ki67+ CD38+ (G), CXCR3+ (H), HLA-DR+CD38+ (I), and granzyme B+ (shown as MFI) (J). (K) Unsupervised uniform manifold approximation and projection (UMAP) analysis showing the density plot of cell distribution in mild (N=17), moderate (N=25), and severe (N=14) patients at 3 months and in matched mild (N=8), moderate (N=17), and severe (N=8) patients at 12 months post infection. Data in A–J are shown as mean ± SEM. Statistics in A–J were calculated by Mann-Whitney t-test.
Figure 2—figure supplement 2
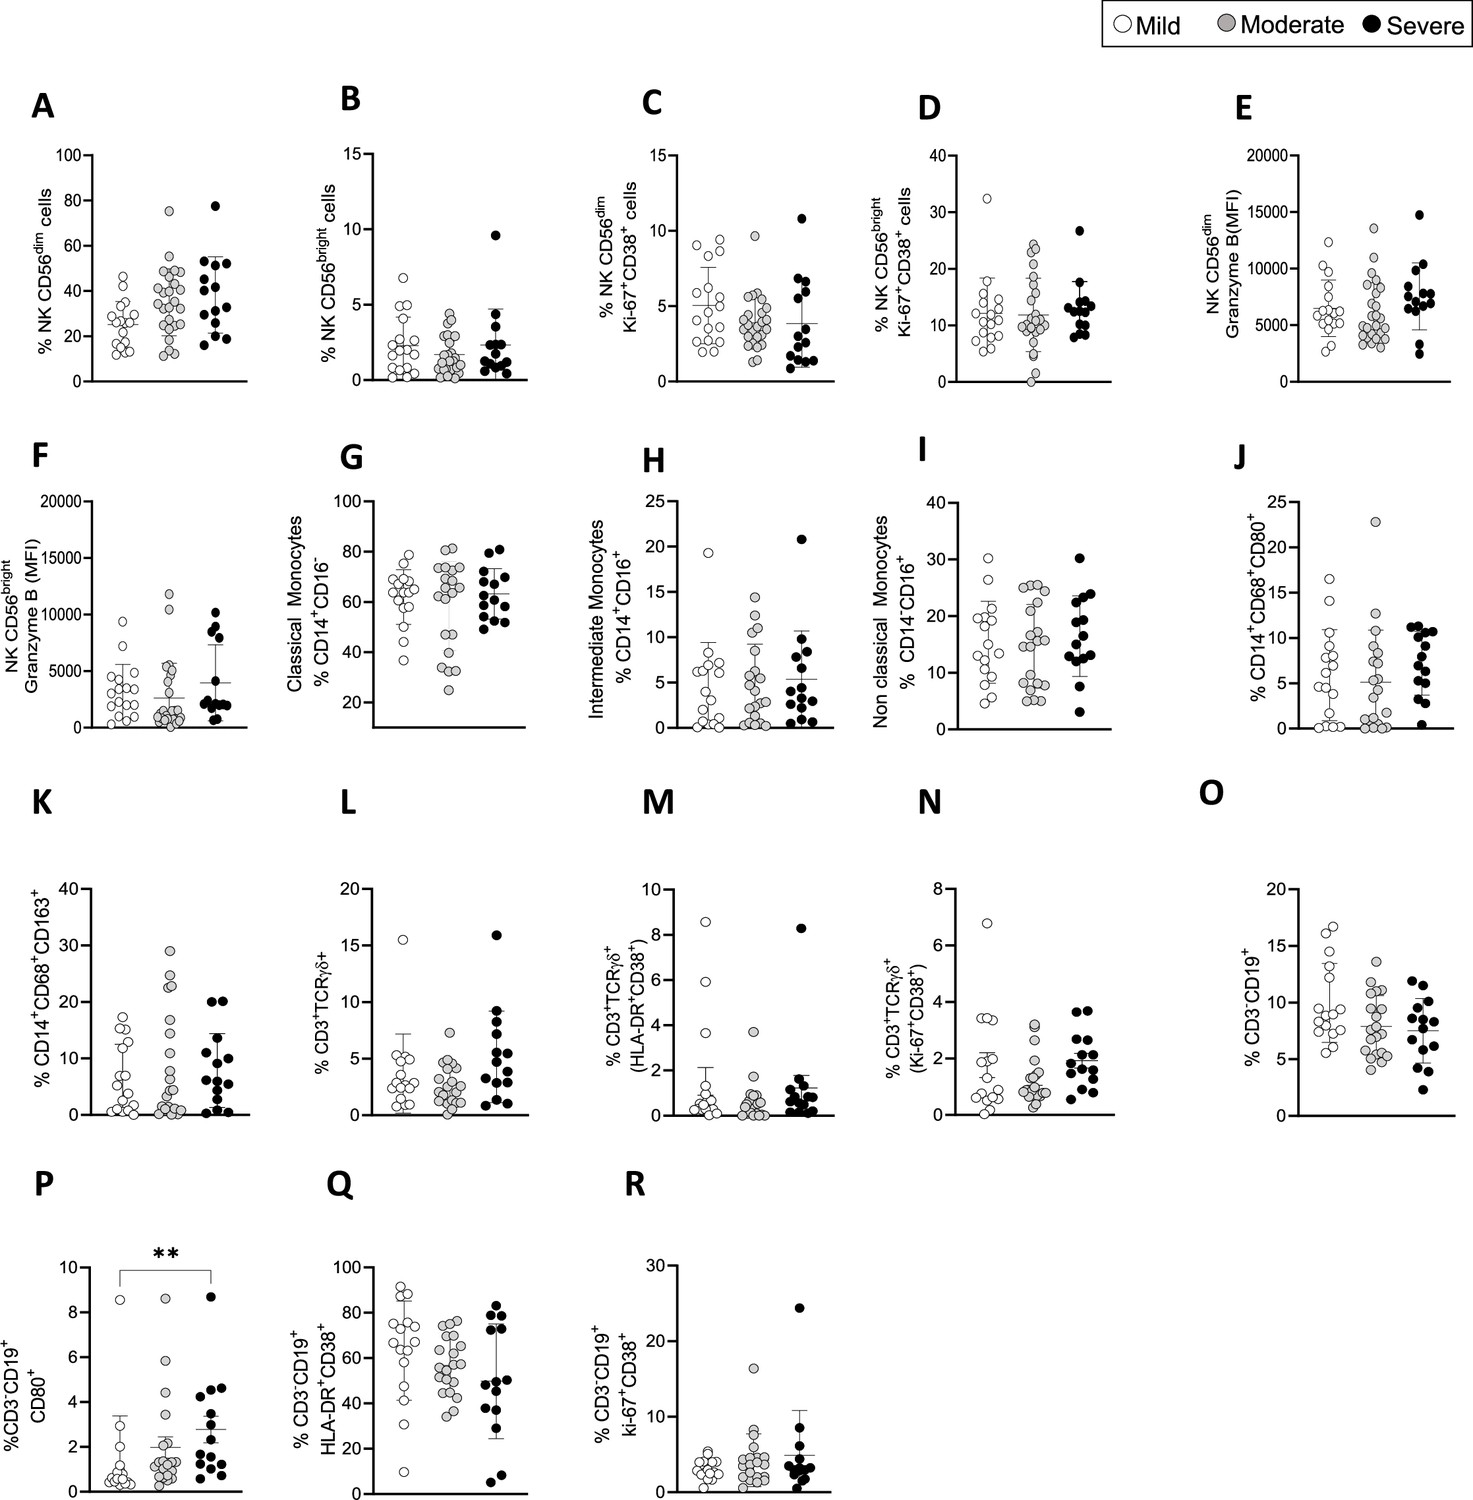
Immune cell populations in coronavirus disease-19 (COVID-19) patients at 3 months post admission.
(A–F) Shown are the percentages of CD56dim (A), CD56bright NK cells (B), Ki67+CD38+ CD56dim (C), and Ki67+CD38+CD56bright NK cells (D). Granzyme B expression on CD56dim (E) and CD56bright (F) NK cells is shown as mean florescence intensity (MFI). (G–K) Shown are the percentages of classical (G: CD14+CD16-), intermediate (H: CD14+CD16+), and non-classical (I: CD14-CD16+) monocytes, activated CD14+CD80+CD86+ (J) and CD14+CD86+CD163+ cells (K). (L–N) TCR-γδ T-cells: frequencies of TCR-γδ T-cells (L), activated HLA-DR+CD38+ (M), and activated/proliferating Ki67+CD38+ TCR-γδ T-cells (N).(O–R) Shown are the percentages of CD3-CD19+ B cells (O), activated CD80+ (P), and HLA-DR+CD38+ B cells (Q) and proliferating Ki67+CD38+ B cells (R). Data are shown as mean ± SD in patients with mild (N=16), moderate (N=21) and severe (N=14) disease. Statistics were by calculated one-way ANOVA test (Kruskal-Wallis test) with Dunn’s correction for multiple testing.
Figure 3 with 1 supplement
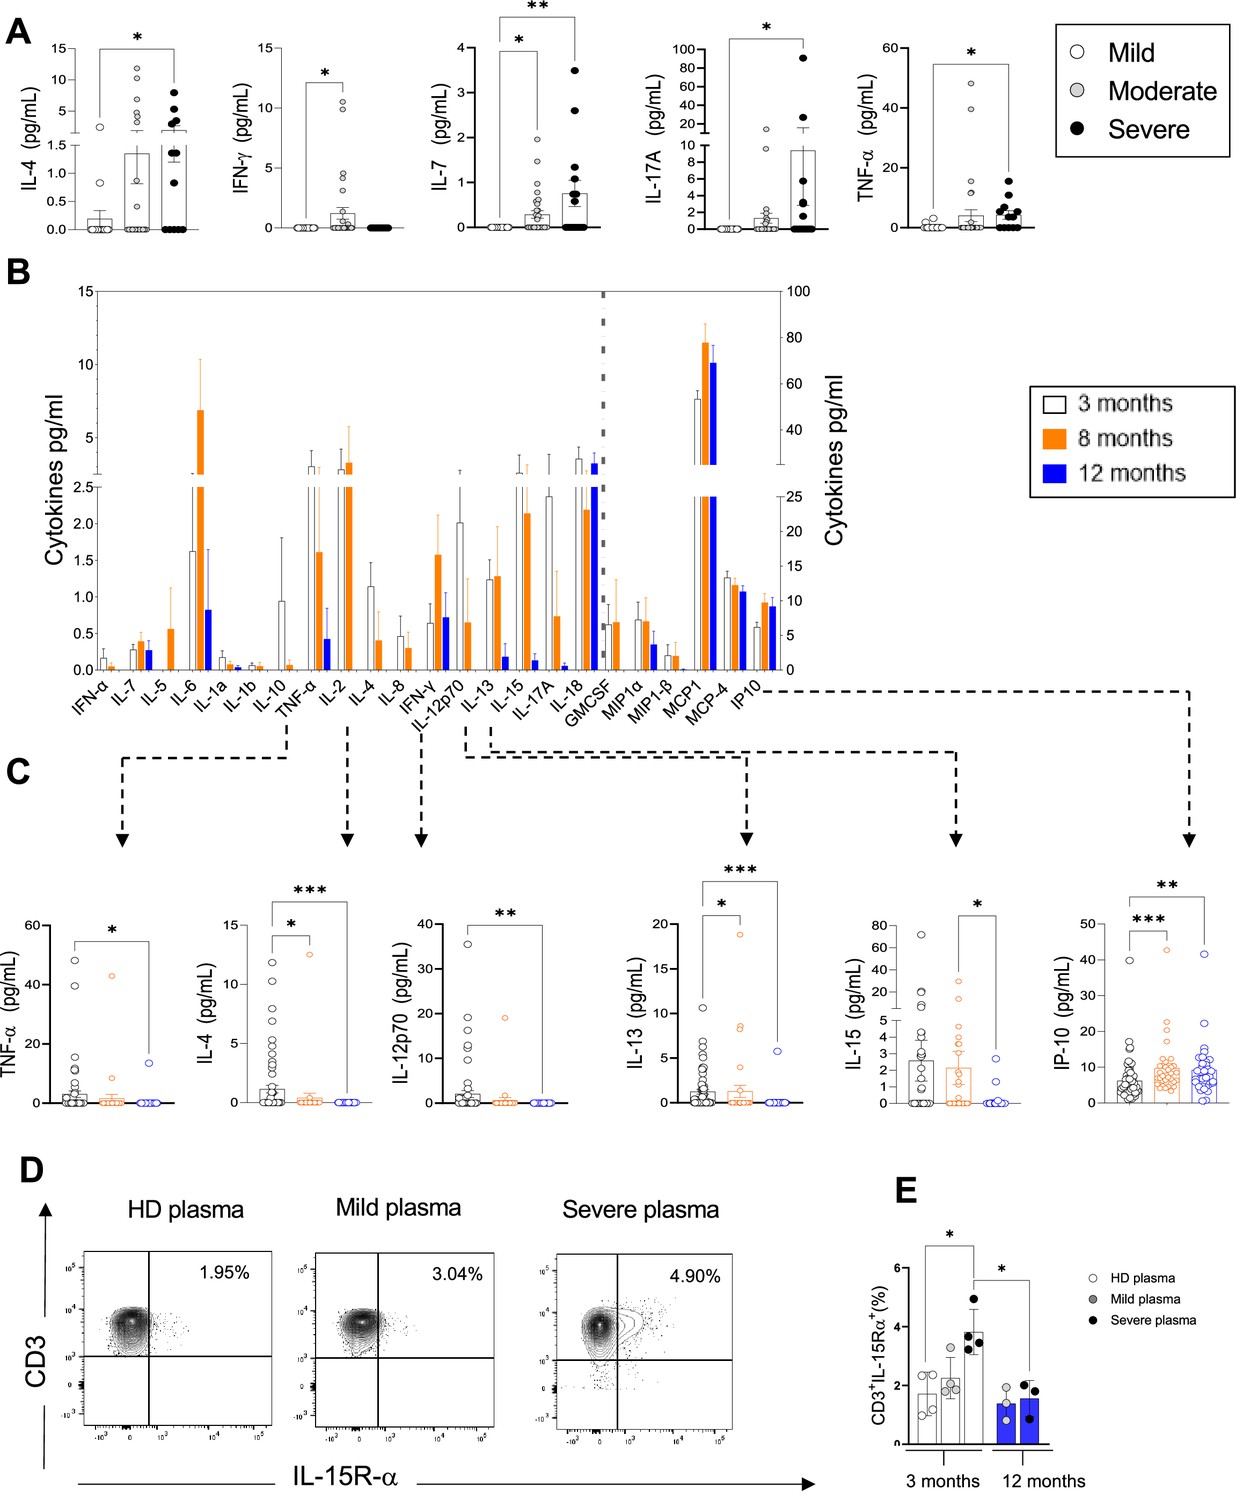
Plasma pro-inflammatory cytokines/chemokines measured at 3, 8, and 12 months.
(A) Plasma cytokines/chemokines measured at 3 months post admission which differed significantly between patients with mild, moderate, and severe disease are shown (N=63: mild: N=17; moderate: N=32; severe: N=14, depicted in white, grey, and black bars, respectively). (B–C) Cytokines/chemokines measured longitudinally in matched samples in patients at 3 (n=63), 8, and 12 months post admission (n=33 samples for each time point) are shown. Data from analytes that differed significantly between time points in B are shown in C for each patient. (D, E) Purified CD3+ T-cells from healthy donors (N=4 for 3 months; N=3 for 12 months) were co-cultured with plasma from 4 healthy donors, 4 mild, and 4 severe patients at 3 months post infection. Shown is IL-15R-α expression in T-cells from a representative donor at 3 months (D) and the average expression of IL-15Rα by T-cells from each peripheral blood mononuclear cell (PBMC) donor after co-culture with plasma from healthy, mild and severe patients, where each data point represents a single patient (E). Statistics were calculated by one-way ANOVA test (Kruskal-Wallis test) with Dunn’s multiple comparison test (A, E) and by ANOVA/repeated-measures one-way ANOVA, mixed-effects analysis with the Geisser-Greenhouse correction, Tukey’s multiple comparison test. (B, C) Data are visualised as mean ± SEM.
Figure 3—figure supplement 1
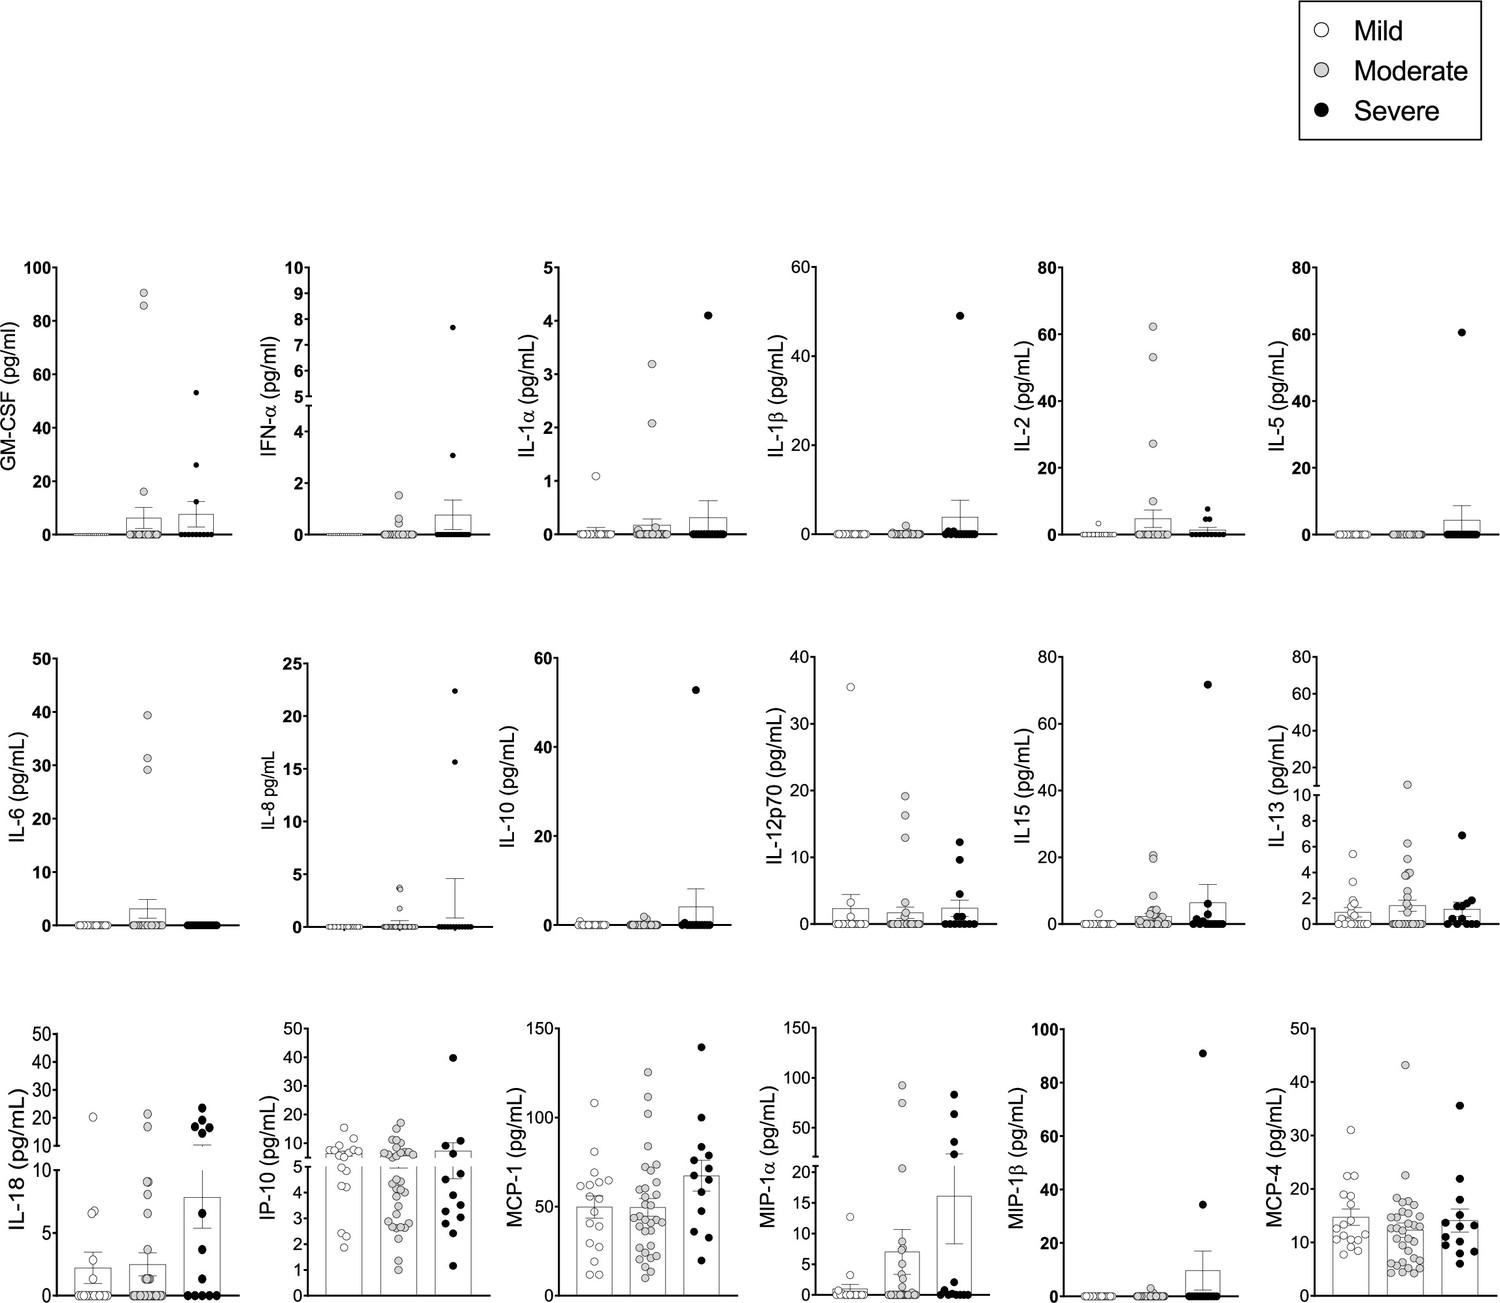
Pro-inflammatory cytokines/chemokines in the plasma of coronavirus disease-19 (COVID-19) patients at 3 months post admission.
Cytokines/chemokines were measured in the plasma of patients by Luminex. (A) Analyte levels (pg/ml) are shown for mild, moderate, and severe patients at 3 months post admission (63 samples: mild: N=17; moderate: N=32; severe: N=14, depicted in white, grey, and black symbols, respectively). Data are visualised as mean ± SEM. No statistical differences were detected for the cytokines included here, as calculated by one-way ANOVA test (Kruskal-Wallis test) with Dunn’s correction for multiple testing.
Figure 4
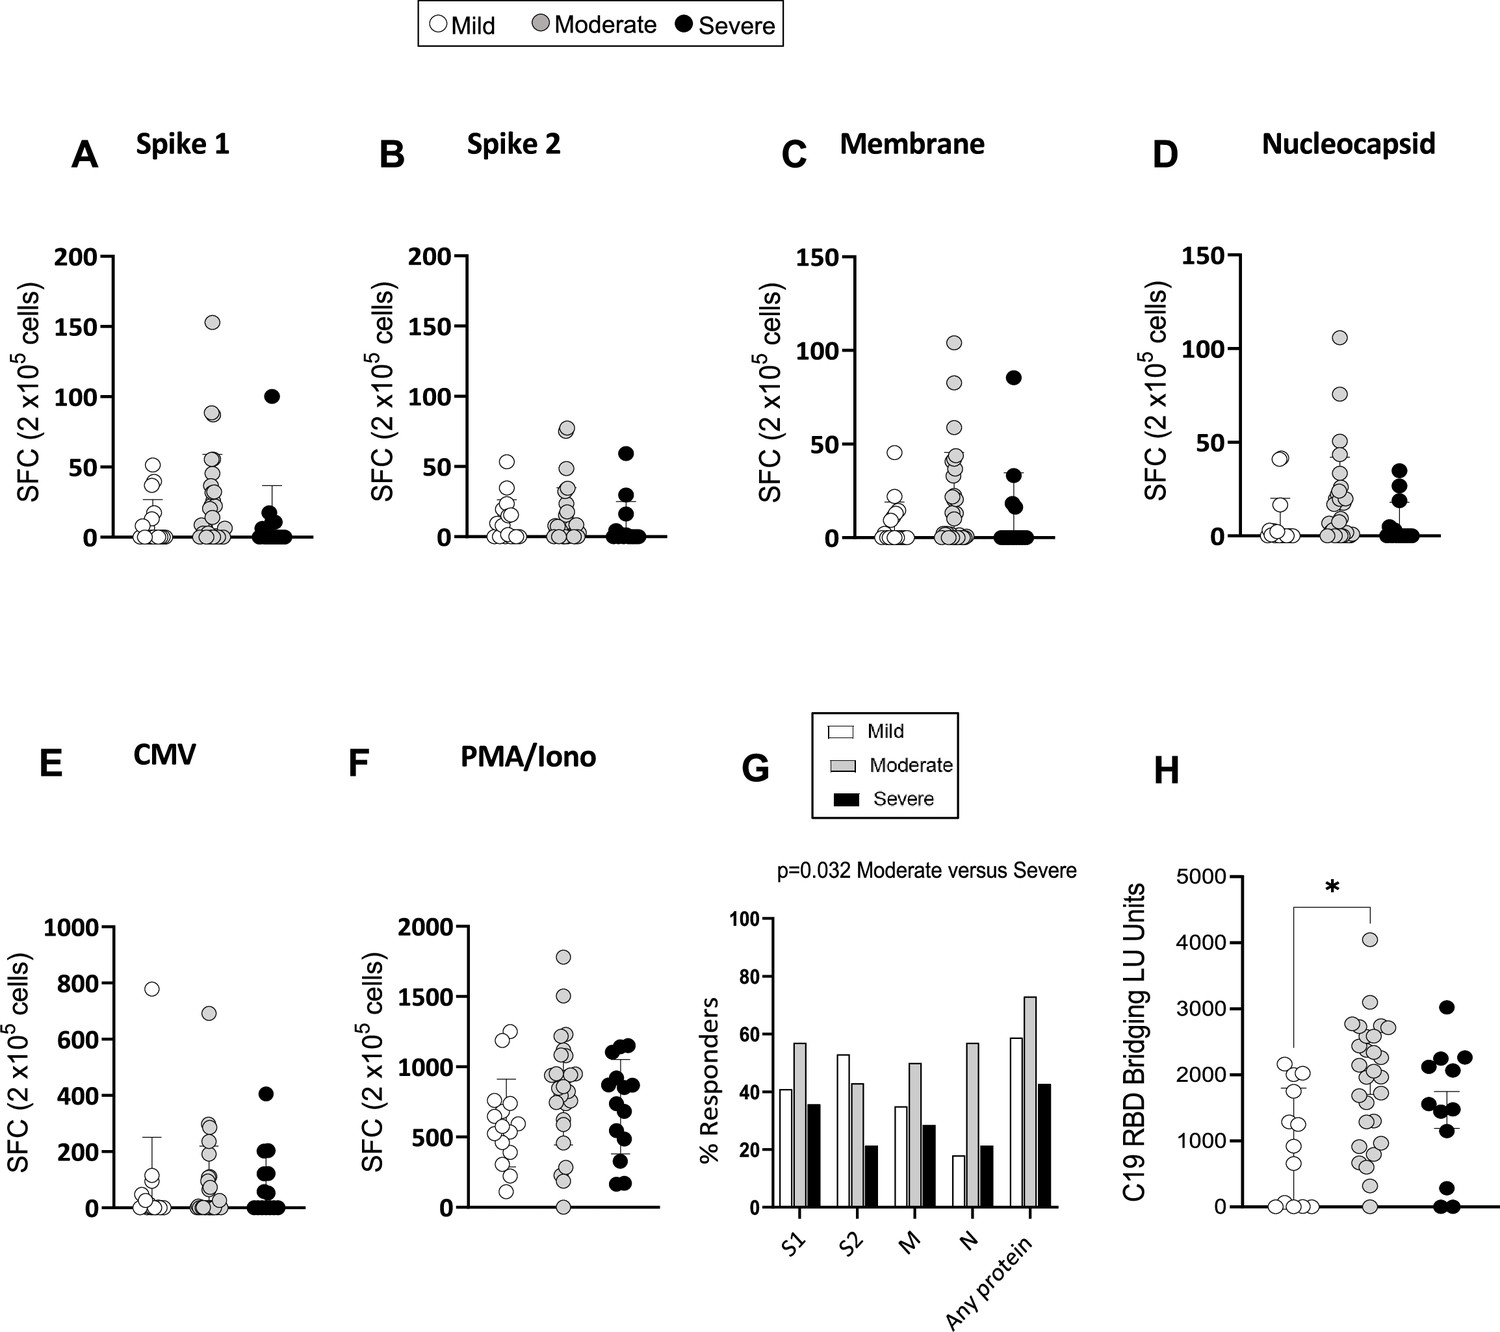
Severe acute respiratory syndrome coronavirus 2 (SARS-CoV-2)-specific memory T-cell and antibody response at 3 months.
(A–F) Interferon gamma (IFN-γ) release measured by Enzyme-Linked Immune absorbent Spot (ELISpot) in peripheral blood mononuclear cells (PBMCs) from mild, moderate, and severe patients (N=61) upon stimulation with 15-mer peptide pools spanning SARS-CoV-2 spike 1 (A), spike 2 (B), membrane (C), nucleocapsid (D), cytomegalovirus (CMV) pp65 (E), and PMA/ionomycin (F). Results are shown as spot forming cells (SFC) relative to 2×10⁵ PBMCs. (G) Percentages of responders assessed as patients from each severity group who displayed a response to the indicated peptide pool >5 SFC/2×105 PBMCs. (H) SARS-CoV-2 receptor binding domain (RBD) antibody titers in patients expressed as RBD bridging LU units. Data in A–F are visualised as mean ± SEM. Statistics were calculated by one-way ANOVA (Kruskal-Wallis test) with Dunn’s correction for multiple testing.
Figure 5
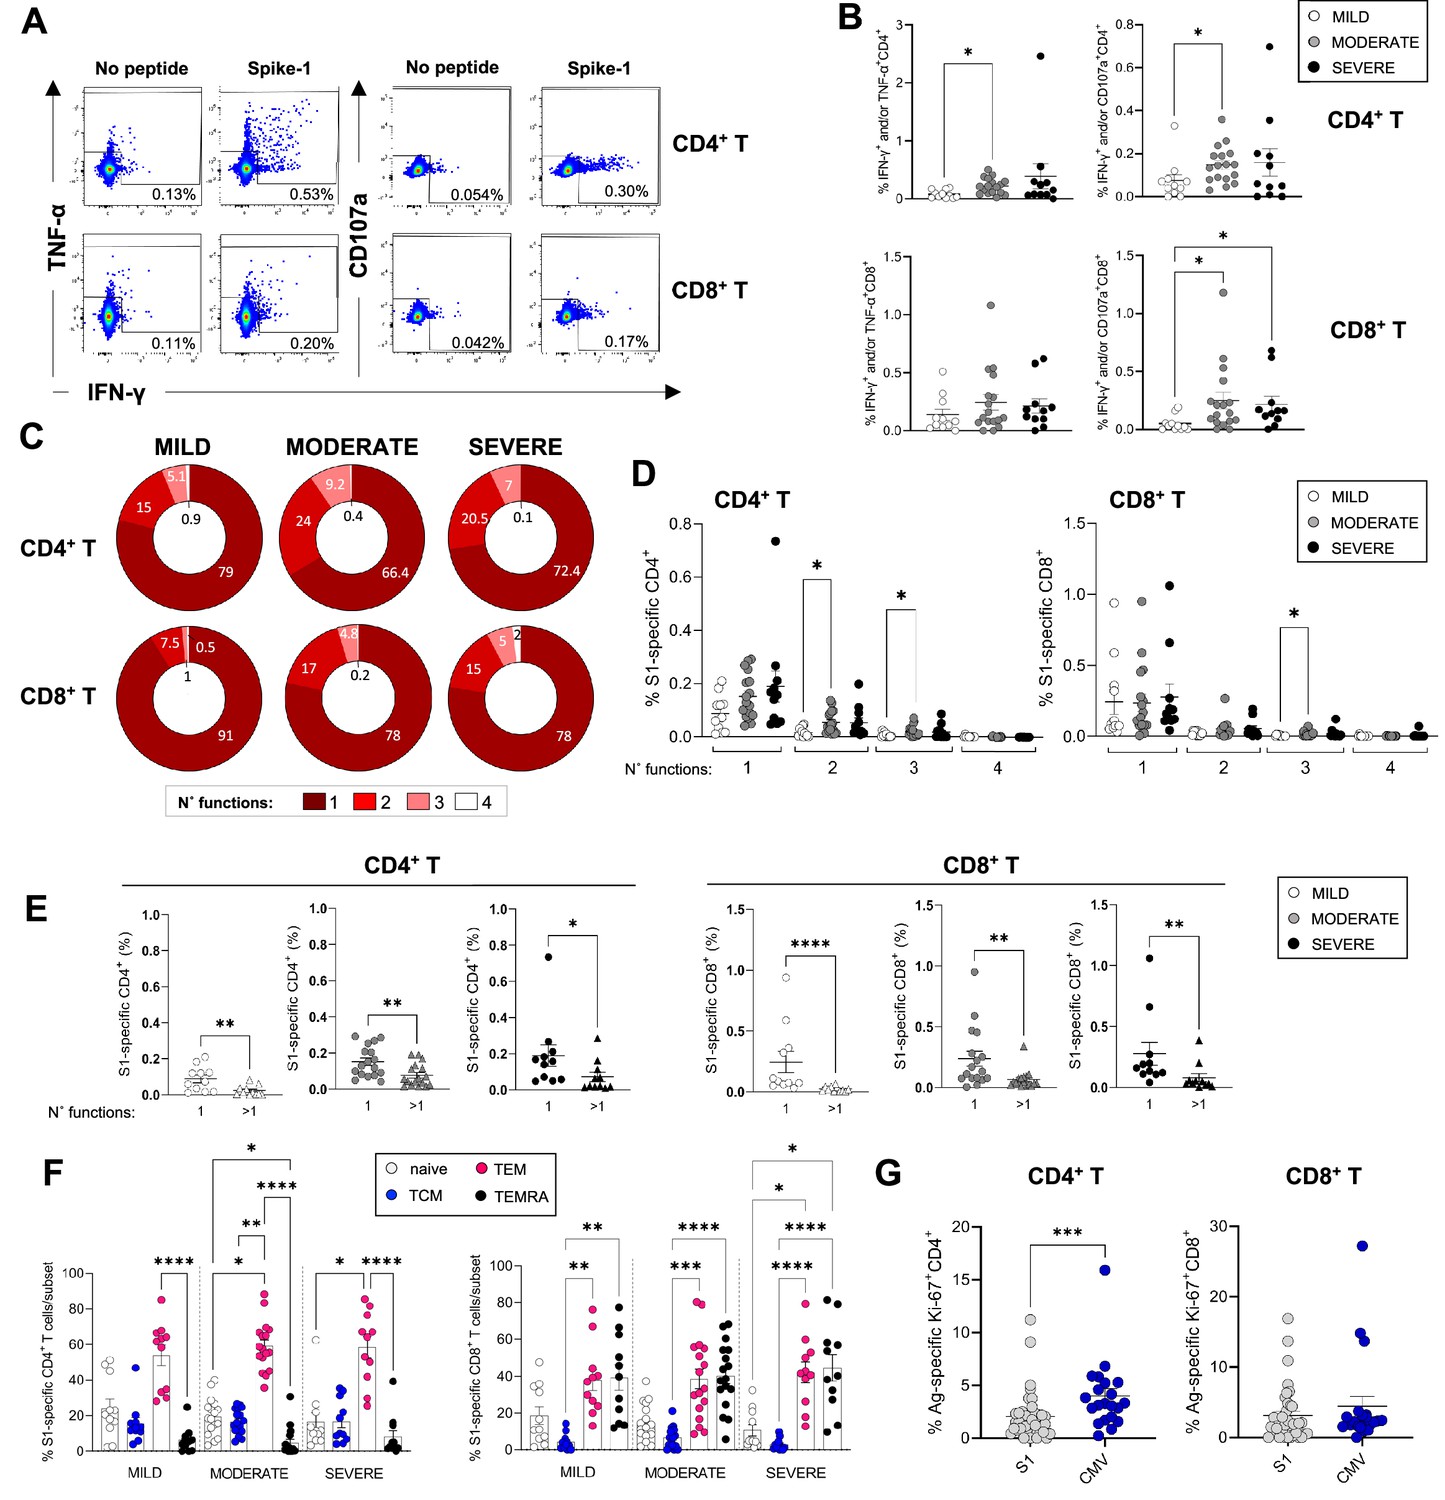
Magnitude and cytokine profiles of severe acute respiratory syndrome coronavirus 2 (SARS-CoV-2)-specific CD4+ and CD8+ T-cells at 3 months.
CD4+ and CD8+ T-cell responses targeting spike peptides were assessed by intracellular cytokine staining (ICS) in mild (N=11), moderate (N=17), and severe (N=11) patients. (A, B) Shown are representative flow cytometry plots of interferon gamma (IFN-γ) and tumor necrosis factor-alpha (TNF-α) or CD107a production by CD4+ and CD8+ T-cells (A) and the percentages of CD4+ (top panel) and CD8+ T (bottom panel) cells producing IFN-γ and/or TNF-α and IFN-γ and/or CD107a in the presence of spike-1 peptides (B). (C) Pie charts summarising the multifunctionality of T-cells specific for spike-1, defined as their capacity to produce 1, 2, 3, or 4 cytokines/CD107a (no. functions). (D) Spike-1 (S1) specific CD4+ (left panel) and CD8+ T-cells (right panel) that express 1–4 functions in mild, moderate, and severe patients. (E) Monofunctionality and polyfunctionality (>1 function) of CD4+ and CD8+ T-cells targeting spike-1 peptides in mild, moderate, and severe patients. (F) Expression of differentiation markers CD45RA/CCR7 by spike-1specific CD4+ and CD8+ T-cells in mild, moderate, and severe patients. Naïve cells = CCR7+CD45RA+ (white); T central memory cells (TCM)=CCR7+ CD45RA- (blue); T effector memory cells (TEM)=CCR7+ CD45RA- (red); T effector memory RA re-expressing cells (TEMRA)=CCR7+ CD45RA- (black). Data not significantly different between patient groups. (G) Percentage of spike-1-specific or CMV-specific CD4+ (left panel) and CD8+ T (right panel) cells that express Ki67. Data in A–B, D–G are visualised as mean ± SEM. Statistics were calculated by one-way ANOVA (Kruskal-Wallis test) with Dunn’s correction for multiple testing or by Mann-Whitney t-test.
Figure 6
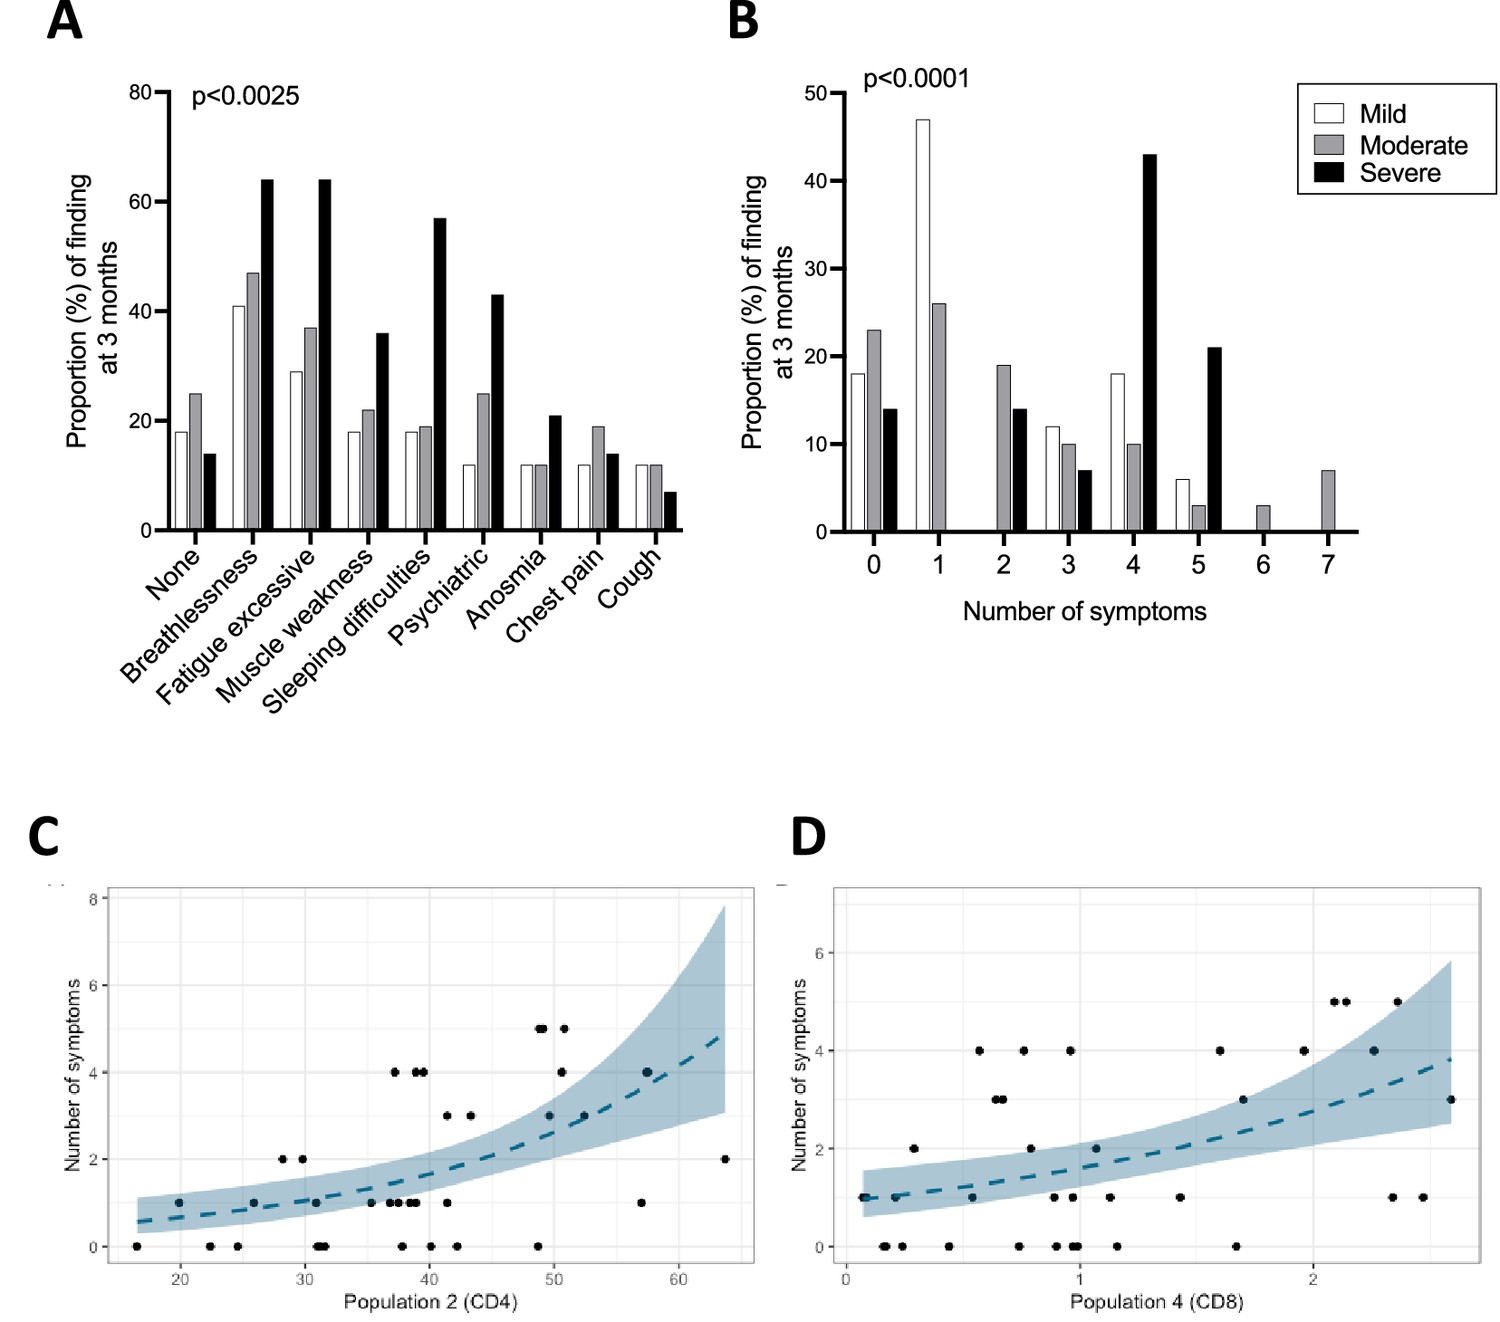
Ongoing symptoms at 3 months and associations with immune profiles.
(A, B) The percentage of patients with mild (N=17), moderate (N=32), and severe (N=14) coronavirus disease-19 (COVID-19) who reported the indicated symptom (A) or number of symptoms (B) at 3 months are indicated with white, grey, and black bars, respectively. Statistics were calculated using a Chi-square test. (C, D) Graphs depicting the association between number of symptoms and uniform manifold approximation and projection (UMAP) T-cells clusters in Poisson models, specifically CD4+ T-cell cluster 2 (C) and CD8+ T-cell cluster 4 (D).
-
Figure 6—source data 1
Associations between immune parameters and symptoms, physical component summary (PCS) or mental component summary (MCS) scores at 3 months in either unadjusted (A) or adjusted (B) Poisson regression models.
p-Values are shown with or without FDR correction (fdr_p or p values, respectively) for both adjusted and unadjusted models. Highlighted in grey are the two immune parameters that significantly correlated with symptoms after FDR correction. Only parameters with FDR uncorrected p-values <0.05 are included in the tables.
- https://cdn.elifesciences.org/articles/85009/elife-85009-fig6-data1-v2.docx
Tables
Table 1
Details of the patients included in the immunological analysis of this study.
| Disease severity (n) | Mild | Moderate | Severe | |
|---|---|---|---|---|
| (n=17) | (n=32) | (n=14) | ||
| Age (median, SD) | 53±14.5 | 58±12.6 | 61.5±10 | |
| Sex, % (n) | Female | 35.3 (6) | 31.2 (10) | 50 (7) |
| Male | 64.7 (11) | 68.5 (22) | 50 (7) | |
| Ethnicity, % (n) | Caucasian | 83.3% (14) | 78.1% (25) | 87.7% (12) |
| Asian | 11.7% (2) | 12.5% (4) | 14.3% (2) | |
| Black | 5.9% (1) | 6.3% (2) | 0 (0) | |
| Missing data | 0 (0) | 3.1% (1) | 0 (0) | |
| BMI, kg/m2, % (average, SD) | Healthy | 7.6% (22.3±0.57) | 12.5% (23.75±0.5) | 14.3% (23±0) |
| Overweight | 35.3% (26.6±1.5) | 28.1% (27±1.39) | 28.6% (28.75±0.5) | |
| Obese | 35.3% (32.8±1.47) | 46.9% (32.7±2.46) | 28.6% (35±2.1) | |
| Extremely obese | 11.8% (61±28.2) | 9.38% (46.3±6.02) | 28.6% (46±7.34) | |
| Missing data | 0 | 3.1% | 0 | |
| Comorbidity % (n) | None | 47.1% (8) | 43.75% (14) | 14.3% (2) |
| Heart disease | 23.5% (4) | 15.6% (5) | 14.3% (2) | |
| T1DM | 0 (0) | 3.1% (1) | 7.14% (1) | |
| T2DM | 5.88% (1) | 12.5% (4) | 14.3% (2) | |
| Hypertension | 17.65 (3) | 18.75% (6) | 50% (7) | |
| Chronic lung disease | 5.88% (1) | 21.88% (7) | 50% (7) | |
| Kidney disease | 5.88 (1) | 9.37% (3) | 14.3% (2) | |
| Mental health | 0 (0) | 6.25% (2) | 14.3% (2) | |
| Cancer | 5.88% (1) | 3.1% (1) | 7.14 (1) | |
| Asthma | 5.88% (1) | 0 (0) | 14.3% (2) | |
| Total obesity | 47.1% (8) | 53.1% (17) | 57.1% (8) | |
| Other | 47.1% (8) | 28.1% (9) | 50% (7) | |
| Hospital stay (average days, SD) | 3.3±1.99 | 7.8±5.16 | 12±6.67 | |
| Ongoing symptoms at 3 months (n, %) | None | 3 (17.65%) | 8 (25%) | 2 (14.3%) |
| Dyspnoea | 7 (41.2%) | 15 (47%) | 9 (64.3%) | |
| Excessive fatigue | 5 (29.4%) | 12 (37.5%) | 9 (64.3%) | |
| Muscle weakness | 3 (17.65) | 7 (22%) | 5 (35.7%) | |
| Sleeping difficulties | 3 (17.65) | 6 (18.75%) | 8 (57%) | |
| Psychiatric | 2 (11.8%) | 8 (25%) | 6 (42.9%) | |
| Anosmia | 2 (11.8%) | 4 (12.5%) | 3 (21.4%) | |
| Chest pain | 2 (11.8%) | 6 (18.75%) | 2 (14.3%) | |
| Cough | 2 (11.8%) | 4 (12.5%) | 1 (7.14%) | |
| Other | 5 (29.4%) | 4 (12.5%) | 3 (21.4%) | |
Key resources table
| Reagent type (species) or resource | Designation | Source or reference | Identifiers | Additional information |
|---|---|---|---|---|
| Antibody | Mouse monoclonal anti-human CD4 (RPA-T4) | Biolegend | Cat# 300535 | FC (0.625:50) |
| Antibody | Mouse monoclonal anti-human HLA-DR (L243) | Biolegend | Cat# 307640 | FC (2.5:50) |
| Antibody | Mouse monoclonal anti-human CD38 (HIT2) | Biolegend | Cat# 303528 | FC (2.5:50) |
| Antibody | Mouse monoclonal anti-human Ki-67 (Ki-67) | Biolegend | Cat# 350505 | FC (3:50) |
| Antibody | Mouse monoclonal anti-human CD16 (3G8) | Biolegend | Cat# 302007 | FC (2.5:50) |
| Antibody | Mouse monoclonal anti-human CD8 (SK1) | Biolegend | Cat# 344713 | FC (3:50) |
| Antibody | Mouse monoclonal anti-human CD56 (NCAM16.2) | BD Biosciences | Cat# 564849 | FC (0.5:50) |
| Antibody | Mouse monoclonal anti-human CD3 (UCHT1) | BD Biosciences | Cat# 557943 | FC (1:50) |
| Antibody | Mouse monoclonal anti-human IFN-γ (B27) | BD Biosciences | Cat# 560371 | FC (3:50) |
| Antibody | Mouse monoclonal anti-human CD3 (UCHT1) | BD Biosciences | Cat# 560835 | FC (2:50) |
| Antibody | Mouse monoclonal anti-human CD107a (H4A3) | Biolegend | Cat# 328610 | FC (0.75:50) |
| Antibody | Mouse monoclonal anti-human TNF-α (MAb11) | Biolegend | Cat# 502946 | FC (3:50) |
| Antibody | Mouse monoclonal anti-human CD163 (GHI/61) | Biolegend | Cat# 333631 | FC (2.5:50) |
| Antibody | Mouse monoclonal anti-human CD14 (M5E2) | Biolegend | Cat# 301833 | FC (2.5:50) |
| Antibody | Mouse monoclonal anti-human CD68 (Y1/82A) | Biolegend | Cat# 333811 | FC (5:50) |
| Antibody | Mouse monoclonal anti-human CD66b (G10F5) | Biolegend | Cat# 305122 | FC (5:50) |
| Antibody | Mouse monoclonal anti-human TCR γ/δ (B1) | Biolegend | Cat# 331209 | FC (2.5:50) |
| Antibody | Mouse monoclonal anti-human CD16 (3G8) | Biolegend | Cat# 302017 | FC (0.5:50) |
| Antibody | Mouse monoclonal anti-human CD80 (2D10) | Biolegend | Cat# 305219 | FC (2.5:50) |
| Antibody | Mouse monoclonal anti-human CD69 (FN50) | Biolegend | Cat# 310931 | FC (5:50) |
| Antibody | Mouse monoclonal anti-human CXCR3 (G025H7) | Biolegend | Cat# 353714 | FC (1:50) |
| Antibody | Mouse monoclonal anti-human CD45RA (HI100) | BD Biosciences | Cat# 561882 | FC (10:50) |
| Antibody | Mouse monoclonal anti-human CCR7 (G043H7) | Biolegend | Cat# 353226 | FC (2.5:50) |
| Antibody | Mouse anti-human CD19 (HIB19) | Biolegend | Cat# 302216 | FC (1:50) |
| Antibody | Rat anti-human IL-2 (MQ1-17H12) | Biolegend | Cat# 500322 | FC (2:50) |
| Antibody | Mouse anti-human CD8a (RPA-T8) | Biolegend | Cat# 301014 | FC (0.3:50) |
| Antibody | Mouse anti-human IL-15Rα (JM7A4) | Biolegend | Cat# 330207 | FC (2.5:50) |
| Antibody | Mouse monoclonal anti-human PD1 (EH12.1) | BD Biosciences | Cat# 612791 | FC (3:50) |
| Antibody | Mouse recombinant anti-human Granzyme B (QA16A02) | Biolegend | Cat# 372219 | FC (2.5:50) |
| Biological sample (human) | Peripheral blood mononuclear cells (PBMCs) | DISCOVER study, Bristol, UK | Frozen - isolated PBMCs | |
| Biological sample (human) | Plasma | DISCOVER study, Bristol, UK | Frozen plasma | |
| Peptide, recombinant protein | SARS-CoV-2 spike protein overlapping peptide library (custom made) | Mimotopes | N/A | |
| Peptide, recombinant protein | SARS-CoV-2 membrane protein overlapping peptide library (custom made) | Mimotopes | N/A | |
| Peptide, recombinant protein | SARS-CoV-2 nucleocapsid protein overlapping peptide library (custom made) | Mimotopes | N/A | |
| Peptide, recombinant protein | CMV pp65 protein (AD169 strain) overlapping peptide library (custom made) | Mimotopes | N/A | |
| Other | Spike-RBD Antibody Bridging LIPS assay | DOI: 10.3389/fimmu.2022.968317 | N/A | |
| Peptide, recombinant protein | Nano-Glo | Promega | Cat# N1150 | |
| Commercial assay or kit | Human IFN-γ ELISpot BASIC kit | Mabtech | Cat# 34202A | |
| Commercial assay or kit | ProcartaPlex Mix&\Match 23-plex | Invitrogen | Cat# PPX-23-MXWCXFA | |
| Commercial assay or kit | Pan T Cell Isolation Kit, human | Miltenyi Biotec | Cat# 130-096-535 | |
| Commercial assay or kit | CellTrace Violet Cell Proliferation Kit, for flow cytometry | Thermo Fisher Scientific | Cat# C34557 | |
| Commercial assay or kit | eBioscience Foxp3/Transcription factor fixation/permeabilisation buffer | Invitrogen | Cat# 00-5523-00 | |
| Commercial assay or kit | Zombie Aqua Fixable Viability Kit | Biolegend | Cat# 423102 | FC (1:1000) |
| Commercial assay or kit | Zombie NIR Fixable Viability Kit | Biolegend | Cat# 423105 | FC (1:100) |
| Commercial assay or kit | Dynabeads Human T-Activator CD3/CD28 | Thermo Fisher Scientific | Cat# 11131D | |
| Commercial assay or kit | OneComp eBeads Compensation Beads | Thermo Fisher Scientific | Cat# 01-1111-42 | |
| Commercial assay or kit | Human TruStain FcX | Biolegend | Cat# 422302 | FC (2.5:50) |
| Commercial assay or kit | Human Anti-Cytomegalovirus IgG ELISA Kit (CMV) | Abcam | Cat# ab108724 | |
| Software | FlowJo | BD | v10.8.1 | |
| Software | R | R Foundation for Statistical Computing | v4.0.4 | |
| Software | GraphPad Prism | GraphPad Software | v9.4 | |
| Software, algorithm | xPONENT | Software for Luminex Instruments | The basic xPONENT software | |
| Software, algorithm | BioSpot Software Suite | ImmunoSpot S6 Ultra-V Analyzer |
Additional files
Download links
A two-part list of links to download the article, or parts of the article, in various formats.
Downloads (link to download the article as PDF)
Open citations (links to open the citations from this article in various online reference manager services)
Cite this article (links to download the citations from this article in formats compatible with various reference manager tools)
Prolonged T-cell activation and long COVID symptoms independently associate with severe COVID-19 at 3 months
eLife 12:e85009.
https://doi.org/10.7554/eLife.85009


