Epigenetically distinct synaptic architecture in clonal compartments in the teleostean dorsal pallium
- Department of Molecular and Cellular Biology, Faculty of Arts and Sciences, Harvard University, United States
- Department of Biological Sciences, Graduate School of Science, The University of Tokyo, Japan
- Graduate School of Natural Science and Technology, Okayama University, Japan
- Department of Basic Biology, Graduate School for Advanced Studies, Japan
- Spatiotemporal Regulations Group, Exploratory Research Center for Life and Living Systems, Japan
- Laboratory for Spatiotemporal Regulations, National Institute for Basic Biology, Japan
- Trans-Scale Biology Center, National Institute for Basic Biology, Japan
- Institute for Quantitative Biosciences (IQB), The University of Tokyo, Japan
- Department of Animal Sciences, Graduate School of Bioagricultural Sciences, Nagoya University, Japan
- Department of Integrative Life Sciences, Graduate School of Life Sciences, Tohoku University, Japan
- Kyoto Sangyo University, Faculty of Life Sciences, Kamigamo Motoyama, Japan
Figures
Figure 1 with 4 supplements
Clonal architecture in the adult medaka telencephalon.
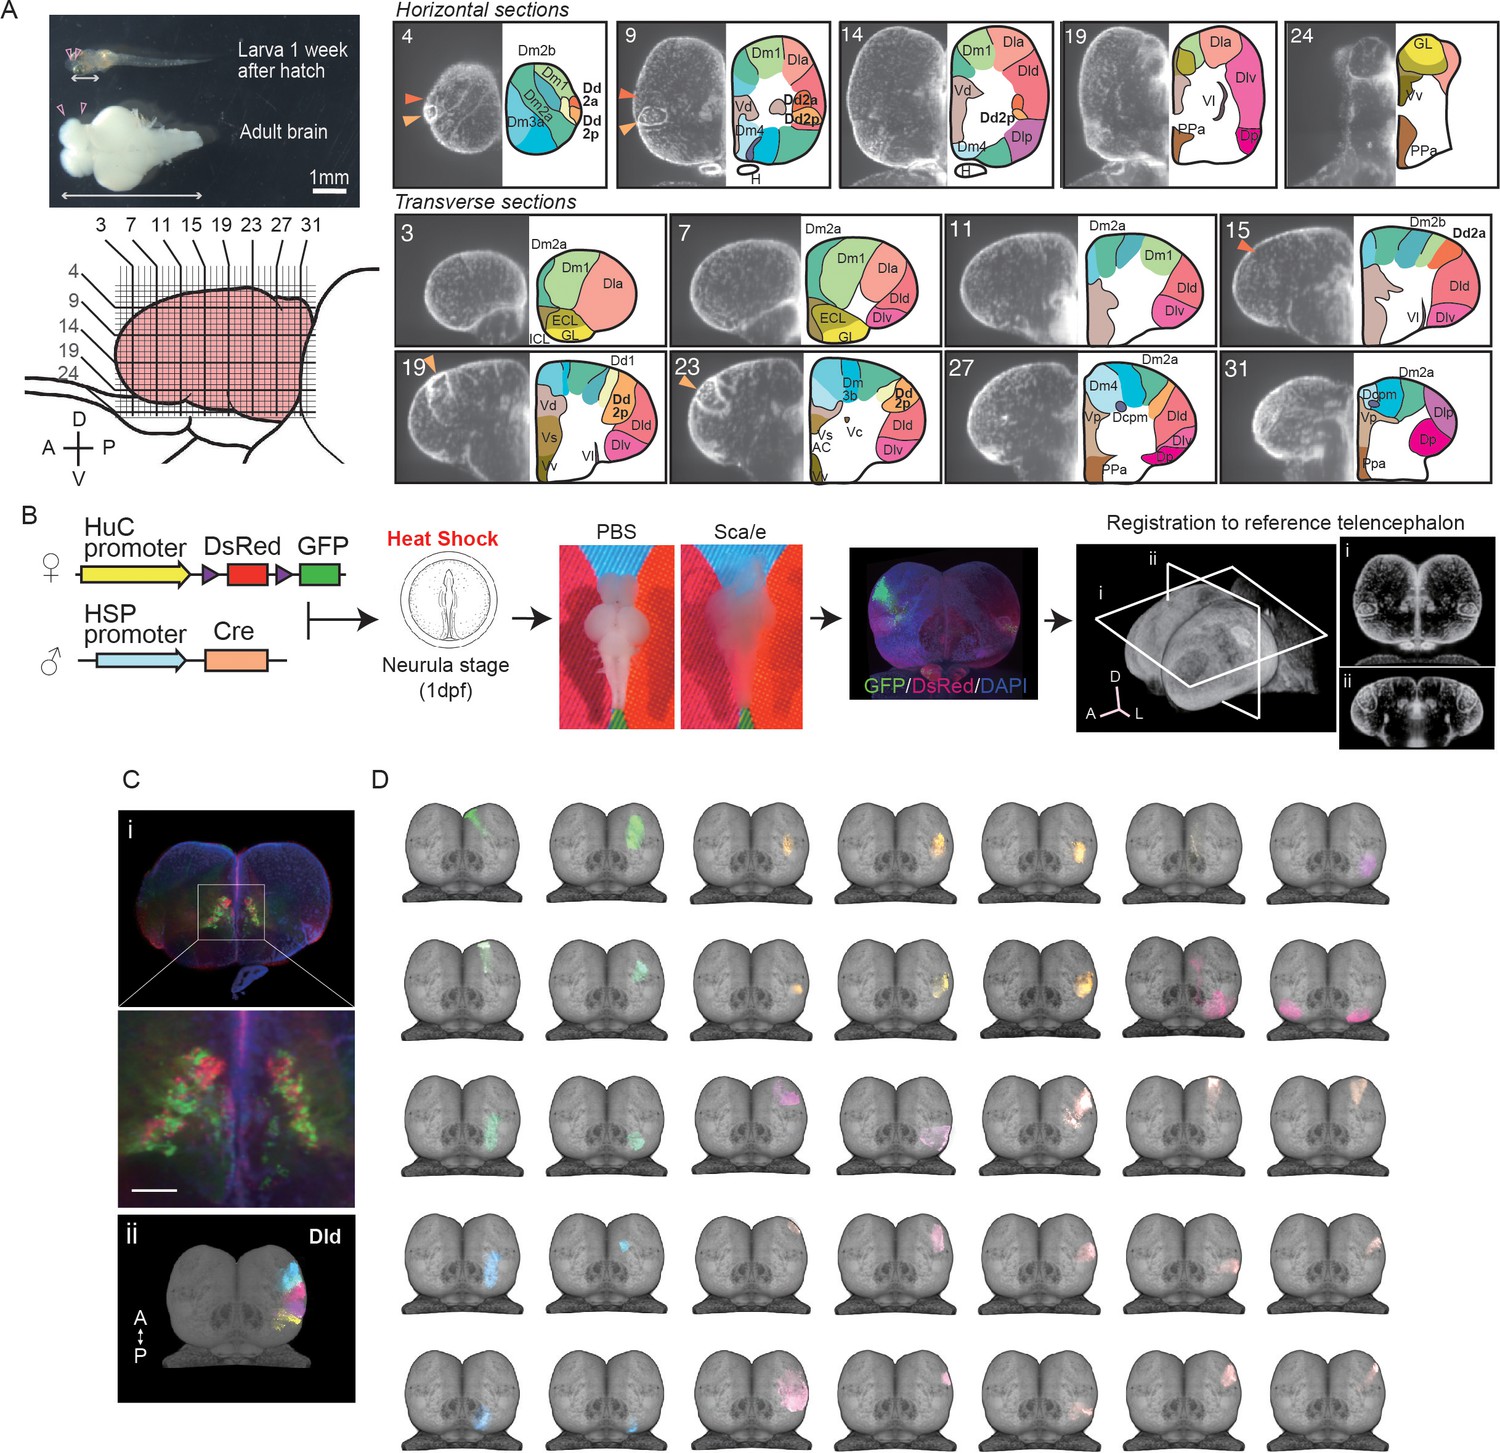
(A) A larval medaka fish (1 week day post fertilization) and a dissected adult brain (top left). Pink triangles indicate the position of the telencephalon in the larval and adult brain. The white two-way arrows indicate the length of the whole larval brain. Scale bar: 1 mm. Schematic drawing of the lateral view of the adult telencephalon (pink, bottom left). Horizontal and vertical lines indicate the position of optical sections in the brain atlas on the right panel. Redefined anatomical regions of adult medaka telencephalon are shown (right). Optical horizontal sections (top right) and transverse sections (bottom right). Orange triangles indicate the position of the dorsal pallial regions we focus on (dark orange: Dd2a; light orange: Dd2p). For each section, the left picture shows DAPI signals and the right shows the brain atlas. (B) Experimental procedure to label cell lineages. Cre-loxp recombination was induced by a short heat shock at the neurula stage of transgenic embryos (Tg (HuC:loxp-DsRed-loxp-GFP) × Tg(HSP:Cre)). Dissected brains were stained with DAPI, cleared in Scale solution, and light-sheet microscopy images were taken. Fluorescent signals were registered to a reference telencephalon. Optical horizontal and transverse sections are shown (i, ii). A: anterior direction; D: dorsal direction; L: lateral direction. (C) Examples of anatomical regions consist of clonally related cells. Multiple cell lineages mix and constitute the subpallial regions, for example, the dorsal medial part of the subpallium (Vd) (an example image from a single fish’s optical section is shown [i]), while the pallium consists of cell lineages in an exclusive mosaic pattern. The clonally related cells in the dorsal part of the lateral pallium (Dld) are shown as an example (ii). A: anterior; P: posterior direction. Scale bar: 100um. (D) Examples of the structure of cell lineages identified in the telencephalon. Dorsal views are shown. Colors of cell lineages indicate the position of cell somas in the anatomical region in (A). Dc: the dorso-central telencephalon; Dcpm: the posterior medial nucleus of the dorso-central telencephalon; Dm: the medial part of the dorsal pallium; Dl: the dorsal lateral pallium; Dla: the anterior part of the dorso-lateral telencephalon; Dld: the dorsal part of the middle and posterior part of the dorso-lateral telencephalon; Dlv: the ventral part of the middle and posterior part of the dorso-lateral telencephalon; Dlp: the posterior regions of the dorso-lateral telencephalon; Dd: the dorso-dorsal telencephalon; Dp: the posterior part of dorsal telencephalon; Vd: the dorsal medial part of the subpallium; Vs: the supracommissural part of ventral telencephalon; Vv: the ventral part of the subpallium; ECL: the external layer of the olfactory bulb; ICL: the internal layer of the olfactory bulb.
Figure 1—figure supplement 1
Details of redefined atlas of the telencephalon.
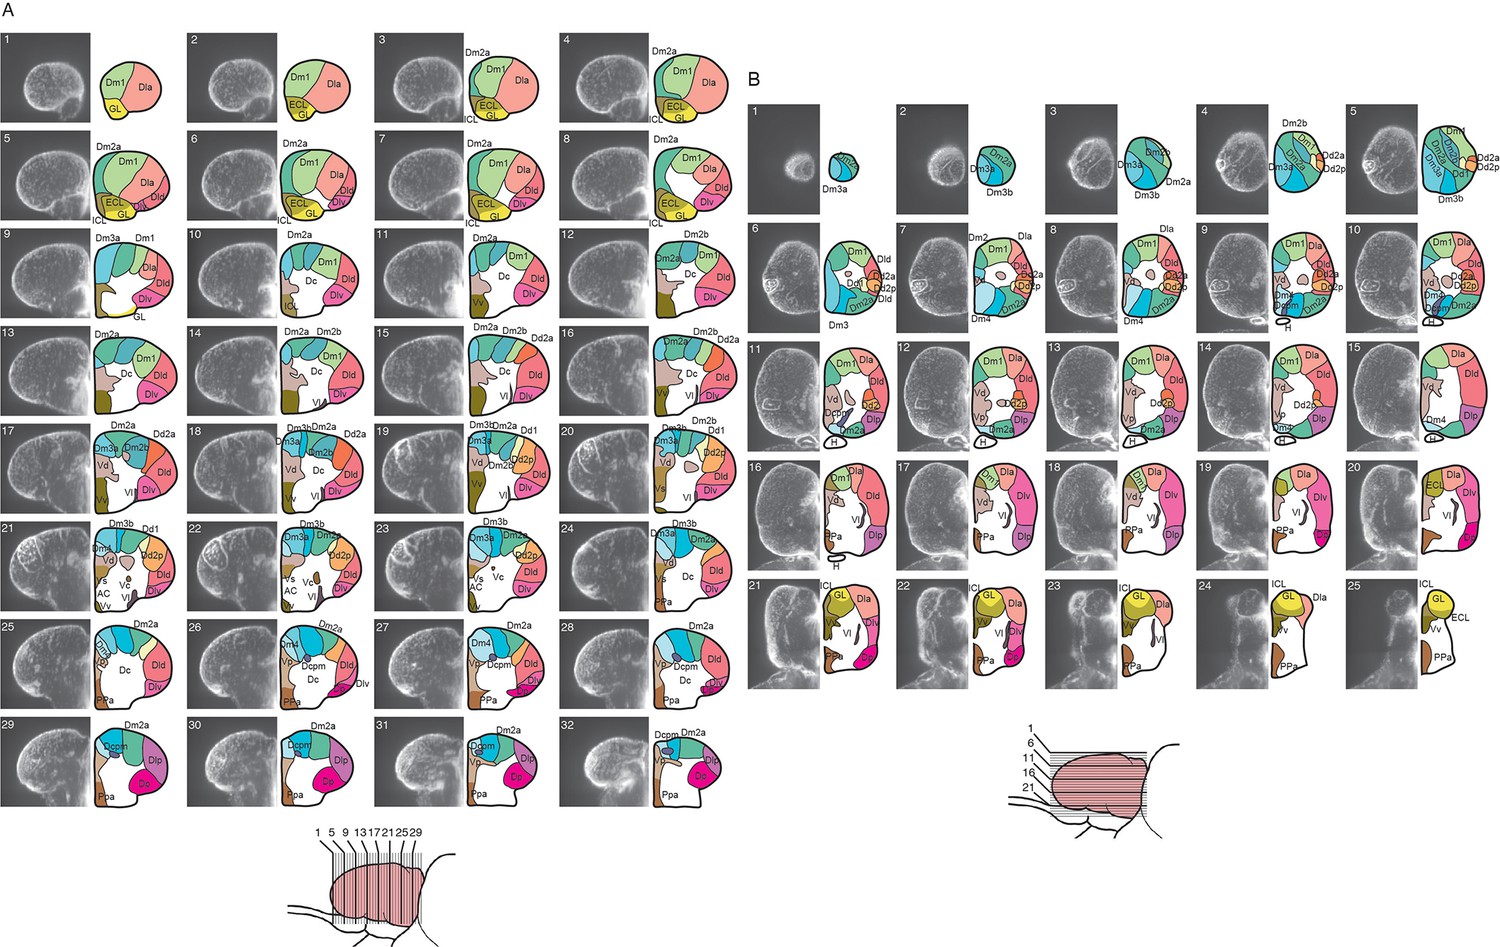
Transverse (A) and horizontal (B) optical sections of the reference telencephalon (left) and redefined brain atlas (right). Lines in the schematic drawing of the lateral view of the telencephalon indicate the locations of the optical sections (bottom).
Figure 1—figure supplement 2
Expression of cell-type marker genes in the adult medaka telencephalon.
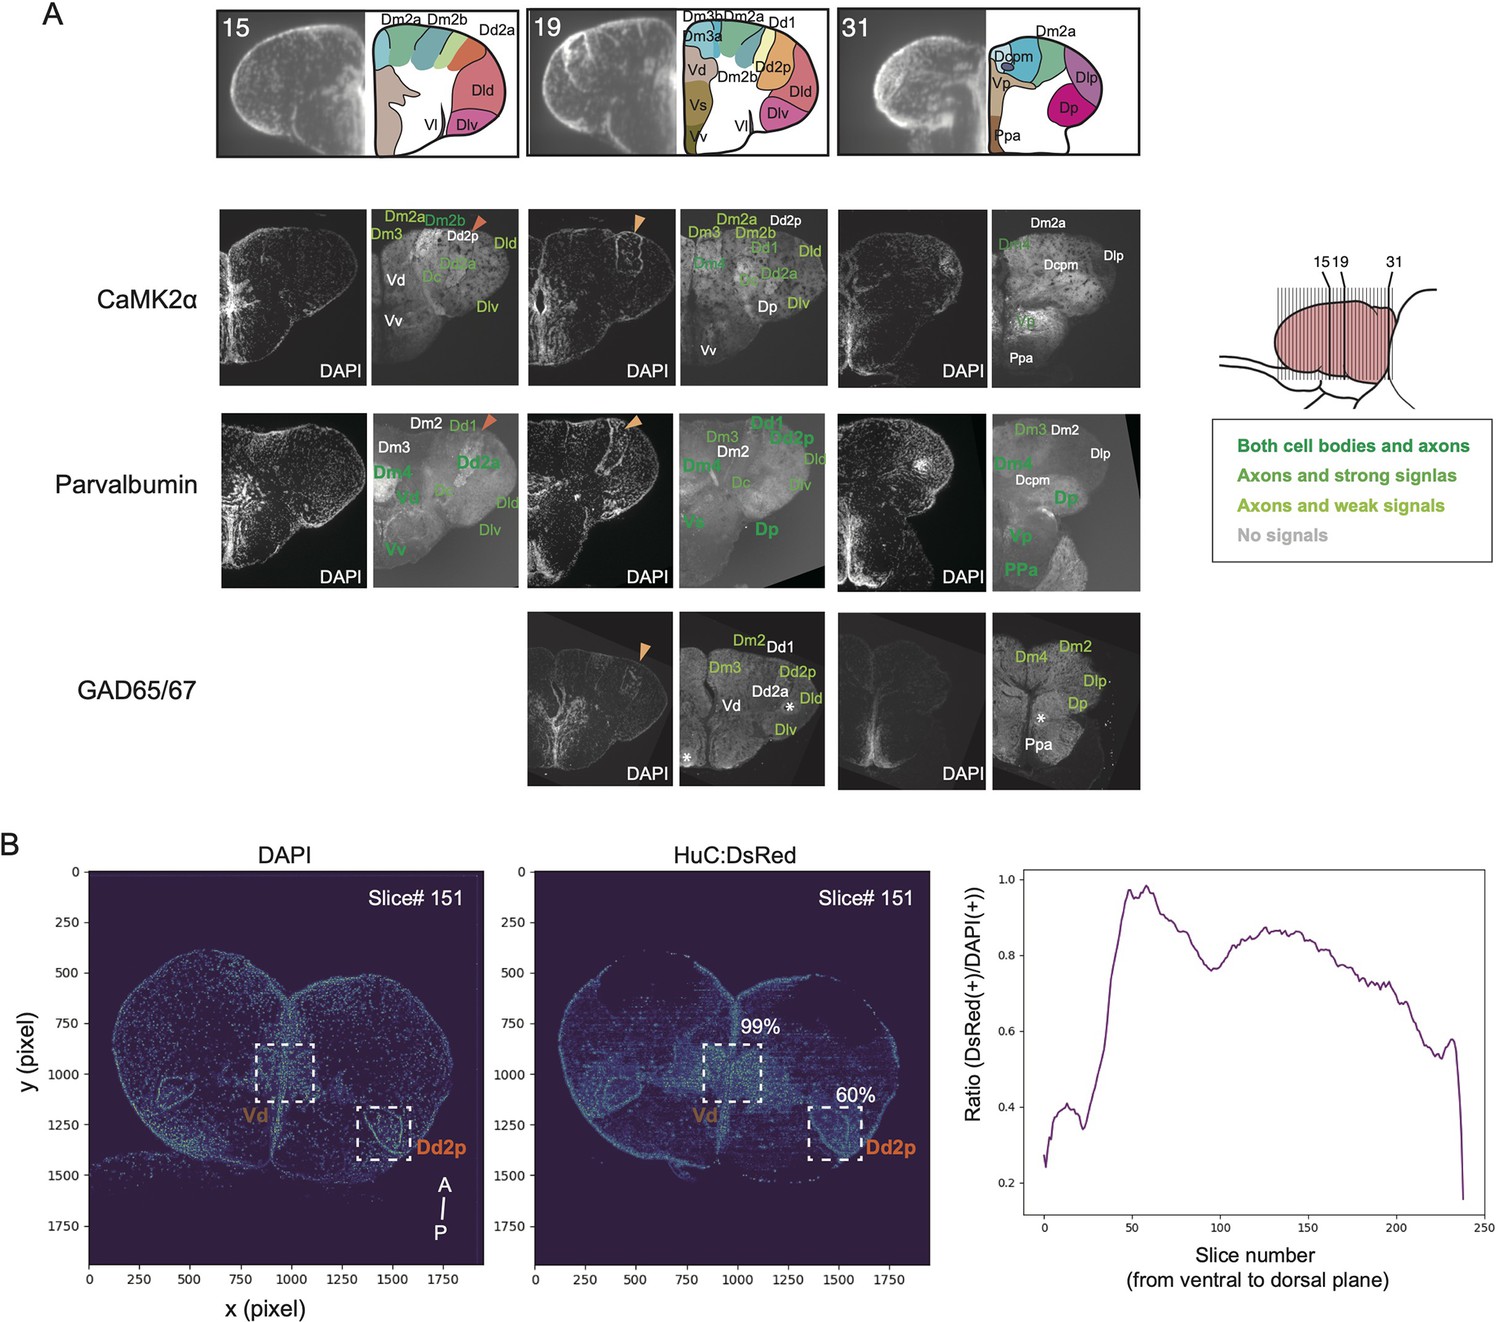
(A) Immunostaining of CaMK2α, Parvalbumin, and GAD65/67 allowed us to define anatomical regions. Numbers in the first row indicate the location of the transverse sections (bottom). Orange triangles indicate the position of Dd2 in medaka (dark orange: Dd2a; light orange:Dd2p). Shades of colors indicate the expression levels of the genes. Asterisk symbols indicate the noise from staining. (B) Cell density analysis on the visualized neurons in the transgenic line we used in the study. After clearing and staining the adult brain, we imaged the brain with the light-sheet microscopy. We counted the number of DAPI-positive cells (left) and the number of DsRed-positive cells (right), then calculated the ratio of DsRed-positive cells (right). Overall, 60–70% of cells were labeled in the telencephalon. The anterior part of the telencephalon that has weak HuC:DsRed signals is the Dla region.
Figure 1—figure supplement 3
Statistics of clonal units.
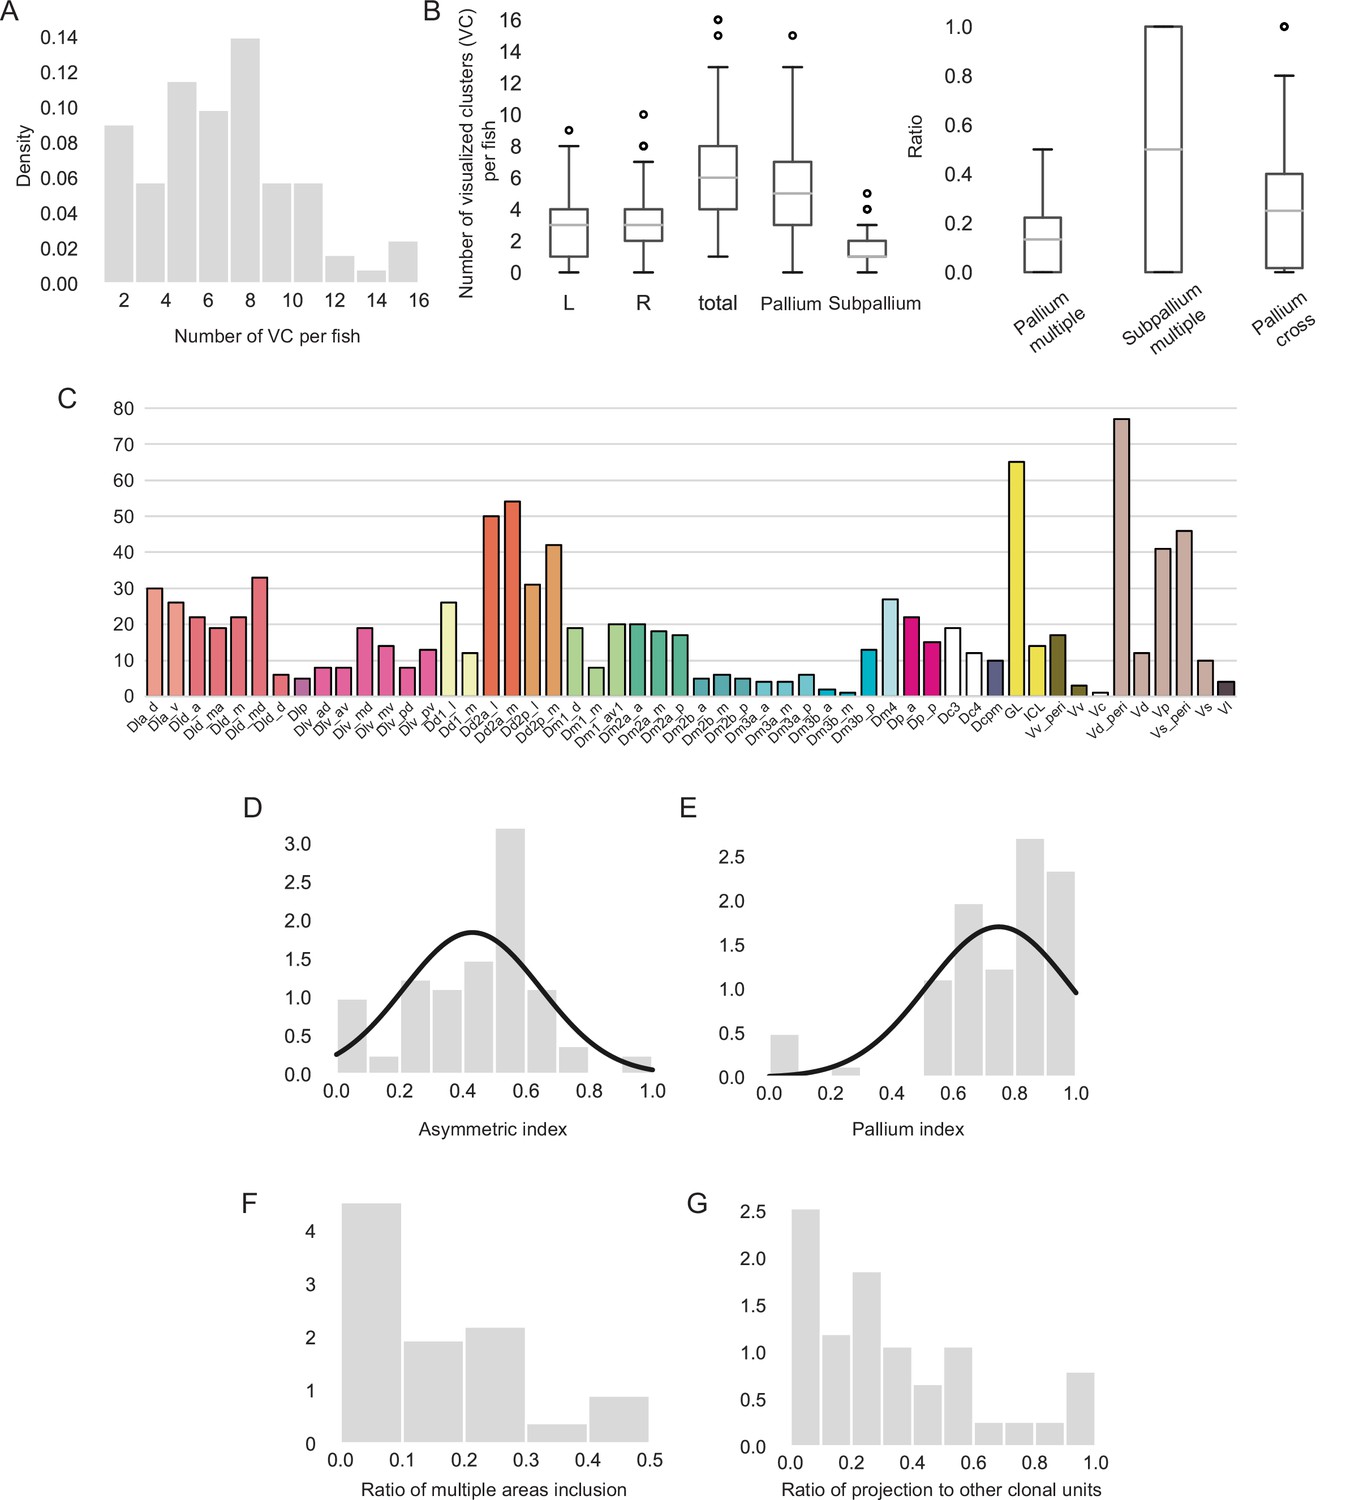
(A) Density plot of total number of visualized clusters (VC) per fish (N = 81 fish). (B) Boxplot showing the statistics of localization of VC. Left boxplot shows the number of VC in the left hemisphere (L), right hemisphere (R), the pallium, the subpallium per fish. Total number of clonal units per fish (total). Right boxplot shows how often VC includes clonal units in the pallium (pallium multiple) or subpallium (subpallium multiple) and how often the dorsal pallium project to other clonal units. (C) Number of clonal units found in each brain anatomical region. We detected 523 GFP-positive neural populations from 81 fish. We found fewer GFP-positive populations in Dm2b and Dm3a. Since we gave a mild heat shock to induce Cre-lox recombination using the thermal cycler, it could be possible that the embryos tend to stay in a certain posture in the PCR tubes so that a few neural stem cells are not likely to get heat shocked, which led to this bias. (D) Distribution of asymmetric index: (number of VC locating in the left hemisphere)/(total number of VC in a fish). (E) Distribution of pallium index: (number of VC locating in the pallium)/(total number of VC in a fish). (F) Histogram of ratio of VC in the pallium that cover multiple clonal units. (G) Distribution of how often VC project to other clonal units.
Figure 1—figure supplement 4

Radial glial projection in the adult medaka telencephalon.
(A) Projections of the radial glial cells in the adult medaka telencephalon visualized by anti-GFAP immunostaining. In the pallium, cell bodies of GFAP-positive neural stem cells locate on the surface of the pallium and project axons vertically (blue-filled triangle: cell bodies; blue-line triangle: axons). Whereas cell bodies of the radial glial in the subpallium locate in the surface between the two hemispheres, the glial projections are short and more complicated than those in the pallium (yellow-filled triangle: cell bodies; yellow-line triangle: axons). Scale bar: 150um. (B) Schematic drawing of how clonal units emerged from the radial glia. Light green filled cells indicate the radial glia. Neural progenitors differentiation from radial glia is indicated by colored arrow. Circles in different colors indicate different cell lineages of neural progenitors. Dark green arrows indicate self-reproduction of neural stem cells. D: the dorsal axis; V: the ventral axis; M: the medial axis; L: the lateral axis.
Figure 2
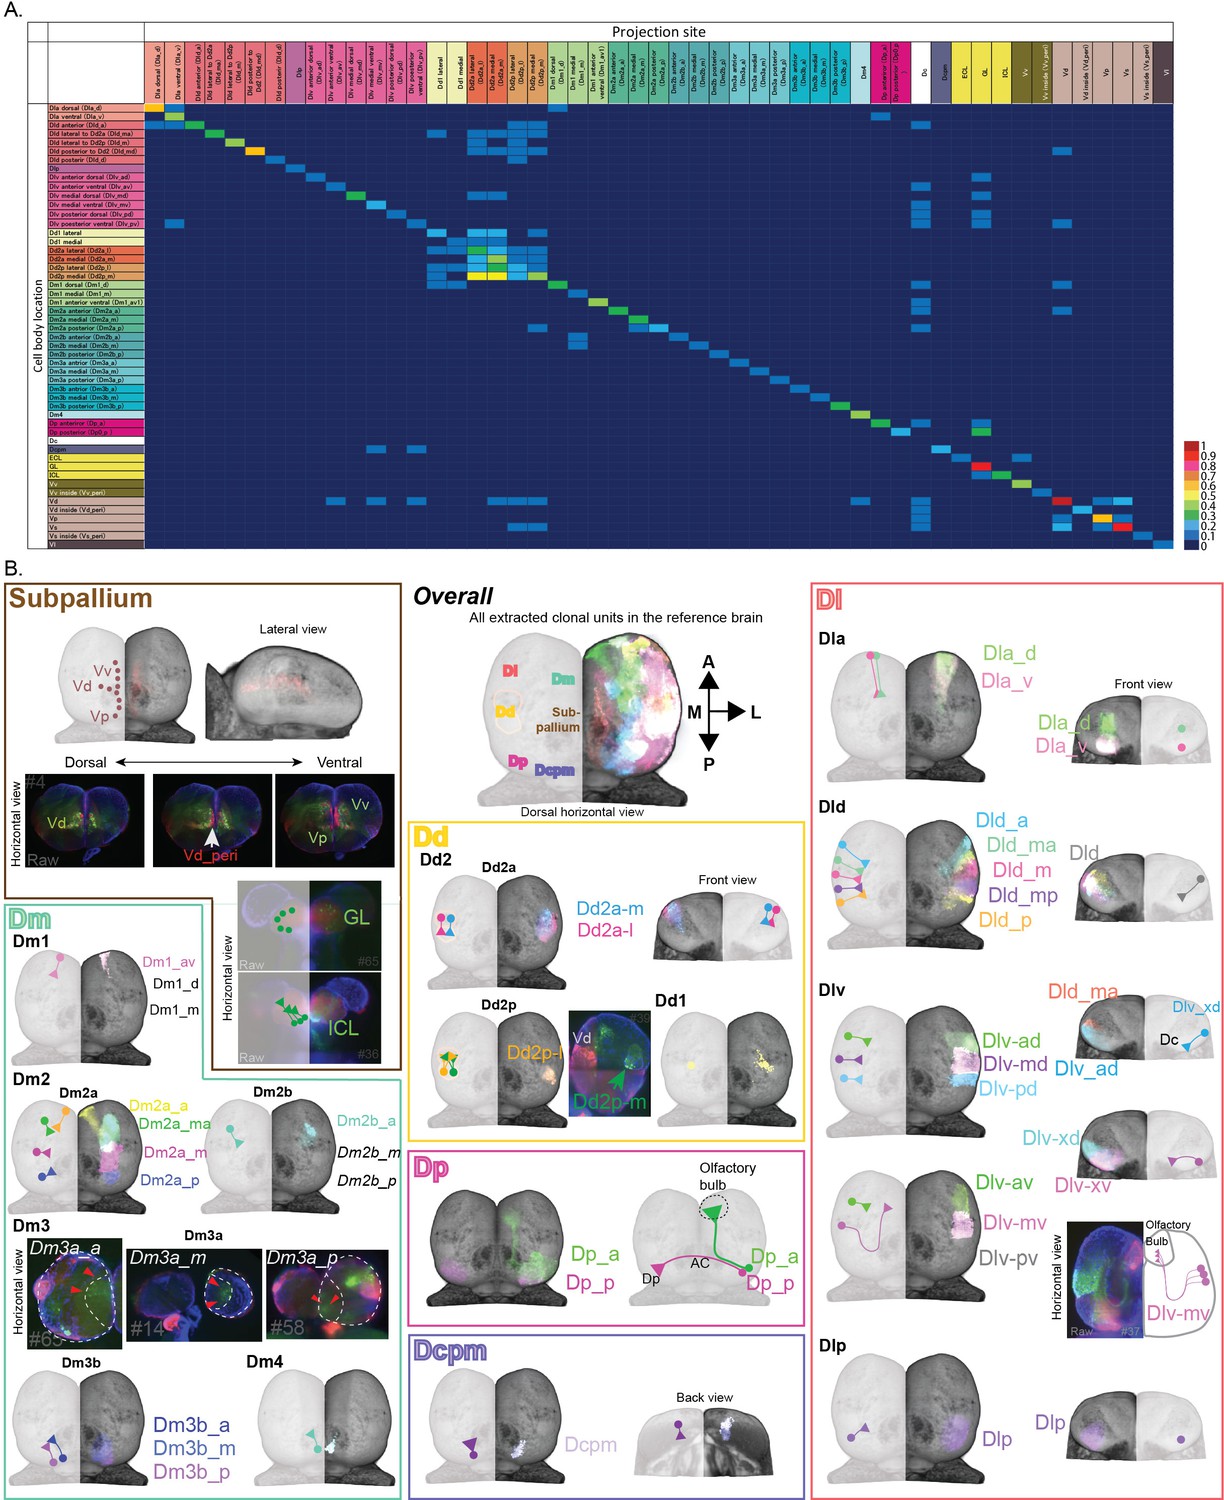
Neuronal projections of clonal units in the telencephalon.
(A) Connectional matrix between clonal units in the telencephalon. The rows indicate the cell body locations and the columns indicate where the projection ends. The number of the projection among 81 fish we analyzed was normalized by the total number of clonal units observed and calculated as the ratio of projection, which is visualized in the color code. (B) The structure of clonal units in the telencephalon. We identified the structure of clonal units by systematic analysis, and here we visualized them in different colors that form a single anatomical region. The color of the outline of panels represents the color code of the anatomical regions, but the colors of each clonal unit inside each region are randomly assigned. In each anatomical brain region, the cell soma location and neural projections of clonal units are indicated by circles and line with a triangle terminal for each. For some clonal units where the registration of brains did not work well, we could not visualize the structure of clonal units in the reference brain. In these cases, we showed raw images of those clonal units.
Figure 3 with 1 supplement
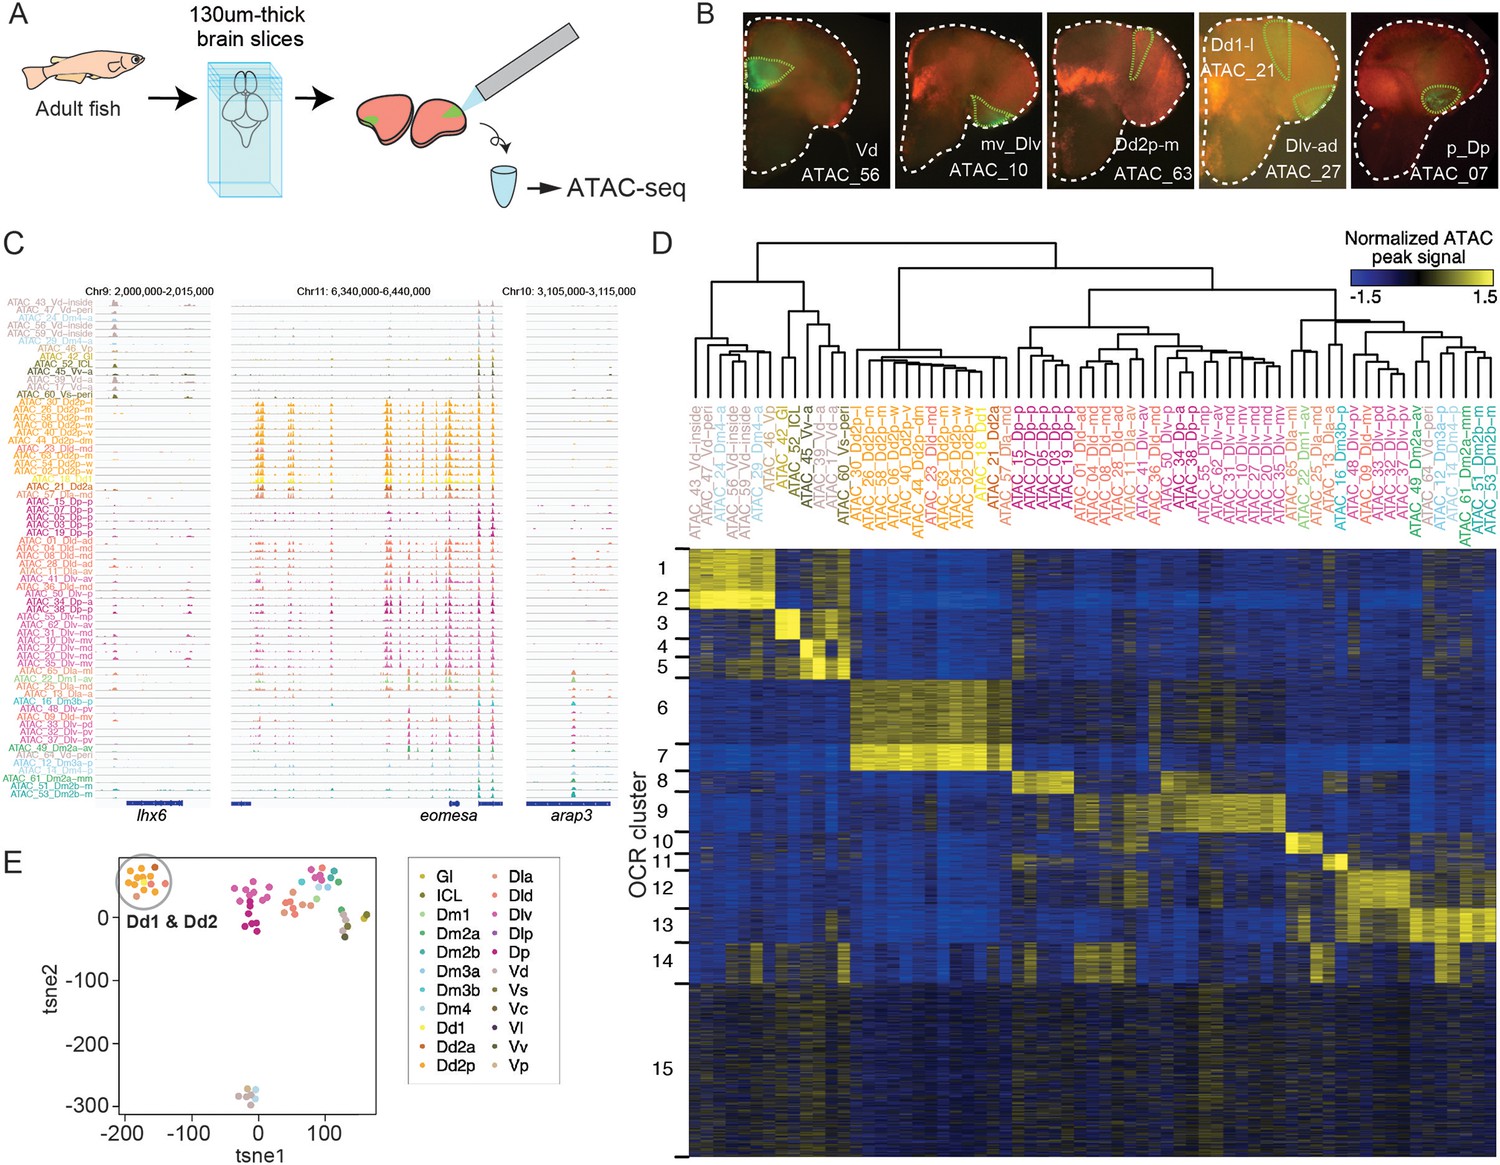
ATAC-seq of clonal units in the adult medaka telencephalon.
(A) Procedure of ATAC-sequencing with extracted clonal units from the adult telencephalon. Cre-loxP recombination was induced at the neurula stage in the transgenic embryos (Tg (HSP-Cre) × Tg (HuC:loxP-DsRed-loxP-GFP)) as previously described. After making 130-um-thick brain slices at the adult stage, GFP-positive cellular subpopulations were dissected and extracted manually. (B) Examples of GFP-positive clonal units in the brain slices. White dotted lines indicate the outline of the brain slices. Green lines indicate the dissected GFP-positive clonal units. The ids of clonal-unit ATAC-seq samples are written next to the GFP-positive clonal units in each picture. (C) Representative track view of ATAC-seq. Colors of clonal units’ names indicate the location in the anatomical regions (Figure 1A) of the extracted clonal units. (D) Hierarchical clustering and k-means clustering of ATAC-seq peaks in clonal units. In the heatmap, blue indicates closed chromatin regions and yellow indicates open chromatin regions (OCR). Colors of clonal units’ names indicate the anatomical regions. (E) Dimensionality reduction analysis (tSNE) of ATAC-seq peak patterns of clonal units. Colors of clonal units’ names indicate the anatomical regions. A gray circle highlights the datapoints of clonal units of Dd1 and Dd2.
Figure 3—figure supplement 1
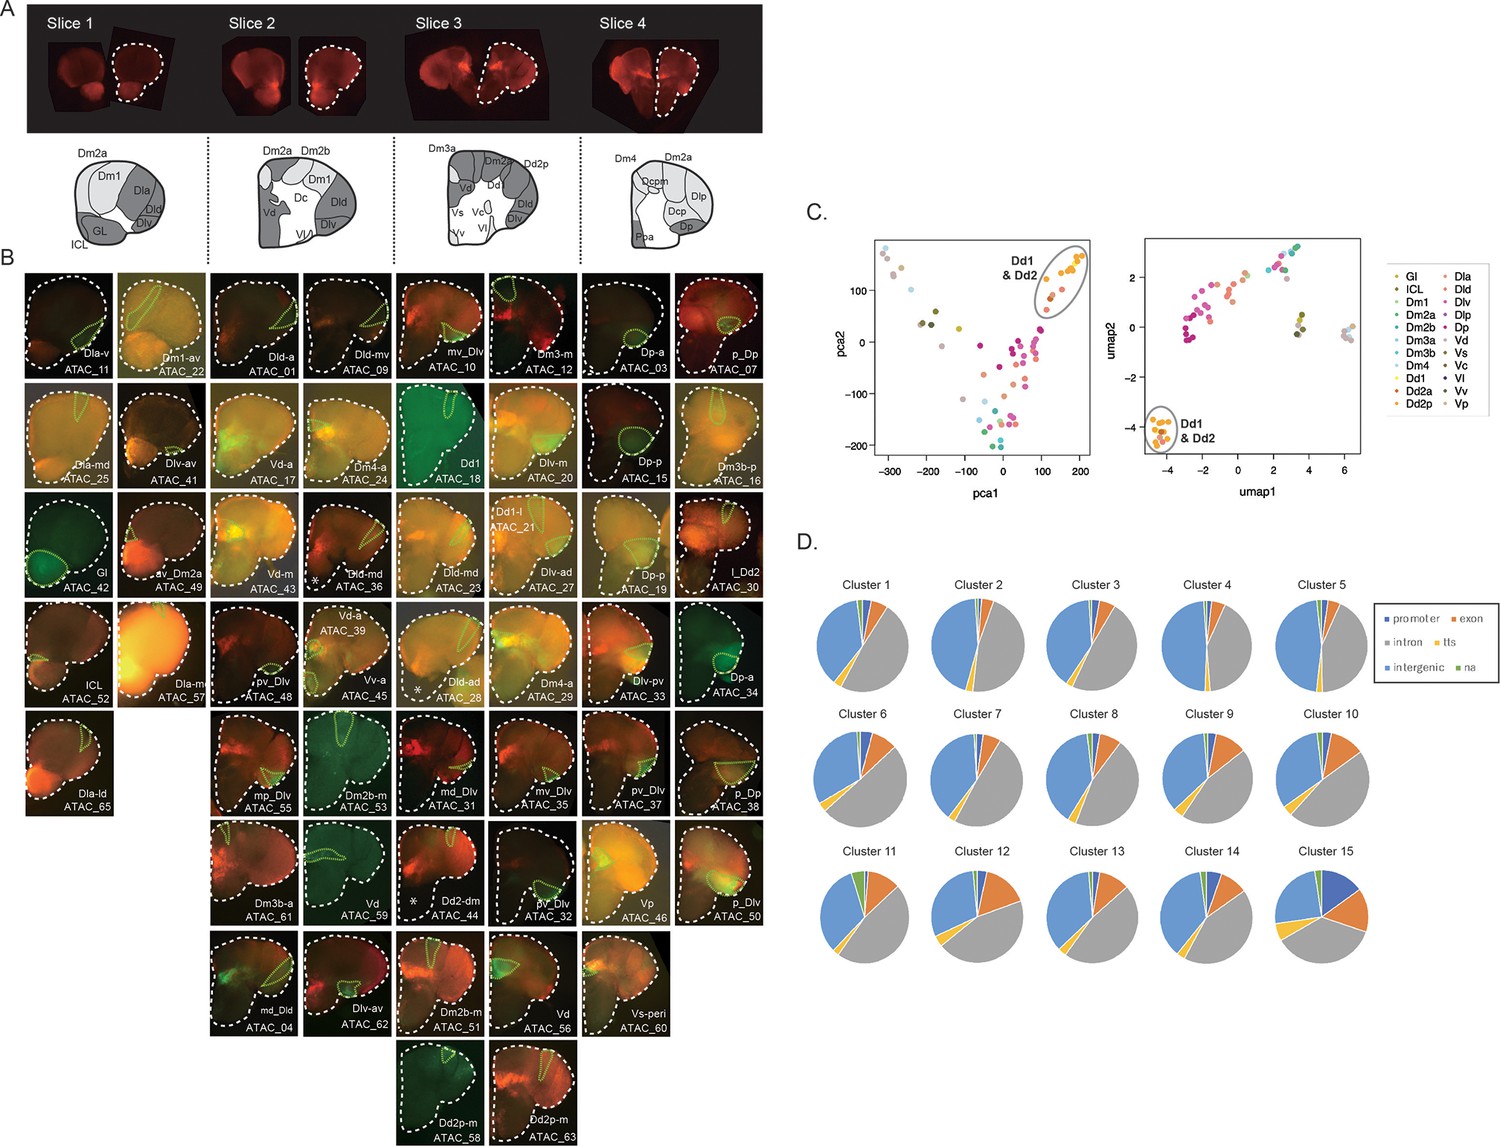
Analysis of ATAC-seq in clonal units.
(A) 130-um-thick brain transverse sections from one adult brain (top). Clonal units used in ATAC-seq are shaded in dark gray in the schematic drawing (bottom). (B) Pictures of extracted GFP-positive clonal units (region surrounded by green dotted line). White dotted line shows the outline of brain slices. (C) Dimensionality reduction analysis of ATAC-seq peak patterns of clonal units using principal component analysis (PCA) (left) and Uniform Manifold Approximation and Projection (UMAP) analysis (right). Color indicates the location of clonal units in the anatomical regions. All dimensionality reduction analyses show that the subpallial clonal units are distinct from the pallial clonal units and that clonal units in Dd2 contain a unique open chromatin structure from other pallial clonal units. Gray circles highlight the clonal units of Dd1 and Dd2. (D) Pie charts show the genomic distribution of the OCR clusters. OCR C15, which was identified as common open peaks among the telencephalon, includes more peaks in promoter regions. Tts stands for transcription termination site.
Figure 4 with 2 supplements
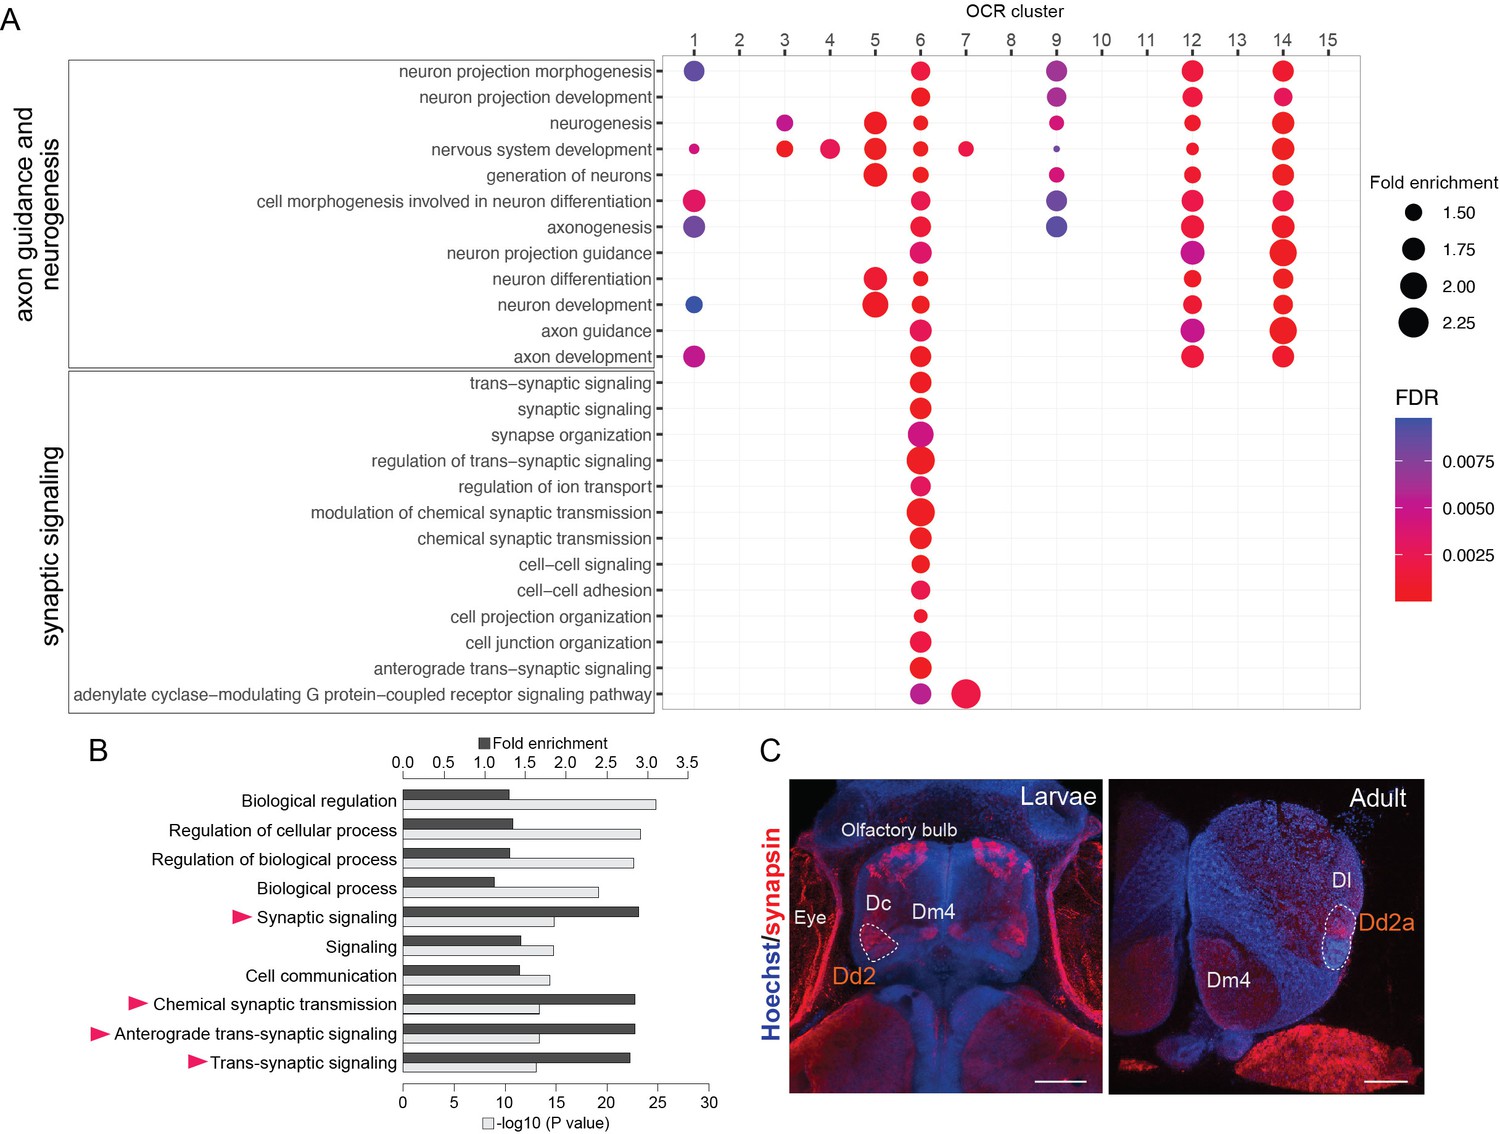
Analyses of Dd2-specific open chromatin region (OCR) clusters reveal specialized synaptic gene transcription.
(A) Gene Ontology (GO) analysis of OCR clusters. GO terms related to axon guidance and neurogenesis (top) and synaptic signaling (bottom) are shown (see also Figure 4—figure supplement 1 for other enriched GO terms). Size and color of circles indicate fold enrichment and false discovery rate (FDR), respectively. Circle was plotted only if FDR is lower than 0.01. GO terms of axon guidance and neurogenesis are enriched with pallial clusters (OCR C9 and 12), Dd2 cluster (OCR C6), subpallial cluster (OCR C1, 3, 4, 5), and a common cluster (OCR C14). On the other hand, synaptic genes are enriched in OCR C6. (B) GO analysis of the genes preferentially expressed in Dd2. Top 10 significantly enriched terms are shown. Black bars indicate the fold enrichment and gray bars show the log p-value. GO terms related to synaptic signaling are highlighted with triangles. (C) Anti-synapsin immunohistochemistry on the medaka larvae and adult telencephalon. Blue: Hoechst; red: anti-synapsin signals. In larvae, strong signals were detected in the olfactory bulbs, Dc, Dm4, and Dd2. In the adult telencephalon, the signals were broadly detected and strongly detected in Dd2a. Scale bar in larvae: 50um, scale bar in adult: 200um.
Figure 4—figure supplement 1
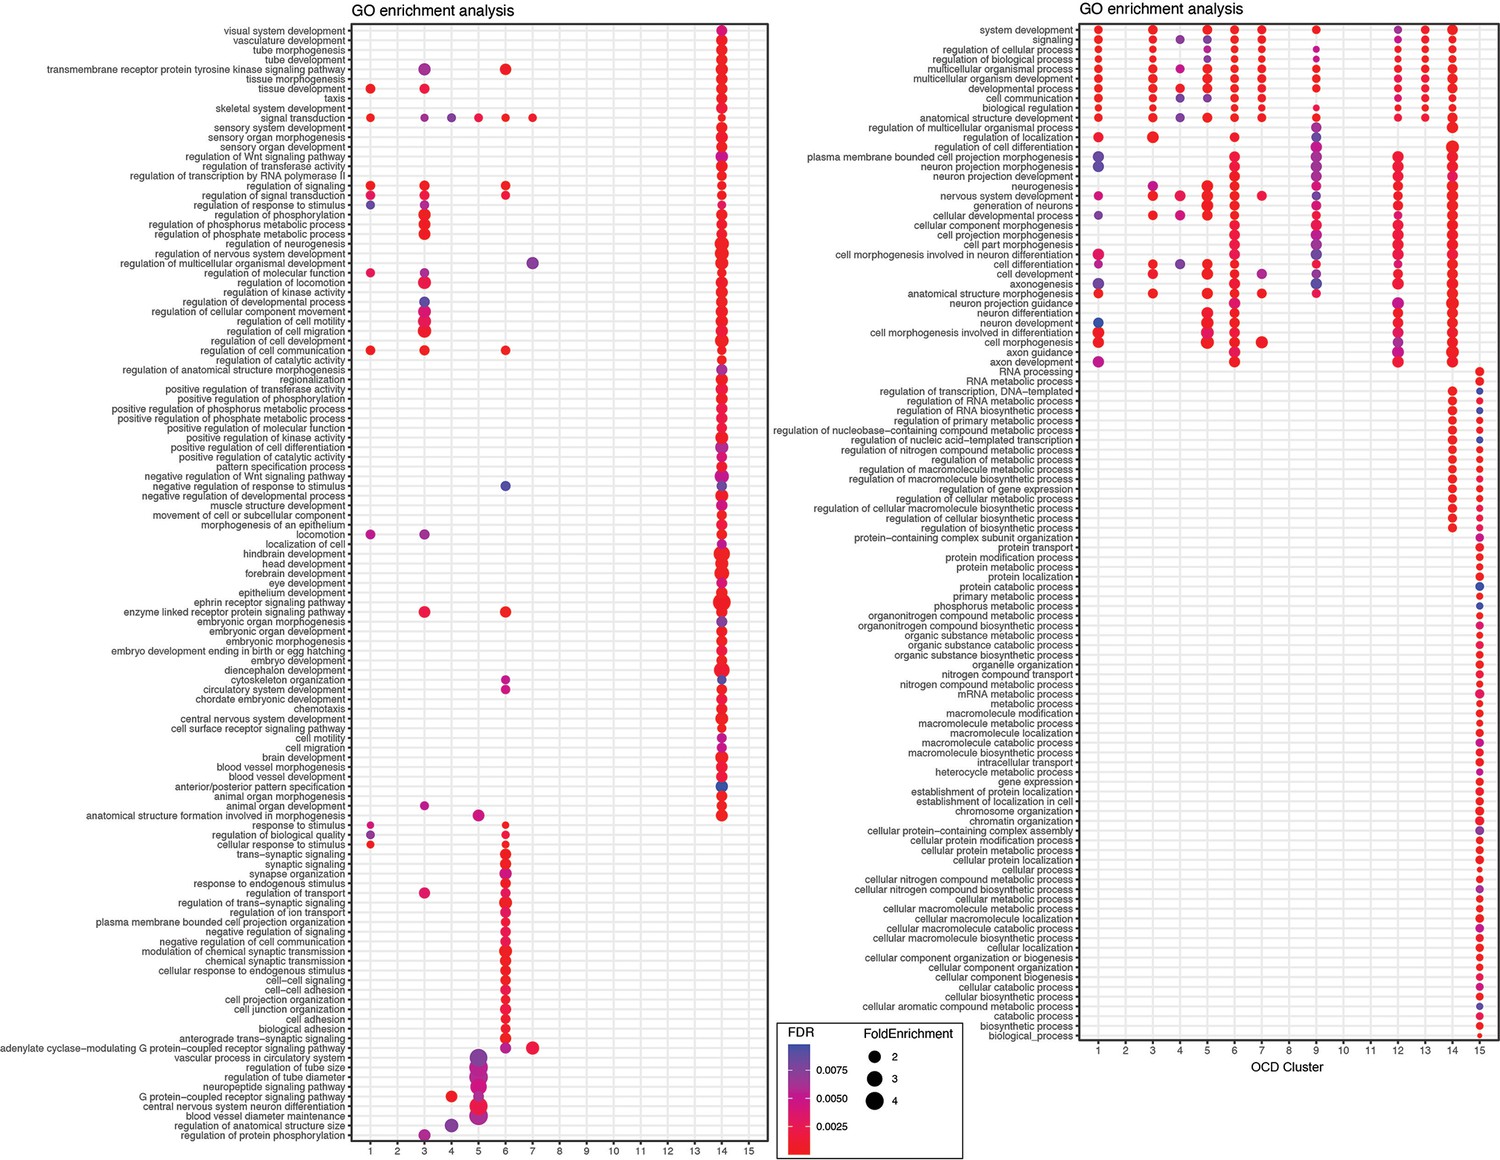
Gene Ontology (GO) term enrichment analysis on open chromatin region (OCR) clusters.
Full list of GO terms enriched in OCR cluster-target genes in Figure 3D. In OCR C8, 10, 11, no GO term was enriched. Size and color of circles indicate fold enrichment and false discovery rate (FDR), respectively. Circle was plotted only if FDR is lower than 0.01. OCR C14, 15 were identified as common open peaks among the telencephalon, which included many metabolic and biosynthesis processes (OCR C 15), and developmental signaling pathways that might reflect the adult neurogenesis process (OCR C 14). Also, one of the subpallial OCR clusters (OCR C5) was enriched with neuropeptide signaling, neural differentiation, and vascular processes, which is consistent with previous avian studies that show neuropeptide expression in the subpallium (Abellán and Medina, 2009; Arieli et al., 1996).
Figure 4—figure supplement 2
RNA-seq and ATAC-seq analysis on Dd2.
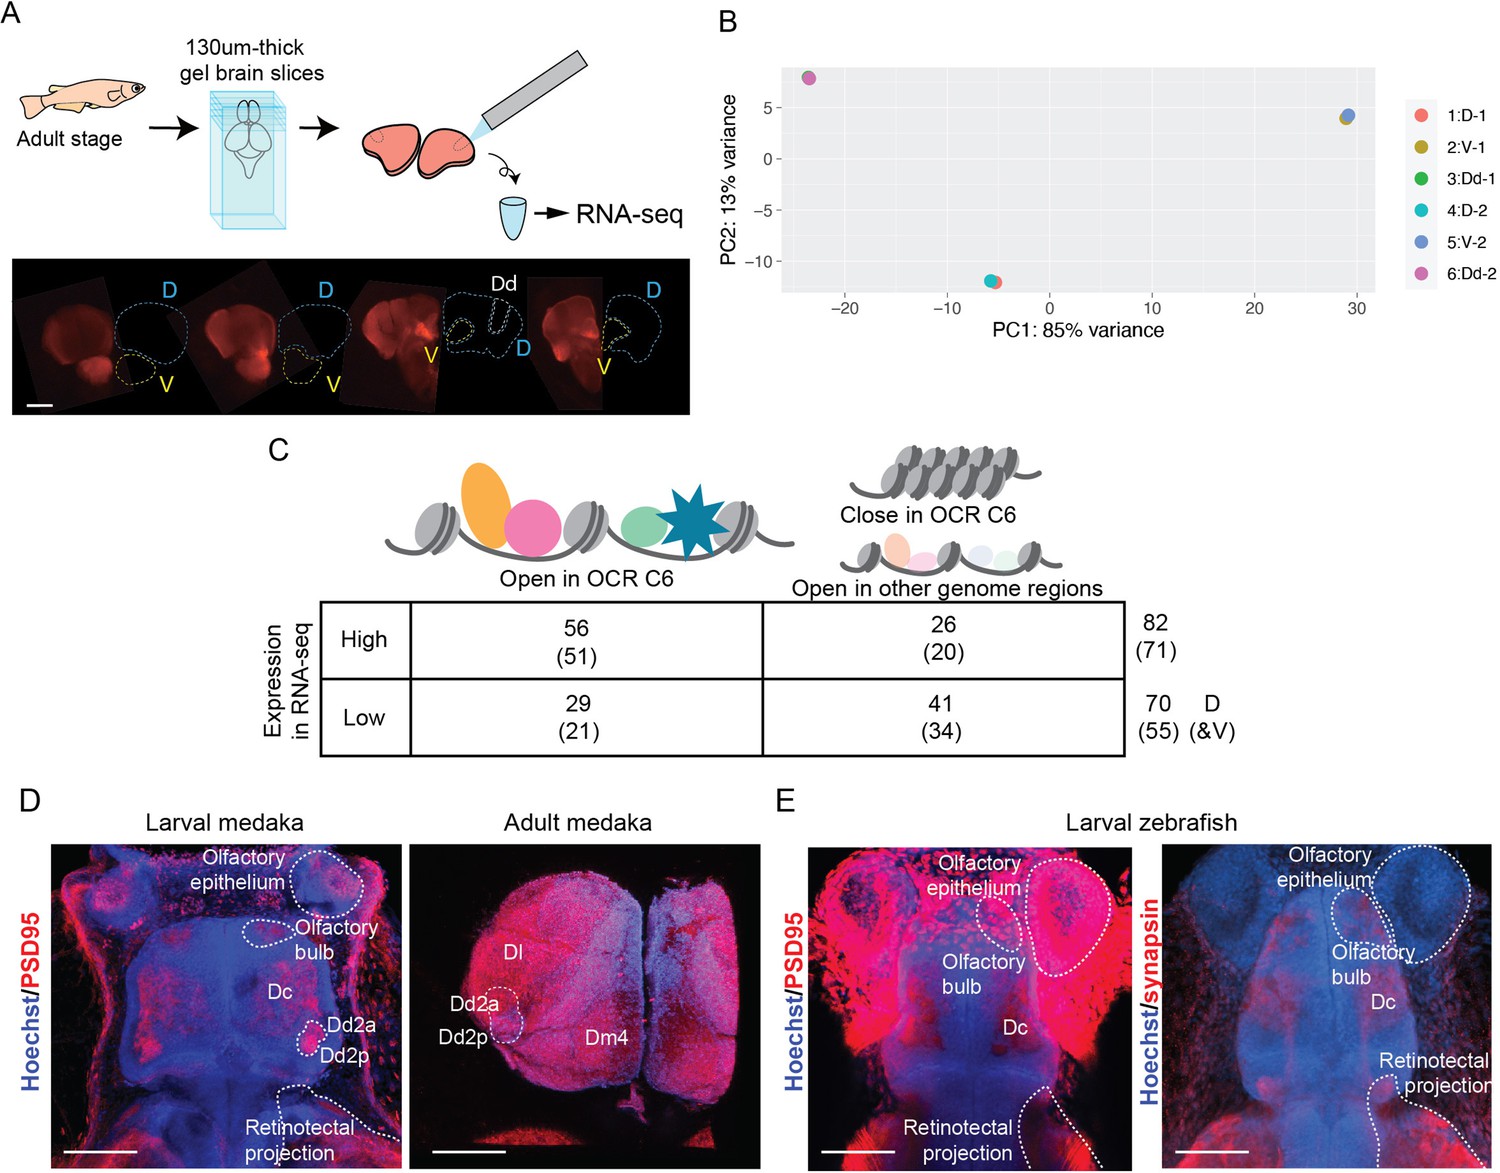
(A) Procedure for RNA-seq analysis. After making 130-um-thick slices, Dd2 (Dd, white lines), the pallium except Dd (D, cyan lines), and subpallium (V, yellow lines) were dissected based on the DsRed signals in the Tg (HuC-DsRed) line. Scale bar: 150 um. (B) Principal component analysis (PCA) of the result of RNA-sequencing (30 fish were used for one replicate and two replicates were made). (C) Synaptic genes differentially expressed and actively regulated in Dd2 from other regions. The number of synaptic genes with significantly high or low expression in the sample Dd2 detected by RNA-seq, and the number of synaptic genes targeted by OCR C6 are shown. By ATAC-seq, we identified genes actively downregulated. (D) Maximum projection image of anti-PSD95 immunostaining on larval medaka (left) and dissected adult medaka (right) telencephalon. Blue: Hoechst signal; red: PSD95 signal. In larvae, PSD95 signals were detected in olfactory epithelium, olfactory bulb, Dc, retinotectal projection, and both Dd2a and Dd2p. Noisy signals were detected in the skin. In the adult telencephalon, PSD95 signals were broadly detected but we observed strong signals in Dl, Dd2a, and Dm4. Scale bar in larvae: 50um, scale bar in adult: 250um. (E) Maximum projection image of anti-synapsin immunostaining on larval zebrafish. Both PSD95 and synapsin were detected in the olfactory bulb, Dc, and retinotectal projection. Noisy signals were detected in the skin in anti-PSD95 immunostaining. No strong signal in the dorsal telencephalon was observed. Scale bar: 50um.
Figure 5 with 1 supplement
Analyses of Dd2-specific open chromatin region (OCR) clusters reveal specialized synaptic architecture.
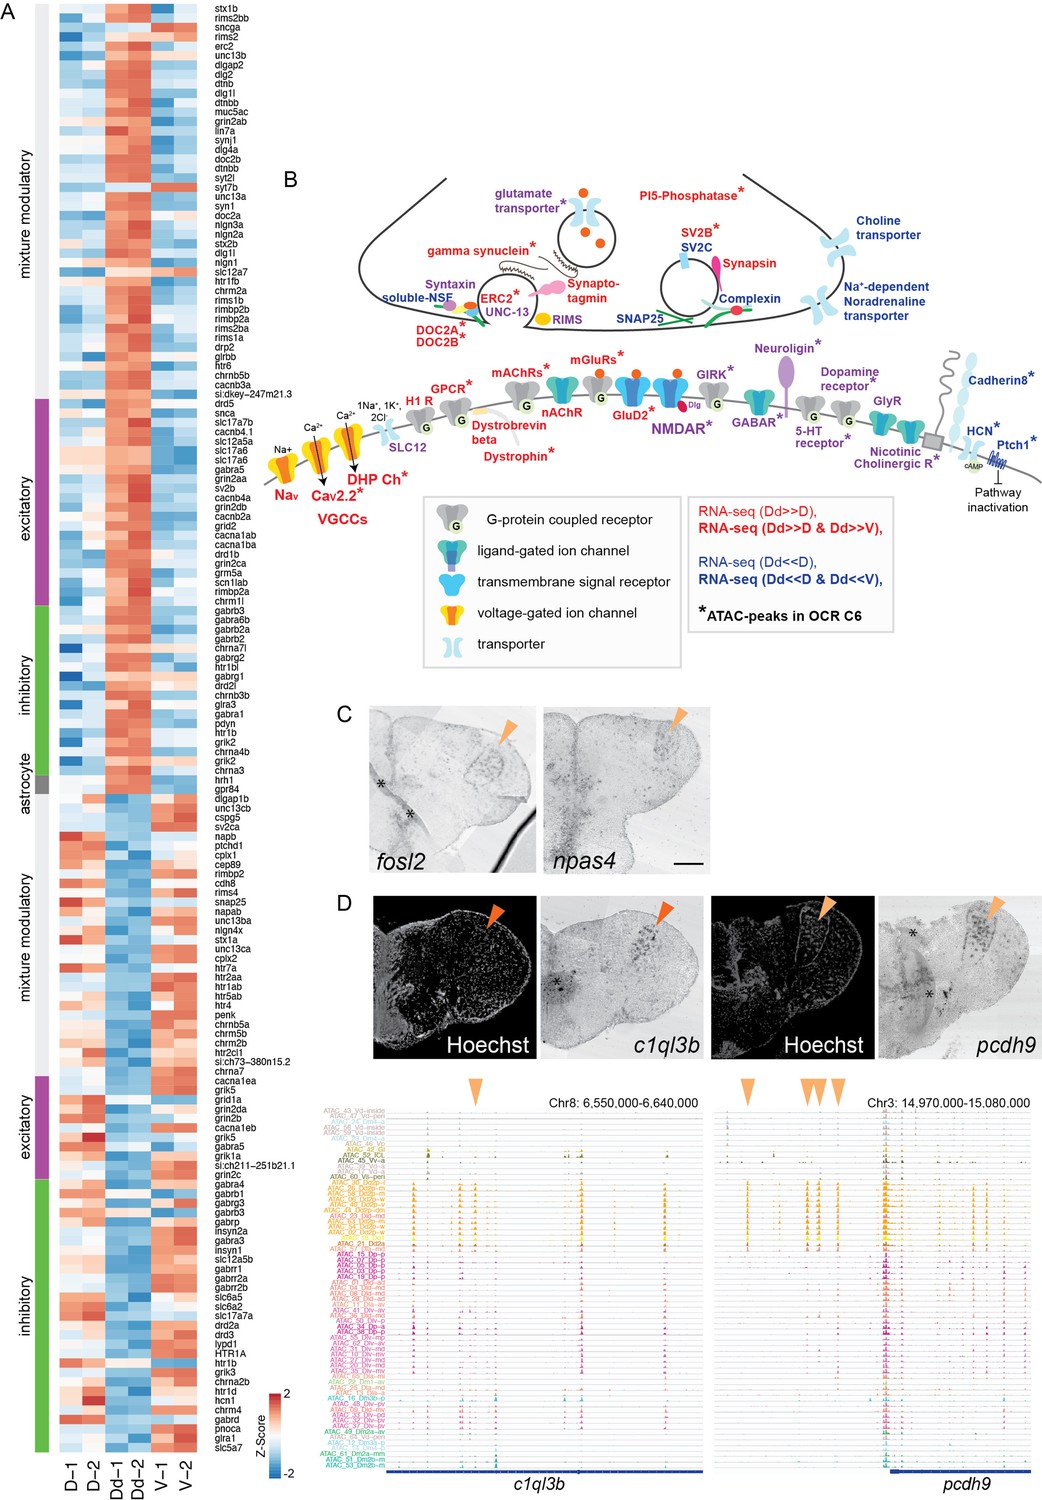
(A) Differential expression of synaptic signaling genes in the Dd2 compared to other pallial regions and the subpallium. Expression levels from RNA-seq data are shown for synaptic signaling genes that were differentially expressed in Dd2. Synaptic genes are classified into excitatory, inhibitory, modulatory, and astrocyte categories. (B) Schematic summary of the genes actively regulated or preferentially expressing genes in Dd2 regions. Gene names in red indicate all subunits in the gene expressed significantly higher in Dd2 than in other pallial regions, while gene names in blue indicate the expression of all subunits in Dd2 was significantly lower in Dd2. Gene names in purple indicate that the gene included both higher and lower expressing subunits. * indicates the genes that are actively regulated by the Dd2-specific OCR cluster (C6). More detailed information about the differentially regulated subunits of genes is described in Figure 5—figure supplement 1.
GABAR: GABAergic receptor; GIRK: glutamate receptor ionotropic kainate; GluD2: delta glutamate receptor2; GlyR: glycine receptor; H1R: histamine receptor; mAChRs: muscarinic acetylcholine receptors; nAChR: nicotine acetylcholine receptor; SLC12: kidney-specific sodium-potassium-chloride cotransporter; CaV2.2: N-type voltage-gated calcium channels; DHP Ch: L-type voltage-gated calcium channels; VGCCs: voltage-gated calcium channels; Nav: voltage-gated sodium ion channels; PI5-phosphatase: phosphoinositide 5-phosphatase. (C) Expression of immediate early genes (fosl2 and npas4) in the Dd2p region (orange triangles). Scale bar: 200um. (D) Expression of synaptic genes specifically expressed in Dd2 visualized by in situ hybridization (top). c1ql3b was specifically expressed in Dd2a (top left), and protocadherin 9 was detected in Dd2p (top right). Orange triangle indicates the gene expression in Dd2. Track view of ATAC-seq peaks in clonal units (bottom). Orange triangles indicate the Dd2-specific ATAC-seq peaks.
Figure 5—figure supplement 1
Characterization of synaptic genes expressed and regulated in Dd2.
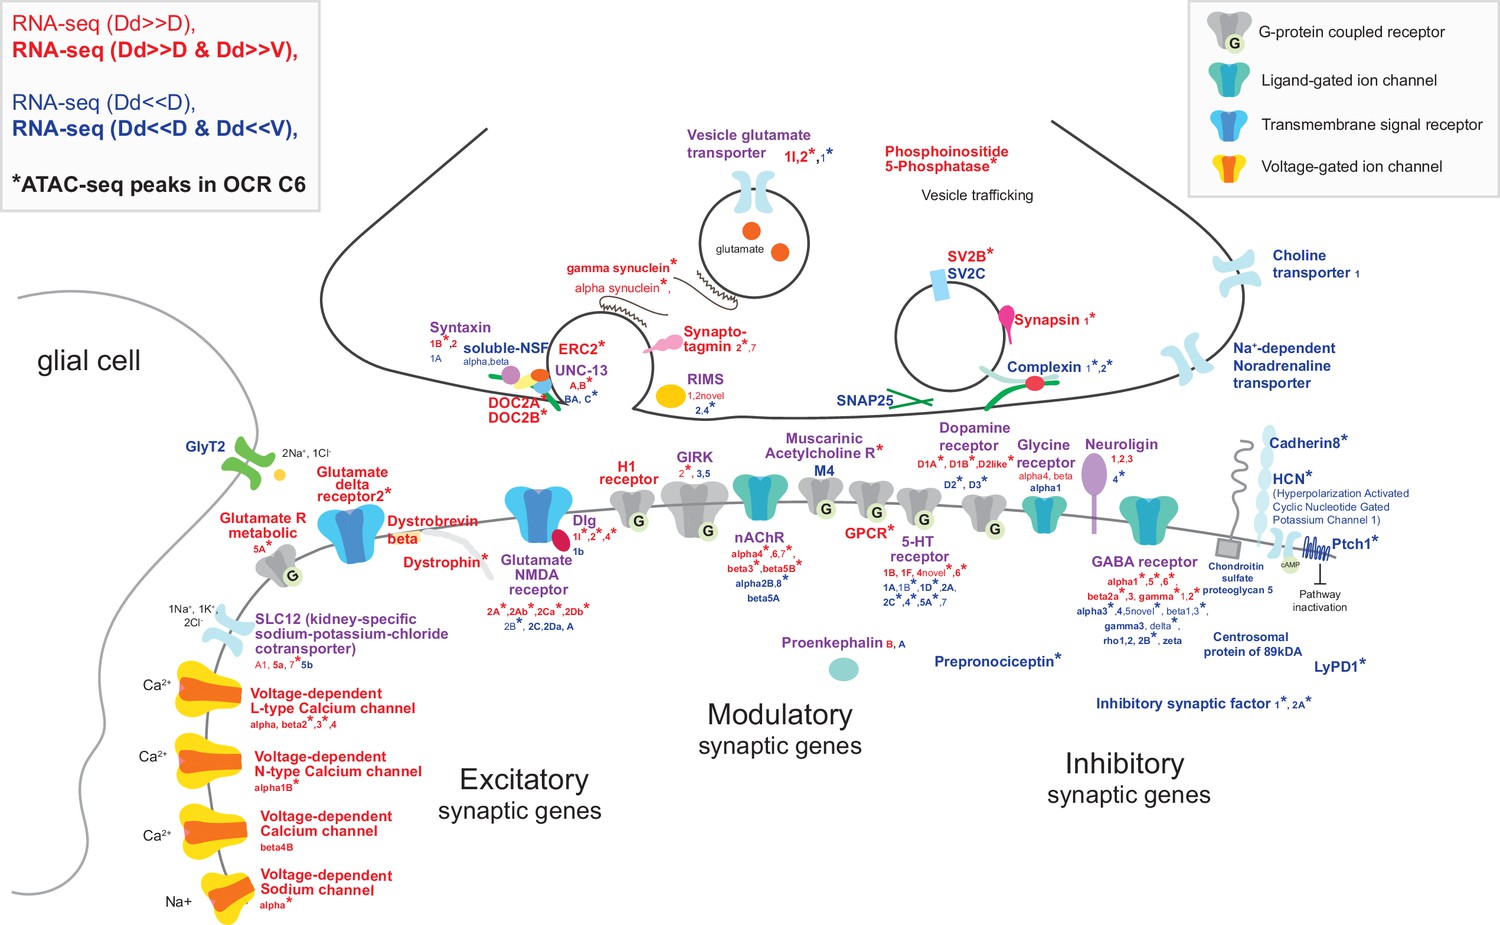
Schematic representation of synaptic genes detected as specifically expressed and regulated in Dd2 by ATAC-seq and RNA-seq. We found that different subunits of neurotransmitter receptors and ion channels are both up- and downregulated in Dd2 compared to other pallial regions; excitatory glutamate receptors and glutamate transporters; modulatory neuronal genes, such as 5-HT receptors, cholinergic receptors, and dopamine receptors; inhibitory receptors, such as GABAergic receptors. On the other hand, the voltage-dependent calcium channels are expressed significantly higher in Dd2 than other regions, and the expression of inhibitory synaptic genes was suppressed. Red gene names indicate significantly highly expressing genes, blue gene names indicate actively significantly lowly expressing genes, and purple gene names indicate that subunits of the genes were differently expressed in Dd2. * indicates the genes targeted by Dd2-specific OCR C 6.
Figure 6 with 1 supplement
Transcriptional regulation in Dd2.
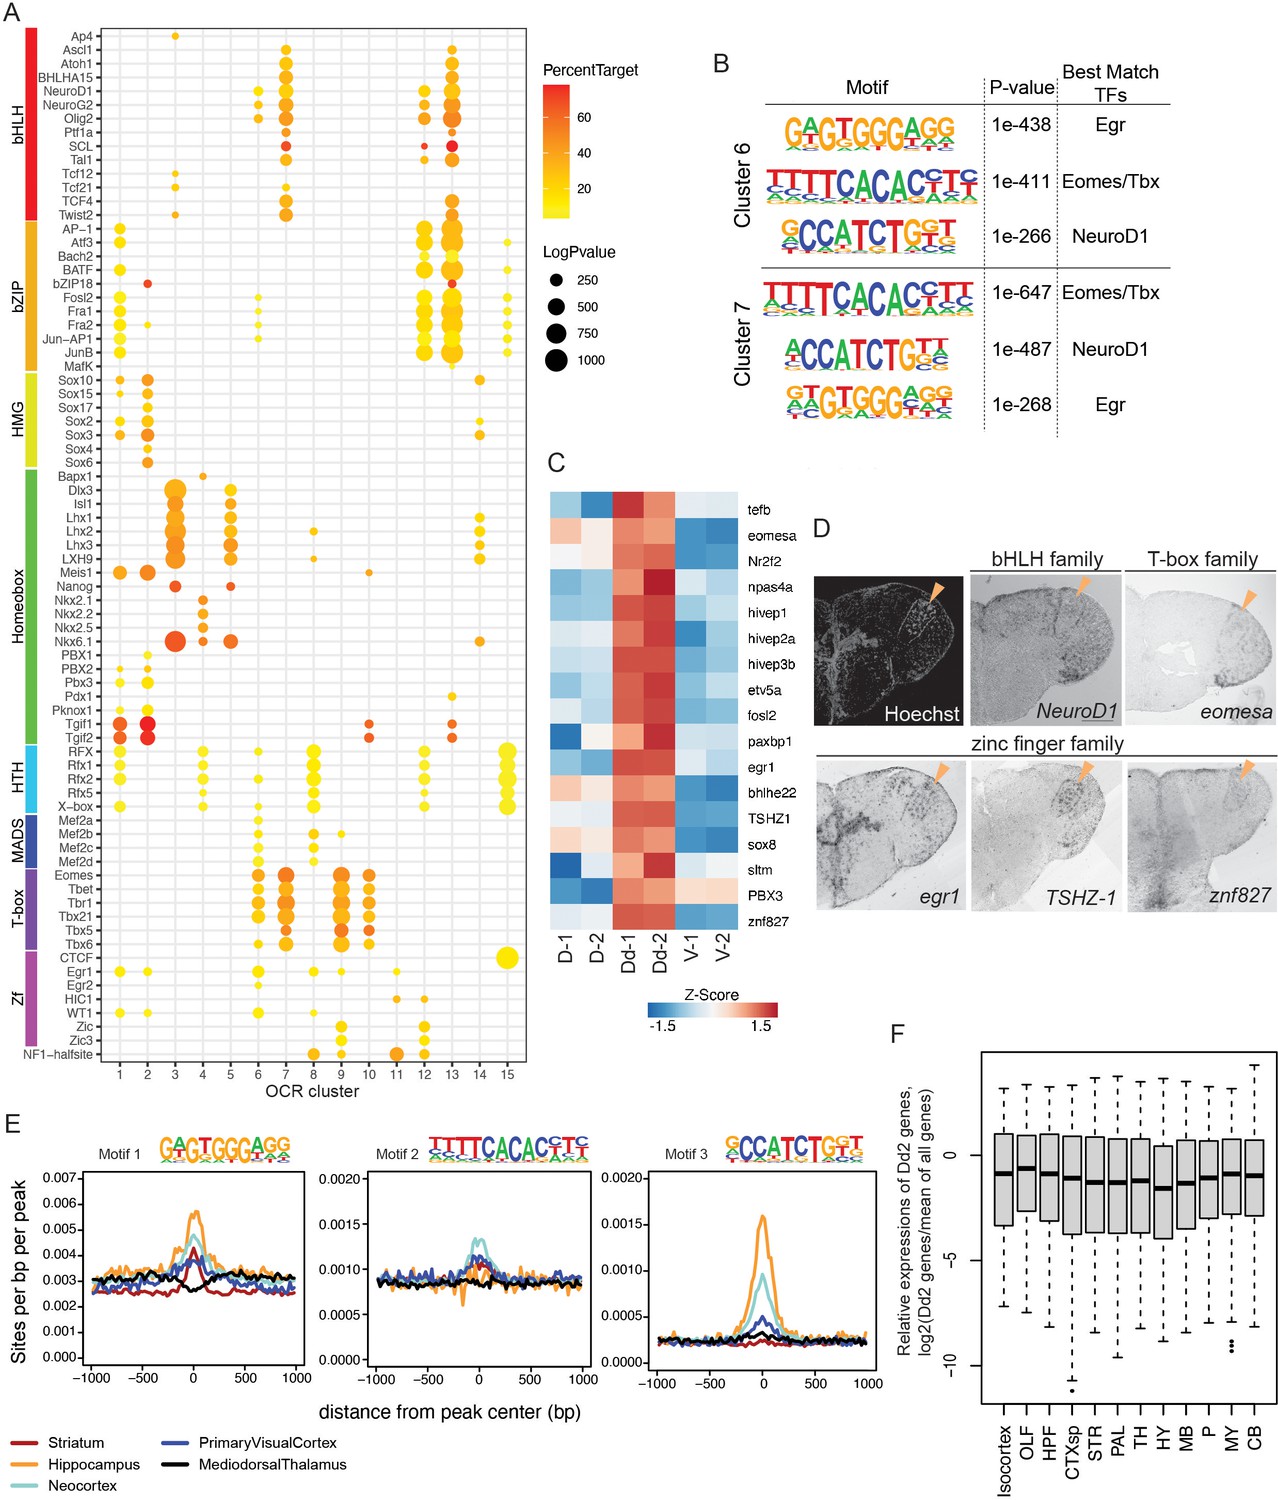
(A) Enrichment of known transcription factor binding motifs in open chromatin region (OCR) clusters are shown as dot plots. Size and color of circles indicate -log10(p-value) and percent target, respectively. Circle was plotted only if -log10(p-value) is higher than 100. (B) Result of de novo motif finding analysis. Top 3 of the enriched motifs in OCR C6 and 7 and candidate transcription factors that have similar binding motifs are shown. (C) Expression of candidate transcription factors in Dd, the pallium except Dd (D), and the subpallium (V) analyzed by RNA-sequencing (n = 2 replicate). (D) Expression pattern of the candidate transcription factors in the telencephalon visualized by in situ hybridization (ISH). Orange triangles indicate the position of Dd2p. (E) Medaka OCR C6 motif enrichment in human brain region-specific OCRs. Existence of each medaka C6 motif was examined around human brain ATAC-seq peaks, and the motif density was calculated. HC: hippocampus; MDT: medial dorsal thalamus; NCX: neocortex; PVC: primary visual cortex; ST: striatum. Darker blue shades indicate higher correlation. (F) Relative expression levels of Dd2-preferentially expressed genes (809 genes) in the mouse brain. We examined the expression of Dd2-preferentially expressed genes across 12 regions in the mouse brain (isocortex. OLF: olfactory areas; HPF: hippocampal formation; CTXsp: cortical subplate; STR: striatum; PAL: pallidum; TH: thalamus; HY: hypothalamus; MB: midbrain; P: pons; MY: medulla; CB: cerebellum). The gene expression levels were from the ISH data of Allen Brain Atlas (https://mouse.brain-map.org/).
Figure 6—figure supplement 1
Expression of candidate transcription factors in the adult medaka telencephalon.
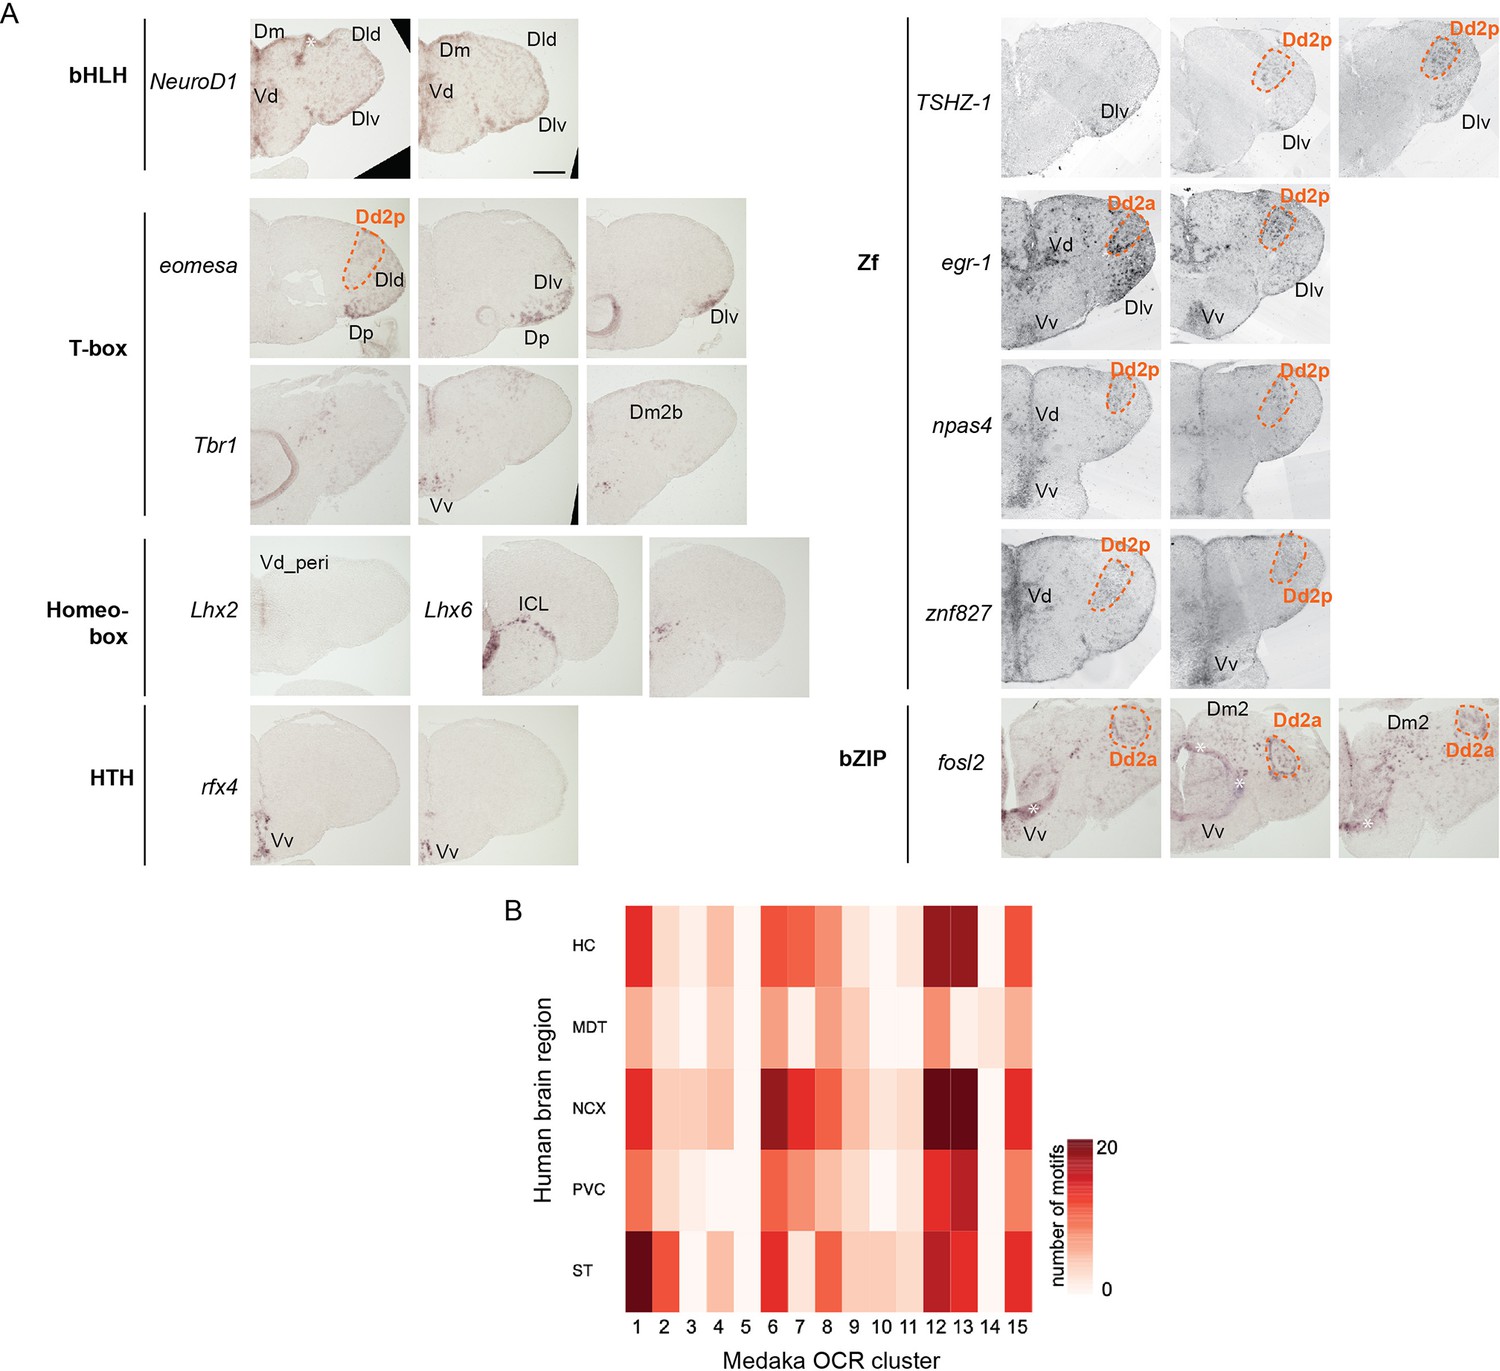
(A) Brain regions where RNA signals were detected by in situ hybridization are indicated by names. Expression in Dd2 is shown with the orange line and name. bHLH: beta-helix-loop-helix family; HTH: helix-turn-helix family; Zf: zinc-finger family; bZIP: basic leucine zipper family. Scale bar: 150um. (B) A heatmap showing the number of shared motifs between human brain regional ATAC-seq peaks and medaka OCR clusters. HC: hippocampus; MDT: medial dorsal thalamus; NCX: neocortex; PVC: primary visual cortex; ST: striatum. Darker shade indicates larger overlap between medaka and human.
Figure 7
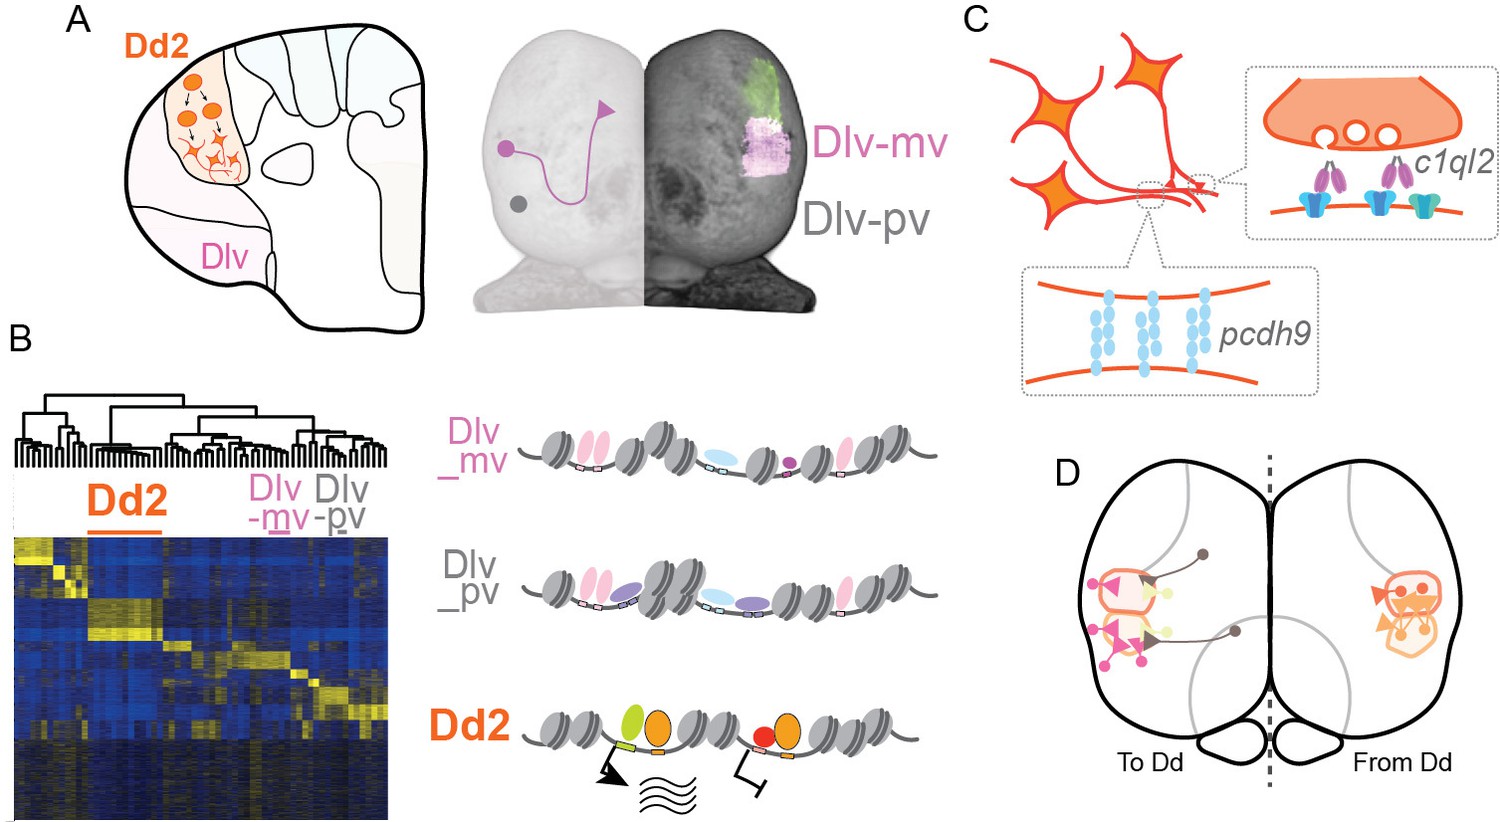
Hypothesized molecular model of specialized synaptic architecture in the dorsal pallium in medaka.
(A) Anatomical regions in the pallium is formed by clonal units mutually exclusively. (B) Clonal ATAC-seq shows unique open-chromatin patterns in some clonal units (left). Transcription is likely regulated by the combination of multiple TFs that construct a distinct open chromatin structure (right). (C) This specific open chromatin region (OCR) contributes to the transcriptional regulation of a specialized set of synaptic genes in Dd2, which are suggested to generate specific axonal projections and synaptic architecture. (D) We assume that Dd2 is important in the telencephalic neural networks in medaka. Circles indicate cell bodies and triangles indicate projection terminals. The color code indicates the position of anatomical regions identical to the color code in Figure 1.
Videos
Video 1
Reference brain.
DAPI-based reference brain. The slices show the horizontal view from the ventral to the dorsal direction.
Video 2
Pallium.
One of the examples of visualized clonally related units in the pallium (raw movie). GFP-positive cells (green) make a cluster and send a projection to the same site. Red signals indicate DsRed and blue signals indicate DAPI staining. The slices show the horizontal view from the dorsal to the ventral direction.
Video 3
Subpallium.
One of the examples of visualized clonally related units in the subpallium (raw movie). GFP-positive cells (green) and DsRed-positive cells (red) were mixed in the subpallial region. Blue signals indicate DAPI staining. The slices show the horizontal view from the dorsal to the ventral direction.
Tables
Table 1
Summary of marker gene expression in the telencephalic regions in medaka.
Several marker gene expressions were assessed with immunostainings (Figure 1—figure supplement 2).
| CaMK2 | Parvalbumin | GAD65/67 | GAD67 | |
|---|---|---|---|---|
| Dla | + | n.a. | n.a. | n.a. |
| Dld | +/– | + | + | ++ |
| Dlp | +/– | – | - | n.a. |
| Dlv | + | + | + | ++ |
| Dd1 | + | ++ | - | + |
| Dd2a | + | ++ | ++ | + |
| Dd2p | ++(ventral) | + | ++(dorsal) | + |
| Dm1 | – | ー | + | n.a. |
| Dm2a | + | – | + | + |
| Dm2b | ++ | – | + | + |
| Dm3a | ++ | ー | + | + |
| Dm3b | ++ | ー | + | + |
| Dm4 | ++ | ++ | - | n.a. |
| Dp | ++ | + | - | n.a. |
| Dc | + | - | - | n.a. |
| Dcpm | – | - | n.a. | n.a. |
| GL | + | n.a. | ++ | + |
| ICL | – | ++ | n.a. | n.a. |
| Vv | – | ++ | - | - |
| Vd | – | ++ | - | - |
| Vp | ++ | + | - | - |
| Vs | – | + | - | - |
| Vl | – | ++ | - | - |
-
- signals not detected; +: signals detected; ++: signals strongly detected; n.a.: not analyzed.
Table 2
Nomenclature of the adult telencephalon.
For the medaka brain research, two brain atlases of adult medaka have been used (Anken and Bourrat, 1998; Ishikawa et al., 1999). Because performing three-dimensional reconstruction from brain slices is difficult, some inconsistencies in nomenclature were observed among references. To overcome this difficulty, we performed a three-dimensional imaging of the nuclei-stained adult medaka telencephalon, which allowed us to analyze the anatomical boundaries in more accuracy. The number in the name of anatomical regions (such as Dm1, Dm2, Dm3) was defined by the order of the emergence in the anterior to posterior axis. Here, the table shows the nomenclature of the anatomical regions of the adult telencephalon and the description of cellular organization in the anatomical regions, which we used to define the names.
| Abbreviation of anatomical region | Name of subregion | Name of anatomical region | Cellular distribution |
|---|---|---|---|
| Dc | The dorso-central telencephalon | In most teleostean species, cells in Dc have larger size of cell body (Cichlid fish Burmeister et al., 2009, sea bass Cerdá-Reverter et al., 2001) and are sparsely distributed. According to the medaka brain atlas of Ishikawa et al., 1999, Dc is defined in the center of the pallium as well. However, in the other brain atlas of medaka fish (Anken and Bourrat, 1998), multiple subregions are separately defined as Dcs. In our atlas, we defined the center region of the pallium that has less dense cell populations as Dc. | |
| Dcpm | The posterior medial nucleus of the dorso-central telencephalon | The aggregates of cells in the posterior medial center of dorsal pallium (Dcpm) were found. | |
| Dm | The medial part of the dorsal pallium | Small cell-body neurons with high density were observed. In the horizontal optic sections, we found several linearly aligned cells on the dorsal surface of the telencephalic hemispheres which correspond to the boundaries of Dm subregions. | |
| Dm1 | Densely packed with small cells. | ||
| Dm2 | Dm2 is packed with cells more densely than Dm1. | ||
| Dm3 | |||
| Dm4 | |||
| Dl | The dorsal lateral pallium | In the previous medaka brain atlas, the anterior region of dorsal lateral pallium is simply named as Dl (Anken and Bourrat, 1998). But here we named this anterior part of dorso-lateral telencephalon the Dla because the nuclear density is less than Dld, Dlv, and Dlp. We also divided Dl into the dorsal and ventral part since the nuclear density is different between the dorsal and ventral parts. | |
| Dla | The anterior part of the dorso-lateral telencephalon | In the horizontal sections, we found that the density of nucleuses are more sparse in Dla than Dld and Dlv. | |
| Dld | The dorsal part of the middle and posterior part of the dorso-lateral telencephalon | The dorsal part of the middle and posterior part of the dorso-lateral telencephalon (Dld) (Anken and Bourrat, 1998) is next to Dla and the cell density is more than that of Dla. | |
| Dlv | The ventral part of the middle and posterior part of the dorso-lateral telencephalon | The boundary between Dld and Dlv is not clear. But the cells are more densely distributed in Dlv than Dld. The ventral part of the middle and posterior part of the dorso-lateral telencephalon (Dlv)(Anken and Bourrat, 1998) is highly packed with cells. | |
| Dlp | The posterior regions of the dorso-lateral telencephalon | Higher DAPI signal density in Dlp than Dld and Dlv were detected. There is no clear boundary among the posterior regions of the dorso-lateral telencephalon (Dlp), the posterior of dorsal telencephalon (Dp), Dld, and Dlv. But we observed that Dlp was highly dense with a small nucleus and the cell distribution pattern was different from neighboring regions. | |
| Dd | The dorso-dorsal telencephalon | In the previous report (Anken and Bourrat, 1998), Dd is subdivided into two regions, Dd1 and Dd2. In the other report (Ishikawa et al., 1999), only Dd is defined which corresponds to Dd2 of Anken and Bourrat, 1998. Since the boundary between Dd1 and Dd2 was visible in DAPI staining, we followed the definition of Ralf H Anken, 1998. | |
| Dd1 | |||
| Dd2 | Dd2 is clearly demarcated in the telencephalon. As observed with the horizontal sections, Dd2 can be subdivided into two regions, Dd2a (anterior part of Dd2) and Dd2p (posterior part of Dd2). Dd2p is surrounded by cells, and the cell density is relatively higher than Dd2a. | ||
| Dp | The posterior part of dorsal telencephalon | The posterior part of dorsal telencephalon (Dp) (Anken and Bourrat, 1998) is remarkably denser with the cell nucleus than other posterior anatomical regions. | |
| Vd | The dorsal medial part of the subpallium | Cells in the dorsal medial part of the subpallium are called Vd. We also observed some cell clusters that are located laterally and inside the pallium. Those cell clusters correspond to the Vc region in some references. But according to the cell density and some gene expression, we define those regions also as Vd. | |
| Vs | The supracommissural part of ventral telencephalon | The supracommissural part of ventral telencephalon (Vs) is located ventral to Vd. But there is no clear boundary between Vs and Vd. | |
| Vv | The ventral part of the subpallium | ||
| ECL | The external layer of the olfactory bulb | In the anterior part of the telencephalon, the external (ECL) and internal (ICL) cellular layer of the olfactory bulb and the glomerular layer of the olfactory bulb (GL) are clearly found. | |
| ICL | The internal layer of the olfactory bulb |
Additional files
Download links
A two-part list of links to download the article, or parts of the article, in various formats.
Downloads (link to download the article as PDF)
Open citations (links to open the citations from this article in various online reference manager services)
Cite this article (links to download the citations from this article in formats compatible with various reference manager tools)
Epigenetically distinct synaptic architecture in clonal compartments in the teleostean dorsal pallium
eLife 12:e85093.
https://doi.org/10.7554/eLife.85093


