Associations of four biological age markers with child development: A multi-omic analysis in the European HELIX cohort
- Μedical Research Council Centre for Environment and Health, Imperial College London, United Kingdom
- Mohn Centre for Children's Health and Well-being, School of Public Health, Imperial College London, United Kingdom
- Department of Environmental Science, Vytautas Magnus University, Lithuania
- Center for Genomics Regulation, Barcelona Institute of Science and Technology, Spain
- Universitat Pompeu Fabra (UPF), Spain
- Institute for Global Health (ISGlobal), Spain
- CIBER Epidemiologa y Salud Pública (CIBERESP), Spain
- Department of Preventive Medicine, Keck School of Medicine, University of Southern California, United States
- Division of Systems Medicine, Department of Metabolism, Digestion and Reproduction, Imperial College London, United Kingdom
- Cancer Metabolism & Systems Toxicology Group, Division of Cancer, Department of Surgery & Cancer; Imperial College London, United Kingdom
- Division of Climate and Environmental Health, Norwegian Institute of Public Health, Norway
- Centre for Environmental Sciences, Hasselt University, Belgium
- University Grenoble Alpes, Inserm U 1209, CNRS UMR 5309, Team of environmental epidemiology applied to the development and respiratory health, Institute for Advanced Biosciences, France
- Department of Social Medicine, School of Medicine, University of Crete, Heraklion, Greece
- Bradford Institute for Health Research, Bradford Teaching Hospitals NHS Foundation Trust, United Kingdom
Figures
Figure 1
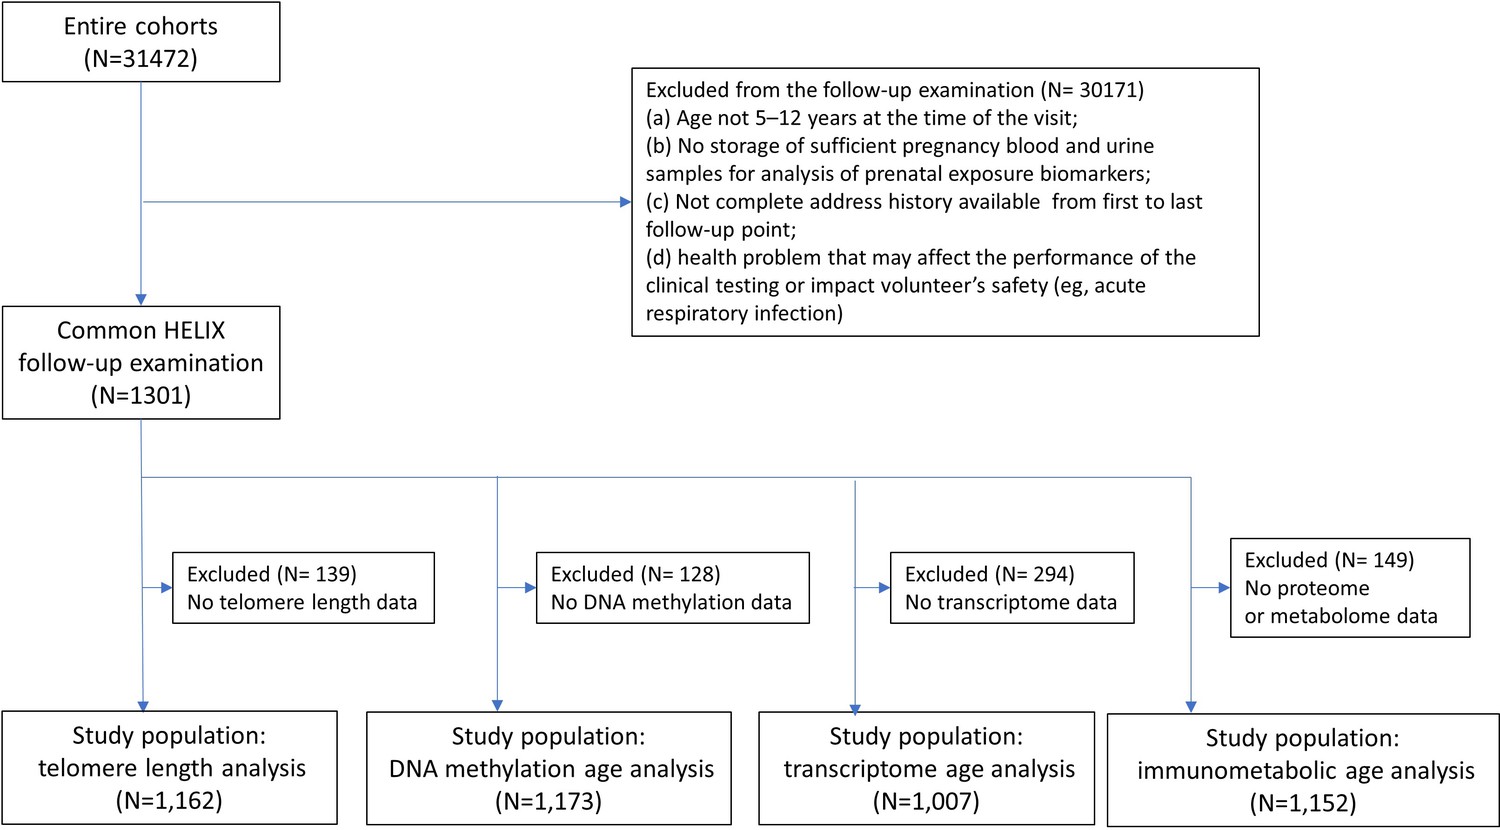
Participant flowchart.
See Supplementary file 1 for details on quality control of molecular data at sample and feature levels.
Figure 2 with 3 supplements
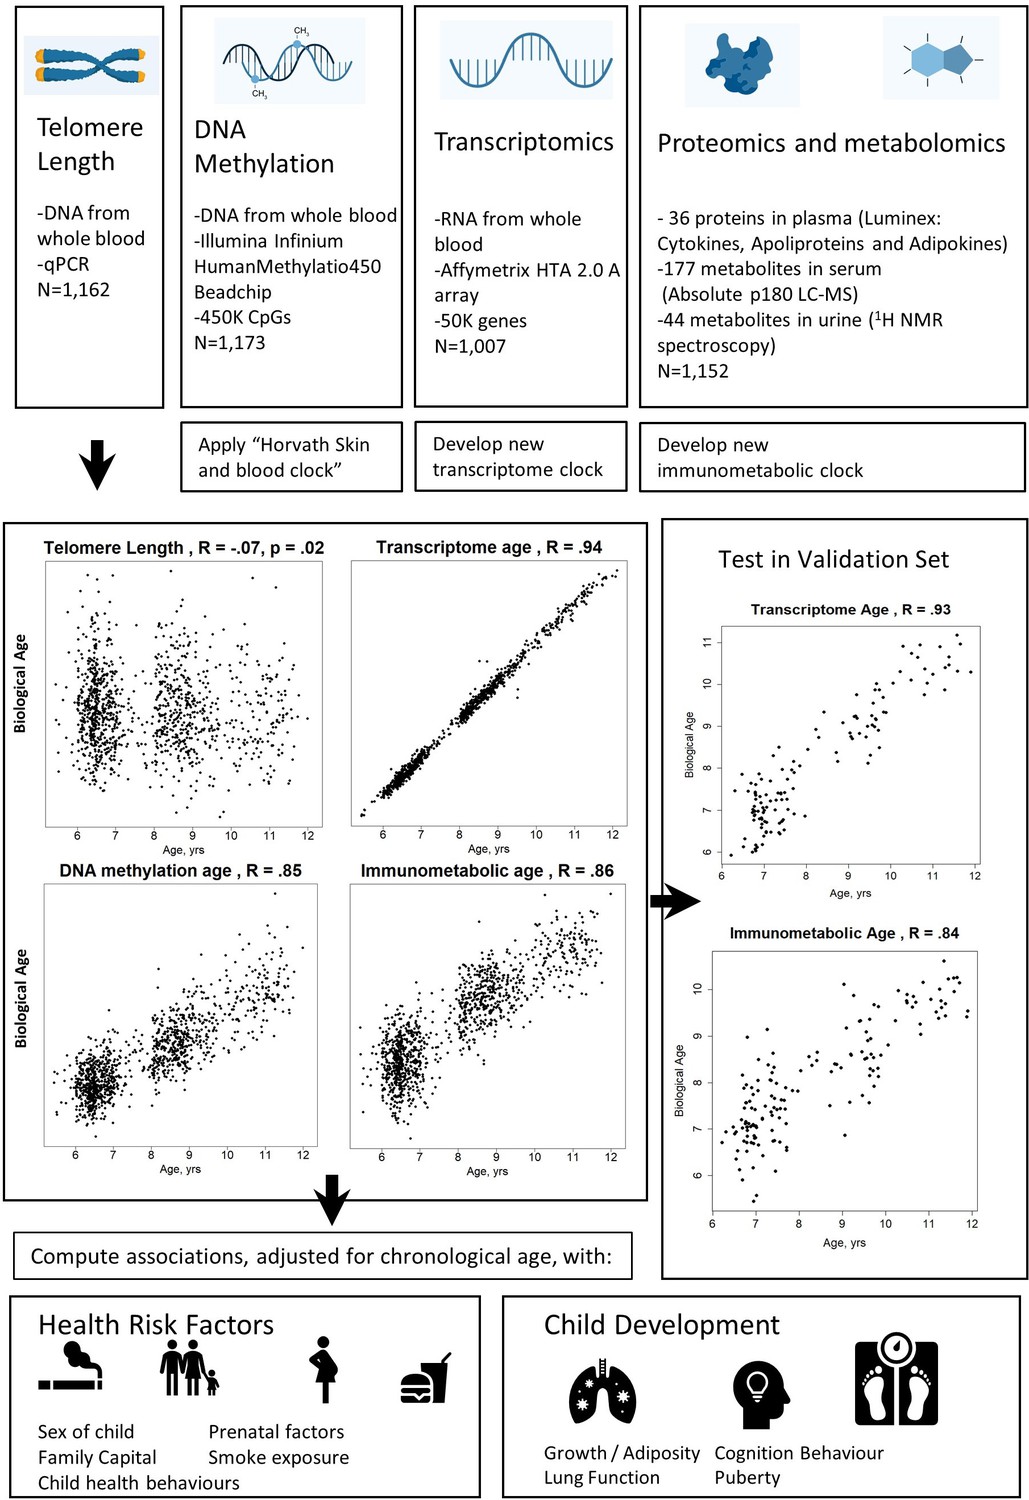
Study design schematic.
Source data for reproducing correlation plots are provided in Figure 2—source data 1.
-
Figure 2—source data 1
Source data for reproducing correlation plots in Figure 2.
- https://cdn.elifesciences.org/articles/85104/elife-85104-fig2-data1-v2.csv
Figure 2—figure supplement 1
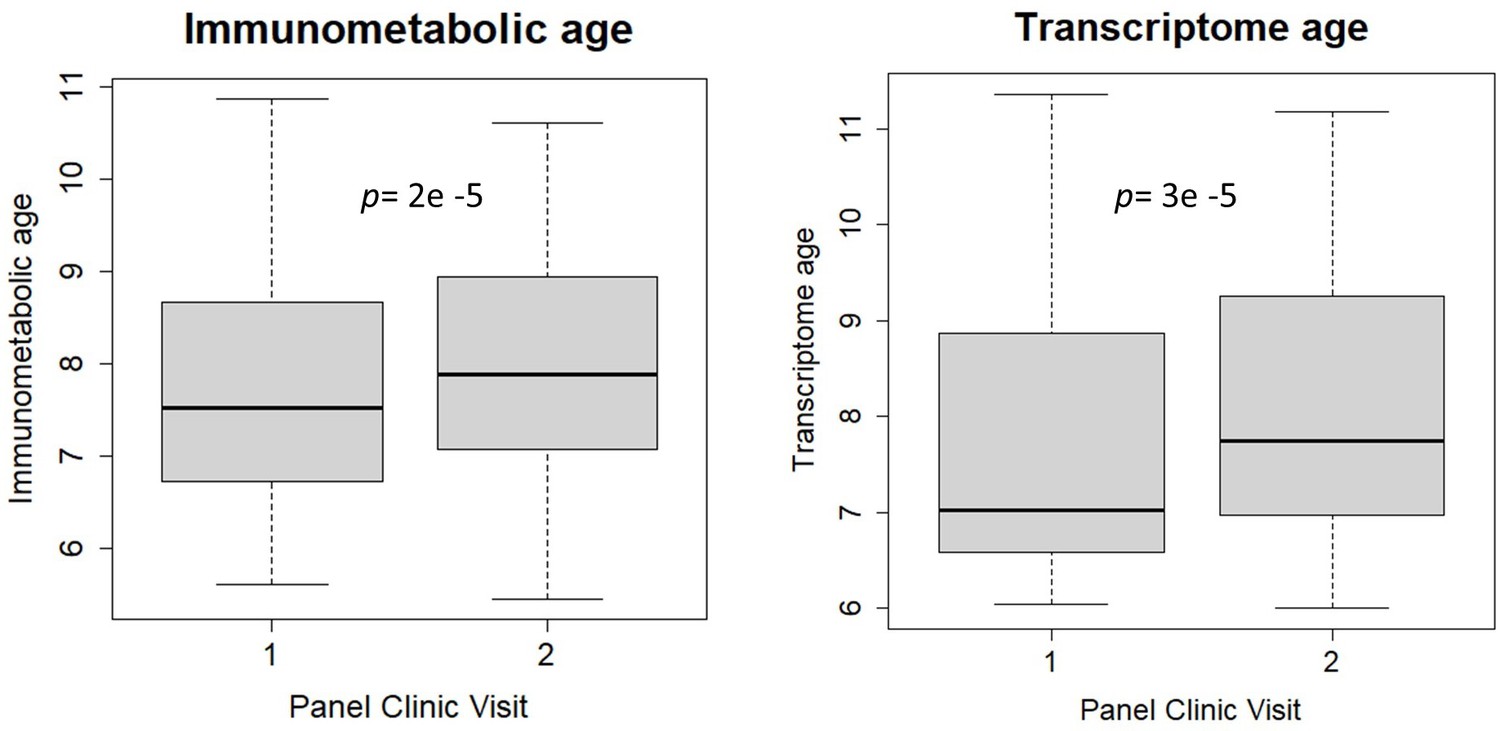
Comparison between immunometabolic and transcriptome age between first and second study visits.
Box plots (showing minimum, maximum, median, first quartile, and third quartile) of biological age measures at each panel study visit (approximately 6 months apart). Panel clinic 1 was part of the main Helix subcohort examination. p-values were calculated from paired t-tests.
Figure 2—figure supplement 2
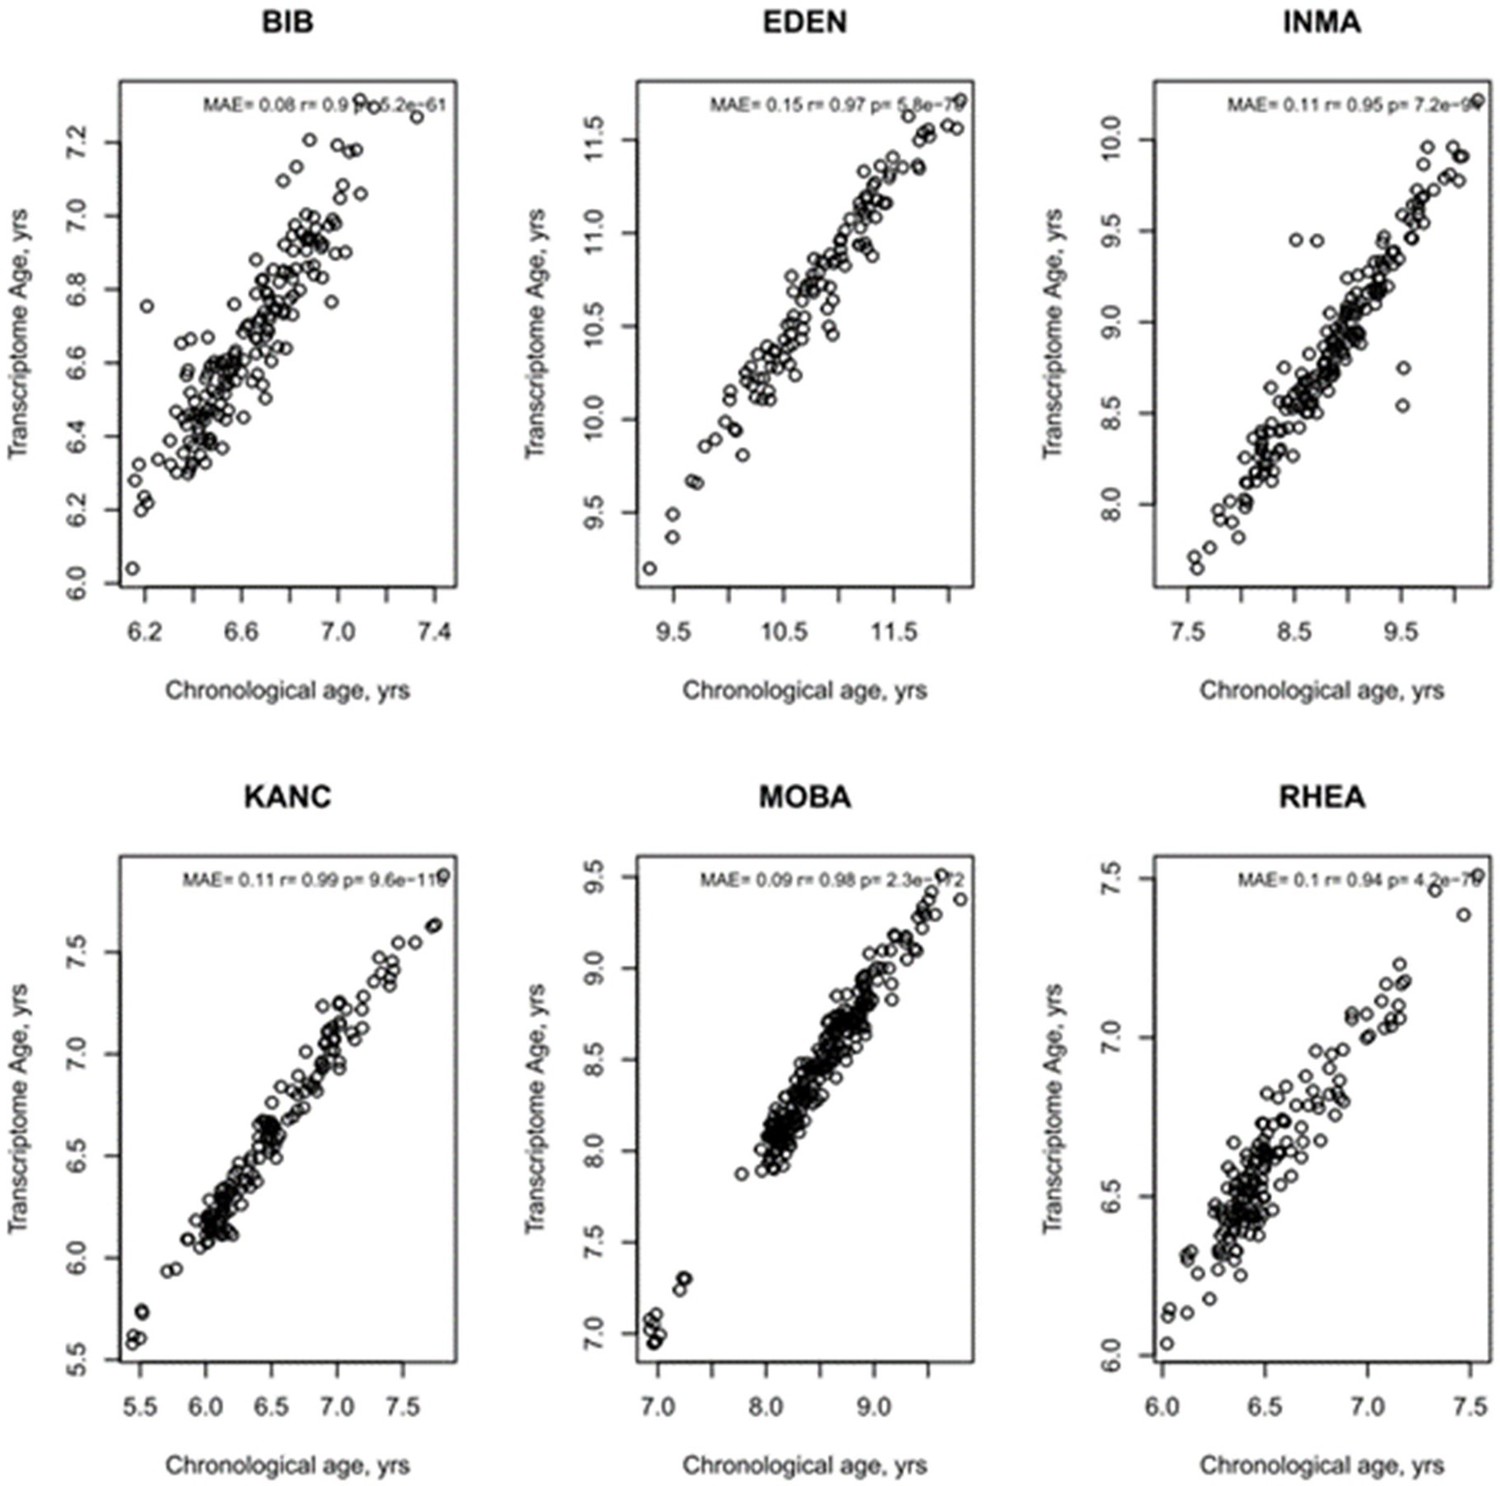
Age Prediction by study centre of transcriptome age.
MAE = mean absolute error. R and p values from Pearson’s correlation.
Figure 2—figure supplement 3
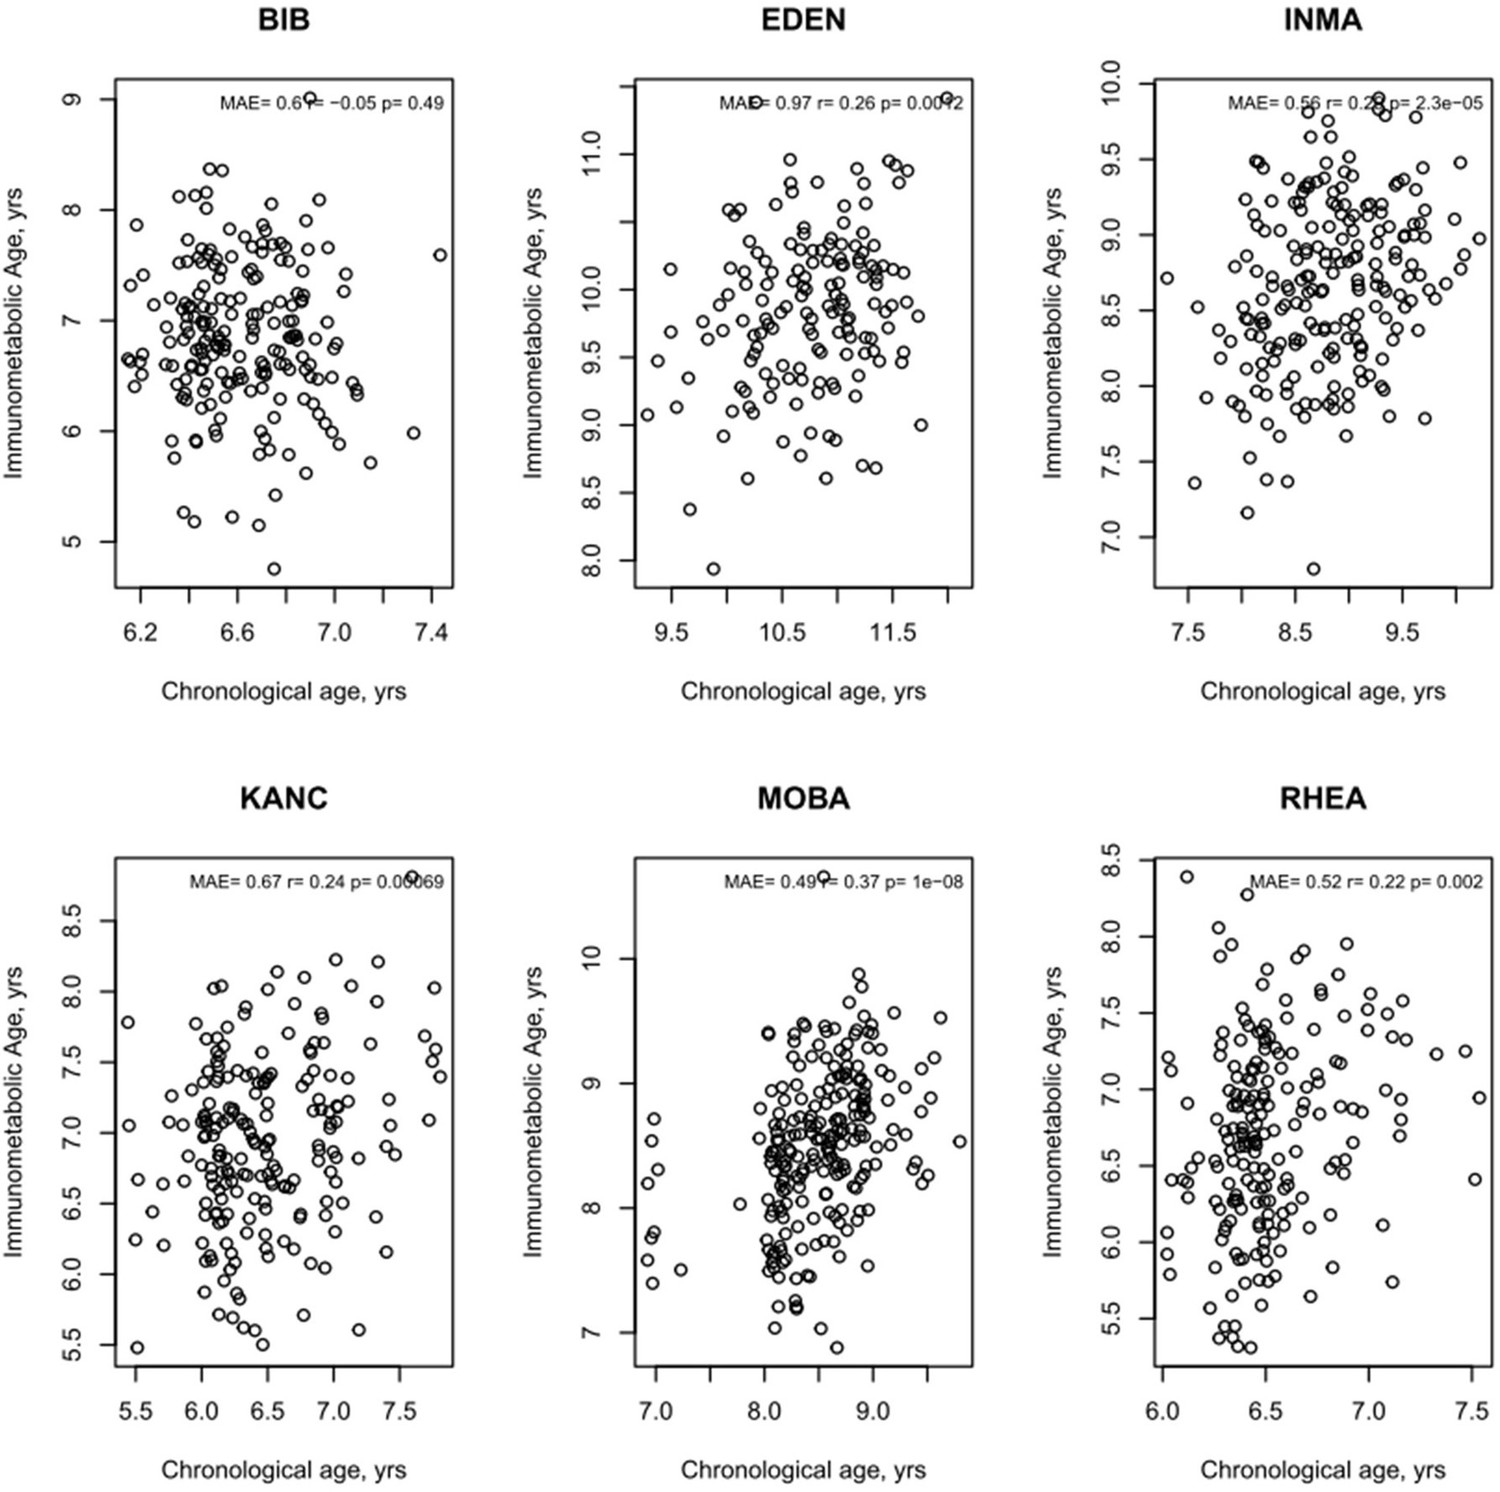
Age Prediction by study centre of immunometabolic age.
MAE = mean absolute error. R and p values from Pearson’s correlation.
Figure 3
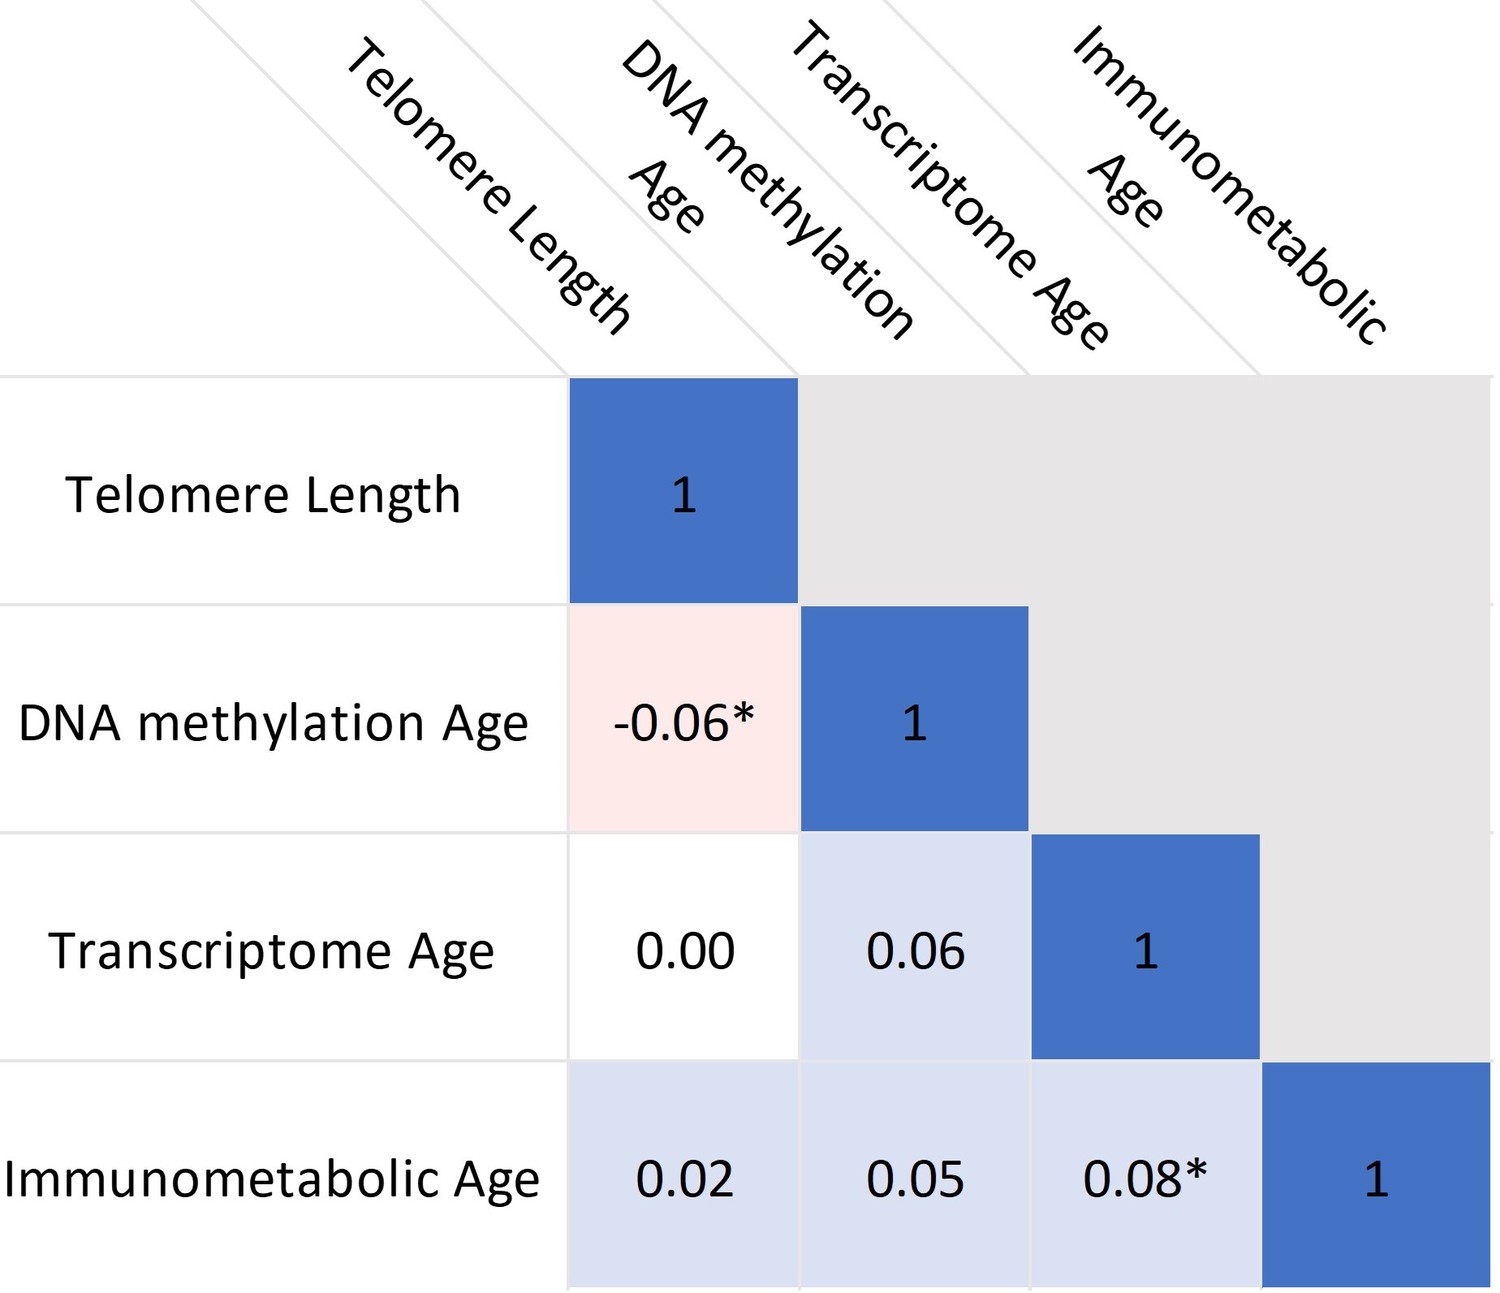
Correlations between biological age indicators.
Heatmap shows partial Pearson’s correlations, adjusted for chronological age and study centre. * indicates p<0.05. Source data for reproducing plots is provided in Figure 3—source data 1.
-
Figure 3—source data 1
Source data for reproducing Figure 3.
- https://cdn.elifesciences.org/articles/85104/elife-85104-fig3-data1-v2.csv
Figure 4 with 6 supplements

Associations between biological age measures and developmental measures.
Estimates were calculated using linear regression, adjusted for chronological age, sex, ethnicity, and study centre. *indicates FDR <5%. Telomere length is expressed as a standard deviation (SD) decrease in length (multiplied by –1) to provide estimates indicative of accelerated biological age, as the other biological age indicators. Error bars show 95% confidence intervals. See Table 3 for numbers included in each analysis and exact point estimates and confidence intervals.
Figure 4—figure supplement 1
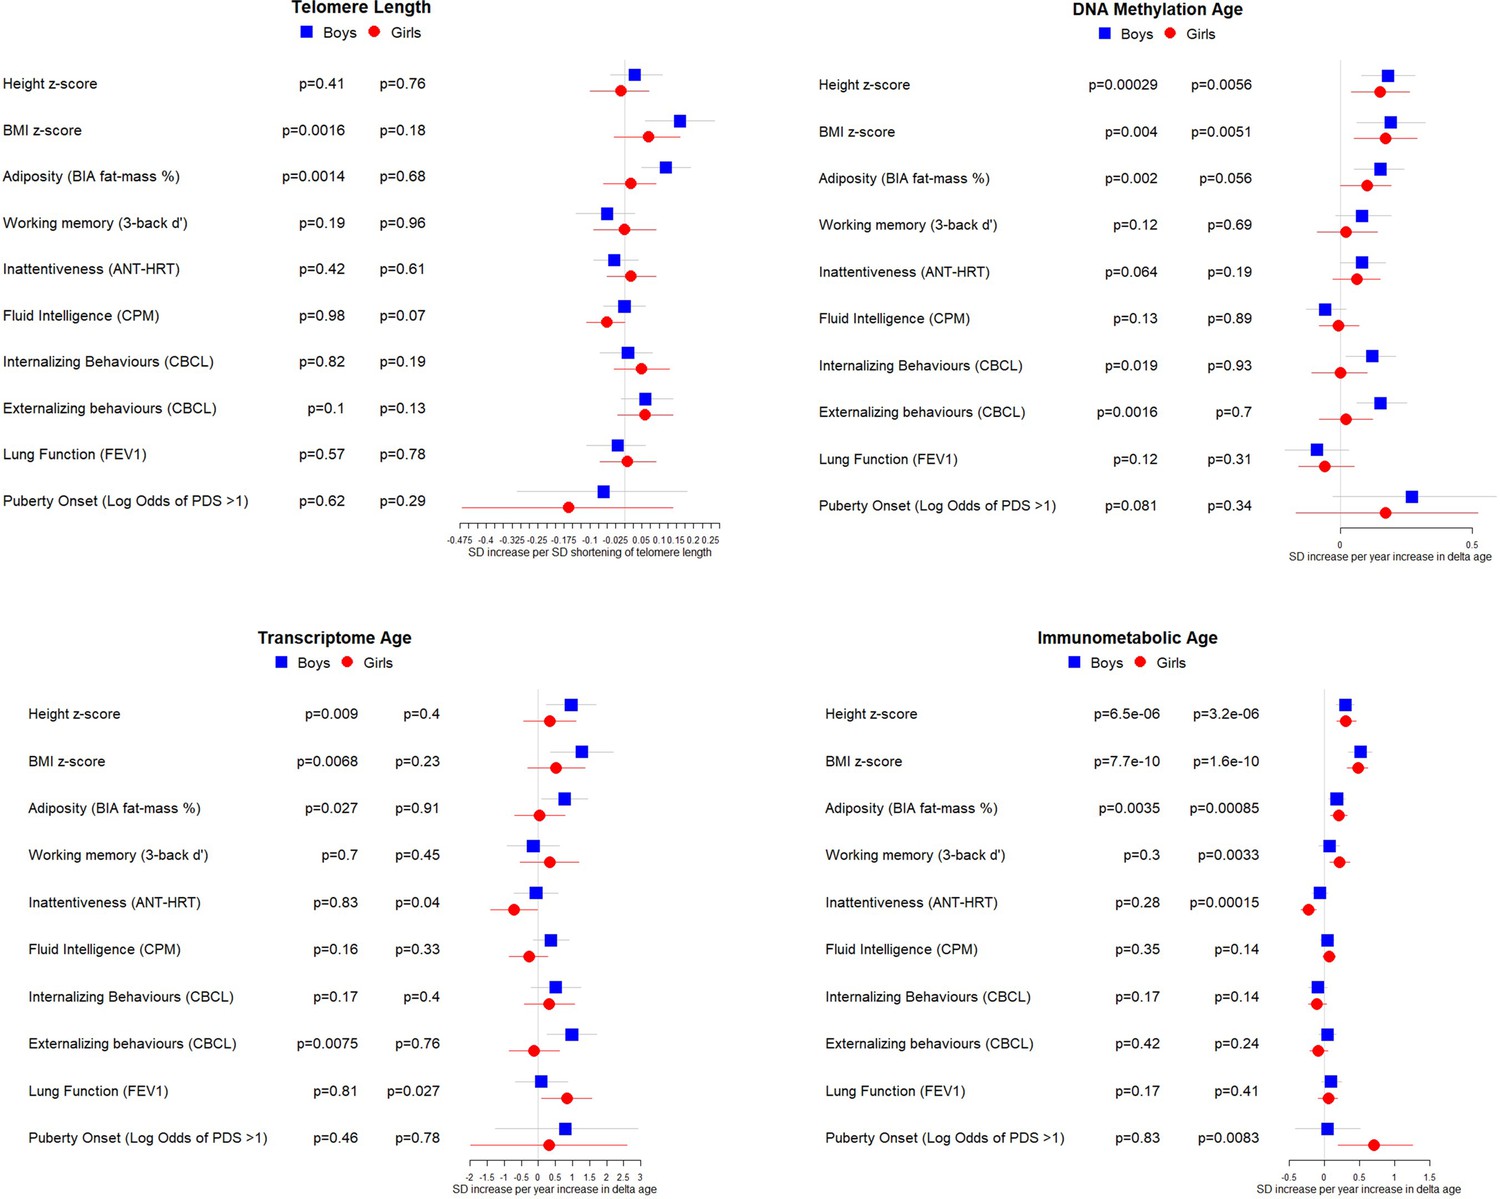
Associations between biological age measures and developmental measures, stratified by sex.
Estimates were calculated using linear regression, adjusted for chronological age, sex, ethnicity, and study centre. Telomere length is expressed as a % decrease in length (multiplied by –1) to provide estimates indicative of accelerated biological age, as for the other biological age indicators. Error bars show 95% confidence intervals.
Figure 4—figure supplement 2
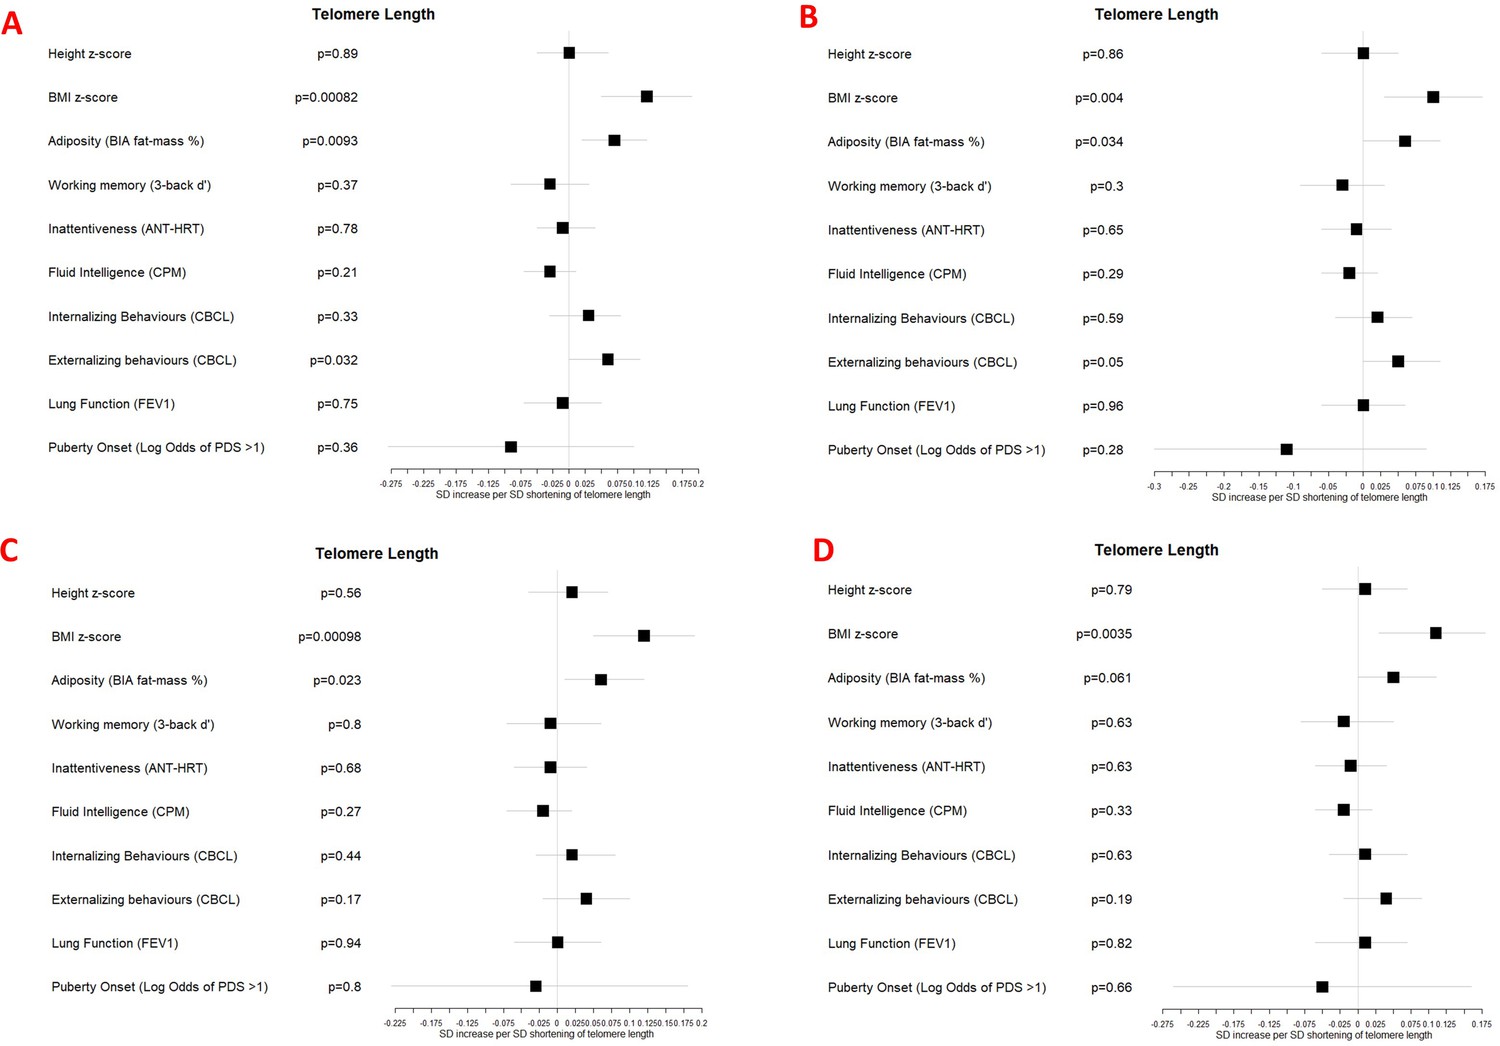
Associations between telomere length and developmental measures adjusted for (A) chronological age, sex, ethnicity, and study centre; (B) as for A plus estimated cell counts; (C) as for A plus family affluence and social capital, birthweight, maternal active smoking, and child passive smoking; (D) as for C plus estimated cell counts.
Error bars show 95% confidence intervals. Telomere length is expressed as a standard deviation decrease in length (multiplied by –1) to provide estimates indicative of accelerated biological age, as for the other biological age indicators.
Figure 4—figure supplement 3
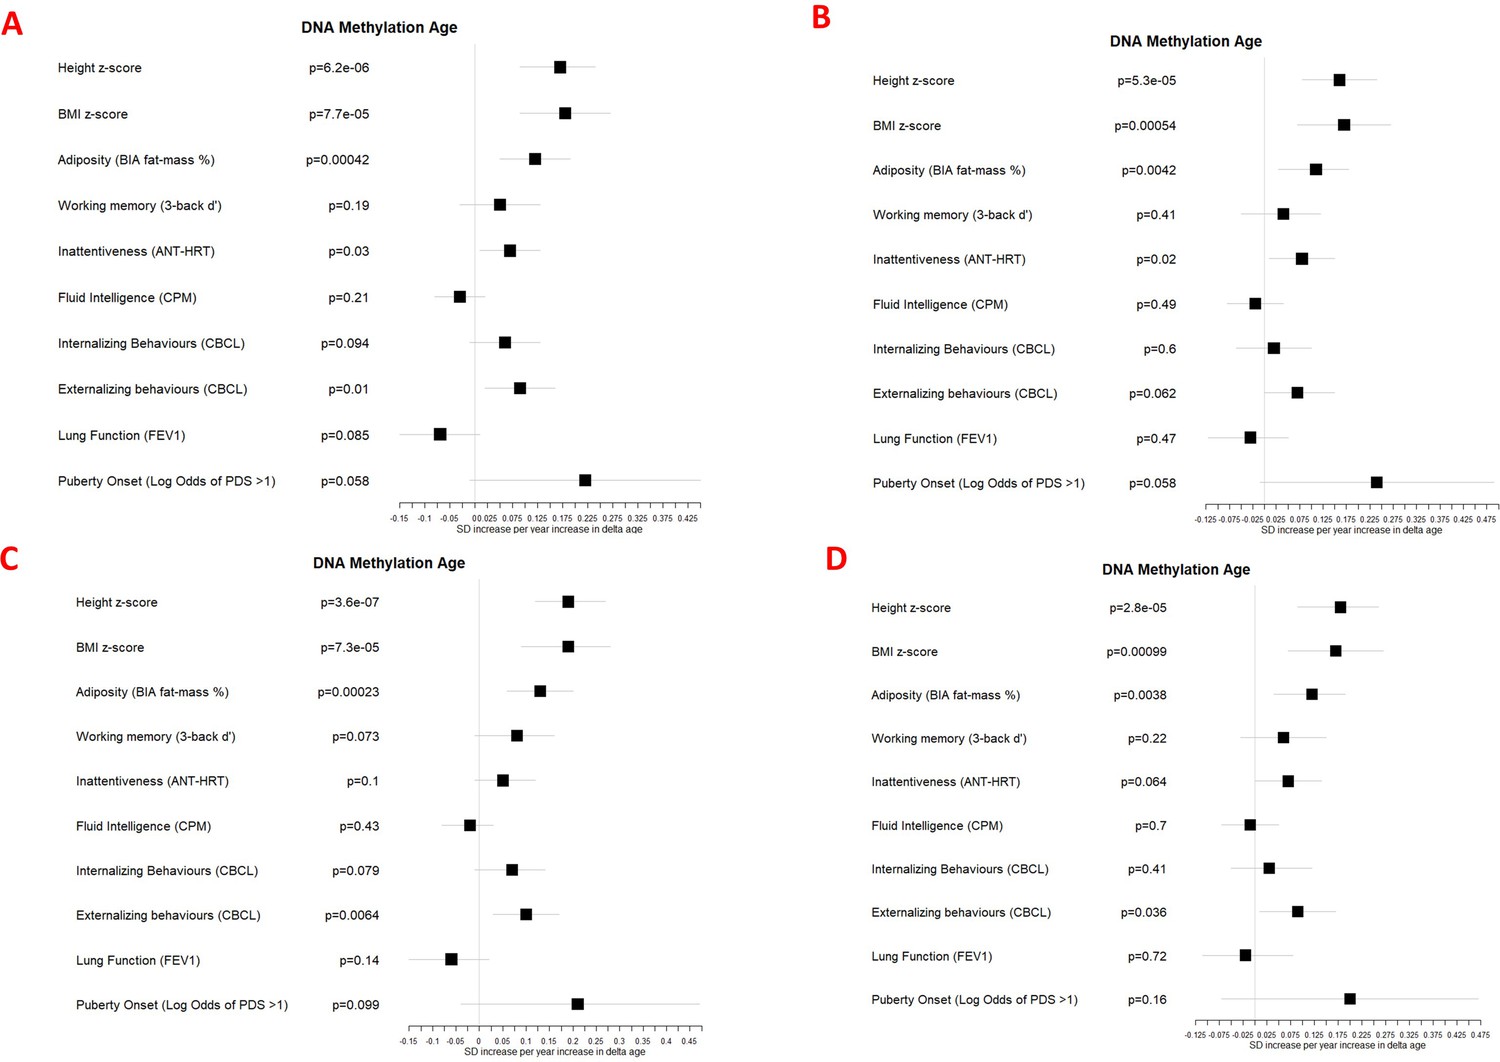
Associations between DNA methylation Δ age and developmental measures adjusted for (A) chronological age, sex, ethnicity, and study centre; (B) as for A plus estimated cell counts; (C) as for A plus family affluence and social capital, birthweight, maternal active smoking, and child passive smoking; (D) as for C plus estimated cell counts.
Error bars show 95% confidence intervals.
Figure 4—figure supplement 4
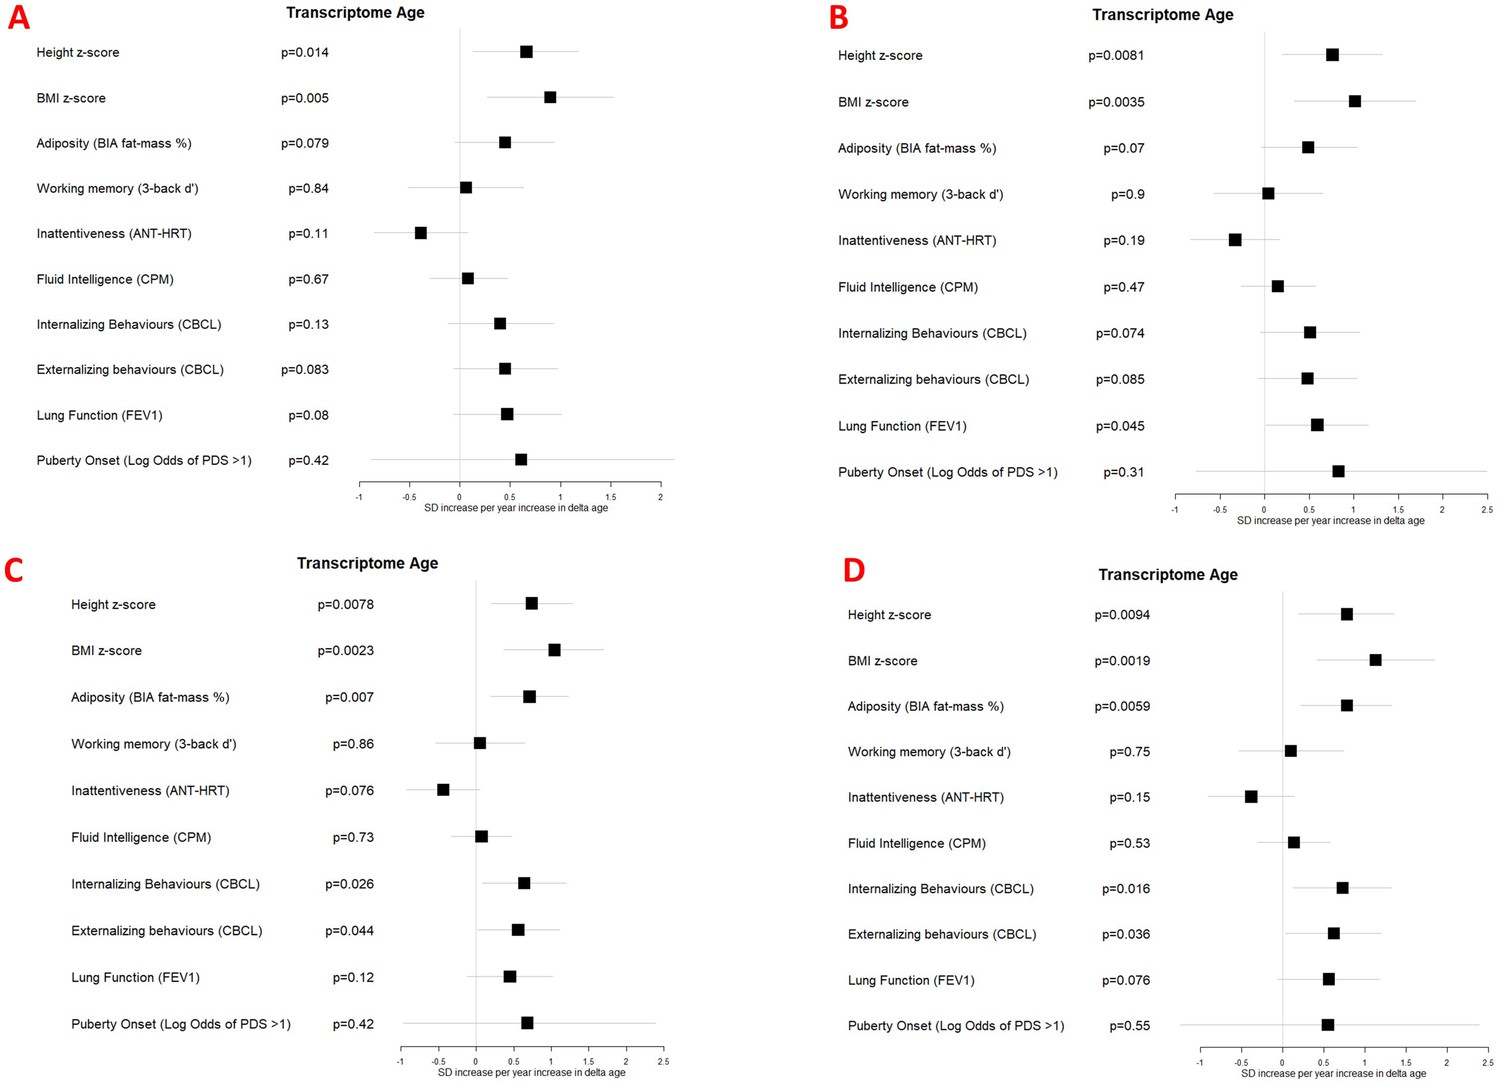
Associations between transcriptome Δ age and developmental measures adjusted for (A) chronological age, sex, ethnicity, and study centre; (B) as for A plus estimated cell counts; (C) as for A plus family affluence and social capital, birthweight, maternal active smoking, and child passive smoking; (D) as for C plus estimated cell counts.
Error bars show 95% confidence intervals.
Figure 4—figure supplement 5
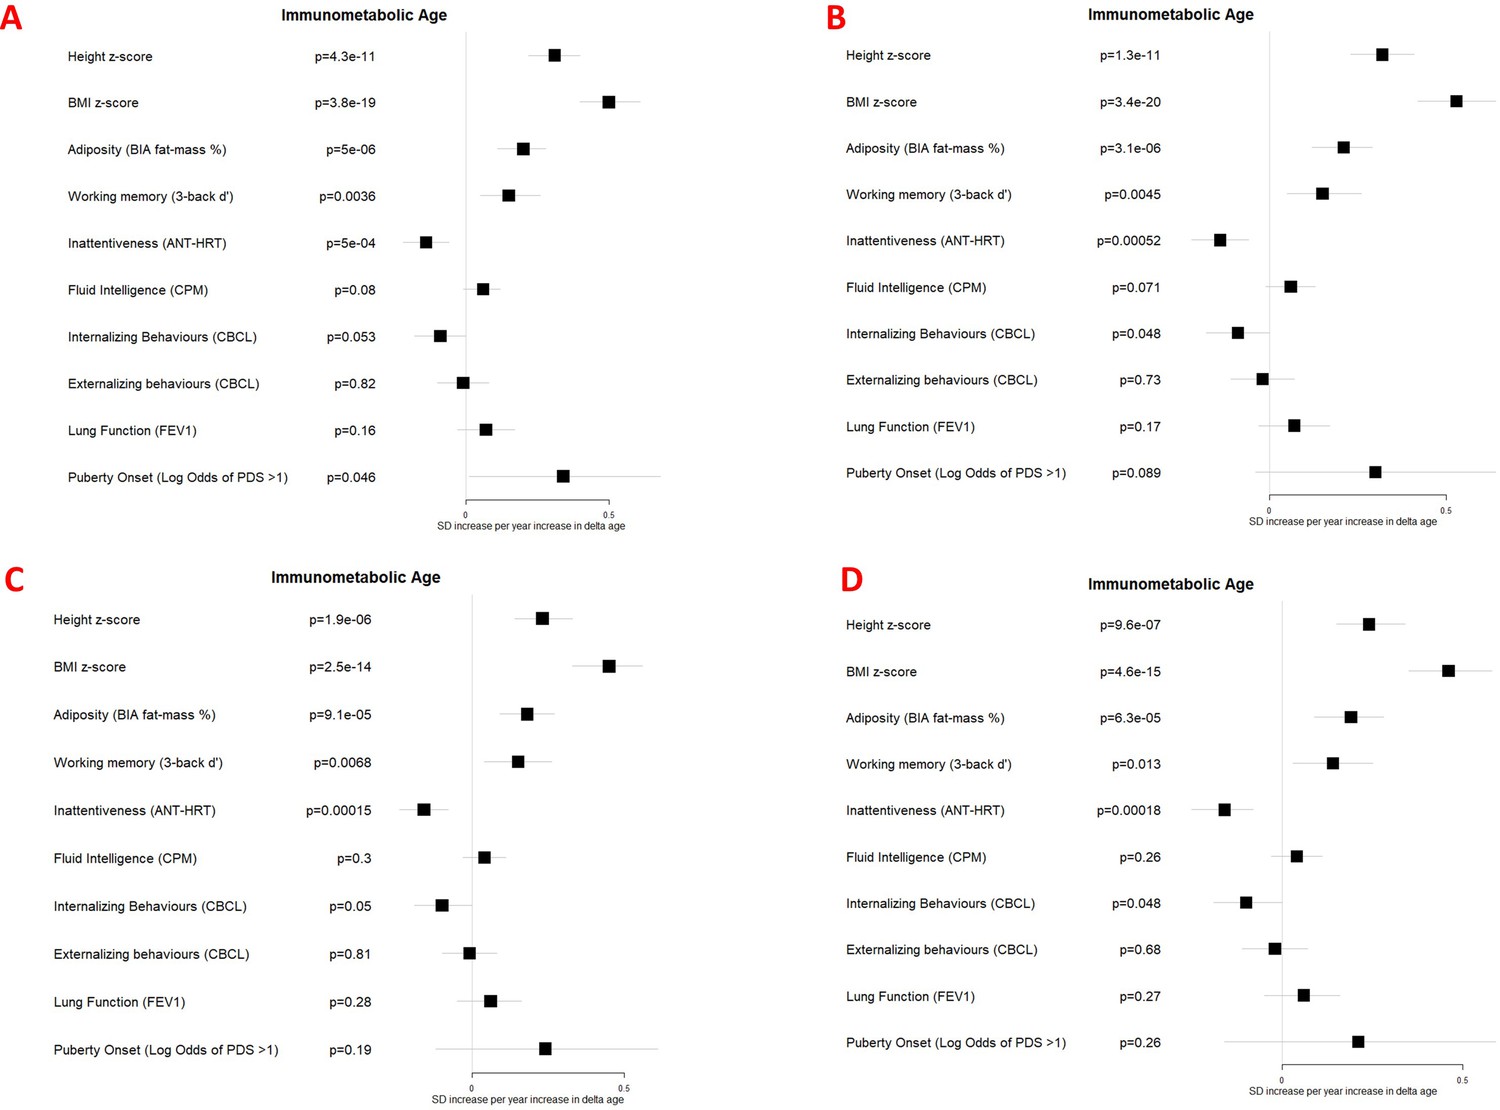
Associations between immunometabolic Δ age and developmental measures adjusted for (A) chronological age, sex, ethnicity, and study centre; (B) as for A plus estimated cell counts; (C) as for A plus family affluence and social capital, birthweight, maternal active smoking, and child passive smoking; (D) as for C plus estimated cell counts.
Error bars show 95% confidence intervals.
Figure 4—figure supplement 6
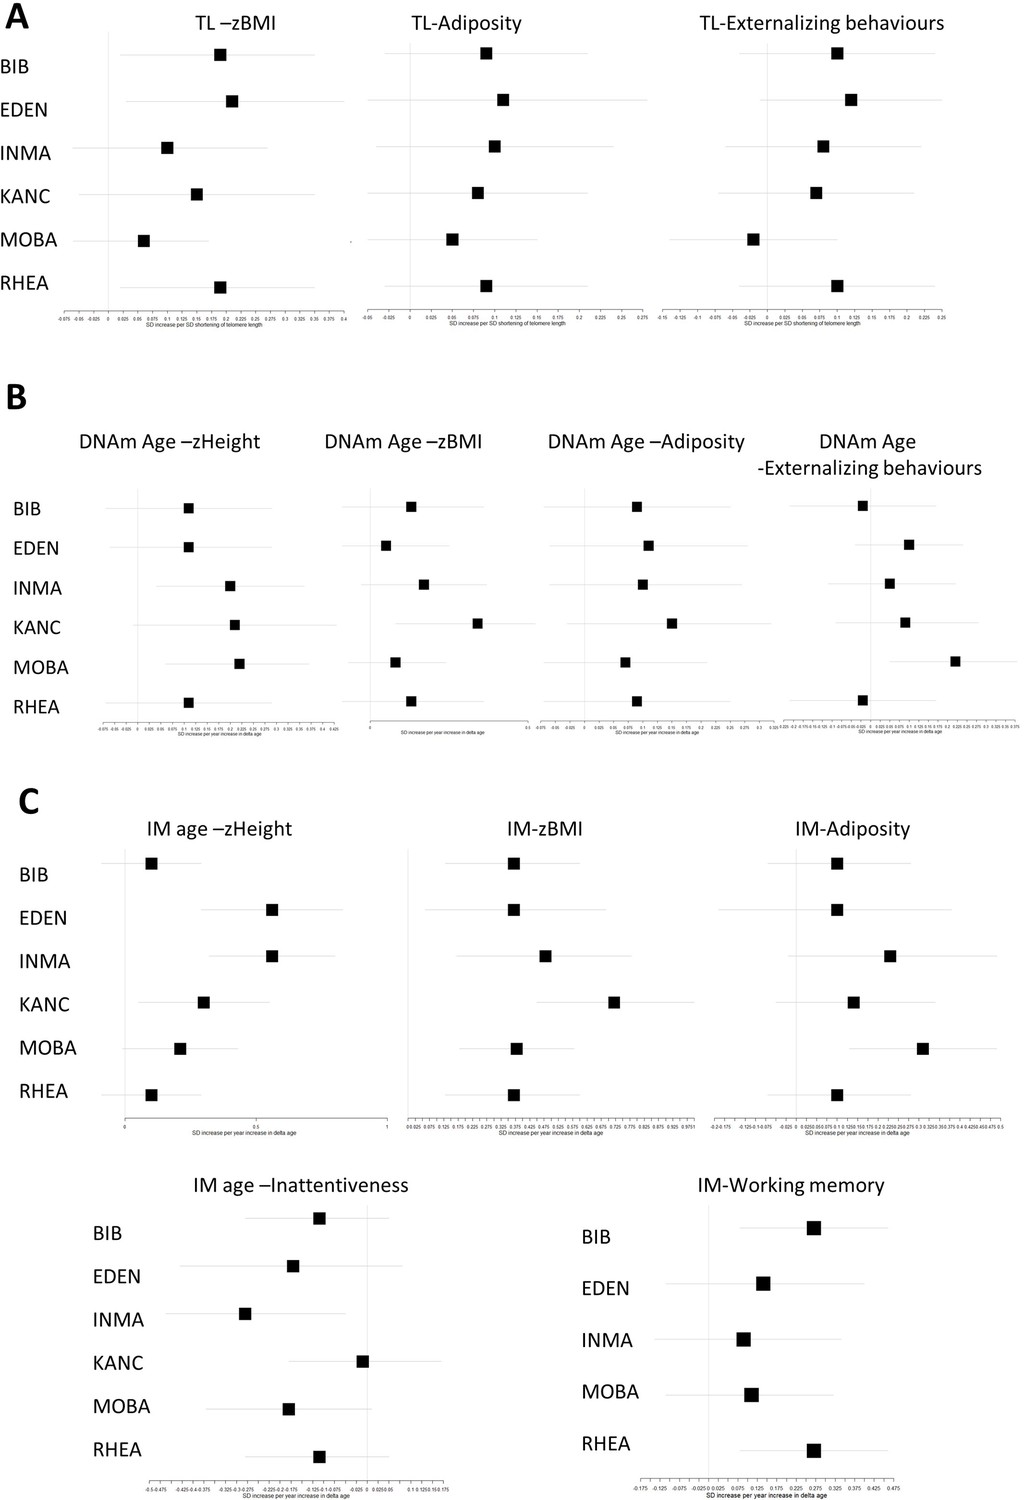
Associations between biological age measures and developmental measures, stratified by study centre (adjusted for chronological age, sex, and ethnicity).
Error bars show 95% confidence intervals. Associations at least at p<0.05 in the pooled analysis are shown for (A) telomere length (TL), (B) DNA methylation (DNAm) age, and (C) Immunometabolic (IM) age.
Tables
Table 1
Summary Statistics for the study population.
| Telomere Length | DNA methylation age | Trancript-ome age | Immuno-metabolic age | |
|---|---|---|---|---|
| N (%) or Mean (SD) | N (%) or Mean (SD) | N (%) or Mean (SD) | N (%) or Mean (SD) | |
| N | 1162 | 1173 | 1007 | 1152 |
| Demographic factors | ||||
| Age (years) | 7.84 (1.54) | 7.84 (1.54) | 7.90 (1.50) | 7.86 (1.55) |
| Sex-Male | 639 (55) | 644 (54.9) | 547 (54.3) | 628 (54.5) |
| Sex-Female | 523 (45) | 529 (45.1) | 460 (45.7) | 524 (45.5) |
| Ethnicity-White | 1039 (89.4) | 1048 (89.3) | 905 (89.9) | 1032 (89.6) |
| Ethnicity-Pakistani/Asian | 96 (8.3) | 98 (8.4) | 76 (7.5) | 93 (8.1) |
| Ethnicity -Other | 27 (2.3) | 27 (2.3) | 26 (2.6) | 27 (2.3) |
| Cohort-BIB | 200 (17.2) | 203 (17.3) | 162 (16.1) | 191 (16.6) |
| Cohort-EDEN | 145 (12.5) | 146 (12.4) | 109 (10.8) | 149 (12.9) |
| Cohort-INMA | 212 (18.2) | 215 (18.3) | 184 (18.3) | 201 (17.4) |
| Cohort-KANC | 196 (16.9) | 198 (16.9) | 151 (15) | 197 (17.1) |
| Cohort-MOBA | 211 (18.2) | 212 (18.1) | 245 (24.3) | 222 (19.3) |
| Cohort-RHEA | 198 (17) | 199 (17) | 156 (15.5) | 192 (16.7) |
| Prenatal factors | ||||
| maternal non-active smoker during pregnancy | 988 (85) | 998 (85.1) | 859 (85.3) | 981 (85.2) |
| Maternal active smoker during pregnancy | 174 (15) | 175 (14.9) | 148 (14.7) | 171 (14.8) |
| Birthweight (kg) | 3.37 (0.5) | 3.37 (0.5) | 3.38 (0.52) | 3.38 (0.5) |
| Gestational age (weeks) | 39.57 (1.67) | 39.58 (1.67) | 39.59 (1.75) | 39.59 (1.66) |
| Family Capital | ||||
| Maternal Education (low) | 165 (14.7) | 166 (14.7) | 140 (14.4) | 157 (14.1) |
| Maternal Education (medium) | 391 (34.8) | 394 (34.8) | 328 (33.8) | 391 (35.1) |
| Maternal Education (high) | 568 (50.5) | 573 (50.6) | 503 (51.8) | 565 (50.8) |
| Family Affluence (low) | 133 (11.5) | 135 (11.5) | 112 (11.1) | 128 (11.1) |
| Family Affluence (medium) | 462 (39.8) | 466 (39.8) | 394 (39.2) | 450 (39.1) |
| Family Affluence (high) | 565 (48.7) | 570 (48.7) | 499 (49.7) | 572 (49.7) |
| Family Social Capital (low) | 513 (47.7) | 516 (47.5) | 422 (45.8) | 496 (46.7) |
| Family Social Capital (medium) | 264 (24.6) | 269 (24.8) | 228 (24.7) | 259 (24.4) |
| Family Social Capital (high) | 298 (27.7) | 301 (27.7) | 272 (29.5) | 307 (28.9) |
| Child factors | ||||
| No passive smoke exposure | 723 (63.8) | 732 (63.9) | 639 (64.5) | 718 (63.8) |
| Passive smoke exposure | 411 (36.2) | 413 (36.1) | 351 (35.5) | 407 (36.2) |
| Physical Activity-Low | 418 (36.9) | 420 (36.8) | 349 (35.3) | 416 (37.1) |
| Physical Activity-Medium | 336 (29.7) | 341 (29.9) | 295 (29.9) | 330 (29.4) |
| Physical Activity-High | 378 (33.4) | 381 (33.4) | 344 (34.8) | 375 (33.5) |
| KIDMED diet score | 2.81 (1.77) | 2.82 (1.78) | 2.88 (1.77) | 2.84 (1.76) |
| Developmental measures | ||||
| Height z-score | 0.4 (0.97) | 0.39 (0.98) | 0.39 (0.96) | 0.4 (0.98) |
| BMI z-score | 0.43 (1.2) | 0.43 (1.2) | 0.4 (1.15) | 0.42 (1.18) |
| Adiposity (BIA fat-mass %) | 6.76 (4.01) | 6.77 (4.01) | 6.52 (3.9) | 6.72 (3.95) |
| Working memory (3-back d') | 1.1 (1.01) | 1.1 (1.01) | 1.13 (1) | 1.1 (1.01) |
| Inattentiveness (ANT-HRT) | 301.97 (90.38) | 301.93 (90.46) | 297.69 (89.36) | 301.35 (89.84) |
| Fluid Intelligence (CPM) | 25.87 (6.33) | 25.86 (6.32) | 26.12 (6.26) | 25.95 (6.3) |
| Internalizing behaviors (CBCL) | 6.49 (5.9) | 6.48 (5.9) | 6.36 (5.89) | 6.52 (5.87) |
| Externalizing behaviors (CBCL) | 6.81 (6.5) | 6.82 (6.51) | 6.67 (6.49) | 6.74 (6.42) |
| Lung Function (FEV1) | 99.26 (13.46) | 99.25 (13.47) | 99.16 (13.02) | 99.17 (13.47) |
| Puberty not started | 250 (46.6) | 252 (46.5) | 254 (49.7) | 260 (48) |
| Puberty started (PDS >1) | 287 (53.4) | 290 (53.5) | 257 (50.3) | 282 (52) |
Table 2
Associations between health risk factors and biological age measures.
Estimates were calculated using linear regression, adjusted for chronological age, sex, ethnicity, and study centre. Bold indicates p<0.05 and *indicates FDR <5%. Telomere length is expressed as a standard deviation (SD) decrease in length (multiplied by –1) to provide estimates indicative of accelerated biological age, as the other biological age indicators. Telomere Length N=1162, DNA methylation age N=1173, Transcriptome age N=1007, Immunometabolic age N=1152.
| Telomere Length | DNA methylation age | TranScriptome age | Immunometabolic age | |||||
|---|---|---|---|---|---|---|---|---|
| SD Decrease (95% CI) | p-value | Increase in years Δ Age (95% CI) | p-value | Increase in years Δ Age (95% CI) | p-value | Increase in years Δ Age (95% CI) | p-value | |
| Sex-Male | - | - | - | - | - | - | - | - |
| Sex-Female | –0.27 (-0.39,–0.16) | 3.30E-06* | 0.07 (-0.01, 0.16) | 0.1 | 0 (-0.01, 0.02) | 0.73 | 0.06 (-0.01, 0.13) | 0.086 |
| Prenatal factors | ||||||||
| maternal non-active smoker during pregnancy | - | - | - | - | - | - | - | - |
| Maternal active smoker during pregnancy | 0.07 (-0.1, 0.23) | 0.41 | 0.15 (0.03, 0.28) | 0.018 | 0 (-0.02, 0.02) | 0.88 | –0.04 (-0.14, 0.06) | 0.43 |
| Birthweight (kg) | –0.098 (-0.218, 0.023) | 0.11 | –0.021 (-0.114, 0.072) | 0.66 | 0.005 (-0.01, 0.02) | 0.51 | 0.102 (0.027, 0.177) | 0.0075 |
| Gestational age (weeks) | –0.012 (-0.048, 0.024) | 0.52 | 0.013 (-0.015, 0.041) | 0.35 | 0 (-0.005, 0.004) | 0.89 | 0.018 (-0.005, 0.04) | 0.12 |
| Family Capital | ||||||||
| Maternal Education (low) | - | - | - | - | - | - | - | - |
| Maternal Education (medium) | –0.06 (-0.26, 0.13) | 0.53 | 0.02 (-0.14, 0.17) | 0.84 | 0.01 (-0.02, 0.03) | 0.61 | 0.08 (-0.04, 0.2) | 0.21 |
| Maternal Education (high) | –0.1 (-0.29, 0.1) | 0.32 | –0.07 (-0.22, 0.08) | 0.37 | 0 (-0.02, 0.03) | 0.85 | 0.12 (0, 0.24) | 0.051 |
| Family Affluence (low) | - | - | - | - | - | - | - | - |
| Family Affluence (medium) | –0.15 (-0.34, 0.05) | 0.13 | –0.11 (-0.26, 0.03) | 0.13 | 0 (-0.03, 0.02) | 0.85 | 0.02 (-0.1, 0.14) | 0.8 |
| Family Affluence (high) | –0.27 (-0.47,–0.07) | 0.0081 | –0.14 (-0.29, 0.02) | 0.083 | 0.01 (-0.01, 0.04) | 0.35 | 0.09 (-0.04, 0.21) | 0.17 |
| Family Social Capital (low) | - | - | - | - | - | - | - | - |
| Family Social Capital (medium) | –0.06 (-0.21, 0.09) | 0.45 | –0.03 (-0.14, 0.09) | 0.62 | 0.02 (0.01, 0.04) | 0.012 | –0.04 (-0.14, 0.05) | 0.36 |
| Family Social Capital (high) | –0.15 (-0.3, 0) | 0.054 | –0.12 (-0.23, 0) | 0.048 | 0.02 (0.01, 0.04) | 0.011 | –0.06 (-0.15, 0.04) | 0.25 |
| Child factors | ||||||||
| No passive smoke exposure | - | - | - | - | - | - | - | - |
| Passive smoke exposure | 0.05 (-0.08, 0.18) | 0.42 | 0.11 (0.02, 0.21) | 0.023 | 0.01 (0, 0.03) | 0.16 | –0.01 (-0.09, 0.07) | 0.76 |
| Physical Activity-Low | - | - | - | - | - | - | - | - |
| Physical Activity-Medium | 0.09 (-0.06, 0.23) | 0.25 | –0.08 (-0.2, 0.03) | 0.15 | –0.01 (-0.03, 0.01) | 0.17 | 0.03 (-0.06, 0.12) | 0.56 |
| Physical Activity-High | 0.14 (-0.01, 0.29) | 0.067 | –0.1 (-0.22, 0.01) | 0.08 | 0 (-0.02, 0.01) | 0.69 | –0.06 (-0.15, 0.04) | 0.24 |
| KIDMED diet score | –0.03 (-0.064, 0.005) | 0.092 | 0.005 (-0.022, 0.031) | 0.74 | 0.004 (-0.001, 0.008) | 0.10 | –0.005 (-0.027, 0.016) | 0.64 |
Table 3
Associations between biological age measures and developmental measures.
Estimates were calculated using linear regression, adjusted for chronological age, sex, ethnicity, and study centre.
| Telomere Length | DNA methylation age | Transcriptome age | Immunometabolic age | |||||||||
|---|---|---|---|---|---|---|---|---|---|---|---|---|
| N | SD increase / odds ratio * per SD shortening (95% CI) | p-value | N | SD increase / odds ratio per year increase in Δ age (95% CI) | p-value | N | SD increase / odds ratio per year increase in Δ age (95% CI) | p-value | N | SD increase/ odds ratio per year increase in Δ age (95% CI) | p-value | |
| Height z-score | 1162 | 0 (-0.05, 0.06) | 0.89 | 1173 | 0.17 (0.09, 0.24) | 6.20E-06* | 1007 | 0.66 (0.13, 1.18) | 0.014 | 1152 | 0.31 (0.22, 0.4) | 4.30E-11* |
| BMI z-score | 1162 | 0.12 (0.05, 0.19) | 0.00082* | 1173 | 0.18 (0.09, 0.27) | 7.70E-05* | 1007 | 0.9 (0.27, 1.53) | 0.005* | 1152 | 0.5 (0.4, 0.61) | 3.80E-19* |
| Adiposity (BIA fat-mass %) | 1153 | 0.07 (0.02, 0.12) | 0.0093* | 1164 | 0.12 (0.05, 0.19) | 0.0004* | 999 | 0.45 (-0.05, 0.94) | 0.079 | 1144 | 0.2 (0.11, 0.28) | 5.00E-06* |
| Working memory (3-back d’) † | 882 | –0.03 (-0.09, 0.03) | 0.37 | 890 | 0.05 (-0.03, 0.13) | 0.19 | 784 | 0.06 (-0.51, 0.63) | 0.84 | 876 | 0.15 (0.05, 0.26) | 0.0036* |
| Inattentiveness (ANT-HRT) | 1142 | –0.01 (-0.05, 0.04) | 0.78 | 1153 | 0.07 (0.01, 0.13) | 0.03 | 997 | –0.39 (-0.85, 0.08) | 0.11 | 1135 | –0.14 (-0.22,–0.06) | 5.00E-04* |
| Fluid Intelligence (CPM) | 1156 | –0.03 (-0.07, 0.01) | 0.21 | 1167 | –0.03 (-0.08, 0.02) | 0.21 | 1001 | 0.08 (-0.3, 0.47) | 0.67 | 1147 | 0.06 (-0.01, 0.12) | 0.08 |
| Internalizing Behaviors (CBCL) | 1156 | 0.03 (-0.03, 0.08) | 0.33 | 1166 | 0.06 (-0.01, 0.13) | 0.094 | 1002 | 0.4 (-0.12, 0.93) | 0.13 | 1146 | –0.09 (-0.18, 0) | 0.053 |
| Externalizing behaviors (CBCL) | 1156 | 0.06 (0, 0.11) | 0.032 | 1166 | 0.09 (0.02, 0.16) | 0.01 | 1002 | 0.45 (-0.06, 0.97) | 0.083 | 1146 | –0.01 (-0.1, 0.08) | 0.82 |
| Lung Function (FEV1) | 911 | –0.01 (-0.07, 0.05) | 0.75 | 921 | –0.07 (-0.15, 0.01) | 0.085 | 795 | 0.47 (-0.06, 1.01) | 0.08 | 907 | 0.07 (-0.03, 0.17) | 0.16 |
| Puberty onset ‡ | 537 | 0.92 (0.76, 1.11) | 0.36 | 542 | 1.25 (0.99, 1.57) | 0.058 | 511 | 1.84 (0.41, 8.44) | 0.42 | 542 | 1.41 (1.01, 1.97) | 0.046 |
-
Bold indicates p<0.05 and *indicates FDR <5%.
-
*
Odds ratio provided for puberty onset only.
-
†
Not available in the Lithuanian KANC cohort.
-
‡
Only assessed in children over 8 years old.
Additional files
-
MDAR checklist
- https://cdn.elifesciences.org/articles/85104/elife-85104-mdarchecklist1-v2.docx
-
Source code 1
R script for all data analyses.
- https://cdn.elifesciences.org/articles/85104/elife-85104-code1-v2.zip
-
Supplementary file 1
Number of samples and features before and after the quality control process.
- https://cdn.elifesciences.org/articles/85104/elife-85104-supp1-v2.xlsx
-
Supplementary file 2
Proportion of covariates missing for each biological age marker.
- https://cdn.elifesciences.org/articles/85104/elife-85104-supp2-v2.xlsx
-
Supplementary file 3
Immunometabolic age clock coefficients.
- https://cdn.elifesciences.org/articles/85104/elife-85104-supp3-v2.xlsx
-
Supplementary file 4
Trancriptome age clock coefficients.
- https://cdn.elifesciences.org/articles/85104/elife-85104-supp4-v2.xlsx
-
Supplementary file 5
Overrepresentation analysis in ConsesuspathDB against KEGG and REACTOME pathways, of all transcripts contributing to the transcriptome clock.
- https://cdn.elifesciences.org/articles/85104/elife-85104-supp5-v2.xlsx
-
Supplementary file 6
Overrepresentation analysis in ConsesuspathDB against Gene Ontology (GO) biological process terms, of all transcripts contributing to the transcriptome clock.
- https://cdn.elifesciences.org/articles/85104/elife-85104-supp6-v2.xlsx
-
Supplementary file 7
Associations between biological age measures and developmental measures, in main analysis (model 1) and sensitivity analyses (models 2-4).
- https://cdn.elifesciences.org/articles/85104/elife-85104-supp7-v2.xlsx
Download links
A two-part list of links to download the article, or parts of the article, in various formats.
Downloads (link to download the article as PDF)
Open citations (links to open the citations from this article in various online reference manager services)
Cite this article (links to download the citations from this article in formats compatible with various reference manager tools)
Associations of four biological age markers with child development: A multi-omic analysis in the European HELIX cohort
eLife 12:e85104.
https://doi.org/10.7554/eLife.85104


