Mating activates neuroendocrine pathways signaling hunger in Drosophila females
- University of California, Berkeley, United States
Figures
Figure 1
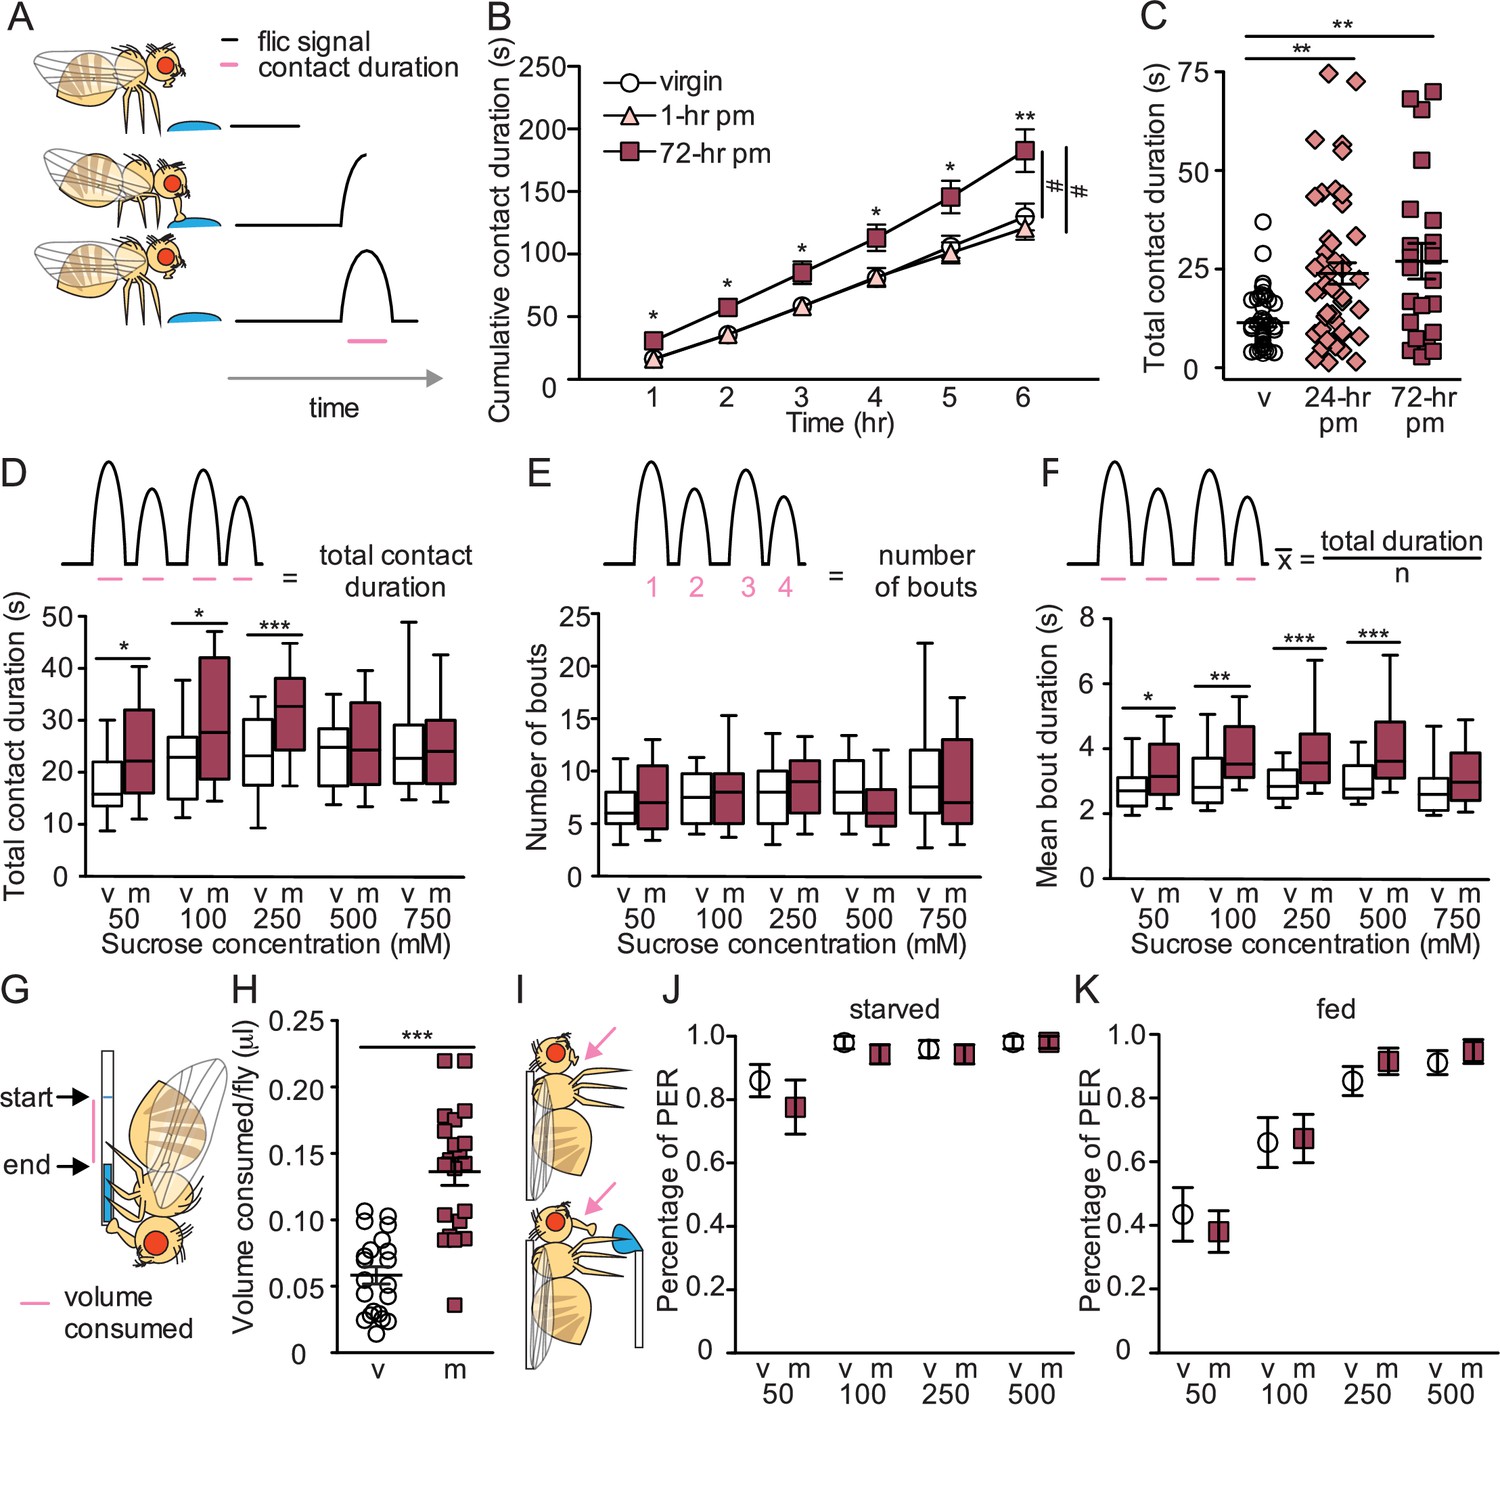
Mated females consume more sucrose than virgins by elongating feeding events.
(A) Schematic of fly feeding behavior (left) and the fly liquid interaction counter (FLIC) signal that monitors food contact over time (right). (B) Cumulative drinking time of 50 mM sucrose in FLIC of the virgin (white circles, n=34), 1 hr postmated (pm) (light pink triangles, n=30), and 72 hr pm (dark pink squares, n=28) females. Line graph shows mean and s.e.m. over time. Kruskal-Wallis was used to compare groups at hour intervals, Dunn’s post hoc at 6 hr, #p<0.05. (C) Total drinking time of 50 mM sucrose in FLIC in the 20 min assay of virgin (v; n=47), 24 hr pm (n=47), and 72 hr pm (n=22) females, Kruskal-Wallis, Dunn’s post hoc. (D–F) Schematic and plots of feeding behavior of virgin (v) and mated (m) females presented with sucrose of varying concentrations in FLIC 20 min assay (n=33–36) examining total drinking time (D), number of drinking bouts (E), and average bout duration (F). Box plots show first to third quartile, whiskers span 10–90 percentile, Mann-Whitney. (G) Schematic of female drinking from capillary containing sucrose solution in CAFE assay. (H) Total volume consumed of 50 mM sucrose in CAFE assay per fly in 24 hr by virgin (v, n=21) and mated females (m, n=21), unpaired t-test. (I) Schematic of proboscis extension response (PER) assay. (J and K) Percentage of proboscis extensions observed per fly upon three presentations of sucrose of indicated concentration (mM) in virgin (v) and mated (m) females in starved, n=17–18 (J) and fed state, n=16 (K), Mann-Whitney. *p<0.05, **p<0.01, ***p<0.001. Scatter plot shows mean +/− s.e.m. Column graph show mean +/− s.e.m. See Supplementary file 1 for full genotypes.
Figure 2
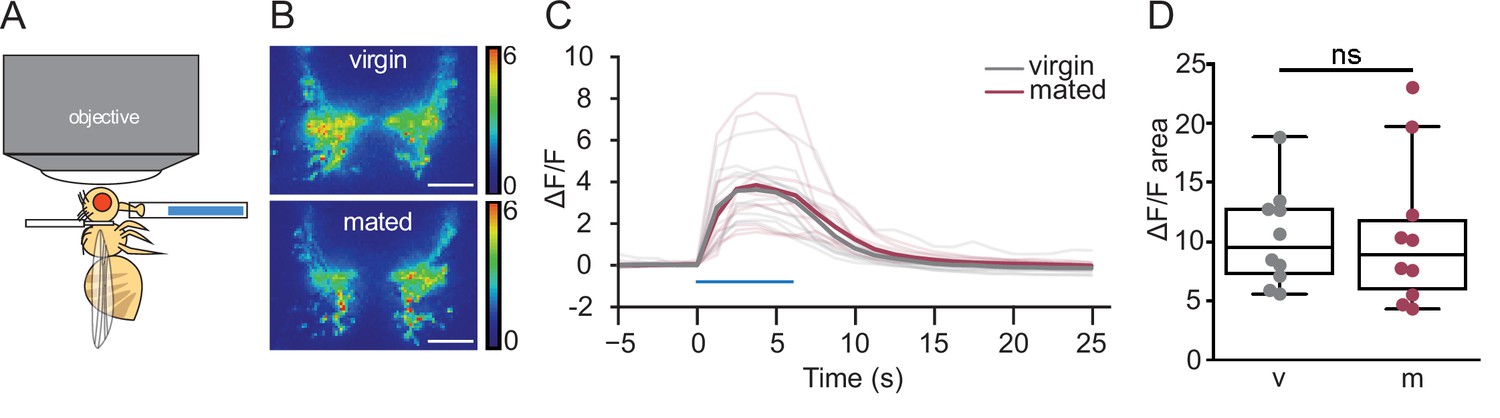
Mated and virgin females do not differ in taste-induced sugar gustatory sensory neuronal activity.
(A) Schematic of in vivo calcium imaging experiment monitoring taste-induced activity in gustatory axons. (B–D) Changes in GCaMP6s signal in virgin (gray) and mated (dark pink) females upon presentation of 250 mM sucrose, shown as representative fluorescent changes in single brains (B), changes over time (C), and area under the curve (D), n=10 per group. Blue bar represents proboscis sucrose stimulation, Wilcoxen Rank test. ns = not significant. Scatter plot shows raw data. Box and whisker plot shows median and quartiles. Scale bar 25 μm. See Supplementary file 1 for full genotypes.
Figure 3 with 3 supplements
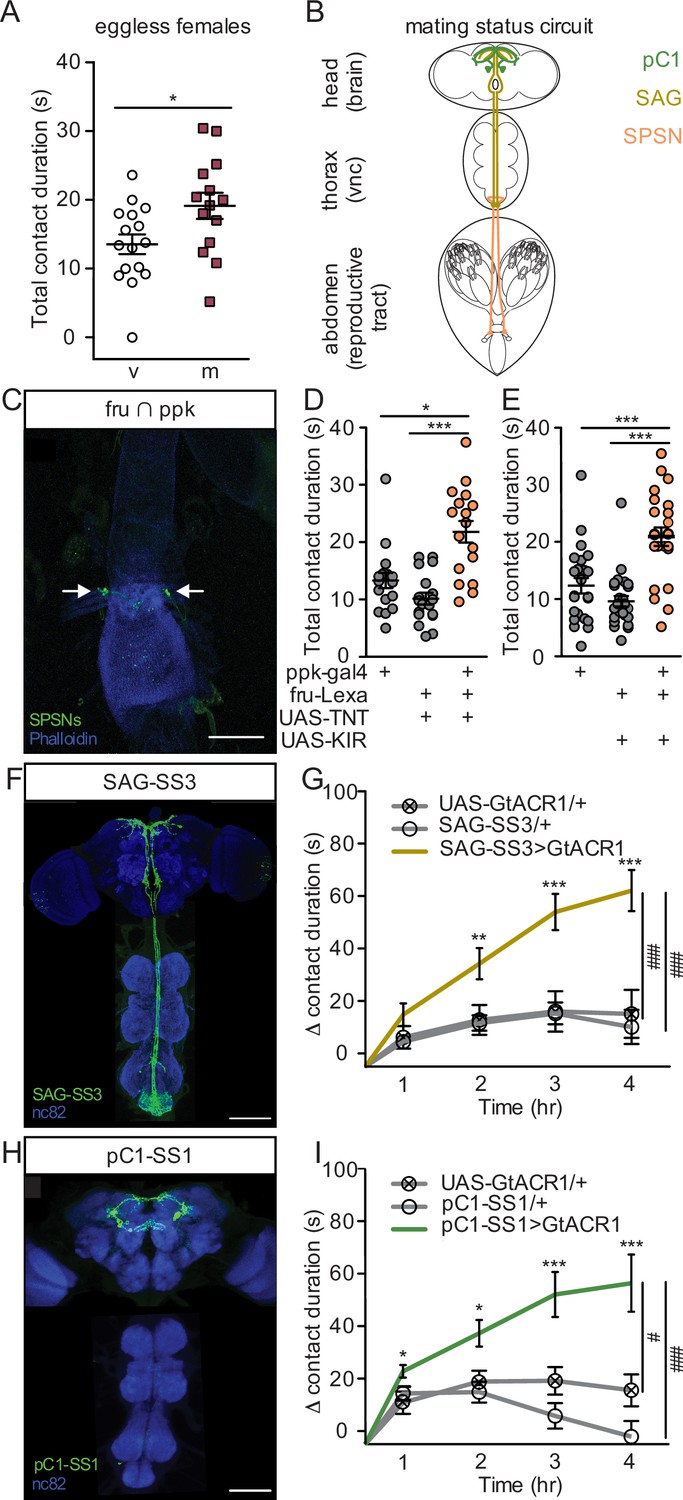
Postmated increases in sucrose consumption are induced by the canonical mating status circuit and are independent of egg-production.
(A) Total drinking time of 250 mM sucrose in fly liquid interaction counter (FLIC) in the 20-min assay of the eggless virgin (v, n=16) and eggless mated (m, n=15) females, Mann-Whitney. (B) Schematic of the female with the mating circuit, showing first order (sex peptide sensory neurons, SPSNs, pink-orange), second order (sex peptide abdominal ganglia, SAG, dark yellow), and third order (pC1, green) neurons. (C) Confocal image of uterus stained to reveal SPSNs (UAS-CD8:GFP, green, arrow indicating cell bodies) and muscle tissue (phalloidin, blue). (D and E) Total drinking time of 250 mM sucrose in FLIC in the 20-min assay of virgin females of indicated genotype (n=17–28), Kruskal-Wallis, Dunn’s post hoc. (F and H) Confocal images of the brain (top) and ventral nerve cord (bottom) of SAG-SS3 (F) and pC1-SS1 (H) females, stained to reveal neural projection pattern (UAS-mVenus, green) and all synapses (nc82, blue). (G and I) Drinking time of 250 mM sucrose by females exposed to light normalized to dark controls of indicated genotype in FLIC over 4 hr (each data point is the drinking time of an individual in the light condition minus the daily average drinking time of all females in dark condition within a genotype, n=17–39), Kruskal-Wallis, Dunn’s post hoc at 4 hr, #p<0.05, ###p<0.001. Line graphs show mean and s.e.m. over time. *p<0.05, **p<0.01, ***p<0.001. Scatter plot shows mean +/− s.e.m. Scale bar 50 μm. See Supplementary file 1 for full genotypes. See also Figure 3—figure supplement 1, Figure 3—figure supplement 2, and Figure 3—figure supplement 3.
Figure 3—figure supplement 1
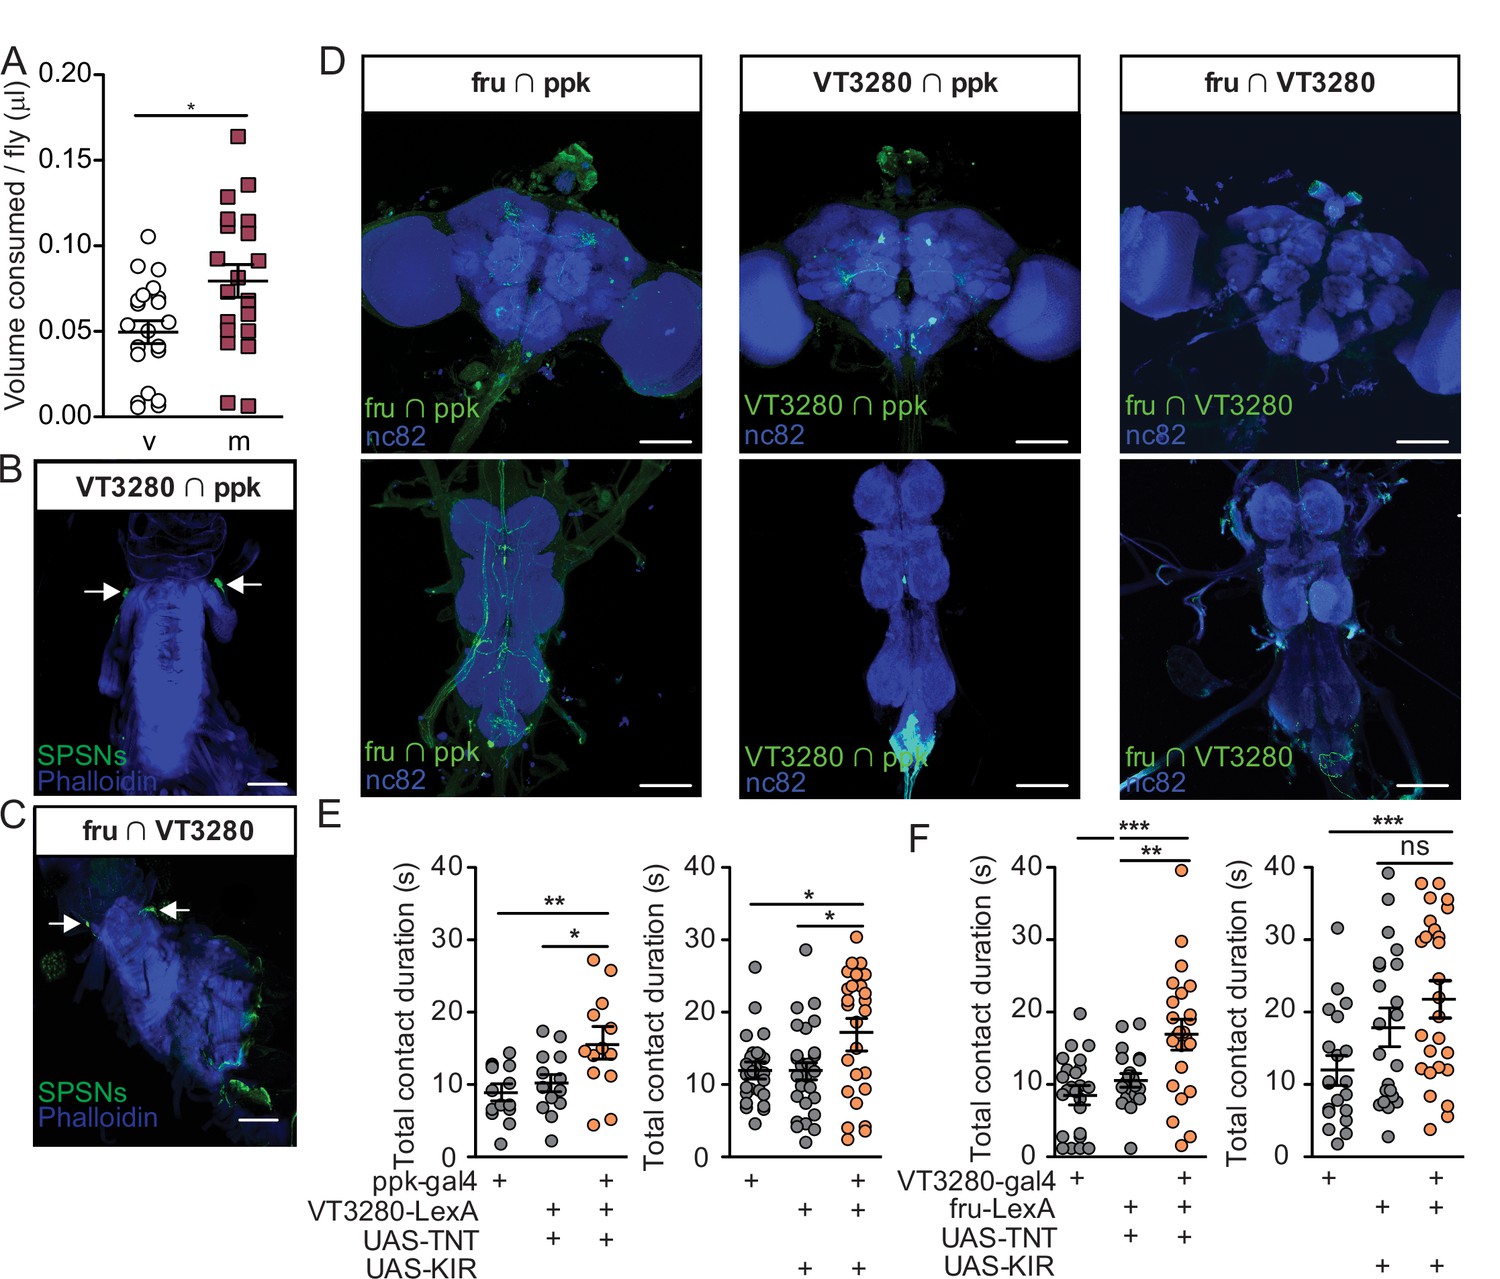
Three independent SPSN lines regulate postmated sucrose consumption.
(A) Total volume of 50 mM sucrose consumed per fly in CAFE assay by eggless virgin (v, n=21) and eggless mated females (m, n=20). *p<0.05, unpaired t-test. (B and C) Confocal image of uterus stained to reveal SPSNs (UAS-CD8:GFP, green, arrow indicating cell bodies) and muscle tissue (phalloidin, blue). (D) Confocal images of the brain (top) and ventral nerve cord (bottom) of genetic intersections accessing SPSNs stained to reveal off-target neurons in the central nervous system (UAS-GFP; green) and all synapses (nc82; blue). (E and F) Total drinking time in fly liquid interaction counter (FLIC) in the 20-min assay of virgin females of indicated genotype (n=19–41). Kruskal-Wallis with Dunn’s Multiple Comparison Test revealed differences between silenced females and controls. Scatter plot shows mean +/− s.e.m. Scale bar 50 μm.
Figure 3—figure supplement 2
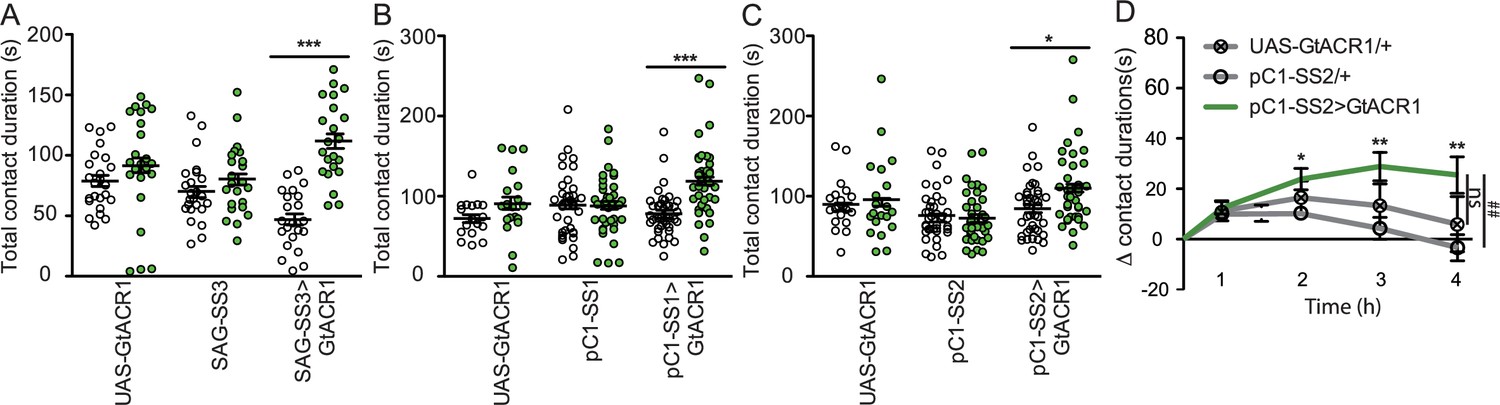
Contact duration times of virgin females upon optogenetic manipulation of neurons in the mating status circuit: sex peptide abdominal ganglia (SAG) and pC1.
(A–C) Total drinking time in fly liquid interaction counter (FLIC) in the 4-hr assay of females of indicated genotype and light condition. White circles are dark condition, green circles are green light condition, n=20–32. Scatter plot shows mean +/− s.e.m. Data were analyzed with two-way ANOVA and Bonferroni posttests, *p<0.05, ***p<0.001. (D) Drinking time of females exposed to light normalized to dark controls of indicated genotype in FLIC over 4 hr, n=20–24. Line graphs show mean and s.e.m. over time, Kruskal-Wallis, *p<0.05, **p<0.01. Dunn’s post hoc at 4 hr, ##p<0.01, ns = not significant.
Figure 3—figure supplement 3
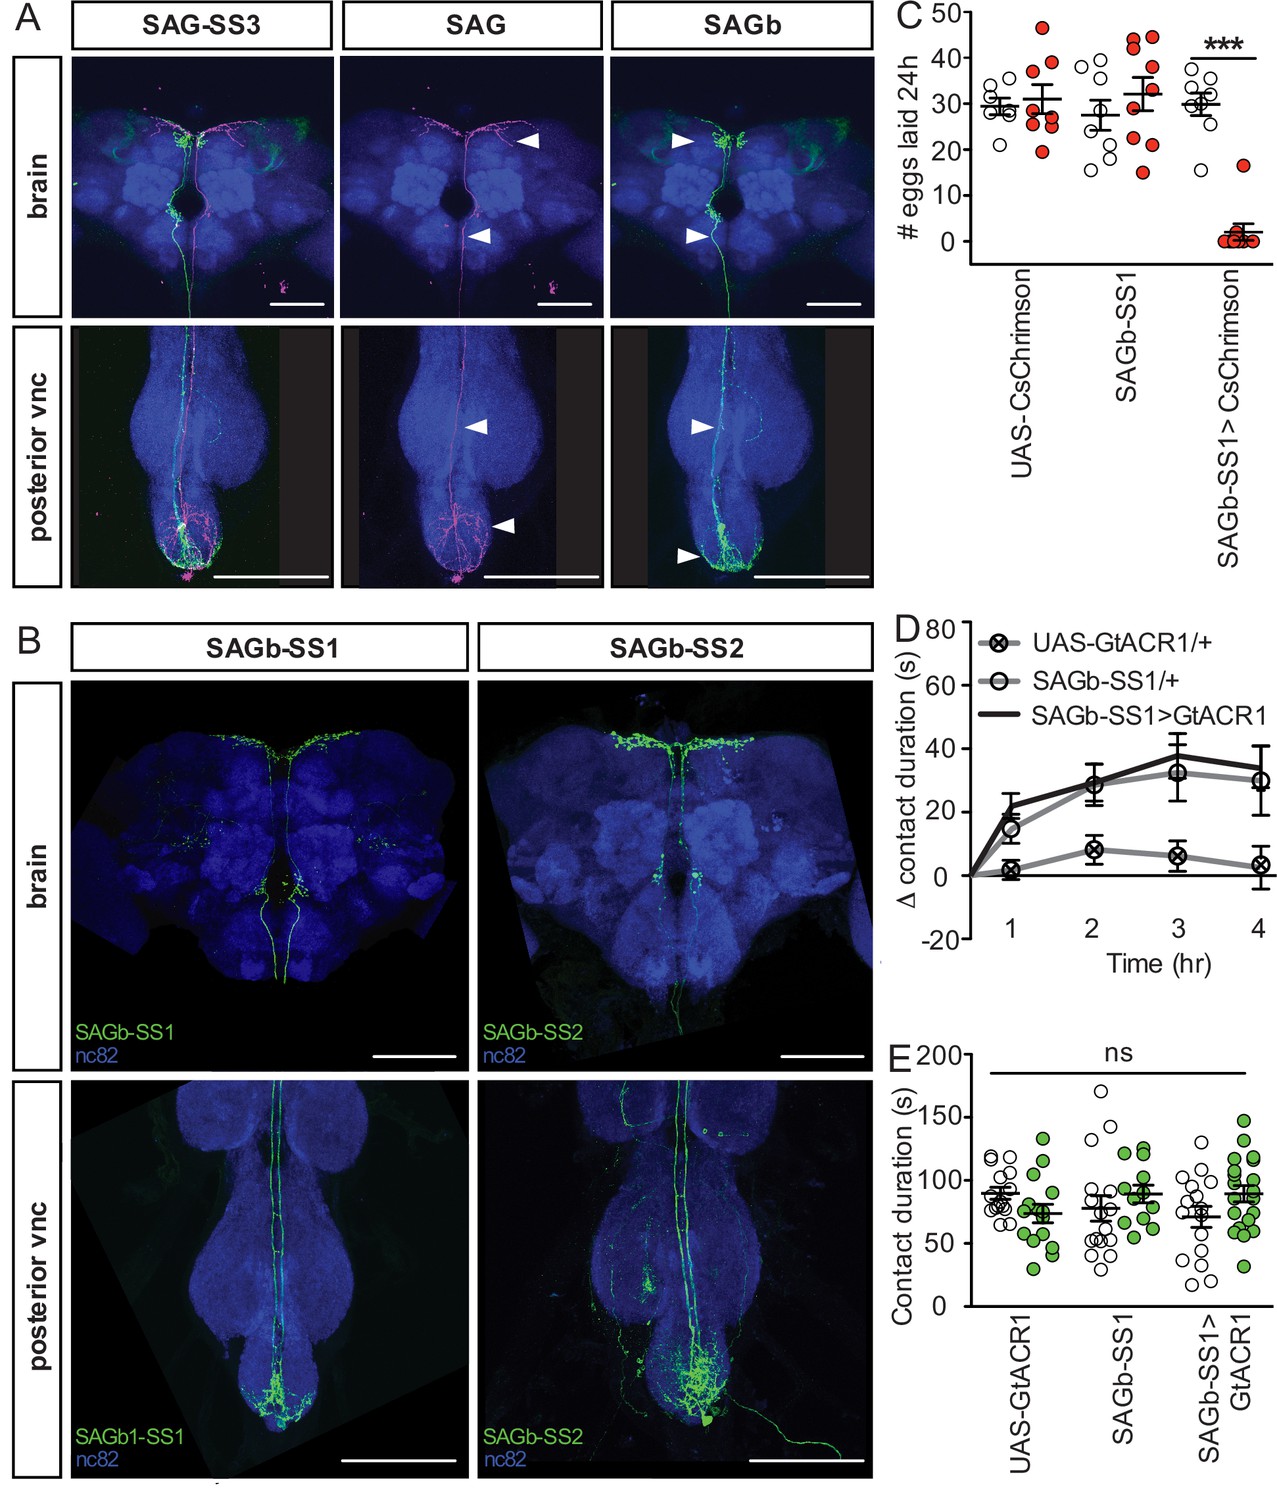
An additional neuron in the SAG-SS3 line, SAGb, does not influence sucrose consumption.
(A) Confocal image of the brain (top) and posterior ventral nerve cord (VNC; bottom) of a SAG-SS3 driving the expression of multi-color flip-out tool, stained to reveal sex peptide abdominal ganglia (SAG) (UAS-flag, magenta), SAGb (UAS-HA, green) and all synapses (nc82, blue). White arrowheads indicate locations of distinctive morphological aspects: (top of the brain) projection in the dorsal protocerebrum present in SAG, absent in SAGb; (bottom of the brain) bowing in ascending axon absent in SAG, present in SAGb; (top of posterior VNC) projections along the ascending axon absent in SAG, present in SAGb; (bottom of VNC) SAG arborizations visible throughout the Abdominal neuromere, SAGb arborizations are restricted to the posterior Abdominal neuromere. (B) Confocal image of the brain (top) and posterior VNC (bottom) of a SAGb-SS1 and SAGb-SS2 stained to reveal SAGb expression pattern (UAS-GFP, green) and all synapses (nc82, blue). (C) Number of eggs laid in 24 hr by mated (co-housed with males for 72 hr) females of indicated genotype while exposed to red light (red) or no light (white). ***p<0.001 by two-way ANOVA analysis and Bonferroni posttests (n=7–9). Result reveals a similar phenotype to LSAN (Shao et al., 2019). (D) Drinking time of females exposed to light normalized to dark controls of indicated genotype in fly liquid interaction counter (FLIC) over 4 hr (n=12–20), Kruskal-Wallis. Line graph shows mean and s.e.m. over time. (E) Total drinking time in FLIC in the 4-hr assay, two-way ANOVA (n=12–20). Scale bar 50 μm. Scatter plot shows mean +/− s.e.m. ns = not significant.
Figure 4 with 1 supplement

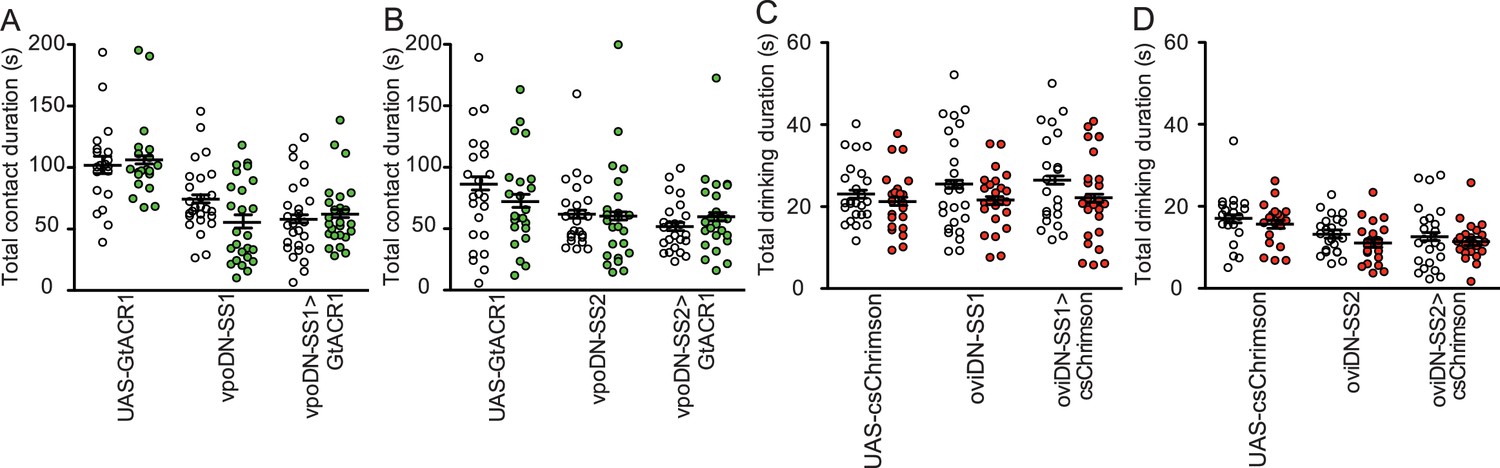
Descending neurons that regulate egg laying and sexual receptivity do not influence sucrose consumption.
(A) Schematic of the mating circuit with neural outputs of pC1 and resulting postmating response. Green circles indicate active neurons, salmon circles indicate silenced neurons. (B and C) Difference in drinking time of 250 mM sucrose of indicated genotype in fly liquid interaction counter (FLIC) over 4 hr. Each data point represents the normalized drinking time of a single female in light conditions (drinking time minus the daily average drinking time of all females in dark conditions within a genotype, n=20–24), Kruskal-Wallis. Line graph shows mean and s.e.m. over time. (D) Velocity heatmap upon transient activation in individual walking flies, genotype indicated on the left. Each row represents the velocity of a single fly. Red bars indicate light ON (n=8–10). (E) Total distance traveled in the locomotor assay in (D). ON condition (red) includes 3–30 s light ON conditions. OFF condition (white) includes 3–30 s light OFF conditions immediately preceding each ON condition, Mann-Whitney, ***p<0.001. Aligned dot plot shows mean +/− s.e.m. (F and G) Drinking time of 250 mM sucrose of females exposed to light normalized to dark controls of indicated genotype in temporal consumption assay (n=19–26), One-way ANOVA, Bonferroni’s post hoc. ns = not significant. Scatter plot shows mean +/− s.e.m. See Supplementary file 1 for full genotypes. See also Figure 4—figure supplement 1.
Figure 4—figure supplement 1
Drinking times of virgin females upon optogenetic manipulation of mating status circuit output circuit neurons: vpo and oviDNs.
(A and B) Total drinking time in fly liquid interaction counter (FLIC) in the 4-hr assay of females of indicated genotype and light condition. White circles are dark condition, green circles are green light condition, n=20–32. Data were analyzed with two-way ANOVA and Bonferroni post-tests. (C and D) Total drinking time in temporal consumption assay (TCA) of females of indicated genotype and light condition. White circles are dark condition, red circles are red light condition, n=20–32, two-way ANOVA and Bonferroni posttests. Scatter plot shows mean +/− s.e.m.
Figure 5 with 4 supplements
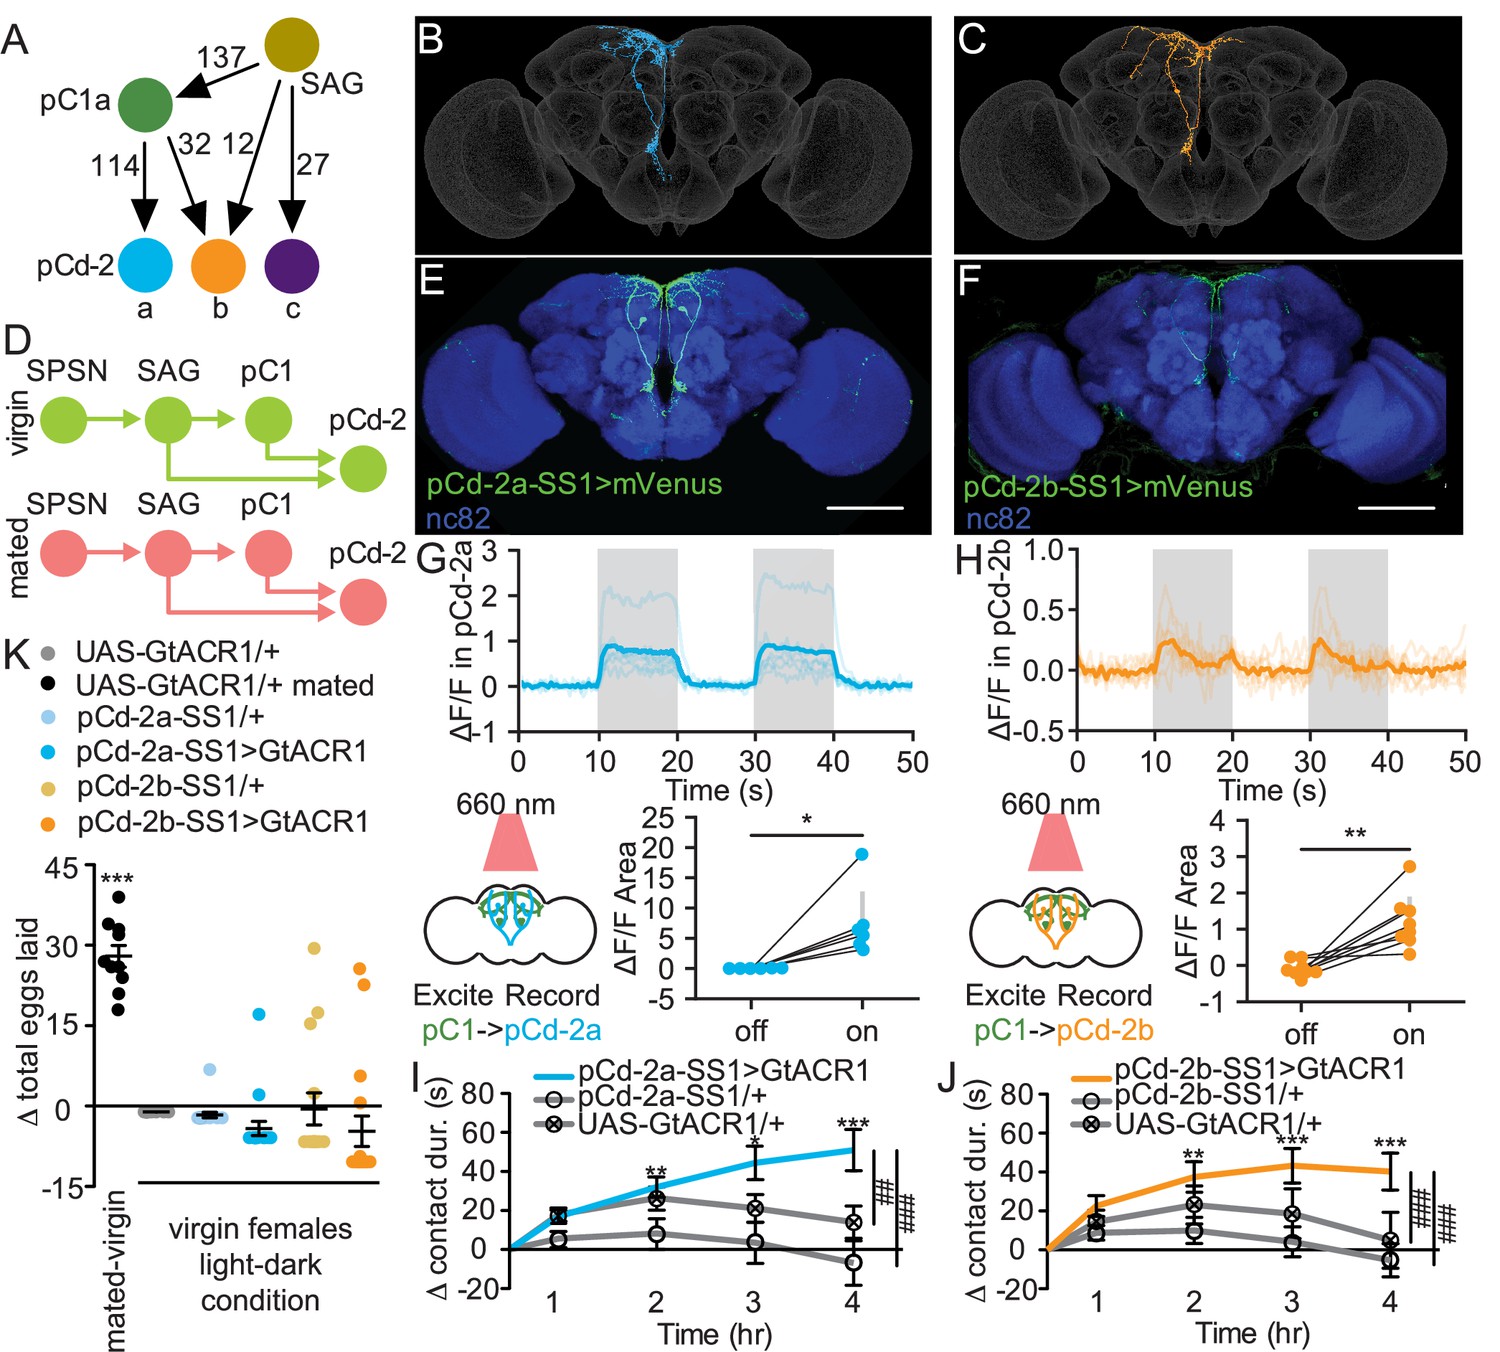
pCd-2 neural outputs of sex peptide abdominal ganglia (SAG) and pC1 mediate postmating sucrose consumption.
(A) Schematic of neural connectivity of the mating status circuit and pCd-2 cells. Arrows represent direct connection and the number indicates the number of synapses per hemisphere. (B and C) Electron microscopy reconstruction of pCd-2a (B) and pCd-2b (C) neurons. (D) Model of circuit activity in virgin and mated state. Green circles indicate active neurons, salmon circles indicate silenced neurons. (E and F) Confocal images of pCd-2a-SS1and pCd-2b-SS1 brains, stained to reveal pCd-2 projection pattern (UAS-GFP, green) and all synapses (nc82, blue). Scale bar 50 μm. (G and H) Calcium responses of pCd-2a (G) and pCd-2b (H) in the prow region of the brain to activation of upstream pC1 neurons with R40F04-LexA (n=6–8) and the analysis of area under the curve, Wilcoxon Rank Test, scatter plot shows mean +/− s.e.m. (gray bar). Gray shading represents optogenetic stimulation. (I and J) Drinking time of 250 mM sucrose of females exposed to light normalized to dark controls of indicated genotype in fly liquid interaction counter (FLIC) over 4 hr (n=22–26). Line graph shows mean and s.e.m. over time, Kruskal-Wallis, Dunn’s post hoc at 4 hr, ##p<0.01, ###p<0.001. (K) Difference in eggs laid in 24 hr of females exposed to light normalized to dark controls (n=10–20). For ‘UAS-GtACR1 mated’ group, the dataset represents eggs laid by mated females normalized to virgin females of the same genotype. Scatter plot shows mean +/− s.e.m, one sample t-test. *p<0.05, **p<0.01, ***p<0.001. See Supplementary file 1 for full genotypes. See also Figure 5—figure supplement 1, Figure 5—figure supplement 2, Figure 5—figure supplement 3, and Figure 5—figure supplement 4.
Figure 5—figure supplement 1
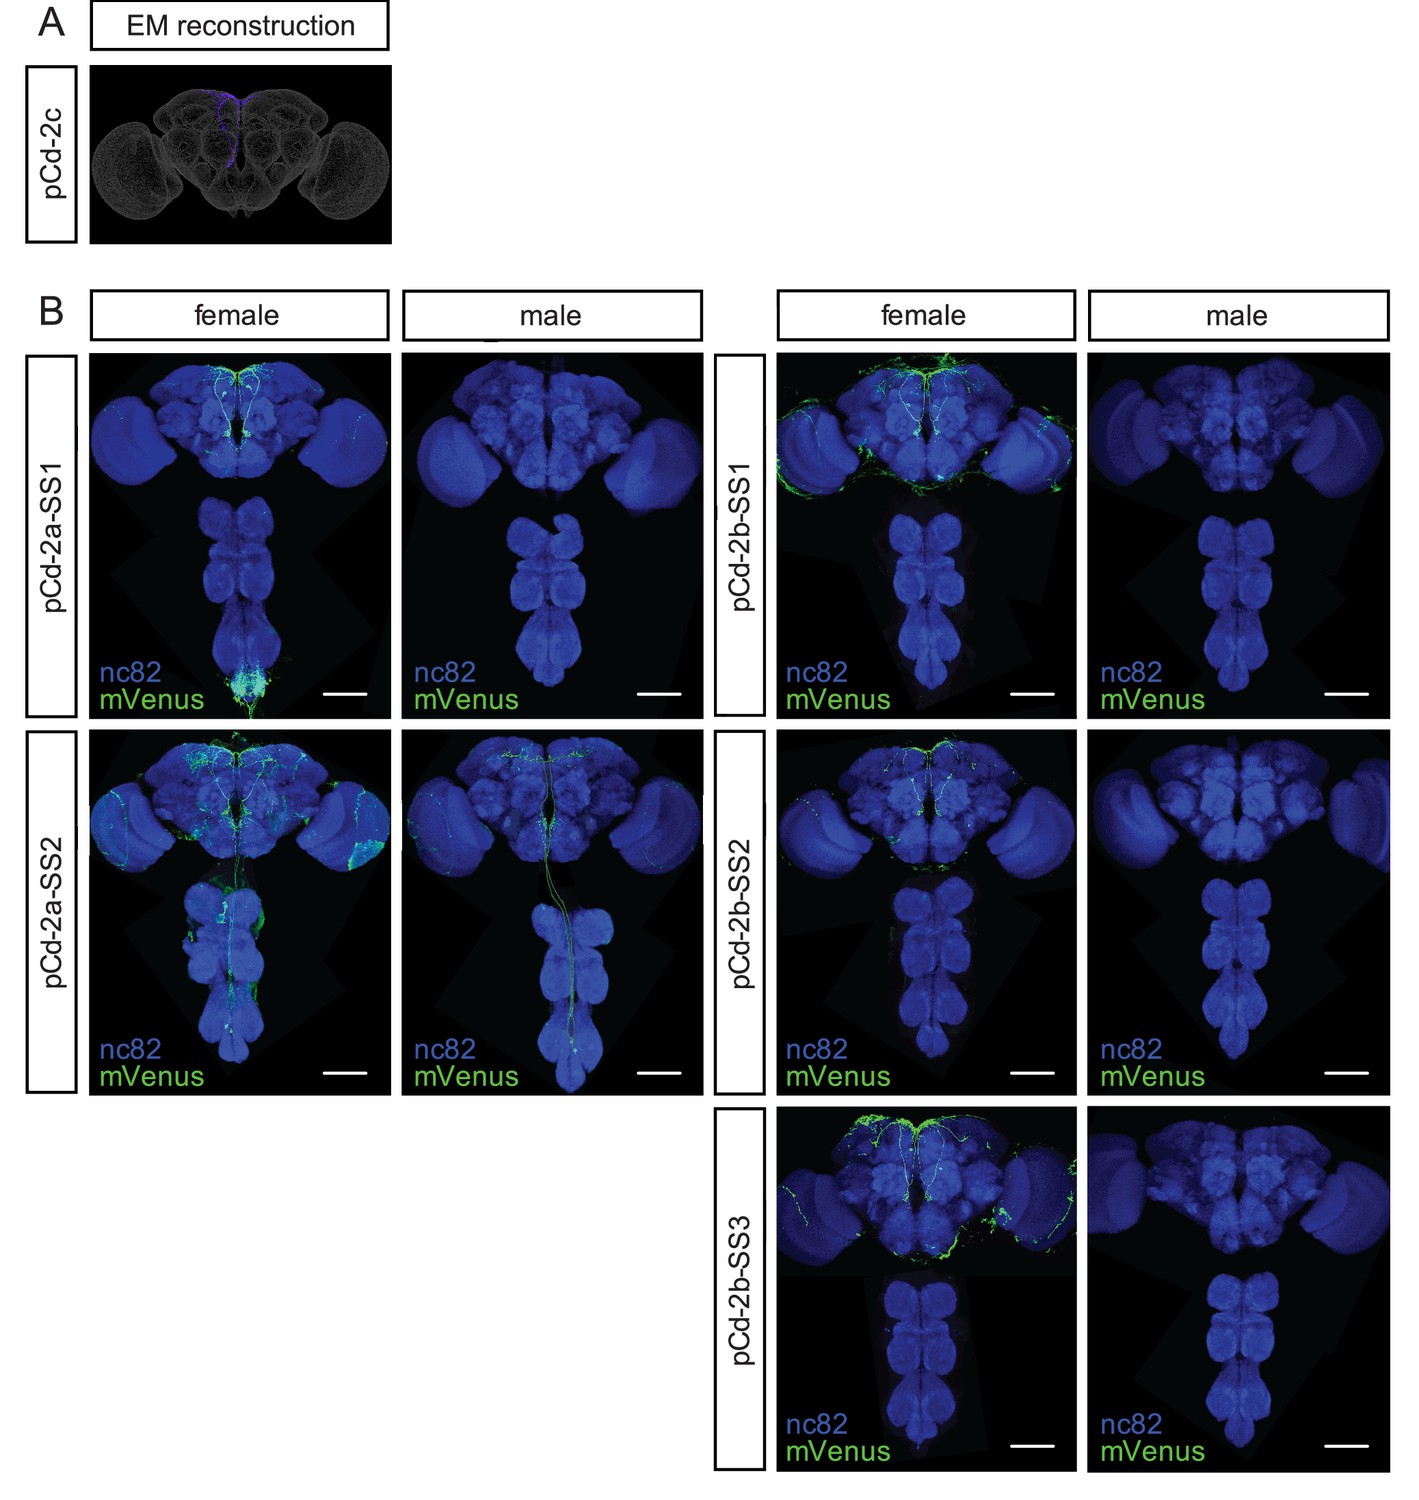
Anatomical characterization of pCd-2 split-GAL4 lines.
(A) Electron microscopy reconstruction of pCd-2c neuron. (B) Confocal images of brains and ventral nerve cords of female and male flies from pCd-2a and pCd-2b split-GAL4 lines stained to reveal expression pattern (UAS-mVenus, green) and all synapses (nc82, blue). Scale bar 50 μm.
Figure 5—figure supplement 2
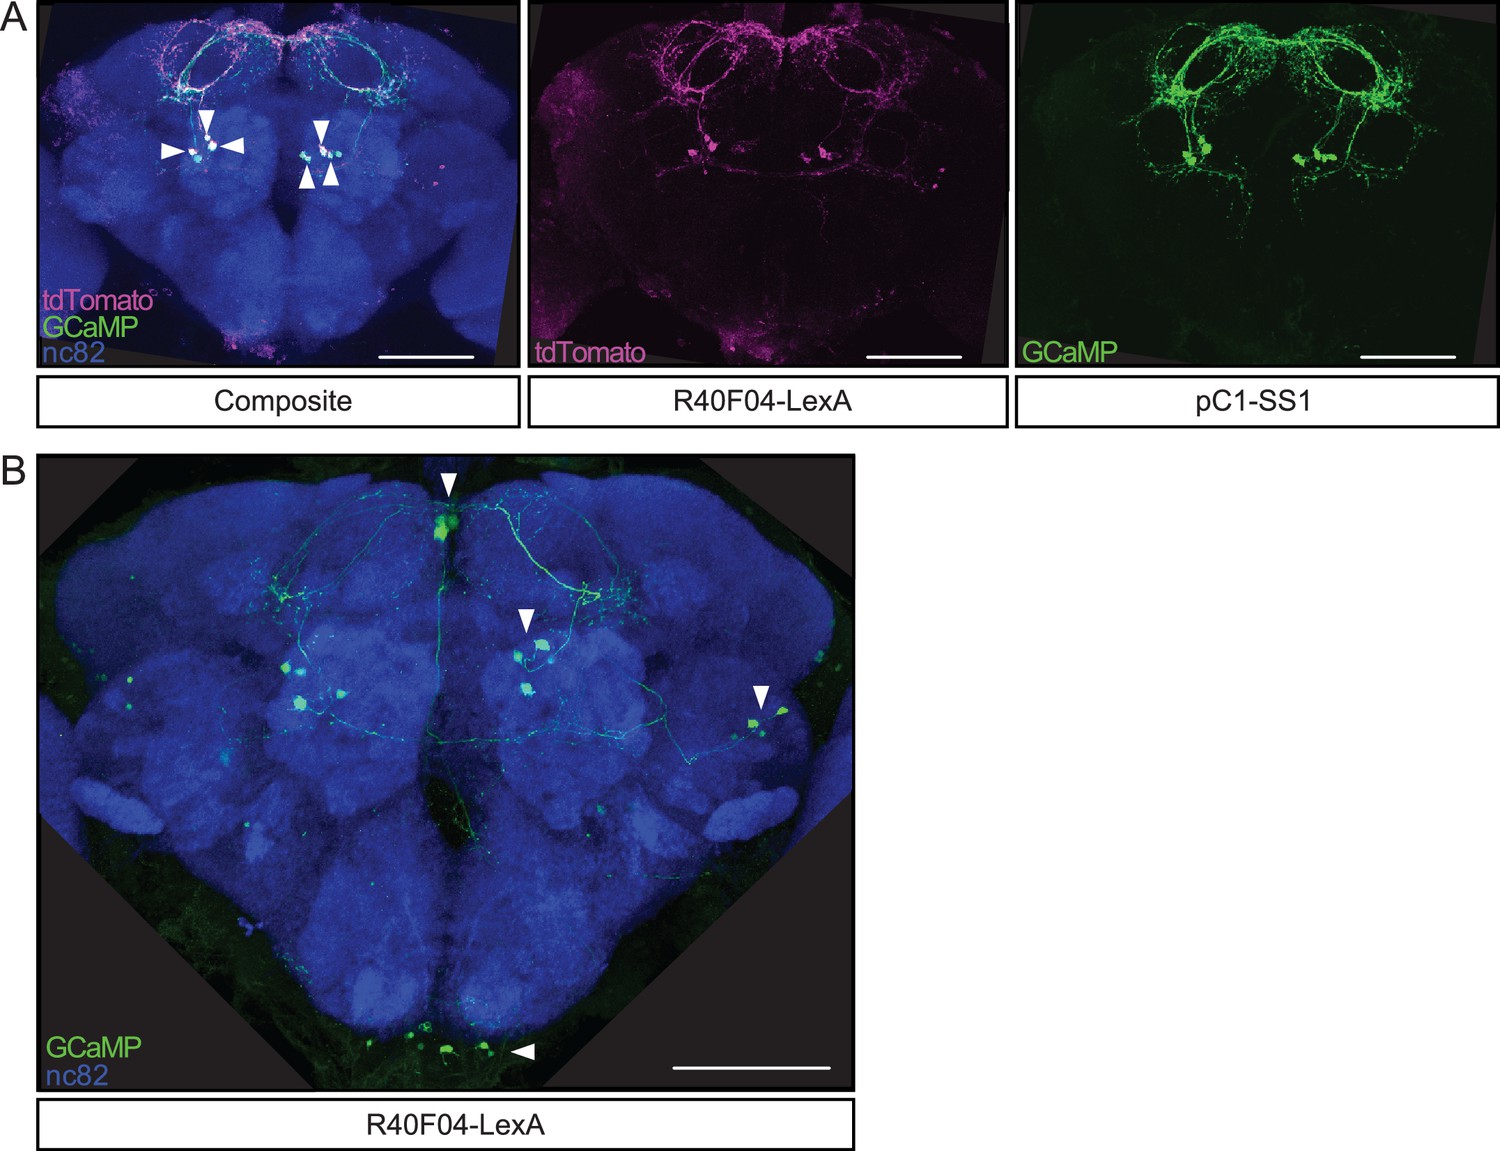
R40F04-LexA labels pC1.
(A) Confocal images of a female brain stained to reveal the co-expression pattern of R40F04-LexA (LexAop-tdTomato, magenta), pC1-SS1 (UAS-GCaMP6s, green), and all synapses (nc82, blue). Arrowheads indicate three pC1 cells per hemisphere that are labeled by both driver lines. (B) Confocal image of a female brain stained to reveal expression pattern of R40F04-LexA (LexAop-GCaMP6s, green) and all synapses (nc82, blue). Arrowheads indicate the location of soma for four different cell types. Scale bar 50 μm.
Figure 5—figure supplement 3

Independent pCd-2a and pCd-2b lines regulate postmated sucrose consumption.
(A and B) Number of eggs laid in 24 hr by virgin females of indicated genotype while exposed to green light (green) or no light (white). Two-way ANOVA analysis revealed no significant differences between groups (n=9–20). Scatter plot shows mean +/- s.e.m. (C–E) Drinking time of females exposed to light normalized to dark controls of indicated genotype in fly liquid interaction counter (FLIC) over 4 hr (n=19–36), Kruskal-Wallis, Dunn’s post hoc at 4 hr, #p<0.5, ##p<0.01, ###p<0.001, ns = not significant. Line graph shows mean and s.e.m. over time. (F–J) Total drinking time in FLIC in the 4-hr assay (n=19–36). Analyzed with a two-way ANOVA and Bonferroni post tests. *p<0.05, **p<0.01, ***p<0.001. Scatter plot shows mean +/- s.e.m.
Figure 5—figure supplement 4
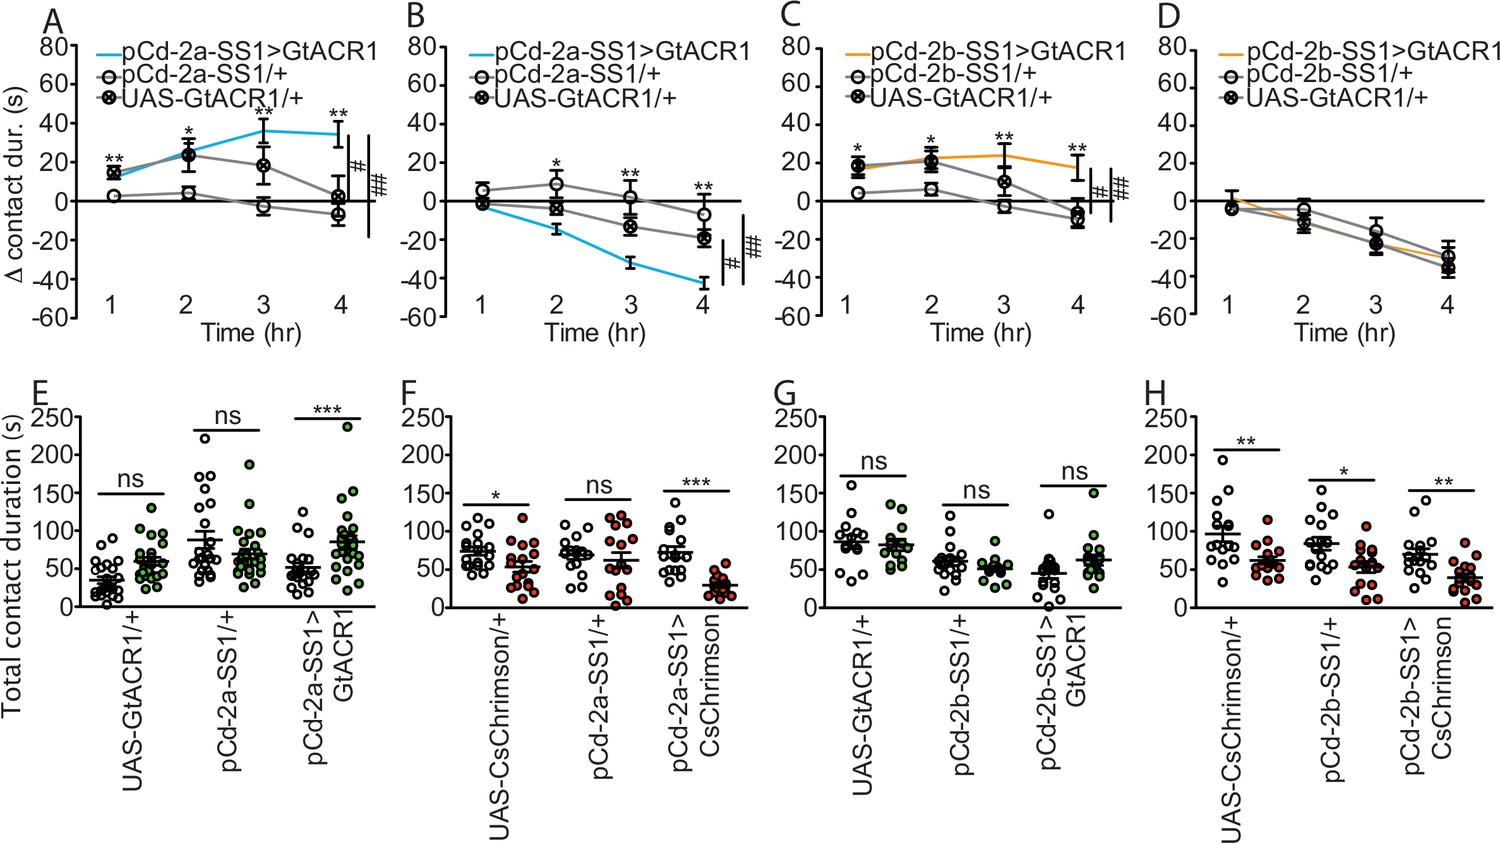
pCd-2 cell type is both necessary and sufficient to drive postmated sucrose intake.
(A–D) Drinking time of females exposed to light normalized to dark controls of indicated genotype in fly liquid interaction counter (FLIC) over 4 hr (n=13–26), Kruskal-Wallis, Dunn’s post hoc at 4 hr, #p<0.05, ##p<0.01. Line graph shows mean and s.e.m over time. (E–H) Total drinking time in FLIC in the 4-hr assay. Analyzed with a two-way ANOVA and Bonferroni post tests (n=13–26). *p<0.05, **p<0.01, ***p<0.001, ns = not significant. Scatter plot shows mean +/− s.e.m.
Figure 6 with 1 supplement
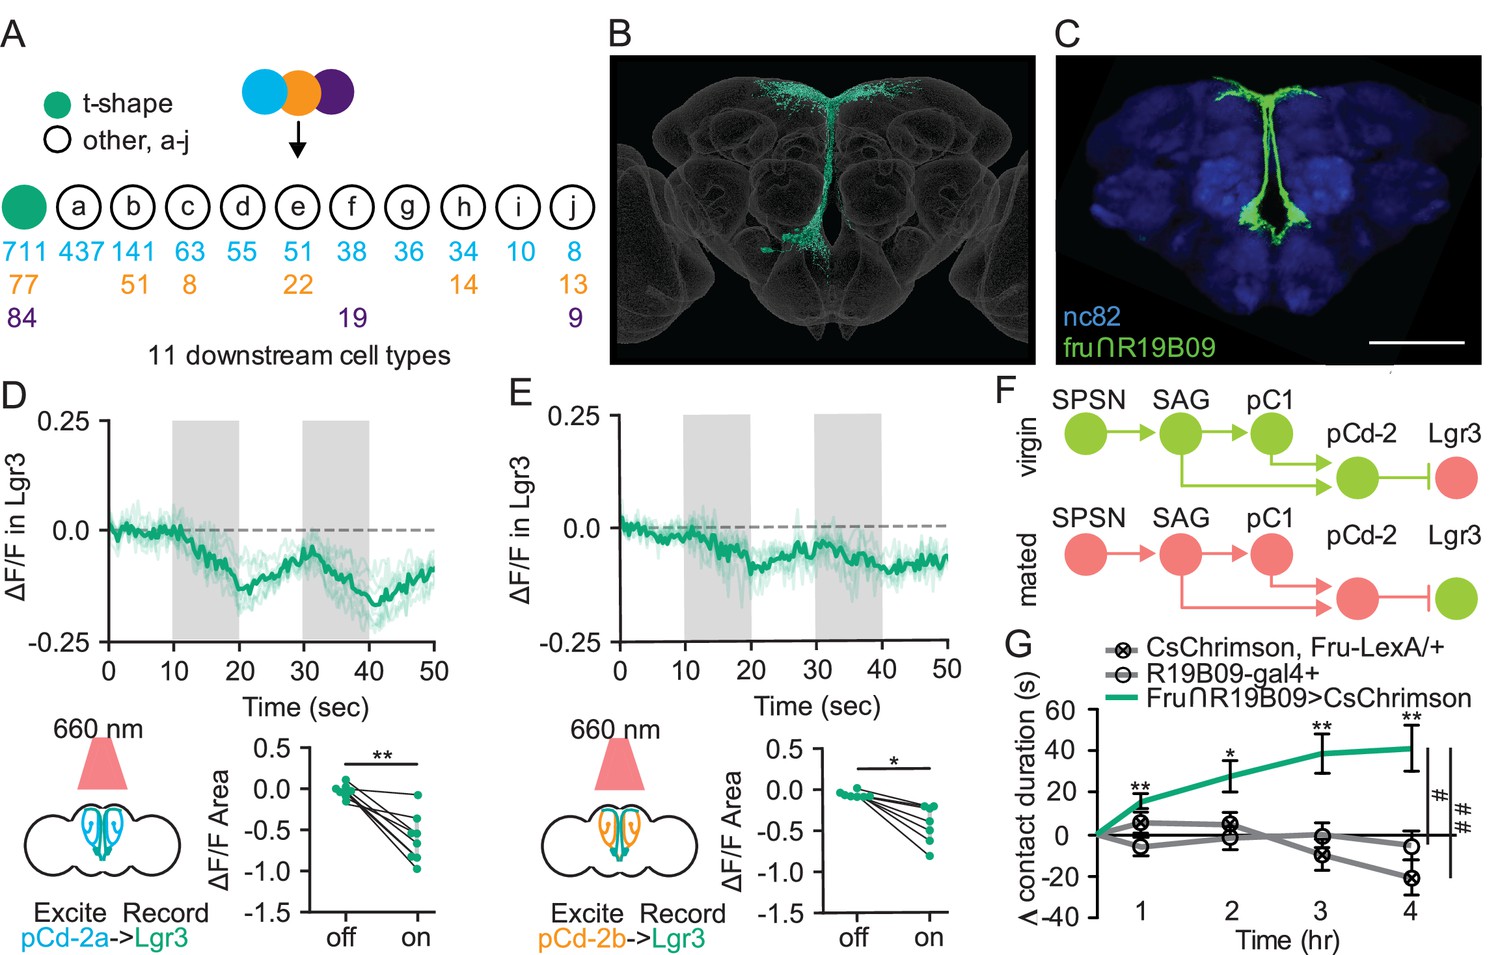
Sexually dimorphic neuroendocrine Lgr3+ cells receive mating status signals via pCd-2 neurons and regulate sucrose consumption in mated females.
(A) Downstream neuronal cell types of pCd-2a (blue), pCd-2b (orange), and pCd-2c (purple) cells identified by electron microscopy reconstruction. Arrow indicates direct connection and numbers indicate pCd-2 output synapses with a color corresponding to upstream pCd-2 cell (a, b, or c). T-shape cell type is represented with a turquoise circle; other cell types are represented with white circles (a-j). (B) Electron microscopy reconstruction of t-shape neurons. (C) Confocal image of fru+ Lgr3-expressing cells (see methods) in the medial brain (UAS-CD8:GFP, green) and all synapses (nc82, blue). Scale bar 50 μm. (D and E) Calcium responses of Lgr3-expressing cell bodies in the prow region of the brain to activation of upstream pCd-2a (D) or pCd-2b (E) neurons (n=7–8) and the analysis of area under the curve, Wilcoxon Rank Test, scatter plot show mean +/− s.e.m. (gray bar). Gray shading represents optogenetic stimulation. (F) Neural model for the coordination of mating status and sucrose intake. Green circles indicate active neurons, salmon circles indicate silenced neurons. (G) Drinking time of 250 mM sucrose of females exposed to light normalized to dark controls of indicated genotype in fly liquid interaction counter (FLIC) over 4 hr (n=10–15). Line graph shows mean and s.e.m. over time, Kruskal-Wallis, Dunn’s post hoc at 4 hr, #p<0.05, ##<0.01. *p<0.05, **p<0.01, ***p<0.001. See Supplementary file 1 for full genotypes. See also Figure 6—figure supplement 1.
Figure 6—figure supplement 1
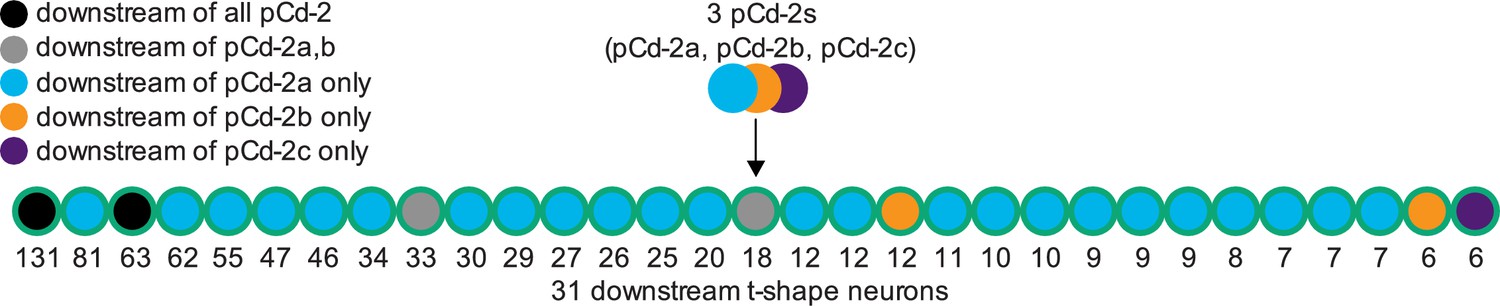
The main output cell type of pCd-2 neurons are t-shape Lgr3 neurons.
Schematic of neural connectivity of pCd-2 cells and downstream t-shape neurons identified by electron microscopy reconstruction. The number indicates the number of synapses.
Figure 7

Model summarizing neuroendocrine Lgr3-dependent feeding modulation.
Schematic of neural connectivity of mating status circuit (SPSN-SAG-pC1), mating status output neurons (pCd-2), and downstream Lgr3 cells. Circles represent neurons of indicated cell type. Lines between neurons represent synaptic connectivity: arrowheads indicate excitatory synapses, and horizontal lines indicate inhibitory synapses. Circuitry shown in green is active, pink indicates silenced. Star (blue) represents Dilp8. Blue wavey line is Dilp8 receptor, Lgr3. Status is indicated at the top and feeding outcome is indicated at the bottom (boxed).
Author response image 1
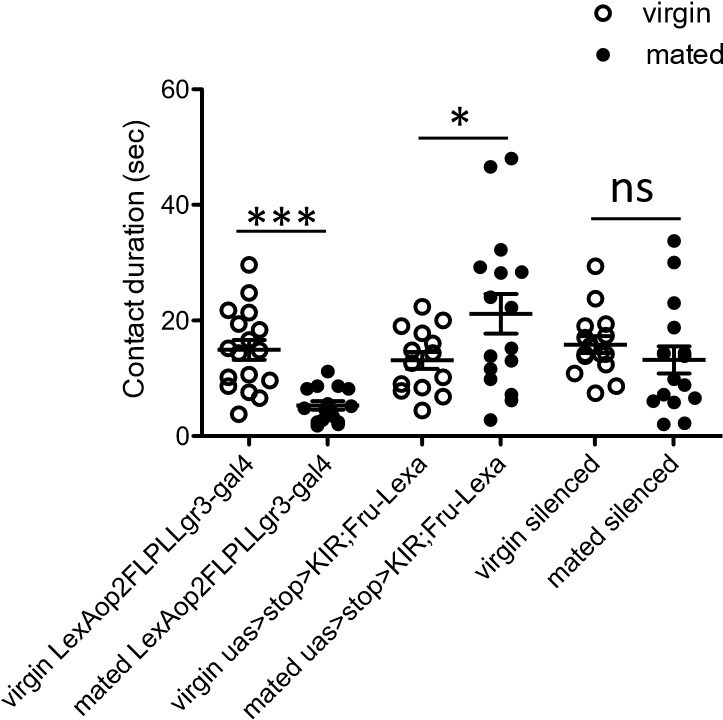
Total drinking time in FLIC in a 20 minute assay of females of indicated genotype and mating state.
White circles represent virgin and black circles indicate mated, n = 14-17. Data was analyzed with a Two-Way ANOVA and revealed a significant interaction of genotype and mating status, F(2,88)=9.271, p<0.001. Bonferroni posthoc tests indicated a significant increase in feeding after mating in only one control genotype (uas>stop>KIR, Fru-LexA), *p<0.05, ***p<0.001, ns = not significant. Scatterplot show mean +/- s.e.m.
Tables
Appendix 1—key resources table
| Reagent type (species) or resource | Designation | Source or reference | Identifiers | Additional information |
|---|---|---|---|---|
| Antibody | Anti-Brp (mouse monoclonal) | DSHB, University of Iowa, USA | DSHB Cat# nc82, RRID:AB_2314866 | 1/40 |
| Antibody | Anti-GFP (chicken polyclonal) | Thermo Fisher Scientific | Thermo Fisher Scientific Cat# A10262, RRID:AB_2534023 | 1/1000 |
| Antibody | Anti-chicken Alexa Fluor 488 (goat polyclonal) | Thermo Fisher Scientific | Thermo Fisher Scientific Cat# A11039, RRID:AB_2534096 | 1/500 |
| Antibody | Anti-mouse Alexa Fluor 647 (goat polyclonal) | Thermo Fisher Scientific | Thermo Fisher Scientific Cat# A21236, RRID:AB_2535805 | 1/500 |
| Antibody | Anti-HA (rabbit monoclonal) | Cell Signalling Technology | Cell Signaling Technology (C29F4) Cat #3724, RRID:AB_1549585 | 1/1000 |
| Antibody | Anti-rabbit Alexa Fluor 488 (goat polyclonal) | Thermo Fisher Scientific | Thermo Fisher Scientific Cat# A11034, RRID:AB_2576217 | 1/500 |
| Antibody | Anti-DYKDDDK epitope tag (rat monoclonal) | Novus Biologicals | Novus Biologicals, NBP1-06712, RRID:AB_1625981 | 1/1000 |
| Antibody | Anti-rat Alexa Fluor 568 (goat polyclonal) | Thermo Fisher Scientific | Thermo Fisher Scientific Cat# A11077, RRID#AB_2534121 | 1/500 |
| Antibody | Anti-dsRed (rabbit polyclonal) | Takara | Takara Bio Cat# 632496, RRID:AB_10013483 | 1/1000 |
| Antibody | Anti-rabbit Alexa Fluor 568 (goat polyclonal) | Thermo Fisher Scientific | Thermo Fisher Scientific Cat# A11011, RRID#AB_143157 | 1/500 |
| Chemical Compound, drug | All trans-Retinal | MilliporeSigma | Cat # R2500, CAS:116-31-4 | |
| Chemical Compound, drug | Sucrose | Thermo Fisher Scientific | Thermo Fisher Scientific:Cat# AAA1558336; CAS:57-50-1 | |
| Genetic reagent (D. melanogaster) | Wild-type, Canton-S | Bloomington Stock Center | ||
| Genetic reagent (D. melanogaster) | Gr64f-Gal4 | Bloomington Stock Center | RRID: BDSC_57669 | |
| Genetic reagent (D. melanogaster) | Gr64f-Gal4 | Bloomington Stock Center | RRID: BDSC_57668 | |
| Genetic reagent (D. melanogaster) | UAS-GCaMP6s(attP40) | Bloomington Stock Center | RRID: BDSC_42746 | |
| Genetic reagent (D. melanogaster) | UAS-GCaMP6s(VK00005) | Bloomington Stock Center | RRID: BDSC_42749 | |
| Genetic reagent (D. melanogaster) | UAS-CD8-tdTomato | Thistle et al., 2012 | ||
| Genetic reagent (D. melanogaster) | ovoD1 | Mével-Ninio et al., 1996 | ||
| Genetic reagent (D. melanogaster) | hs-bam | Bloomington Stock Center | RRID: BDSC_24636 | |
| Genetic reagent (D. melanogaster) | nsyb-Gal4 | Bloomington Stock Center | RRID: BDSC_51941 | |
| Genetic reagent (D. melanogaster) | UAS-dcr-2 | Bloomington Stock Center | RRID: BDSC_24650 | |
| Genetic reagent (D. melanogaster) | UAS-SPR-IR1 | Yapici et al., 2008 | ||
| Genetic reagent (D. melanogaster) | ppk-gal4 | Bloomington Stock Center | RRID: BDSC_32079 | |
| Genetic reagent (D. melanogaster) | VT003280-gal4 (attP2) | Feng et al., 2014 | ||
| Genetic reagent (D. melanogaster) | VT003280-LexA (attP2) | Feng et al., 2014 | ||
| Genetic reagent (D. melanogaster) | FruP1-LexA | Mellert et al., 2010 | ||
| Genetic reagent (D. melanogaster) | 8xLexAop2-FLPL(attP40) | Bloomington Stock Center | RRID: BDSC_55820 | |
| Genetic reagent (D. melanogaster) | UAS >stop > KIR | Bloomington Stock Center | RRID: BDSC_67686 | |
| Genetic reagent (D. melanogaster) | UAS >stop > TNT | Bloomington Stock Center | RRID: BDSC_67690 | |
| Genetic reagent (D. melanogaster) | UAS >stop > CD8::GF | Bloomington Stock Center | RRID: BDSC_30125 | |
| Genetic reagent (D. melanogaster) | VT050405-p65ADZp(attP40) | Tirian and Dickson, 2017 | ||
| Genetic reagent (D. melanogaster) | dsx-ZpGal4DBD | Shirangi et al., 2016 | ||
| Genetic reagent (D. melanogaster) | pC1 split-GAL4, SS01491 | Bloomington Stock Center | RRID:BDSC_86830 | Full genotype: VT002064-p65ADZp(attP40); VT008469-ZpGal4DBD(attP2) |
| Genetic reagent (D. melanogaster) | VT002064-p65ADZp | Bloomington Stock Center | RRID:BDSC_72442 | |
| Genetic reagent (D. melanogaster) | vpo split-GAL4, SS50200 | Bloomington Stock Center | RRID:BDSC_86868 | Full genotype: 31D07-p65ADZp (attP40); 52F12-ZpGal4DBD (attP2) |
| Genetic reagent (D. melanogaster) | vpo split-GAL4, SS50795 | Bloomington Stock Center | RRID:BDSC_86869 | Full genotype: VT045670-p65ADZp (attP40); 52F12-ZpGal4DBD (attP2) |
| Genetic reagent (D. melanogaster) | oviIN split-GAL4, SS65422 | Bloomington Stock Center | RRID:BDSC_86837 | Full genotype: 68A10-p65ADZp (attP40); VT010054-ZpGal4DBD (attP2) |
| Genetic reagent (D. melanogaster) | oviIN split-GAL4, SS65423 | Bloomington Stock Center | RRID:BDSC_86838 | Full genotype: VT026347-p65ADZp (attP40); VT026035-ZpGal4DBD (attP2) |
| Genetic reagent (D. melanogaster) | oviDN split-GAL4, SS46540 | Bloomington Stock Center | RRID:BDSC_86832 | Full genotype: VT050660-p65ADZp (attP40); VT028160-ZpGal4DBD (attP2) |
| Genetic reagent (D. melanogaster) | oviDN split-GAL4, SS35666 | Bloomington Stock Center | RRID:BDSC_86831 | Full genotype: VT026873-p65ADZp (attP40); VT040574-ZpGal4DBD (attP2) |
| Genetic reagent (D. melanogaster) | 20xUAS-IVS-GtACR1-EYFP9attP2 | Mohammad et al., 2017 | ||
| Genetic reagent (D. melanogaster) | 20xUAS-CsChrimson::mVenus (attP18) | Bloomington Stock Center | RRID: BDSC_55134 | |
| Genetic reagent (D. melanogaster) | MCFO | Bloomington Stock Center, Nern et al., 2015 | RRID:BDSC_64088 | |
| Genetic reagent (D. melanogaster) | VT004974-p65ADZp (attP40) | Bloomington Stock Center | RRID: BDSC_71475 | |
| Genetic reagent (D. melanogaster) | R69H11-ZpGal4DBD (attP2) | Bloomington Stock Center | RRID: BDSC_69819 | |
| Genetic reagent (D. melanogaster) | VT023823-p65ADZp (attP40) | Tirian and Dickson, 2017 | ||
| Genetic reagent (D. melanogaster) | VT027804-p65ADZp (attP40) | Bloomington Stock Center | RRID: BDSC_72041 | |
| Genetic reagent (D. melanogaster) | VT057275-p65ADZp (attP40) | Bloomington Stock Center | RRID: BDSC_71664 | |
| Genetic reagent (D. melanogaster) | R9B05-p65ADZp (attP40) | Bloomington Stock Center | RRID: BDSC_70519 | |
| Genetic reagent (D. melanogaster) | R22D06-ZpGal4DBD (attP2) | Dionne et al., 2018 | ||
| Genetic reagent (D. melanogaster) | R29G03-p65ADZp (attP40) | Bloomington Stock Center | RRID: BDSC_75746 | |
| Genetic reagent (D. melanogaster) | R60C09-p65ADZp (attP40) | Bloomington Stock Center | RRID: BDSC_69750 | |
| Genetic reagent (D. melanogaster) | R19B09-gal4 (attP2) | Bloomington Stock Center | RRID: BDSC_48840 | |
| Genetic reagent (D. melanogaster) | R19B09-LexA (attP40) | Bloomington Stock Center | RRID: BDSC_52539 | |
| Genetic reagent (D. melanogaster) | UAS >stop > csChrimson w-,UAS >stop > csChrimson (attP18) | Wu et al., 2016 | ||
| Genetic reagent (D. melanogaster) | UAS-Chrimson88 | Klapoetke et al., 2014 | ||
| Genetic reagent (D. melanogaster) | LexAop-GCaMP6s | Broussard et al., 2018 | ||
| Genetic reagent (D. melanogaster) | R40F04-LexA (attP40) | Bloomington Stock Center | RRID: BDSC_54785 | |
| Software, Algorithm | Fiji | https://fiji.sc/ | RRID: SCR_002285 | |
| Software, Algorithm | GraphPad Prism | Graphpad Software; https://www.graphpad.com/scientific-software/prism/ | RRID:SCR_002798 | |
| Software, Algorithm | Python | Python Software Foundation; https://www.python.org/downloads/ | RRID:SCR_008394 | |
| Software, Algorithm | Flywire | Flywire; https://flywire.ai/ | RRID:SCR_019205 | |
| Software, Algorithm | Adobe Illustrator | Adobe Software; https://www.adobe.com/products/illustrator.html | RRID:SCR_010279 | |
| Software, Algorithm | CATMAID | Saalfeld et al., 2009; https://catmaid.org | RRID:SCR_006278 | |
| Software, Algorithm | CAVE (connectome annotation versioning engine) | Buhmann et al., 2021, Heinrich et al., 2018 | ||
| Software, Algorithm | R Project for Statistical Computing | Dessau and Pipper, 2008; www.r-project.org | RRID:SCR_001905 | |
| Software, Algorithm | SciPy package | Virtanen et al., 2020; https://scipy.org/ | RRID:SCR_008058 | |
| Software, Algorithm | CircuitCatcher | Bushey, 2019 | ||
| Other | FLIC | Ro et al., 2014; https://www.sablesys.com/products/classic-line/flic_drosophila_behavior_system/ | ||
| Peptide, recombinant protein | Alexa Fluor 633 Phalloidin | Thermo Fisher Scientific | Thermo Fisher Scientific Cat# A22284 | 1/500 |
Additional files
-
Supplementary file 1
Fly genotypes in figures.
Table including the short and full genotypes of flies in the indicated figure.
- https://cdn.elifesciences.org/articles/85117/elife-85117-supp1-v2.docx
-
MDAR checklist
- https://cdn.elifesciences.org/articles/85117/elife-85117-mdarchecklist1-v2.pdf
Download links
A two-part list of links to download the article, or parts of the article, in various formats.
Downloads (link to download the article as PDF)
Open citations (links to open the citations from this article in various online reference manager services)
Cite this article (links to download the citations from this article in formats compatible with various reference manager tools)
Mating activates neuroendocrine pathways signaling hunger in Drosophila females
eLife 12:e85117.
https://doi.org/10.7554/eLife.85117


