Amelioration of non-alcoholic fatty liver disease by targeting adhesion G protein-coupled receptor F1 (Adgrf1)
- Department of Chemistry and Chemical Engineering, Guangzhou University, China
- Department of Health Technology and Informatics, Hong Kong Polytechnic University, Hong Kong
- Zhujiang Hospital, Southern Medical University, China
- Ionis Pharmaceuticals, United States
- Department of Medicine, University of Hong Kong, Hong Kong
- State Key Laboratory of Pharmaceutical Biotechnology, University of Hong Kong, China
- Department of Orthopaedics and Traumatology, Chinese University of Hong Kong, Hong Kong
- Hong Kong Polytechnic University, Shenzhen Research Institute, China
Figures
Figure 1
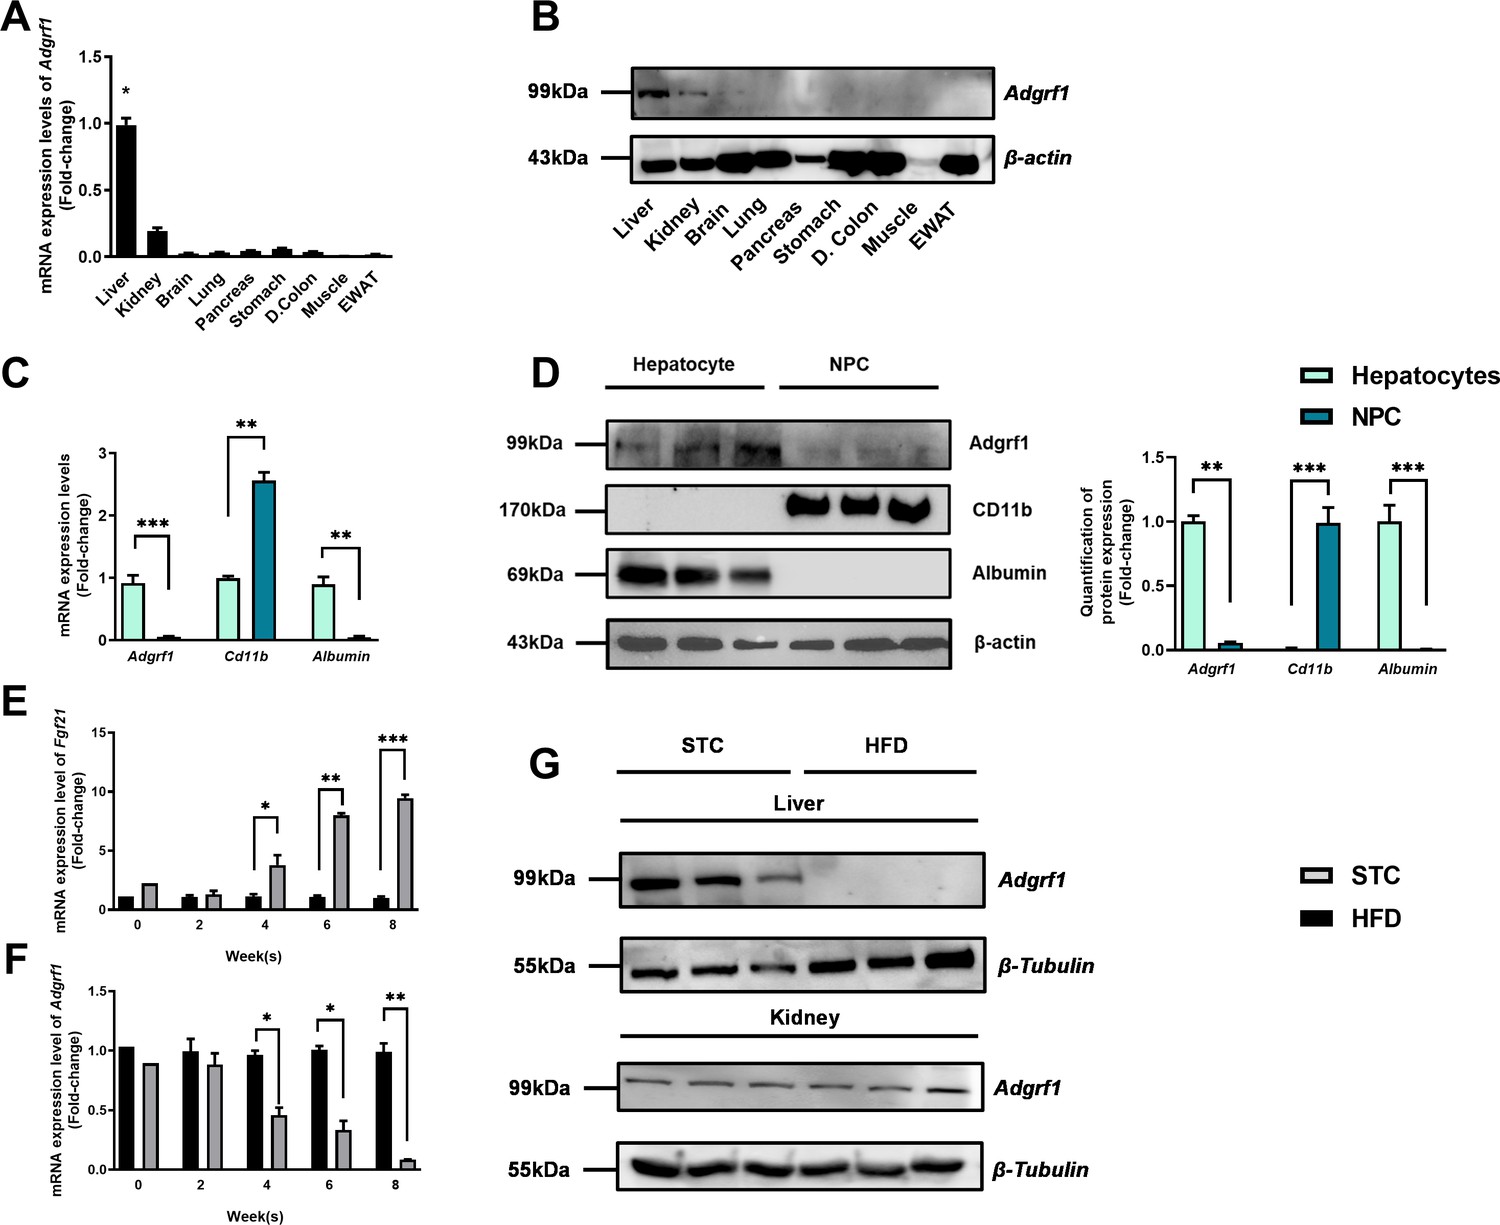
Adgrf1 is mainly expressed in the liver and its expression is downregulated after HFD treatment.
Eight-week-old male C57BL/6J mice were fed with either STC or HFD for 8 wk. (A) mRNA expression levels of Adgrf1 in different organs as determined by RT-qPCR analysis (n = 5). (B) Representative immunoblotting analyses of Adgrf1 expression in different tissues of C57BL/J mice after STC for 8 wk (n = 3). (C) mRNA expression levels of Adgrf1, Cd11b, and albumin in factions of hepatocyte or NPCs isolated from STC-fed mice livers as determined by RT-qPCR. (D) Left panel: representative immunoblotting analyses of Adgrf1, Cd11b, and albumin in fractions of hepatocytes or NPC isolated from mice livers fed with STC, each lane is a sample from different individual; right panel: quantification of protein expression levels of Adgrf1, Cd11b, and albumin. Protein expression levels were normalized to the expression of β-actin. The fraction of hepatocytes was set as 1 for fold-change calculation. (E) mRNA expression levels of FGF21 in mice liver fed with 0, 2, 4, 6, and 8 wk of HFD as determined by RT-qPCR. (F) mRNA expression levels of Adgrf1 in mice liver fed with 0, 2, 4, 6, and 8 wk of HFD as determined by RT-qPCR. (G) Left panel: representative immunoblotting analyses of Adgrf1 in mice fed with either STC or HFD for 8 wk; right panel: quantification of protein expression levels of Adgrf1. Protein expression levels were normalized to the expression of β-tubulin. The sample from STC mice was set as 1 for fold-change calculation. Each lane is a sample from different individual. Adgrf1, G-protein-coupled receptor 110; STC, standard chow diet; HFD, high-fat diet; NPC, non-parenchymal cell. Data represented as mean ± SEM; repeated with three independent experiments; p-value analyzed by two-tailed Student’s t-test. *p<0.05, **p<0.01, ***p<0.001.
-
Figure 1—source data 1
Adgrf1 is mainly expressed in the liver and its expression is downregulated after HFD treatment.
- https://cdn.elifesciences.org/articles/85131/elife-85131-fig1-data1-v2.zip
Figure 2 with 2 supplements
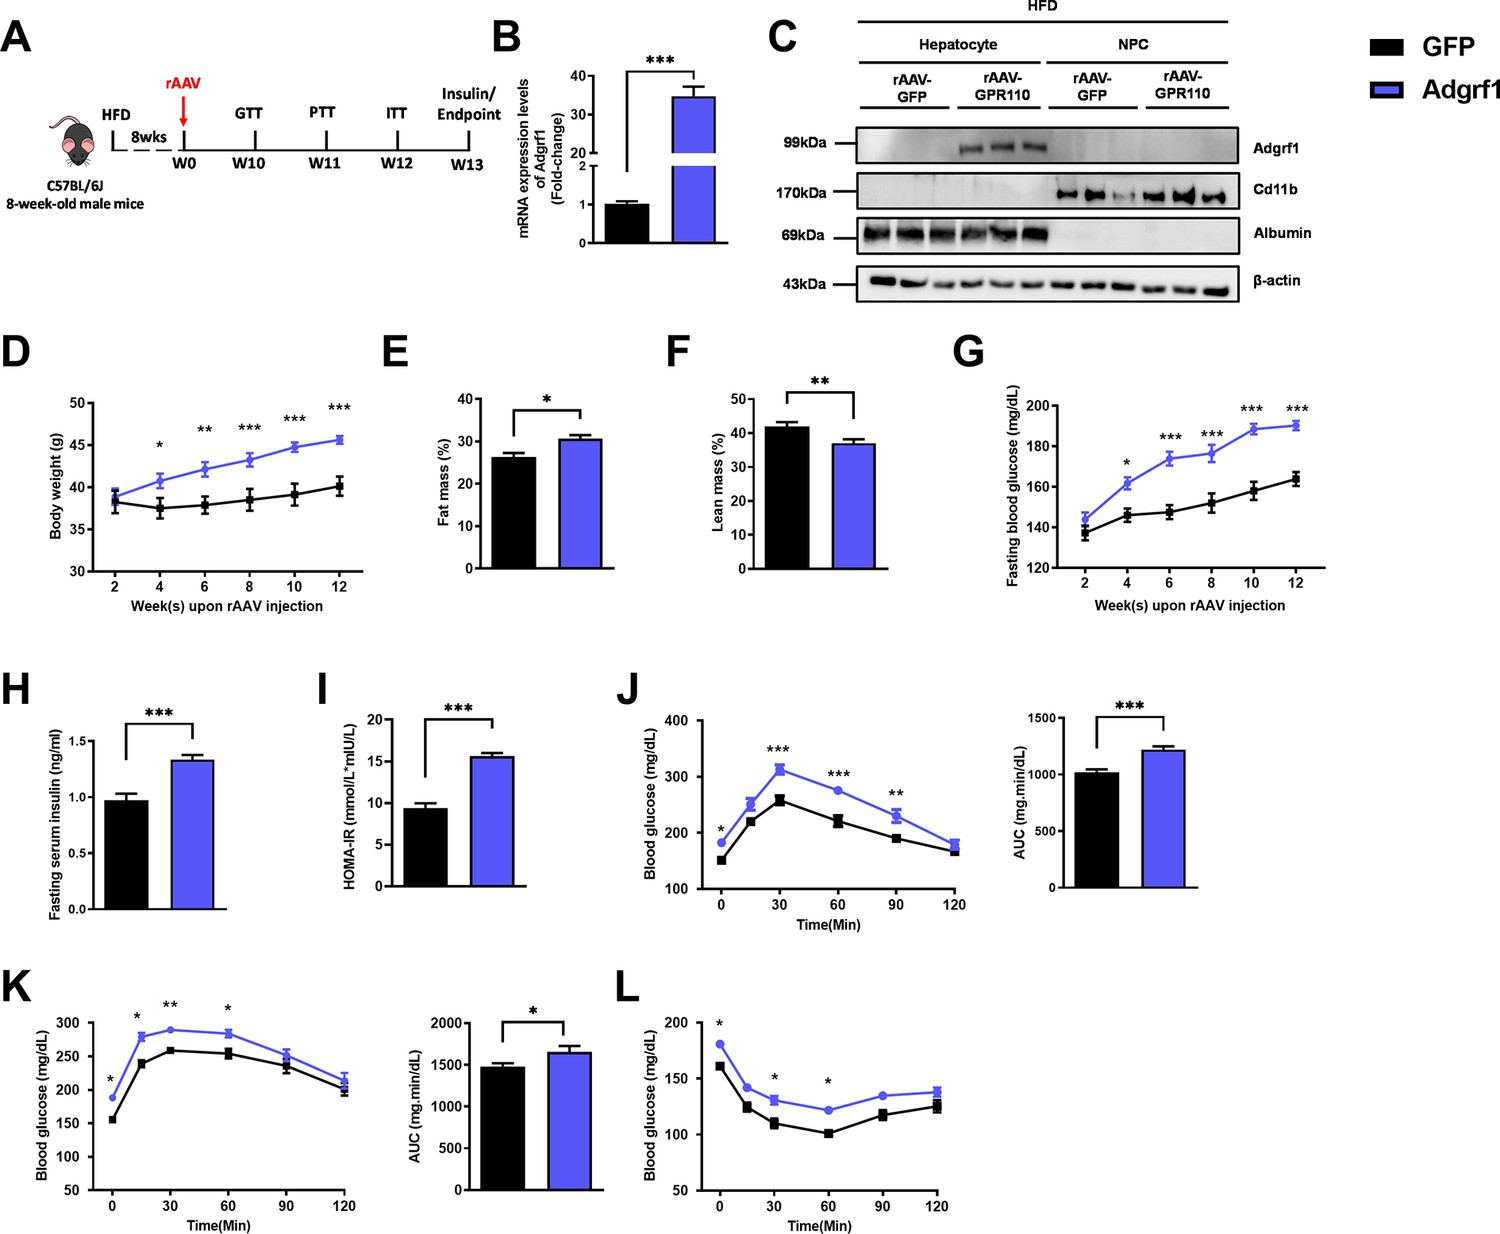
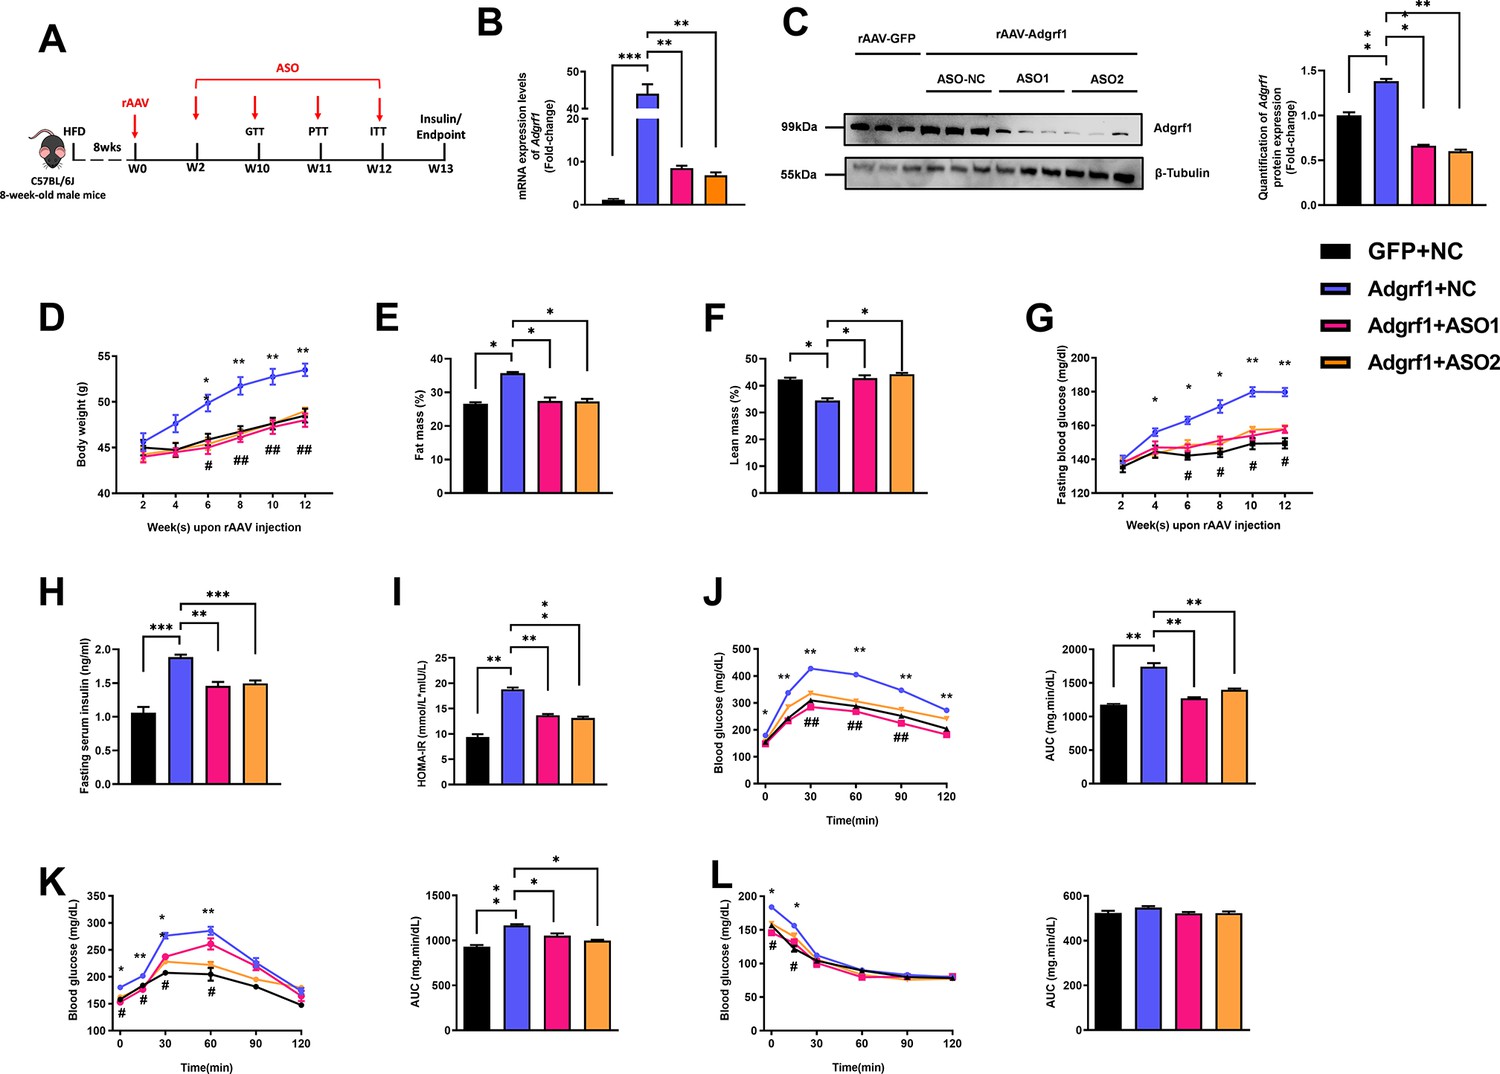
Overexpression of Adgrf1 in hepatocytes exaggerates metabolic dysregulation by HFD treatment.
Eight-week-old male C57BL/6J mice were infected with 3 × 10¹¹ copies of rAAV encoding Adgrf1 (rAAV-Adgrf1, i.v.) or control (rAAV-GFP, i.v.) and received HFD feeding, respectively. (A) Schematic illustration of viral treatments. (B) Hepatic mRNA expression levels of Adgrf1 from rAAV-Adgrf1 mice liver in fractions of hepatocyte or NPCs isolated from HFD-fed mice livers as determined by RT-qPCR. (C) Immunoblotting analyses of Adgrf1, Cd11b, and albumin from rAAV-Adgrf1 mice liver in factions of hepatocyte or NPC isolated from HFD-fed mice livers. Each lane is a sample from a different individual. (D) Body weight, (E) the percentage of fat mass, and (F) lean mass were assessed in different groups. (G) Fasting blood glucose levels were measured biweekly upon rAAV injection. (H) The fasting serum insulin level and (I) HOMA-IR index were measured and calculated according to the formula [Fasting blood glucose (mmol/l) × Fasting blood insulin (mIU/l)]/22.5 for the HFD-fed rAAV-Adgrf1 or rAAV-GFP mice at the end of the experiment. (J) GTT (1 g/kg BW, left) and area under curve (AUC, right) of serum glucose at week 10. (K) PTT (1 g/kg BW, left) and AUC (right) of serum glucose at week 11. (L) ITT (0.5 U/kg BW, left) and AUC (right) of serum glucose at week 12. mRNA expression levels of the target genes were normalized to the expression of mouse Gapdh. rAAV-NC group was set as 1 for fold-change calculation. n = 8 per group. Adgrf1, G-protein-coupled receptor 110; STC, standard chow diet; HFD, high-fat diet; NPC, non-parenchymal cell; BW, body weight; GTT, glucose tolerance test; PTT, pyruvate tolerance test; ITT, insulin tolerance test; AUC, area under curve; NC, negative control; HOMA-IR, homeostasis model assessment-estimated insulin resistance. Data represents as mean ± SEM; repeated with three independent experiments; p-value analyzed by two-tailed Student’s t-test. *p<0.05, **p<0.01, ***p<0.001.
-
Figure 2—source data 1
Overexpression of Adgrf1 in hepatocytes exaggerates metabolic dysregulation by HFD treatment.
- https://cdn.elifesciences.org/articles/85131/elife-85131-fig2-data1-v2.zip
Figure 2—figure supplement 1
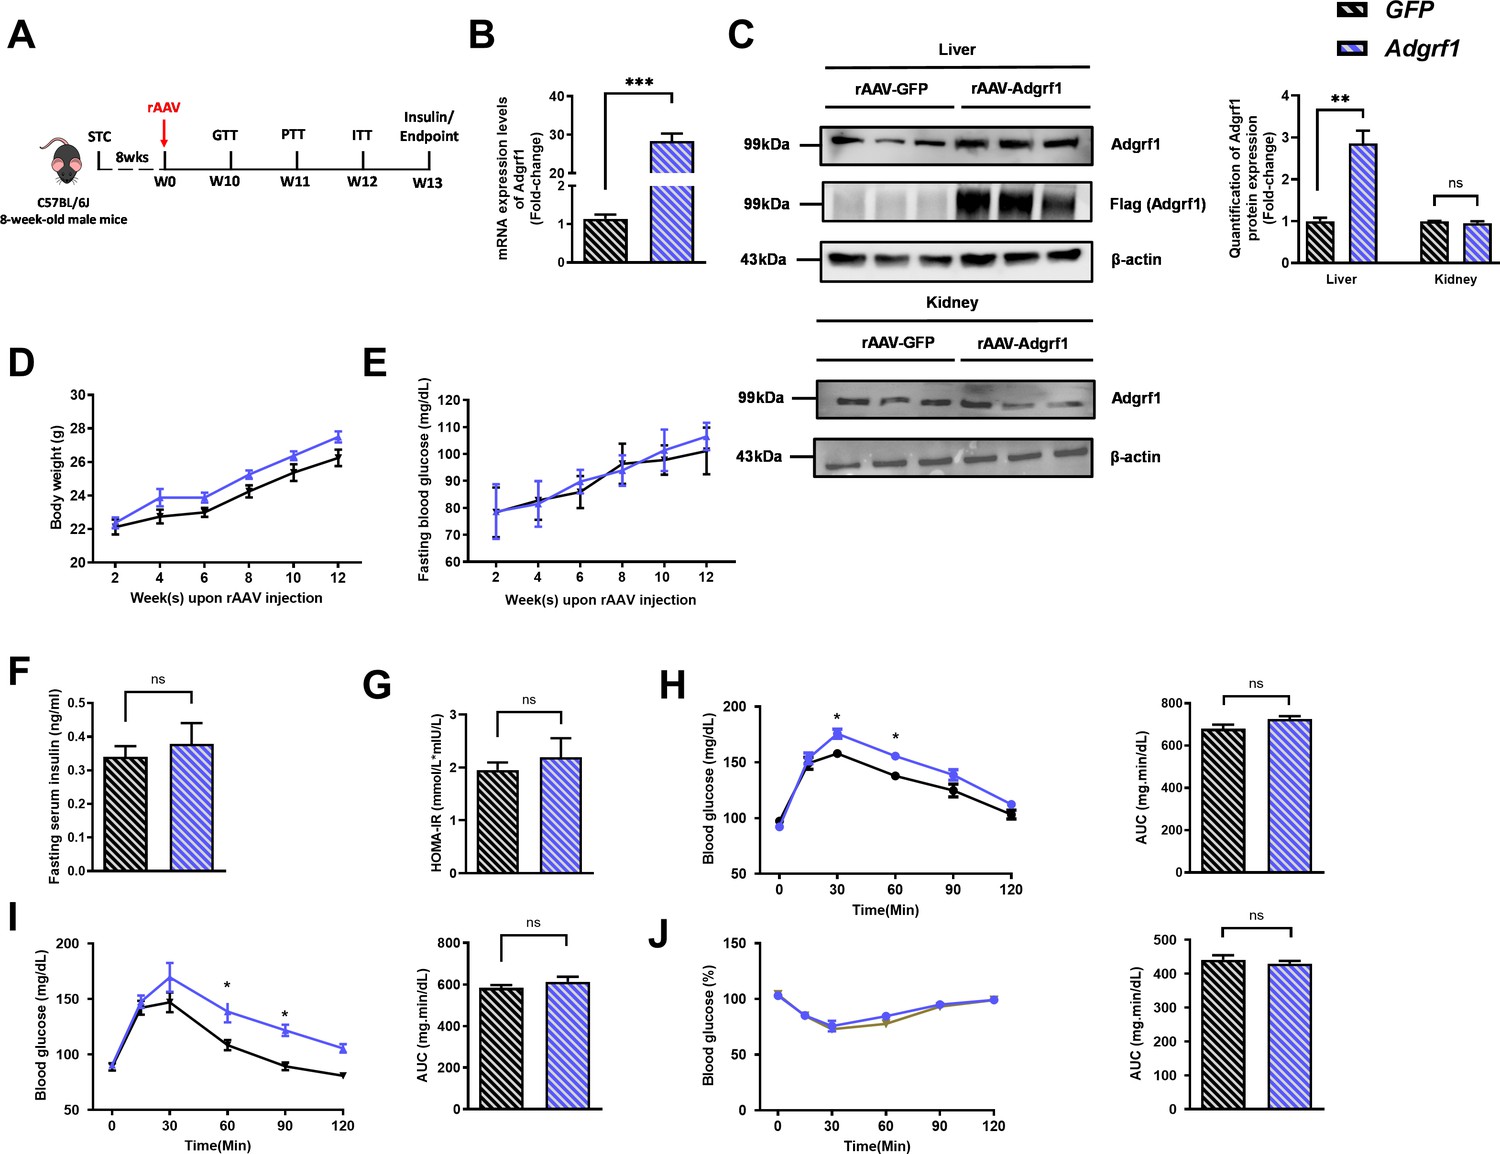
Hepatic overexpression of Adgrf1 in STC-fed mice exhibits mild metabolic abnormalities.
Eight-week-old male C57BL/6J mice were infected with 3 × 10¹¹ copies of AAV encoding Adgrf1 (rAAV-Adgrf1, i.v.) or control (rAAV-GFP, i.v.) and fed with STC diet. (A) Schematic illustration of viral treatments. (B) Hepatic mRNA expression levels of Adgrf1 from STC-fed mice with liver-specific Adgrf1 overexpression as determined by RT-qPCR analysis. (C) Left panel: immunoblotting analysis of hepatic protein expression level of Adgrf1 from STC-fed mice liver with Adgrf1 overexpression. Right panel: quantification of hepatic protein expression levels of Adgrf1. Each lane is a sample from a different individual; n = 3 per group. (D) Change of body weight and (E) fasting blood glucose at different weeks upon rAAV injection were measured. (F) Fasting blood insulin level and (G) HOMA-IR values were measured and calculated at the end the experiment. (H) GTT (1 g/kg BW, left) and area under curve (AUC, right) of serum glucose at the week of 10. (I) PTT (1 g/kg BW, left) and AUC (right) of serum glucose at week 11. (J) ITT (0.5 U/kg BW, left) and AUC (right) of serum glucose at week 12. mRNA expression levels of the target genes were normalized to the expression of mouse Gapdh. n = 8 per group. STC, standard chow diet; BW, body weight; i.v., intravenous injection; GTT, glucose tolerance test; PTT, pyruvate tolerance test; ITT, insulin tolerance test; AUC, area under curve; NC, negative control; HOMA-IR, homeostasis model assessment-estimated insulin resistance. Data represented as mean ± SEM; repeated with three independent experiments; p-value analyzed by two-tailed Student’s t-test. *p<0.05, **p<0.01, ***p<0.001.
-
Figure 2—figure supplement 1—source data 1
Hepatic overexpression of Adgrf1 in STC-fed mice exhibits mild metabolic abnormalities.
- https://cdn.elifesciences.org/articles/85131/elife-85131-fig2-figsupp1-data1-v2.zip
Figure 2—figure supplement 2
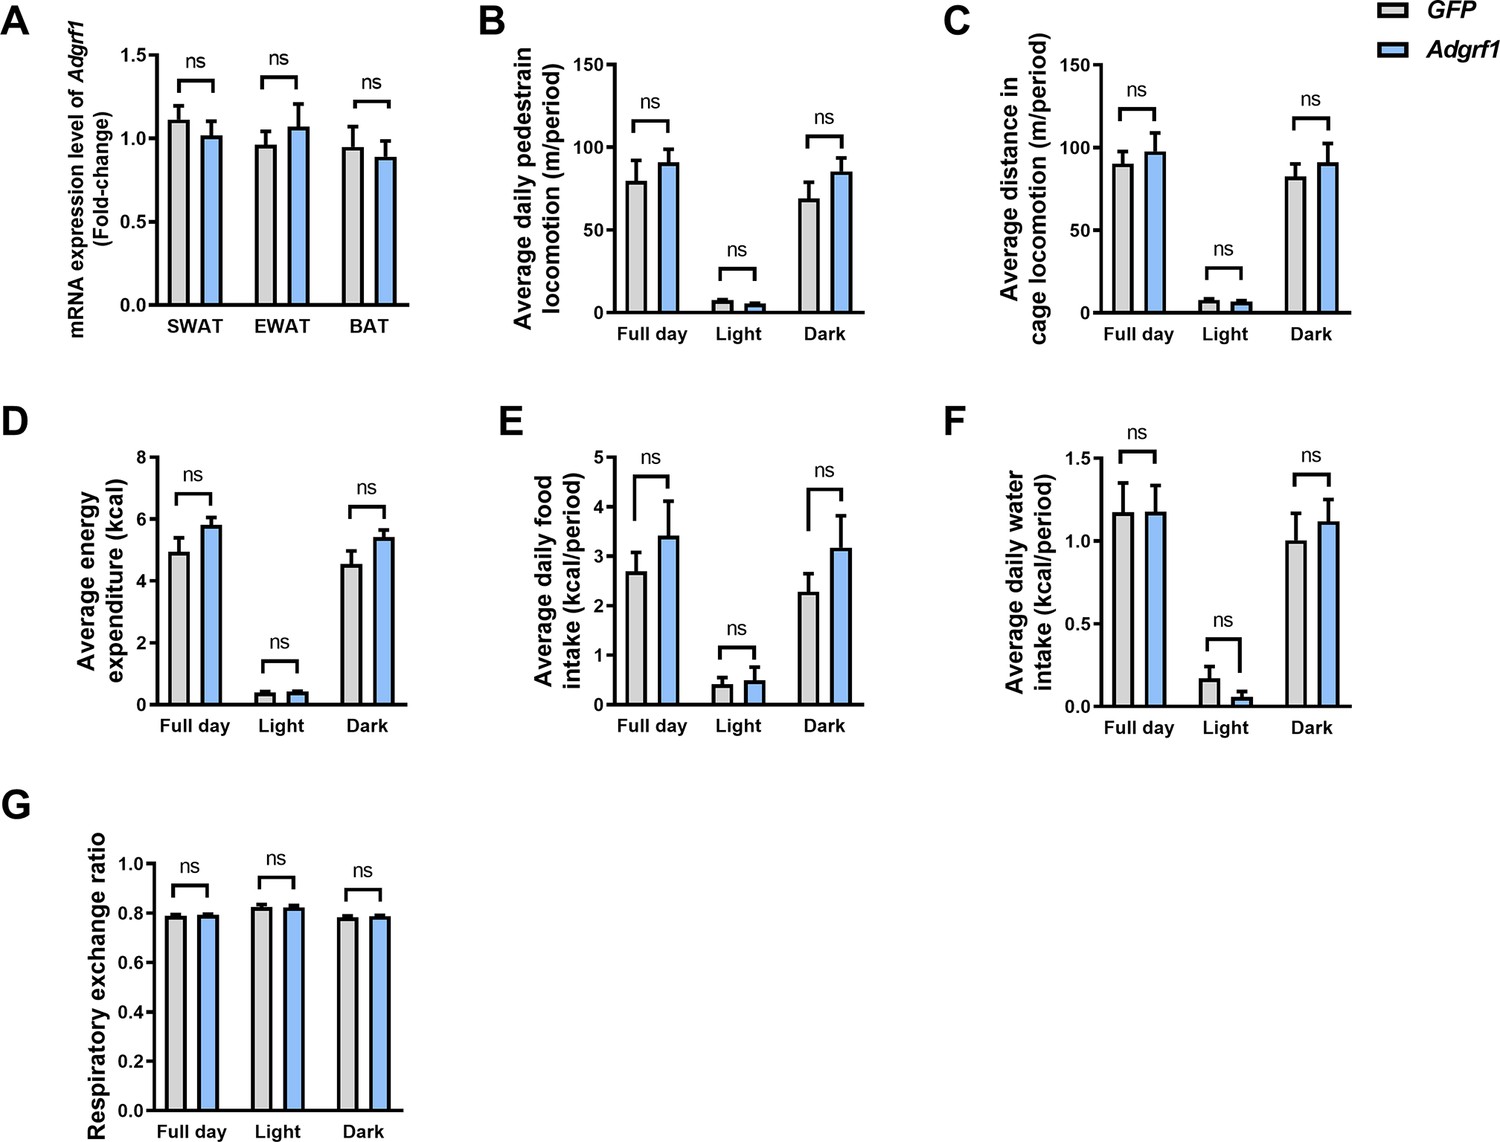
Overexpression of Adgrf1 did not interfere adipose tissues and other metabolic phenotypes.
(A) mRNA expression levels of Adgrf1 in SWAT, EWAT, and BAT as determined by RT-qPCR analysis. (B) The average daily pedestrian locomotion, (C) average distance in cage locomotion, (D) average energy expenditure, (E) average daily food intake, (F) average daily water intake, and (G) respiratory exchange ratio was measured. n = 4 per group. SWAT, subcutaneous adipose tissue; EWAT, epididymal white adipose tissue; BAT, brown adipose tissue. Data represented as mean ± SEM; repeated with three independent experiments; p-value analyzed by two-tailed Student’s t-test. *p<0.05, **p<0.01, ***p<0.001.
-
Figure 2—figure supplement 2—source data 1
Overexpression of Adgrf1 did not interfere adipose tissues and other metabolic phenotypes.
- https://cdn.elifesciences.org/articles/85131/elife-85131-fig2-figsupp2-data1-v2.zip
Figure 3 with 1 supplement
Deletion of hepatic Adgrf1 protects against diet-induced glucose intolerance in Adgrf1 overexpress mice.
Eight-week-old male C57BL/6J mice were infected with either 3 × 10¹¹ copies of rAAV encoding Adgrf1 (rAAV-Adgrf1, i.v.) or control (rAAV-GFP, i.v.) and two different sequences of Adgrf1 ASO (ASO1-Adgrf1, ASO2-Adgrf1, 5 mg/kg, one dose per week, s.c.) or scrambled control (ASO-NC, s.c.) received HFD feeding, respectively. (A) Schematic illustration of viral treatments. (B) Hepatic mRNA expression levels of Adgrf1 from different groups of mice received either GFP-NC, Adgrf1-NC, Adgrf1-ASO1, or Adgrf1-ASO2 fed with HFD, respectively, as determined by RT-qPCR analysis. (C) Left panel: immunoblotting analyses of Adgrf1 and β-tubulin from livers of HFD-fed rAAV-GFP or rAAV-Adgrf1 mice treated with either ASO-NC or ASO-Adgrf1. Each lane is a sample from a different individual. Right panel: quantification of protein expression levels of Adgrf1 and β-tubulin. Protein expression levels were normalized to the expression of β-tubulin. (D) BW was measured biweekly upon rAAV and ASO injection. (E) The percentage of fat mass and (F) the percentage of lean mass were measured at the end of the experiment. (G) The fasting blood glucose level of different groups was measured upon rAAV and ASO injection. (H) Fasting serum insulin level and (I) HOMA-IR index were measured and calculated according to the formula [Fasting blood glucose (mmol/l)×Fasting blood insulin (mIU/l)]/22.5 for the HFD-fed rAAV-Adgrf1 or rAAV-GFP mice at the end of the experiment. (J) GTT (1 g/kg BW, left) and AUC (right) of serum glucose at week 10. (K) PTT (1 g/kg BW, left) and AUC (right) of serum glucose at week 11. (L) ITT (0.5 U/kg BW, left) and AUC (right) of serum glucose at week 12. mRNA expression levels of the target genes were normalized to the expression of mouse Gapdh. rAAV-NC group was set as 1 for fold-change calculation. n = 8 per group. STC, standard chow diet; HFD, high-fat diet; ASO, antisense oligonucleotides; BW, body weight; GTT, glucose tolerance test; PTT, pyruvate tolerance test; ITT, insulin tolerance test; AUC, area under curve; NC, negative control; HOMA-IR, homeostasis model assessment-estimated insulin resistance. Data represented as mean ± SEM; repeated with three independent experiments; p-value analyzed by two-tailed Student’s t-test. *p<0.05, **p<0.01, ***p<0.001.
-
Figure 3—source data 1
Deletion of hepatic Adgrf1 protects against diet-induced glucose intolerance in Adgrf1 overexpress mice.
- https://cdn.elifesciences.org/articles/85131/elife-85131-fig3-data1-v2.zip
Figure 3—figure supplement 1
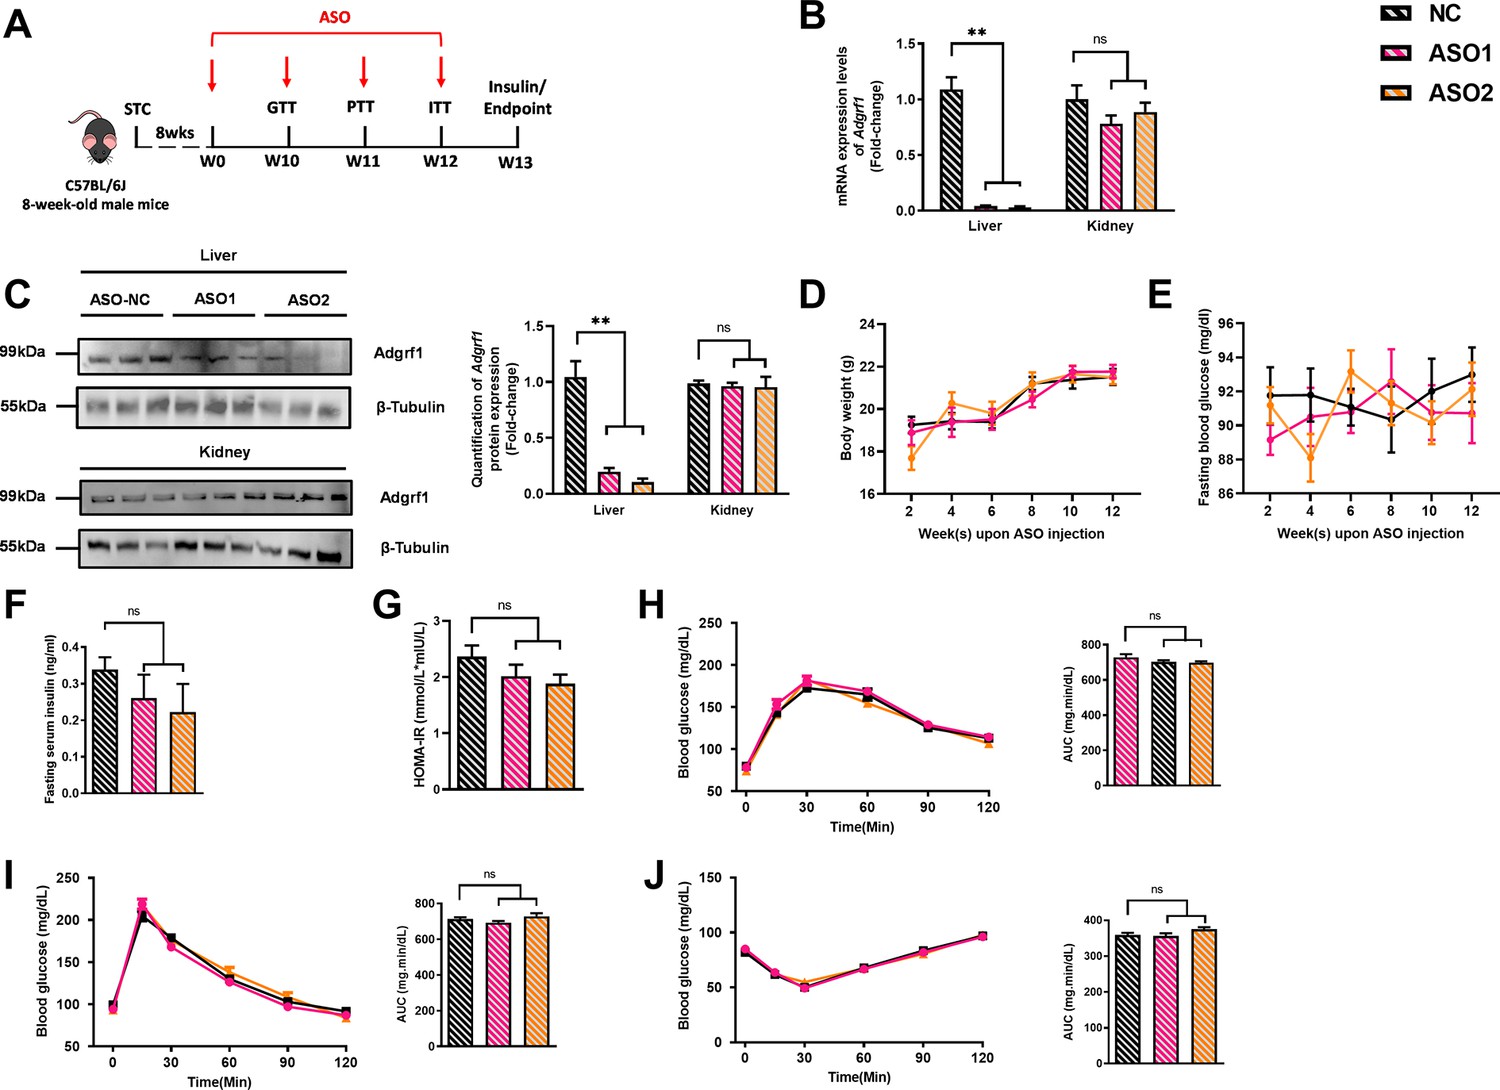
Hepatic knockdown of Adgrf1 in STC-fed mice does not exhibit metabolic abnormalities.
Eight-week-old male C57BL/6J mice were infected with two different sequences of Adgrf1 antisense oligonucleotides (ASO1-Adgrf1, ASO2-Adgrf1, 5 mg/kg, one dose per week, s.c.) or scrambled control (ASO-NC, s.c.) received STC feeding, respectively. (A) Schematic illustration of viral treatments. (B) mRNA expression levels of Adgrf1 in liver and kidney as determined by RT-qPCR analysis. mRNA expression levels of Adgrf1 in different tissues were normalized to the expression of mouse Gapdh. (C) Left panel: immunoblotting analysis of hepatic protein expression level of Adgrf1 from STC-fed mice liver with Adgrf1 knockdown. Right panel: quantification of hepatic protein expression levels of Adgrf1. Each lane is a sample from a different individual. (D) Change of body weight and (E) fasting blood glucose at different weeks upon rAAV injection were measured. (F) Fasting blood insulin level and (G) HOMA-IR values were measured and calculated at the end the experiment. (H) GTT (1 g/kg BW, left) and area under curve (AUC, right) of serum glucose at the week of 10. (I) PTT (1 g/kg BW, left) and AUC (right) of serum glucose at week 11. (J) ITT (0.5 U/kg BW, left) and AUC (right) of serum glucose at week of 12. mRNA expression levels of the target genes were normalized to the expression of mouse Gapdh. STC, standard chow diet; s.c., subcutaneous injection; ASO, antisense oligonucleotides; BW, body weight; GTT, glucose tolerance test; PTT, pyruvate tolerance test; ITT, insulin tolerance test; AUC, area under curve; NC, negative control; HOMA-IR, homeostasis model assessment-estimated insulin resistance. Data represented as mean ± SEM; n = 8 mice per group; repeated with three independent experiments; p-value analyzed by two-tailed Student’s t- test. *p<0.05, **p<0.01, ***p<0.001.
-
Figure 3—figure supplement 1—source data 1
Hepatic knockdown of Adgrf1 in STC-fed mice does not exhibit metabolic abnormalities.
- https://cdn.elifesciences.org/articles/85131/elife-85131-fig3-figsupp1-data1-v2.zip
Figure 4
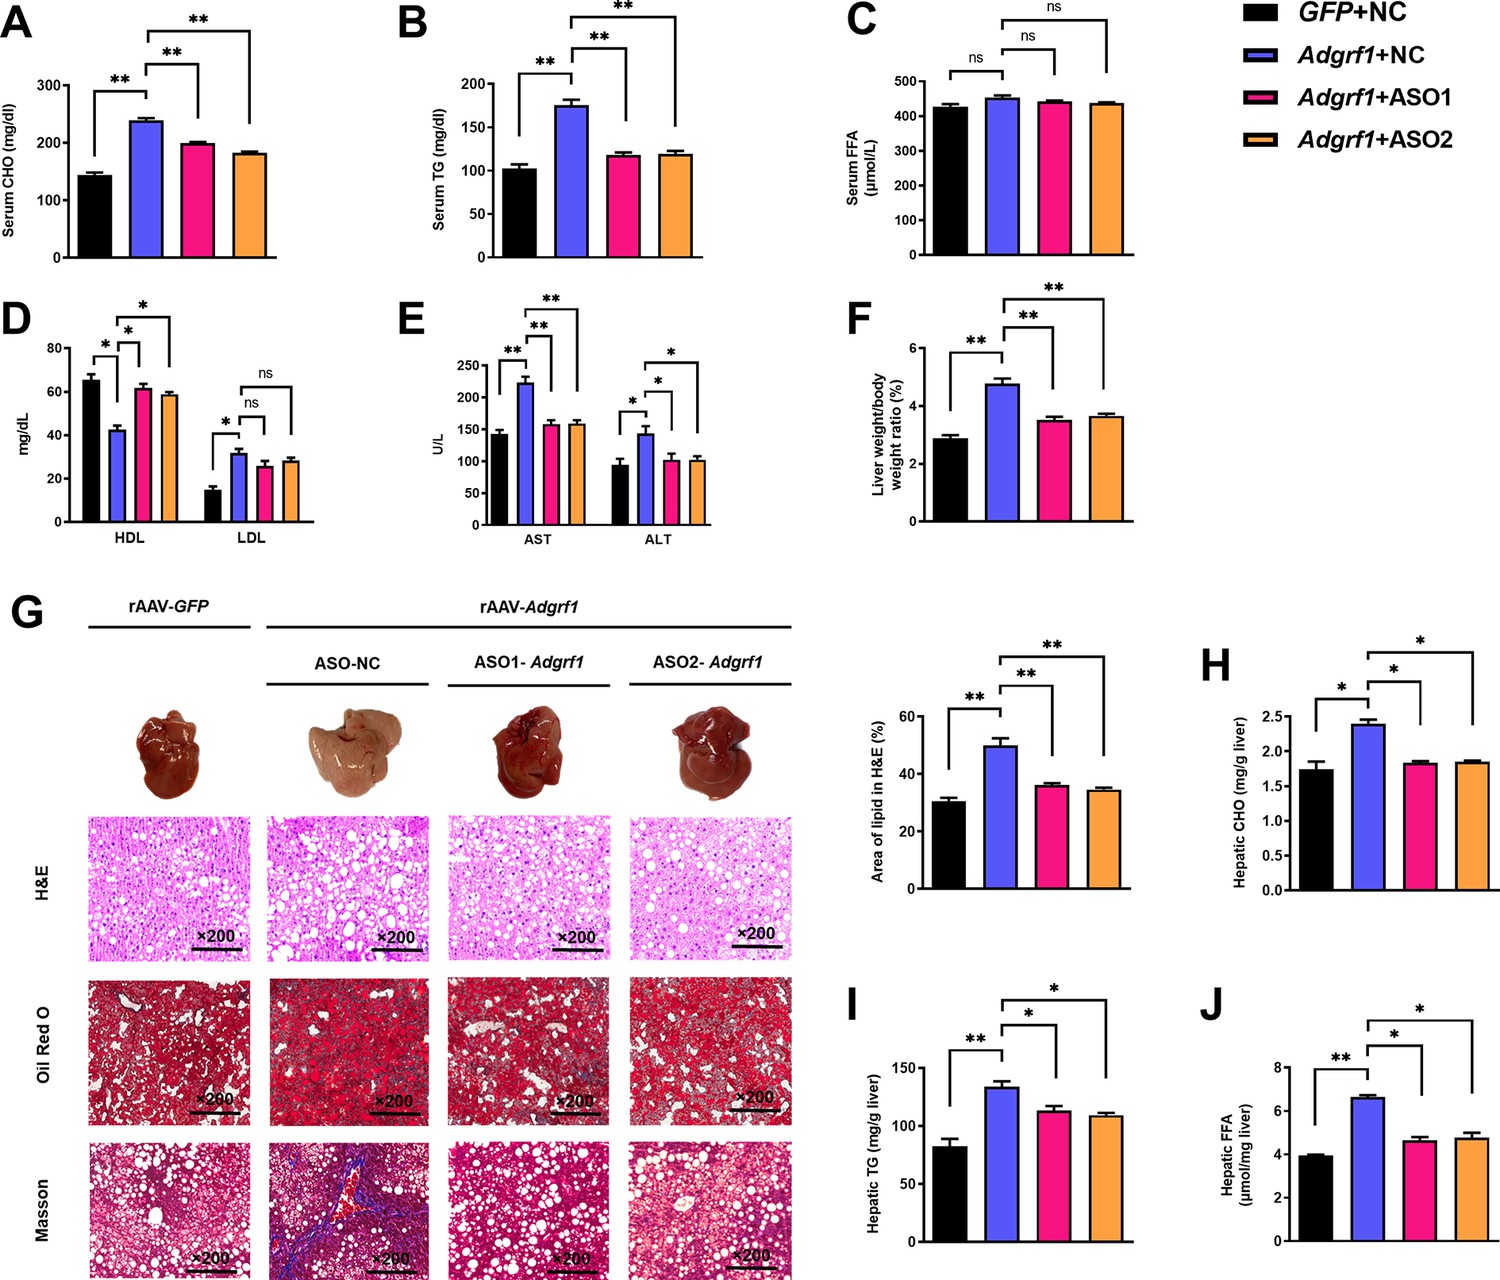
Upregulation of hepatic Adgrf1 exaggerates liver steatosis in HFD-fed mice while downregulation of hepatic Adgrf1 protects mice from diet-induced liver lipid accumulation.
Eight-week-old male C57BL/6J mice were infected with either 3 × 10¹¹ copies of rAAV encoding Adgrf1 (rAAV-Adgrf1, i.v.) or control (rAAV-NC, i.v.) and two different sequences of Adgrf1 antisense oligonucleotides (ASO1-Adgrf1, ASO2-Adgrf1, 5 mg/kg, one dose per week, s.c.) or scrambled control (ASO-NC, s.c.) received HFD feeding, respectively. (A) Serum CHO, (B) serum TG, and (C) serum FFA levels were measured at week 13. (D) Serum HDL and LDL. (E) The levels of serum AST ALT. (F) The ratio of the liver weight against body weight was calculated after sacrificing the mice from four different groups. (G) Representative gross pictures of liver tissues (upper panels), representative images of H&E (middle panels) and Oil Red O (lower panels) staining of liver sections (200 µm). The percentage of lipid area according to H&E staining (right panel). (H) Hepatic CHO, (I) hepatic TG, and (J) hepatic FFA were normalized by the weight of liver samples used for lipid extraction. n = 8 per group. i.v., intravenous injection; s.c., subcutaneous injection; STC, standard chow diet; HFD, high-fat diet; ASO, antisense oligonucleotides; BW, body weight; CHO, cholesterol; TG, triglyceride; FFA, free fatty acid; HDL, high-density lipoprotein; LDL, low-density lipoprotein; AST, aspartate transaminase; ALT, alanine transaminase; H&E, hematoxylin-eosin. Data represented as mean ± SEM; repeated with three independent experiments; p-value analyzed by two-tailed Student’s t-test. *p<0.05, **p<0.01, ***p<0.001.
-
Figure 4—source data 1
Upregulation of hepatic Adgrf1 exaggerates liver steatosis in HFD-fed mice while downregulation of hepatic Adgrf1 protects mice from diet-induced liver lipid accumulation.
- https://cdn.elifesciences.org/articles/85131/elife-85131-fig4-data1-v2.zip
Figure 5
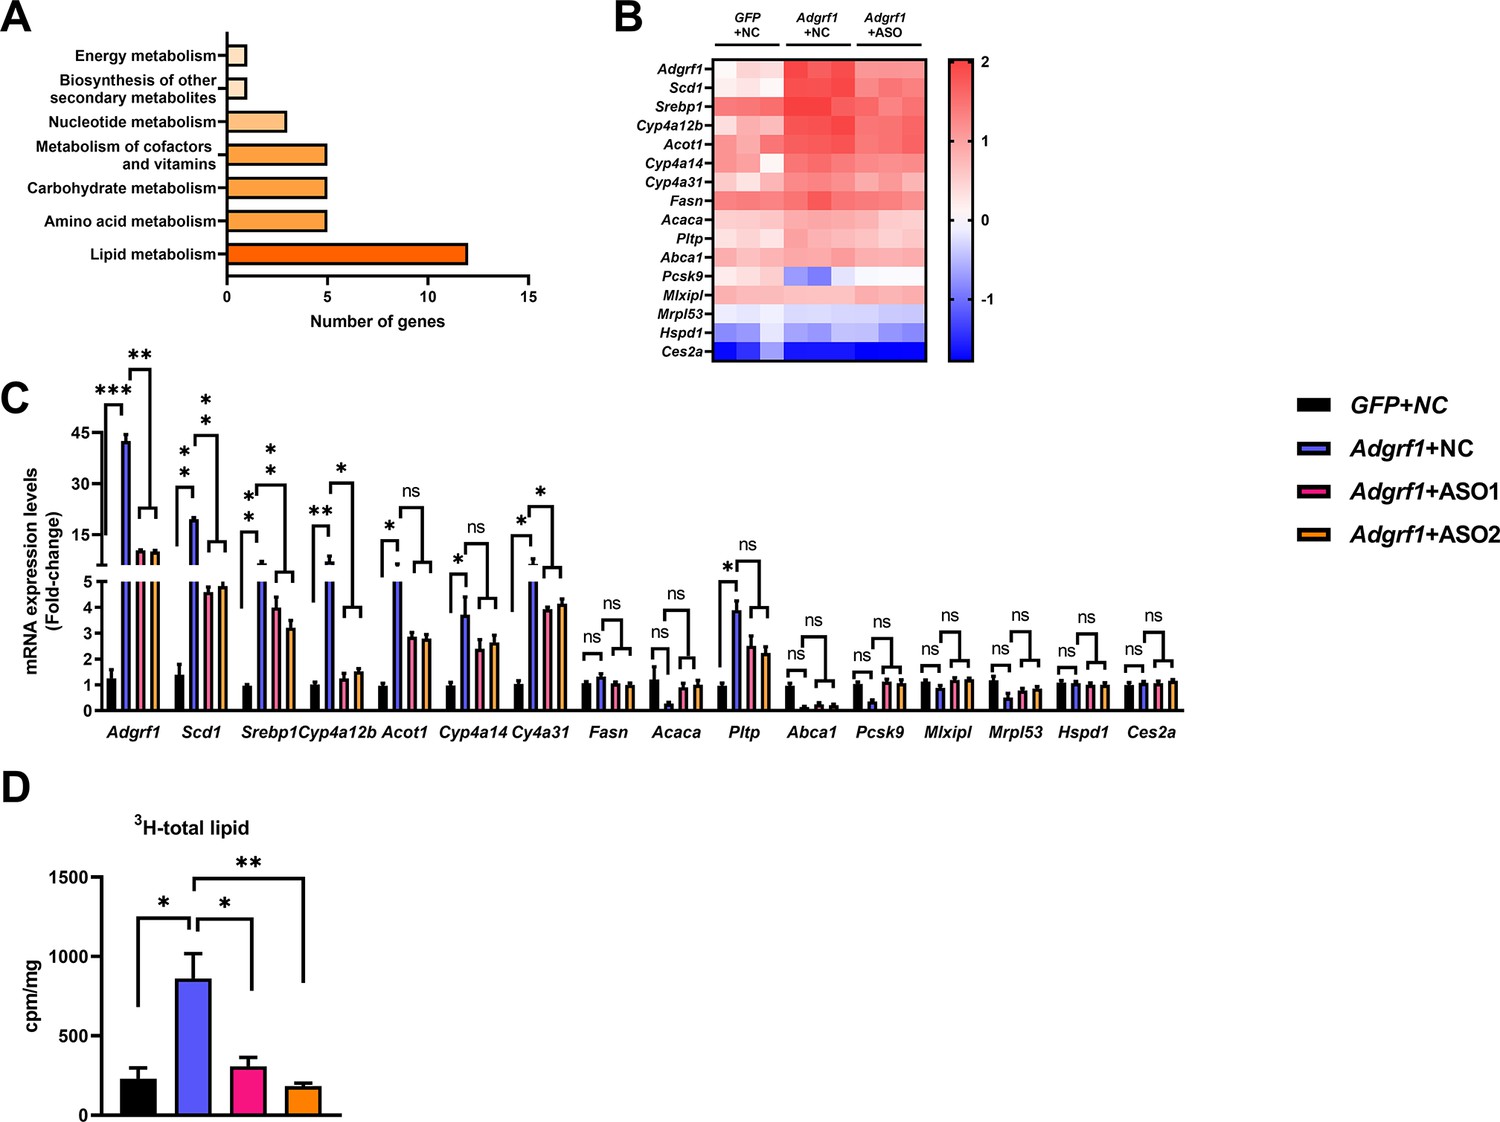
Adgrf1 is a major regulator of hepatic lipid metabolism.
Eight-week-old male C57BL/6J mice were infected with either 3 × 10¹¹ copies of rAAV encoding Adgrf1 (rAAV-Adgrf1, i.v.) or control (rAAV-NC, i.v.) and two Adgrf1 antisense oligonucleotides (ASO1-Adgrf1, ASO2-Adgrf1, 5 mg/kg, one dose per week, s.c.) or scrambled control (ASO-NC, s.c.) and received HFD feeding, respectively. Mice were sacrificed and mRNA of liver from each group were extracted and RNA-seq analysis was conducted. (A) KEGG pathway assay of differential mRNA transcripts in rAAV and ASO groups identified by RNA-seq. (B) Heat map shows the log2 scale fold change in the expression levels of a set of genes involved in lipid metabolism from RNA seq data of livers in HFD-fed mice treated by rAAV-Adgrf1 or rAAV-Adgrf1 plus Adgrf1-ASO1. n = 3 per group. (C) mRNA expression levels of genes according to the heat map from different groups of mice received either GFP-NC, Adgrf1-NC, Adgrf1-ASO1, or Adgrf1-ASO2 fed with HFD, respectively, as determined by RT-qPCR analysis, n = 6 mice per group. (D) De novo lipogenic activity was measured the 3H labeling of lipogenic Acetyl-CoA from 0.5 μCi 3H-acetate. ASO, antisense oligonucleotides. STC, standard chow diet; HFD, high-fat diet; i.v., intravenous injection; s.c., subcutaneous injection; ASO, antisense oligonucleotides; KEGG, Kyoto Encyclopedia of Genes and Genomes; GEO, gene expression omnibus; NAFLD, non-alcoholic fatty liver disease. Data represented as mean ± SEM; p-value analyzed by two-tailed Student’s t-test. *p<0.05, **p<0.01, ***p<0.001.
-
Figure 5—source data 1
Adgrf1 is a major regulator of hepatic lipid metabolism.
- https://cdn.elifesciences.org/articles/85131/elife-85131-fig5-data1-v2.zip
Figure 6
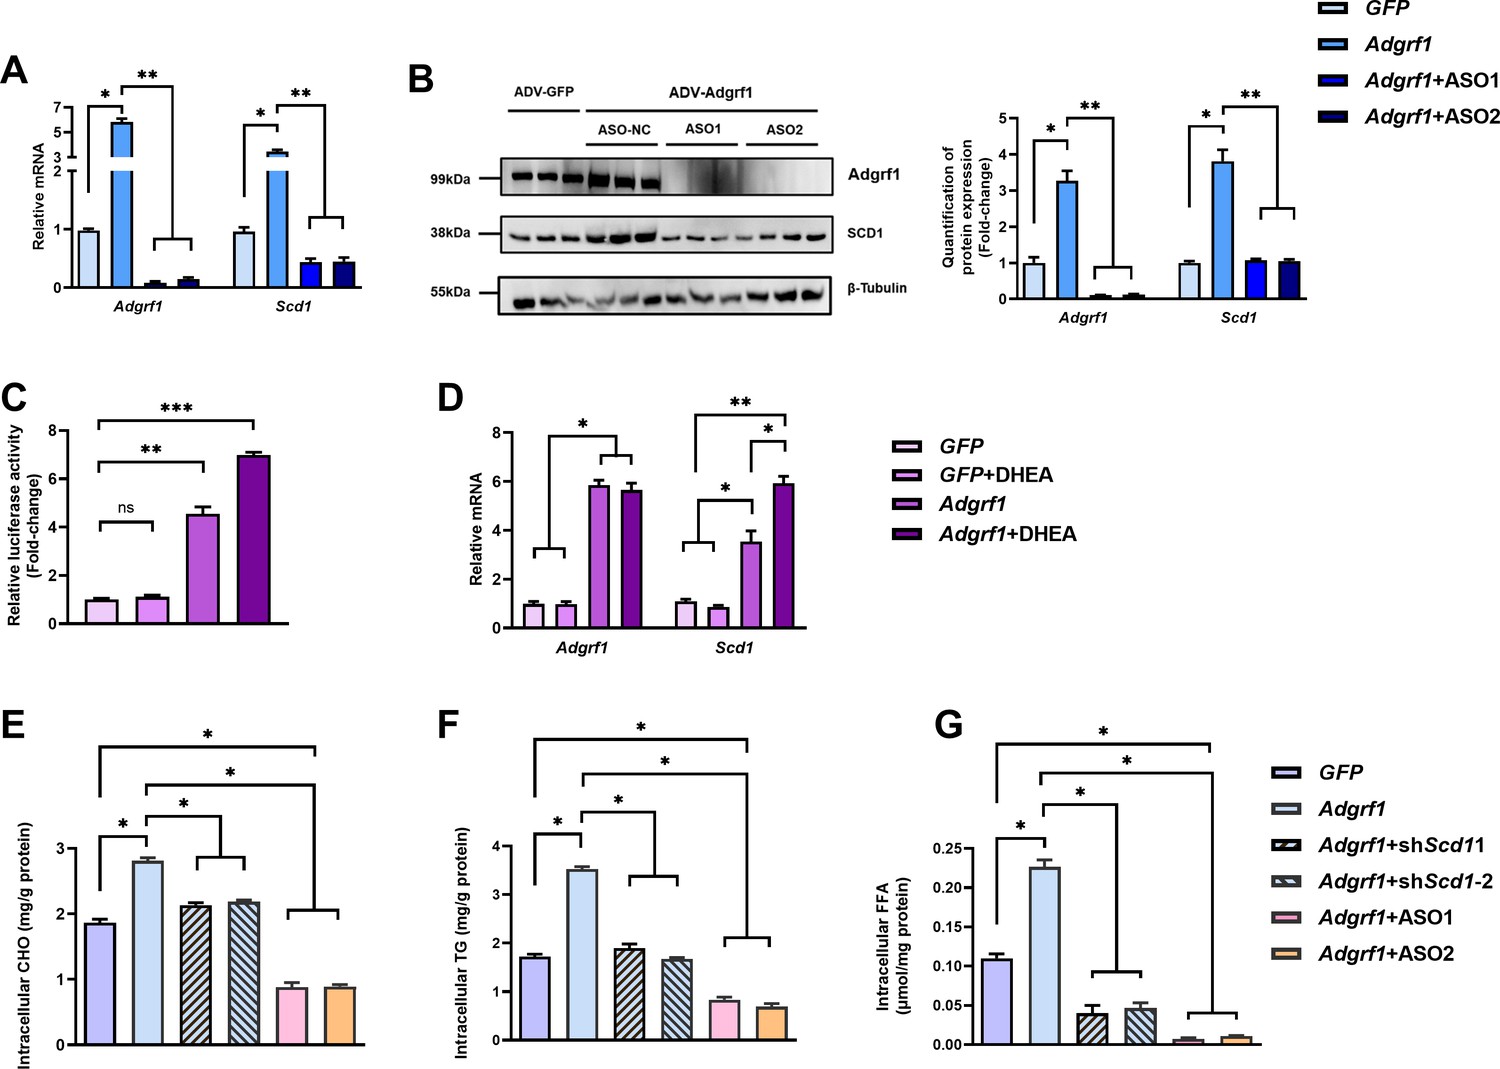
Scd1 expression is regulated by Adgrf1 in primary hepatocytes.
Primary hepatocytes were isolated from 8-week-old male C57BL/6J mice with STC. (A) Primary hepatocytes were infected with either adenoviral vector expressing Adgrf1 (ADV-Adgrf1) or control adenovirus expressing GFP (ADV-GFP) 24 hr after plating, followed by transfection with ASO1-Adgrf1, ASO2-Adgrf1, or ASO-NC for another 6 hr (n = 6). mRNA expression levels of Adgrf1 and Scd1 from different groups were assessed, as determined by RT-qPCR analysis. (B) Left panel: immunoblotting analysis for the expression level of Adgrf1 and Scd1 from different groups of primary hepatocytes. Right panel: quantification of protein expression levels of Adgrf1 and Scd1. Protein expression levels were normalized to the expression of β-tubulin. Each lane is a sample from a different plate. Right panel: quantification of protein expression levels of Adgrf1, Scd1, and β-tubulin. n = 3 per group. Protein expression levels were normalized to the expression of β-tubulin. The samples for GFP were set as 1 for fold-change calculation. (C, D) HEK293T cells were infected with pGL3-Scd1 promoter-luciferase plasmid and adenoviral vector expressing Adgrf1 (ADV-Adgrf1) or GFP (ADV-GFP) for 48 hr and DHEA was added to the transfected cells at the concentration of 100 μM for 24 hr. Cell lysates were used for (C) luciferase assay or (D) RT-qPCR analysis (n = 3). Lysates from the cell co-transfection with pGL3-Scd1 promoter-luciferase plasmid and ADV-GFP without treatment of DHEA was set as 1 for fold-change calculation. (E–G) Primary hepatocytes were infected with either adenoviral vector expressing Adgrf1 (ADV-Adgrf1) or control ADV-GFP, followed by transfecting with scramble or shScd1-1 or shScd1-2 plasmids for another 72 hr. Intracellular lipids were extracted and (E) CHO, (F) TG, and (G) FFA were assessed (n = 3). STC, standard chow diet; i.v., intravenous injection; s.c., subcutaneous injection; ASO, antisense oligonucleotides. CHO, cholesterol; TG, triglyceride; FFA, free fatty acid. Data represented as mean ± SEM; repeated with three independent experiments; p-value analyzed by two-tailed Student’s t-test. *p<0.05, **p<0.01, ***p<0.001.
-
Figure 6—source data 1
Scd1 expression is regulated by Adgrf1 in primary hepatocytes.
- https://cdn.elifesciences.org/articles/85131/elife-85131-fig6-data1-v2.zip
Figure 7
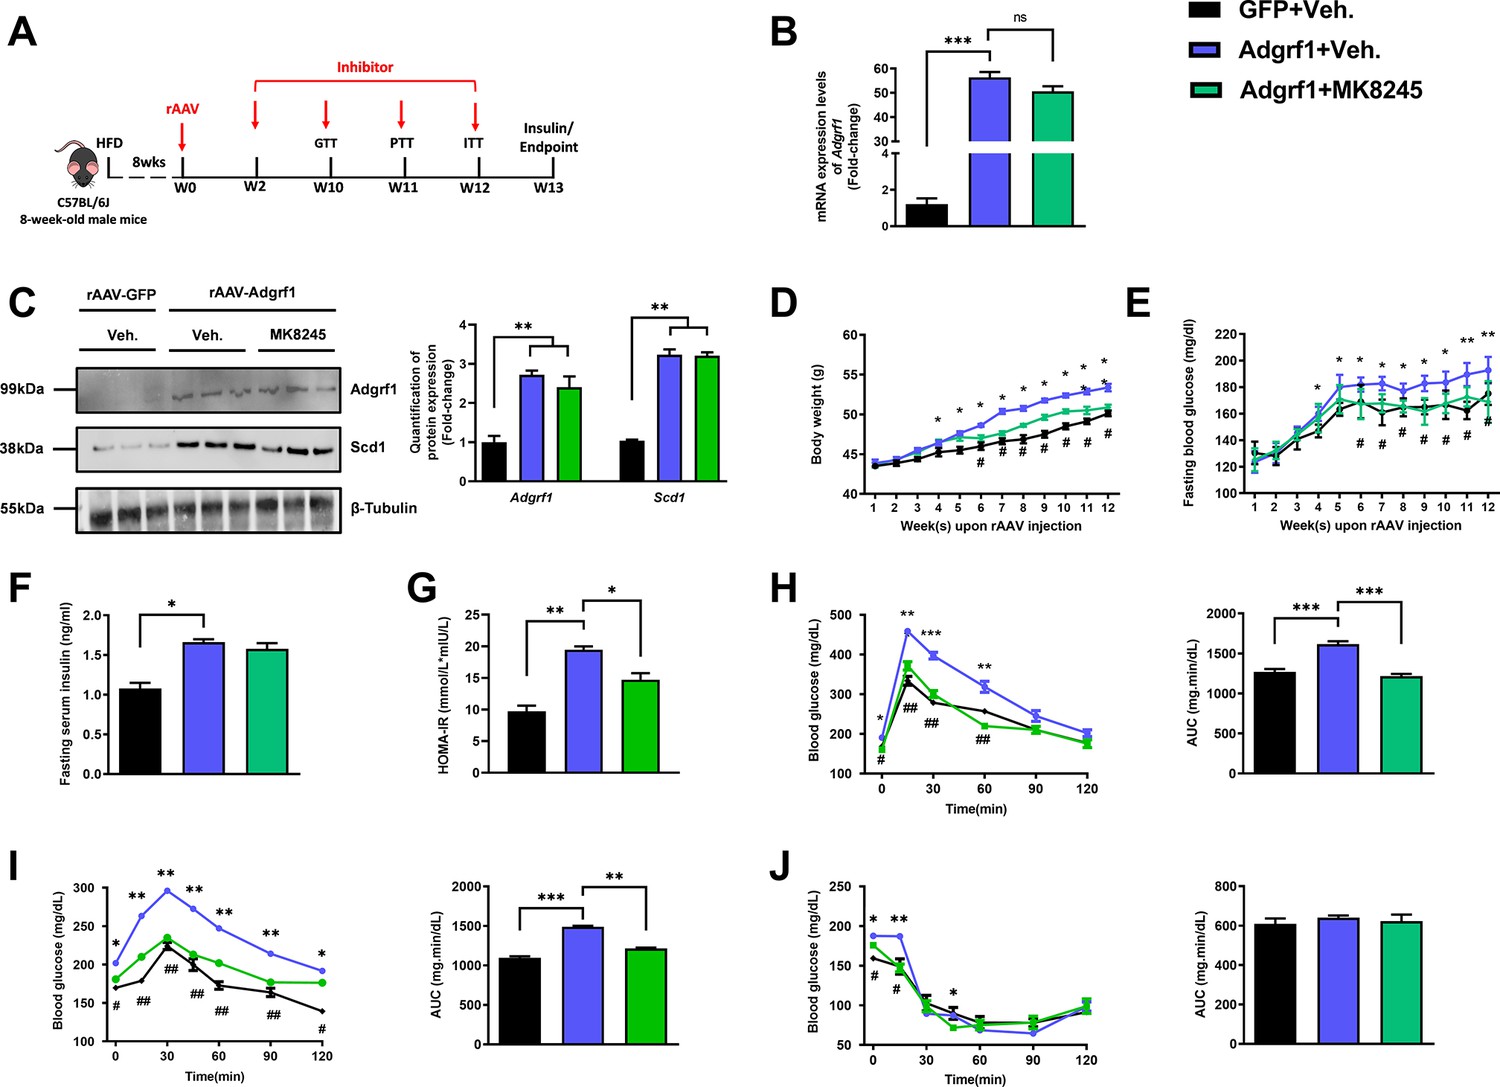
Inhibition of Scd1 alleviates the glucose impairment in mice with hepatic Adgrf1 overexpression.
Eight-week-old male C57BL/6J mice were infected with either 3 × 10¹¹ copies of rAAV encoding Adgrf1 (rAAV-Adgrf1, i.v.) or control (rAAV-GFP, i.v.) and Scd1 inhibitor (MK8245, 10 mg/kg/week, p.o.) or inhibitor vehicle (inhibitor-Veh., p.o.) received HFD feeding. (A) Schematic illustration of viral treatments. (B) Hepatic mRNA expression levels of Adgrf1 from different groups of mice received rAAV and inhibitor fed with HFD, respectively, as determined by RT-qPCR analysis. (C) Left panel: immunoblotting analysis for the hepatic protein expression level of Adgrf1 and Scd1 from different groups of mice fed with HFD. Right panel: quantification of protein expression levels of Adgrf1 and Scd1. Protein expression levels were normalized to the expression of β-tubulin. Each lane is a sample from a different individual. (D) BW and (E) fasting blood glucose level were measured at different weeks upon rAAV and inhibitor injection. (F) The fasting blood insulin level and (G) HOMA-IR index were measured and calculated according to the formula [Fasting blood glucose (mmol/l)×Fasting blood insulin (mIU/l)]/22.5 for the HFD-fed rAAV-Adgrf1 or rAAV-GFP mice at the end of the experiment. (H) GTT (1 g/kg BW, left) and AUC (right) of serum glucose at the week of 10. (I) PTT (1 g/kg BW, left) and AUC (right) of serum glucose at week 11. (J) ITT (0.5 U/kg BW, left) and AUC (right) of serum glucose at week of 12. mRNA expression levels of the target genes were normalized to the expression of mouse Gapdh. rAAV-NC group was set as 1 for fold-change calculation. n = 8 per group. HFD, high-fat diet; i.v., intravenous injection; p.o., oral administration; ASO, antisense oligonucleotides; BW, body weight; GTT, glucose tolerance test; PTT, pyruvate tolerance test; ITT, insulin tolerance test; AUC, area under curve; NC, negative control; HOMA-IR, homeostasis model assessment-estimated insulin resistance. Data represented as mean ± SEM; repeated with three independent experiments; p-value analyzed by two-tailed Student’s t-test. *p<0.05, **p<0.01, ***p<0.001.
-
Figure 7—source data 1
Inhibition of Scd1 alleviates the glucose impairment in mice with hepatic Adgrf1 overexpression.
- https://cdn.elifesciences.org/articles/85131/elife-85131-fig7-data1-v2.zip
Figure 8
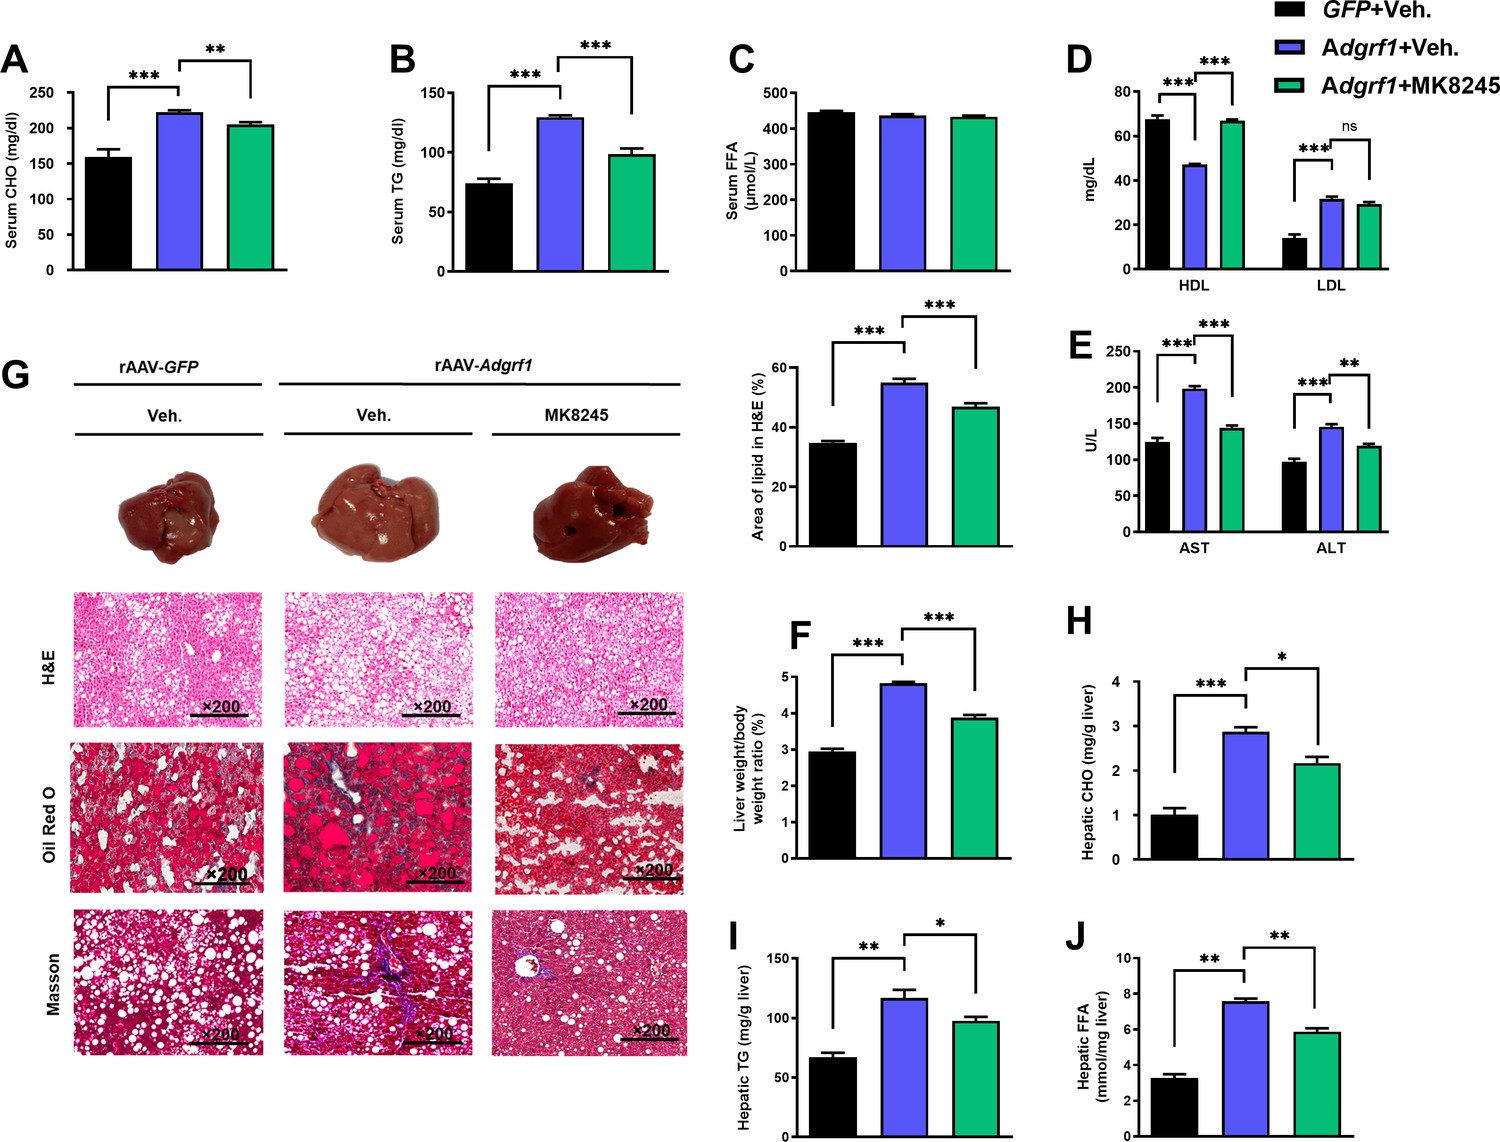
Inhibition of hepatic Scd1 partially alleviates the severity of hepatic steatosis in Adgrf1 overexpression mice.
Eight-week-old male C57BL/6N mice were infected with either 3 × 10¹¹ copies of rAAV encoding Adgrf1 (rAAV-Adgrf1, i.v.) or control (rAAV-GFP, i.v.) and administered with Scd1 inhibitor (MK8245, 10 mg/kg, p.o.) or inhibitor vehicle (inhibitor-Veh., p.o.) received HFD feeding. (A) Serum CHO, (B) serum TG, and (C) serum FFA levels were measured at the end of experiment. (D) Serum HDL and LDL, (E) AST and ALT level of each group of mice were measured at the end of the experiment. (F) The ratio of the liver weight against body weight was calculated after sacrificing the mice from four different groups. (G) Representative gross pictures of liver tissues (upper panels), representative images of H&E (middle panels) and Oil Red O (lower panels) staining of liver sections (200 µm). The percentage of lipid area according to H&E staining (right panel). (H) Hepatic CHO, (I) hepatic TG, and (J) hepatic FFA were normalized by the weight of liver samples used for lipid extraction. n = 8 per group. STC, standard chow diet; HFD, high-fat diet; i.v., intravenous injection; p.o., oral administration; CHO, cholesterol; TG, triglyceride; FFA, free fatty acid; HDL, high-density lipoprotein; LDL, low-density lipoprotein; AST, aspartate transaminase; ALT, alanine transaminase; H&E, hematoxylin-eosin. Data represented as mean ± SEM; repeated with three independent experiments; p-value analyzed by two-tailed Student’s t-test. *p<0.05, **p<0.01, ***p<0.001.
-
Figure 8—source data 1
Inhibition of hepatic Scd1 partially alleviates the severity of hepatic steatosis in Adgrf1 overexpression mice.
- https://cdn.elifesciences.org/articles/85131/elife-85131-fig8-data1-v2.zip
Figure 9
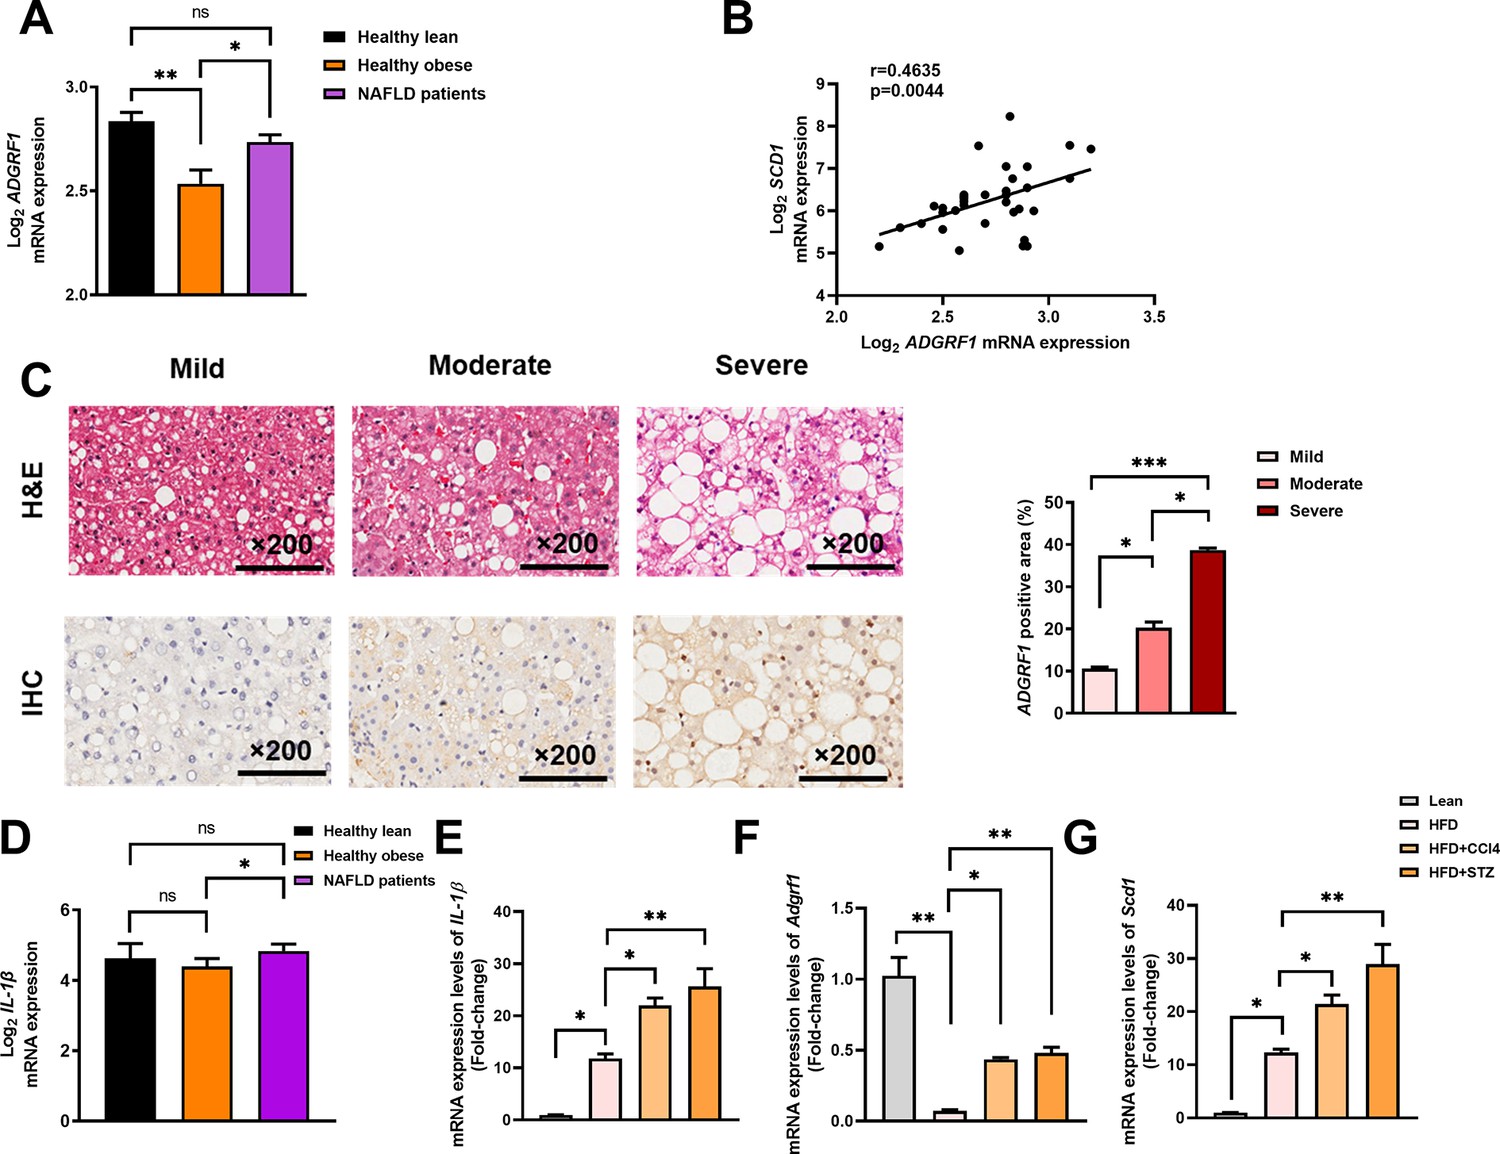
Hepatic expression of ADGRF1 is upregulated in obese patients with hepatic steatosis when compared to those with normal liver morphology, which is positively associated with hepatic SCD1 expression level.
NAFLD patients have higher hepatic expression of ADGRF1 accompanied with increased mRNA Scd1 expression. (A) Normalized Log2 mRNA expression of ADGRF1 in lean people without NAFLD (n = 12), obese people without NAFLD (n = 17), or obese patients with NAFLD (n = 8) according to the GEO database (GEO; Profile # GDS4881/8126820). (B) Correlation between ADGRF1 and SCD1 in liver of human subjects based on the GEO database. (C) Representative images of liver tissues with H&E staining (upper panels) and immunohistochemical staining (IHC) of ADGRF1 (lower panels) from patients with different degree of NAFLD (200 µm). The percentage of ADGRF1 positive area according to H&E staining (right panel). The percentage of ADGRF1-positive areas according to IHC staining (right panel); n = 3 per group. (D) Normalized Log2 mRNA expression of IL-1β in lean people without NAFLD (n = 12), obese people without NAFLD (n = 17), or obese patients with NAFLD (n = 8) according to the GEO database (GEO; Profile # GDS4881/8126820). (E) Hepatic mRNA expression levels of lL-1β, (F) Adgrf1, and (G) Scd1 in either STC-fed mice or HFD-fed mice treated with CCl4 or STZ as determined by RT-qPCR. Data represented as mean ± SEM. p-Value analyzed by two-tailed Student’s t-test. *p<0.05, **p<0.01, ***p<0.001.
-
Figure 9—source data 1
Hepatic expression of ADGRF1 is upregulated in obese patients with hepatic steatosis when compared to those with normal liver morphology, which is positively associated with hepatic SCD1 expression level.
- https://cdn.elifesciences.org/articles/85131/elife-85131-fig9-data1-v2.zip
Tables
Author response table 1
| Sequence | GalNac position | Position of 2’ sugar modification | |
|---|---|---|---|
| ASO1 | AGGAAAATTTCGCTGA | 5’-end | 3*-10-3* |
| ASO2 | GAATTTTAGGACTTGC | 5’-end | 3*-10-3* |
Additional files
-
MDAR checklist
- https://cdn.elifesciences.org/articles/85131/elife-85131-mdarchecklist1-v2.pdf
-
Supplementary file 1
List of primary antibodies.
- https://cdn.elifesciences.org/articles/85131/elife-85131-supp1-v2.zip
-
Supplementary file 2
List of primers used for RT-qPCR.
- https://cdn.elifesciences.org/articles/85131/elife-85131-supp2-v2.zip
-
Supplementary file 3
Expression of GPCRs in the liver of mice fed with either STC or HFD diet for 8 weeks by gene expression microarray analysis.
- https://cdn.elifesciences.org/articles/85131/elife-85131-supp3-v2.zip
-
Supplementary file 4
Expression of lipogenic genes in the liver of mice fed with either STC or HFD diet for 8 weeks by gene expression microarray analysis.
- https://cdn.elifesciences.org/articles/85131/elife-85131-supp4-v2.zip
-
Supplementary file 5
Raw data for baseline characteristics of study cohorts.
- https://cdn.elifesciences.org/articles/85131/elife-85131-supp5-v2.zip
Download links
A two-part list of links to download the article, or parts of the article, in various formats.
Downloads (link to download the article as PDF)
Open citations (links to open the citations from this article in various online reference manager services)
Cite this article (links to download the citations from this article in formats compatible with various reference manager tools)
Amelioration of non-alcoholic fatty liver disease by targeting adhesion G protein-coupled receptor F1 (Adgrf1)
eLife 12:e85131.
https://doi.org/10.7554/eLife.85131


