Statistical inference reveals the role of length, GC content, and local sequence in V(D)J nucleotide trimming
- Computational Biology Program, Fred Hutchinson Cancer Center, United States
- Molecular and Cellular Biology Program, University of Washington, United States
- Department of Biostatistics, University of Washington, United States
- Institute for Protein Design, Department of Biochemistry, University of Washington, United States
- Department of Genome Sciences, University of Washington, United States
- Department of Statistics, University of Washington, United States
- Howard Hughes Medical Institute, United States
Figures
Figure 1
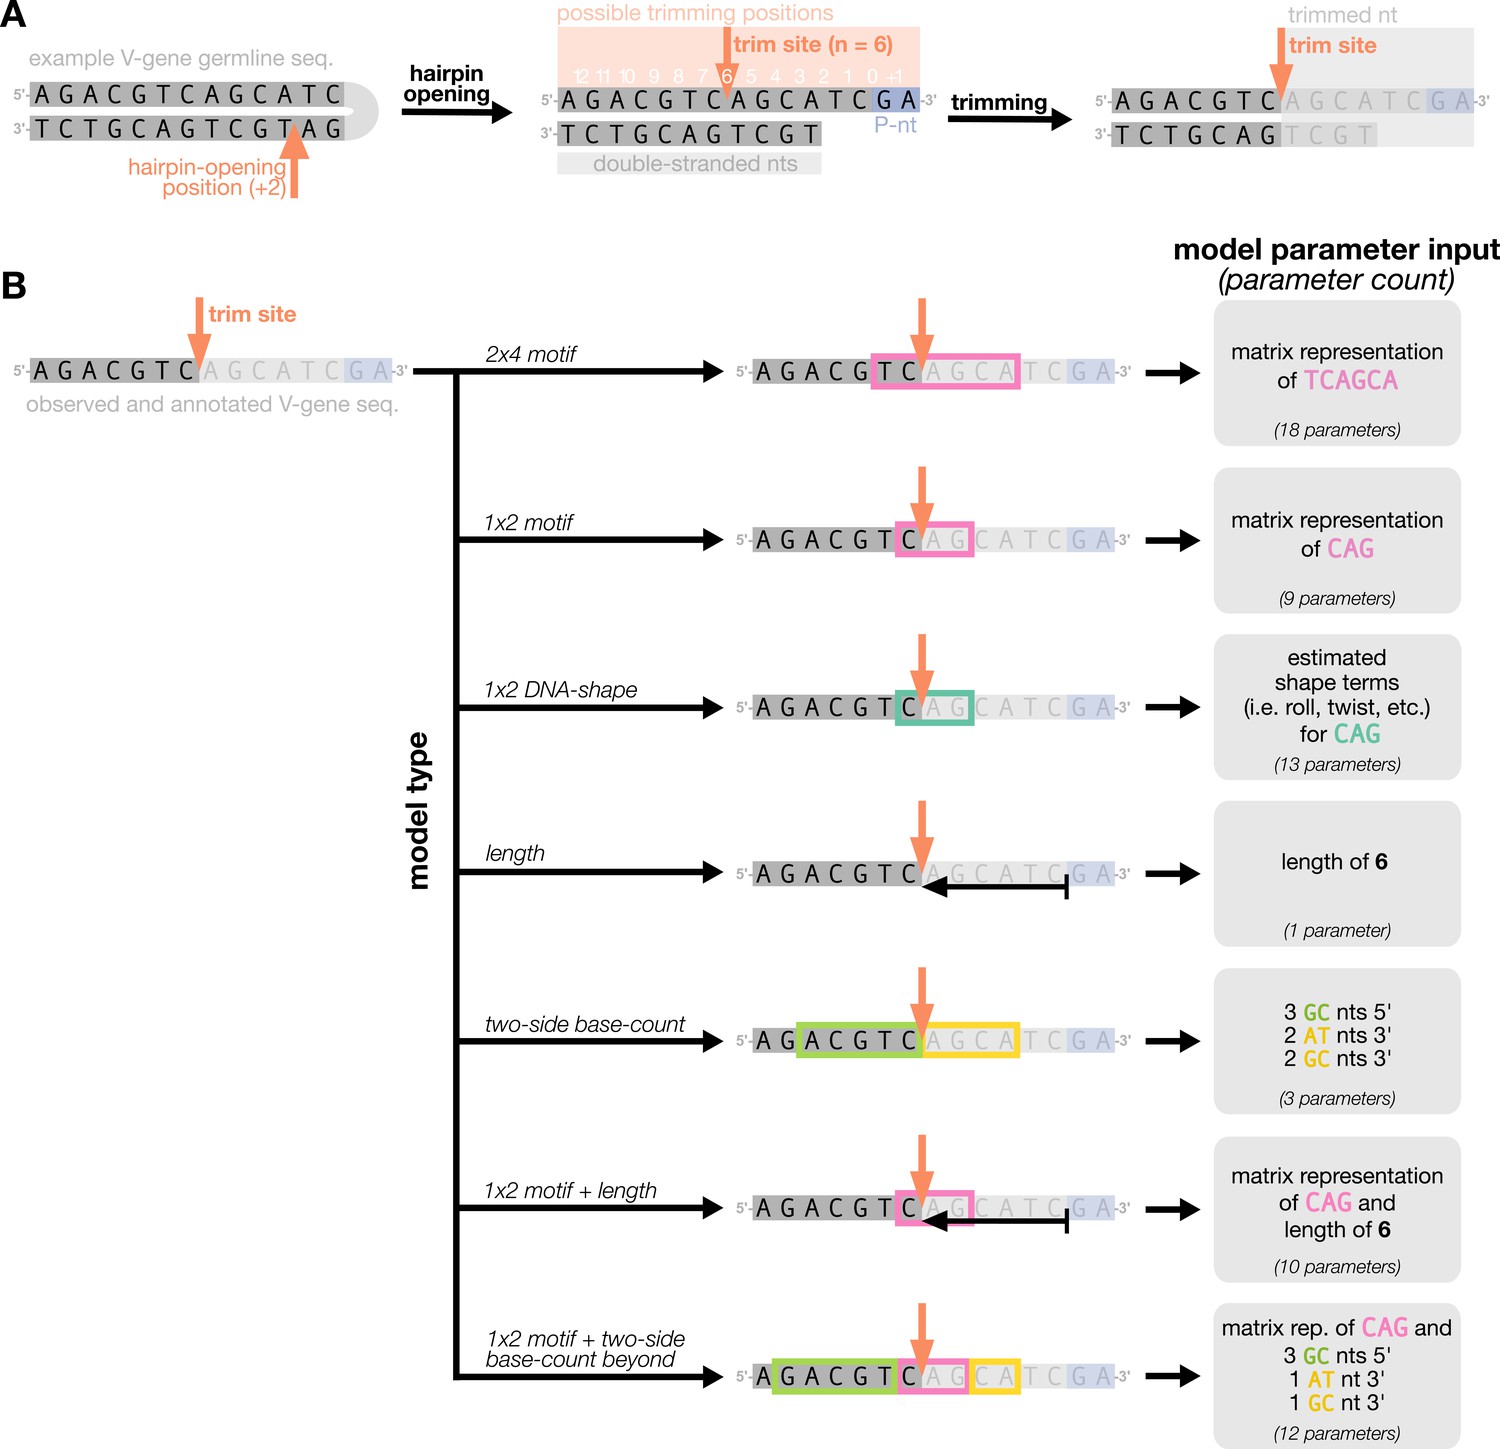
Overview of how a sequence is transformed into features for regression.
(A) As described, during the early stages of V(D)J recombination between two genes, the hairpin of each gene is opened; here, we are showing this hairpin-opening step for a single arbitrary V-gene. The most common hairpin-opening position leads to a 4-nucleotide-long single-stranded overhang (2 nucleotides of which are considered P-nucleotides, as shown in purple). From here, each gene can undergo nucleotide trimming. In this example, the V-gene is trimmed back 6 nucleotides. (B) All models were trained with non-productive V-gene sequences whose trimming positions were inferred during a sequence annotation step. For our model parameterization, we only consider the top strand (5’-to-3’) of the observed sequence. Here, the sequence features parameterized for each model type are shown for the example sequence from (A). The pink boxes surround nucleotides included in the matrix representation of motif features. The turquoise boxes surround nucleotides used to estimate and parameterize DNA-shape features (see Appendix 2 for further details). The green boxes surround nucleotides included in the counts of GC nucleotides 5’ of the trimming site; in our actual models, we count nucleotides within a 10-nucleotide window (a 5-nucleotide window is shown in the figure). Because this window size is fixed, we do not need to include an additional parameter for AT nucleotide count 5’ of the trimming site (since it is already indirectly modeled). The yellow boxes surround double-stranded nucleotides included in the counts of AT and GC nucleotides 3’ of the trimming site. These raw 3’-nucleotide counts also indirectly parameterize length; as such, we never include both length and two-side base-count parameters in the same model. In addition to the models shown in the figure, we also evaluated a null model which does not contain any parameters.
Figure 2 with 1 supplement
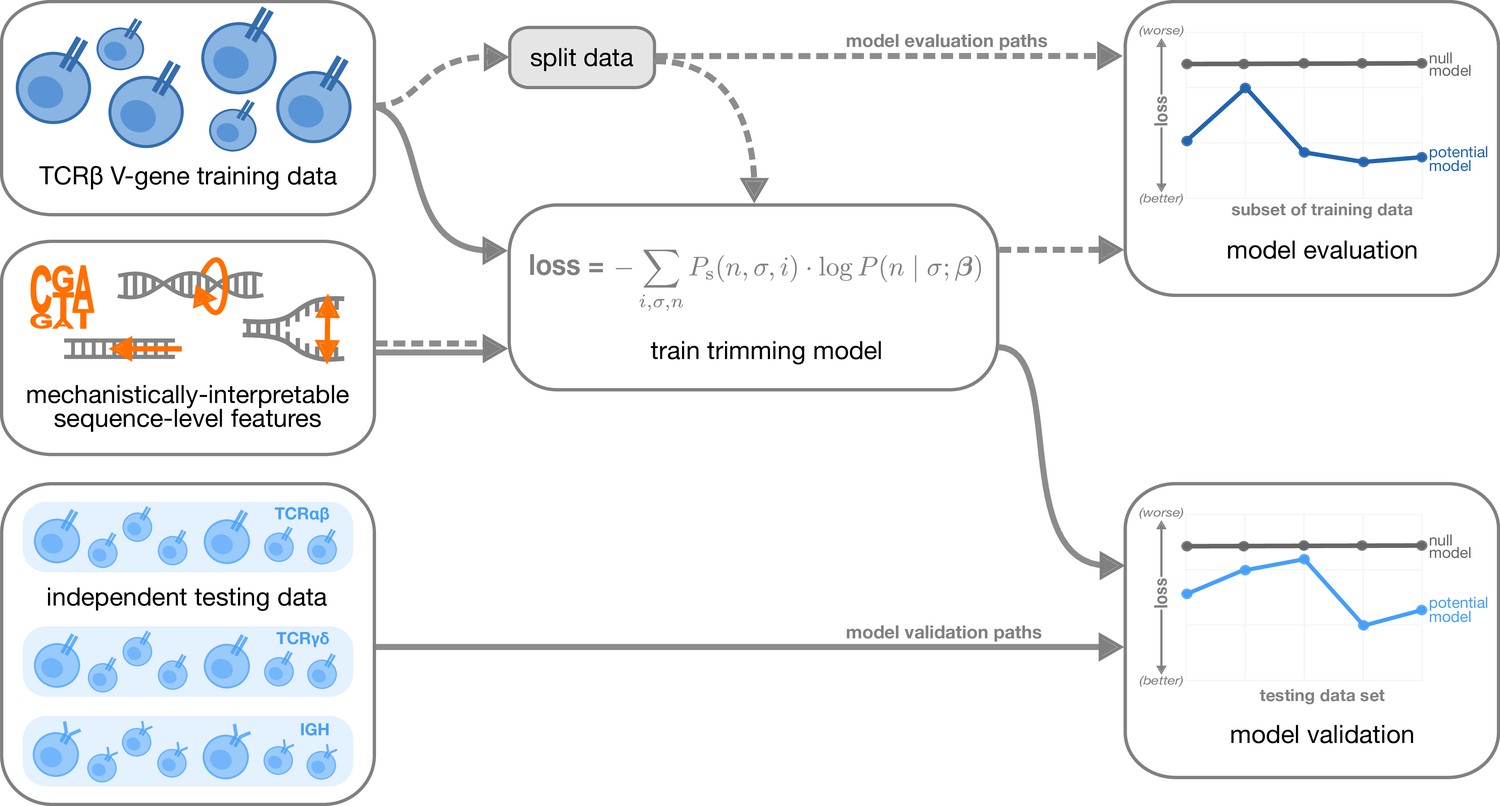
Overview of analysis strategy.
The T cell receptor (TCR)β V-gene training data was used to train each trimming model containing various combinations of sequence-level features (Figure 1) by minimizing the associated loss function. The loss function is given by a sum across individuals , genes , and trimming lengths of the sampling probability of each observation multiplied by the gene-specific trimming probability predicted by a model with β parameters (see Materials and methods for further details). Each potential model first underwent a ‘model evaluation’ stage (shown by the dashed lines) during which the model performance was evaluated using various subsets of the training TCRβ V-gene data set. Once all models were evaluated, a subset of the potential models continued on to the ‘model validation’ stage (shown by the solid lines) during which the performance of the model coefficients from the previous TCRβ V-gene training run were validated using several independent testing data sets including TCRβ, TCRα, TCRγ, and IGH sequences. At each stage, the performance of each model was compared to a null model (containing zero parameters, see Materials and methods).
Figure 2—figure supplement 1
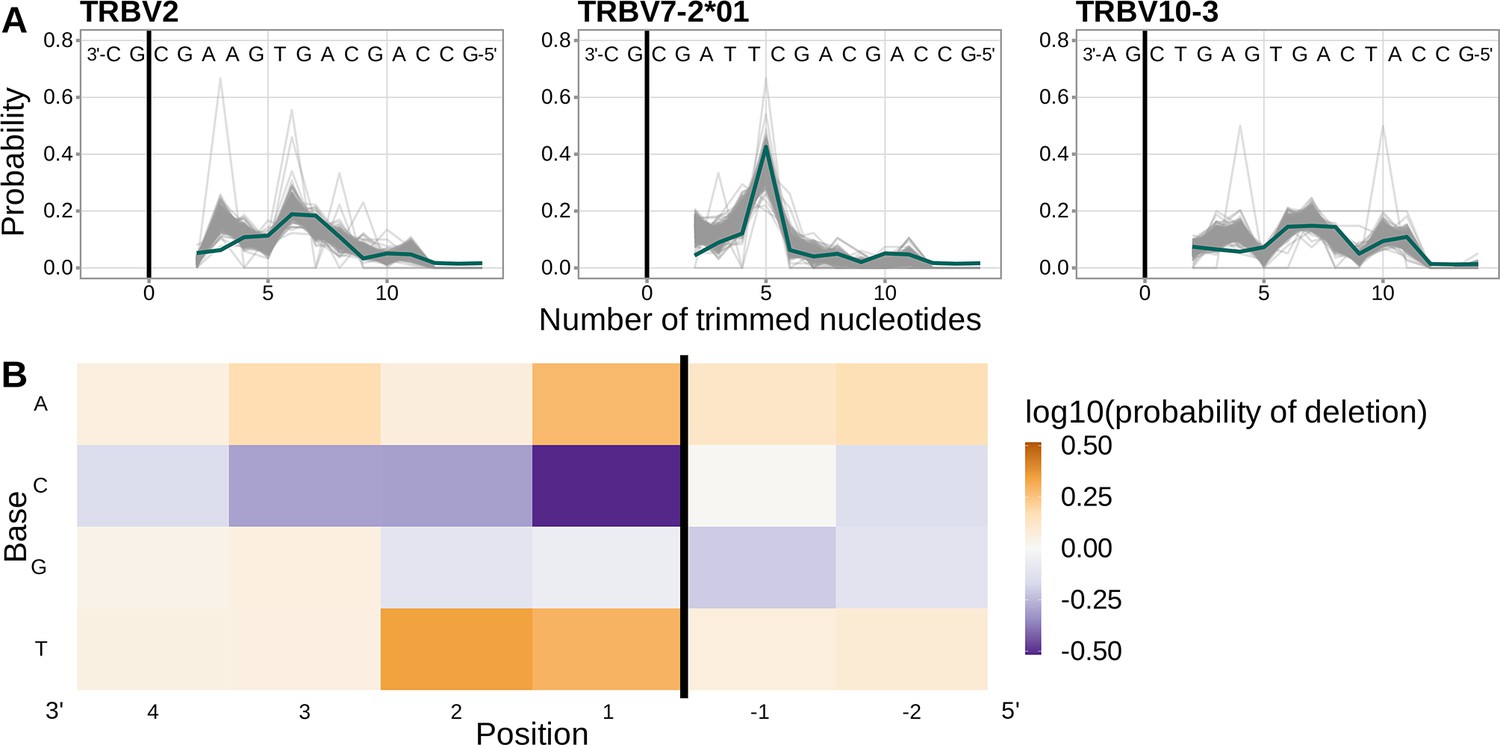
Using a different, and much larger, repertoire sequencing data set, we have closely replicated previous work (Murugan et al., 2012) which illustrated that a simple position-weight-matrix-style model has good predictive accuracy for many T cell receptor β V-genes.
(A) Inferred trimming profiles (shown in blue) using this model have good predictive accuracy for the same V-genes highlighted in previous work (compare Figure 4A in Murugan et al., 2012). Gene-specific trimming profiles for each individual in the training data set are shown in gray. (B) Position-weight-matrix of the local sequence context dependence of V-gene trimming probabilities consisting of 2 nucleotides 5’ of the trimming site and 4 nucleotides 3’ of the trimming site. (Note: the positions in this figure are flipped relative to the rest of the corresponding figures in this paper in order to correspond to the original figure in Murugan et al., 2012.) Positions 3’ of the trimming site have a stronger effect on the probability of trimming compared to positions 5’ of the trimming site. Specifically, A and T nucleotides 3’ of the trimming site have a strong positive effect on the trimming probability whereas C nucleotides have a strong negative effect. The black vertical line corresponds to the trimming site. Each inferred coefficient is given as the change in log10 odds of trimming at a given site resulting from an increase in the feature value, given that all other features are held constant. The inferred coefficients show here closely resemble the previously reported model (see Figure S11 in Murugan et al., 2012).
Figure 3 with 1 supplement
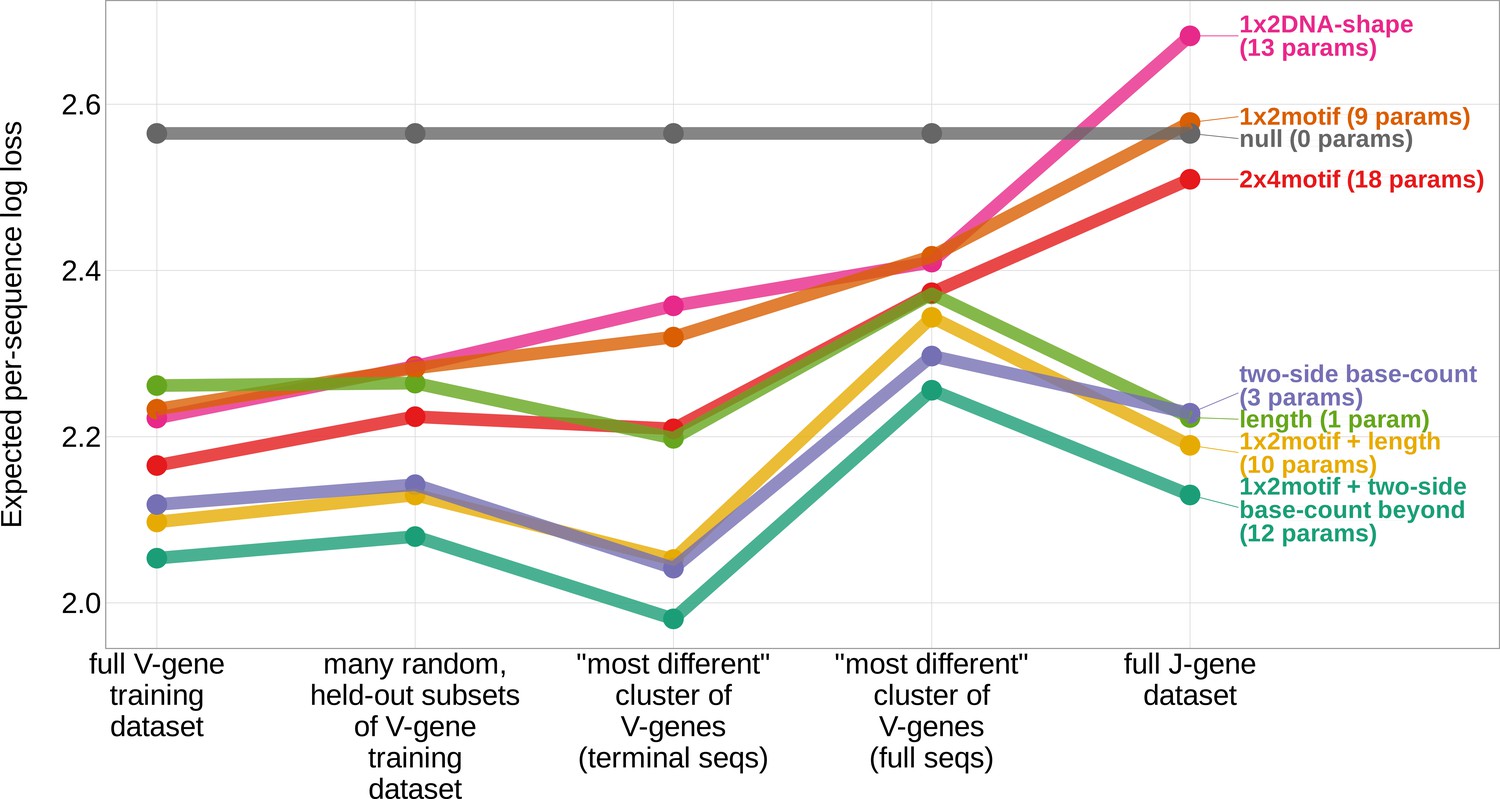
Expected per-sequence conditional log loss computed for various models using the full V-gene training data set, many random, held-out subsets of the V-gene training data set, a held-out subset of the V-gene training data set containing a group of V-genes defined to be the ‘most-different’ using the terminal sequences (last 25 nucleotides of each sequence), a held-out subset of the V-gene training data set containing a group of V-genes defined to be the ‘most-different’ using the full gene sequences, and the full J-gene data set.
Each model was trained using the full V-gene training data set with the held-out group or ‘most-different’ group (if applicable) removed (see Materials and methods and Appendix 3). Lower expected per-sequence log loss corresponds to better a model fit. The 1×2 motif + two-side base-count beyond model has the best model fit and generalizability across all data sets.
-
Figure 3—source data 1
Expected per-sequence conditional log loss reported for each model and validation data set.
- https://cdn.elifesciences.org/articles/85145/elife-85145-fig3-data1-v1.tsv
Figure 3—figure supplement 1
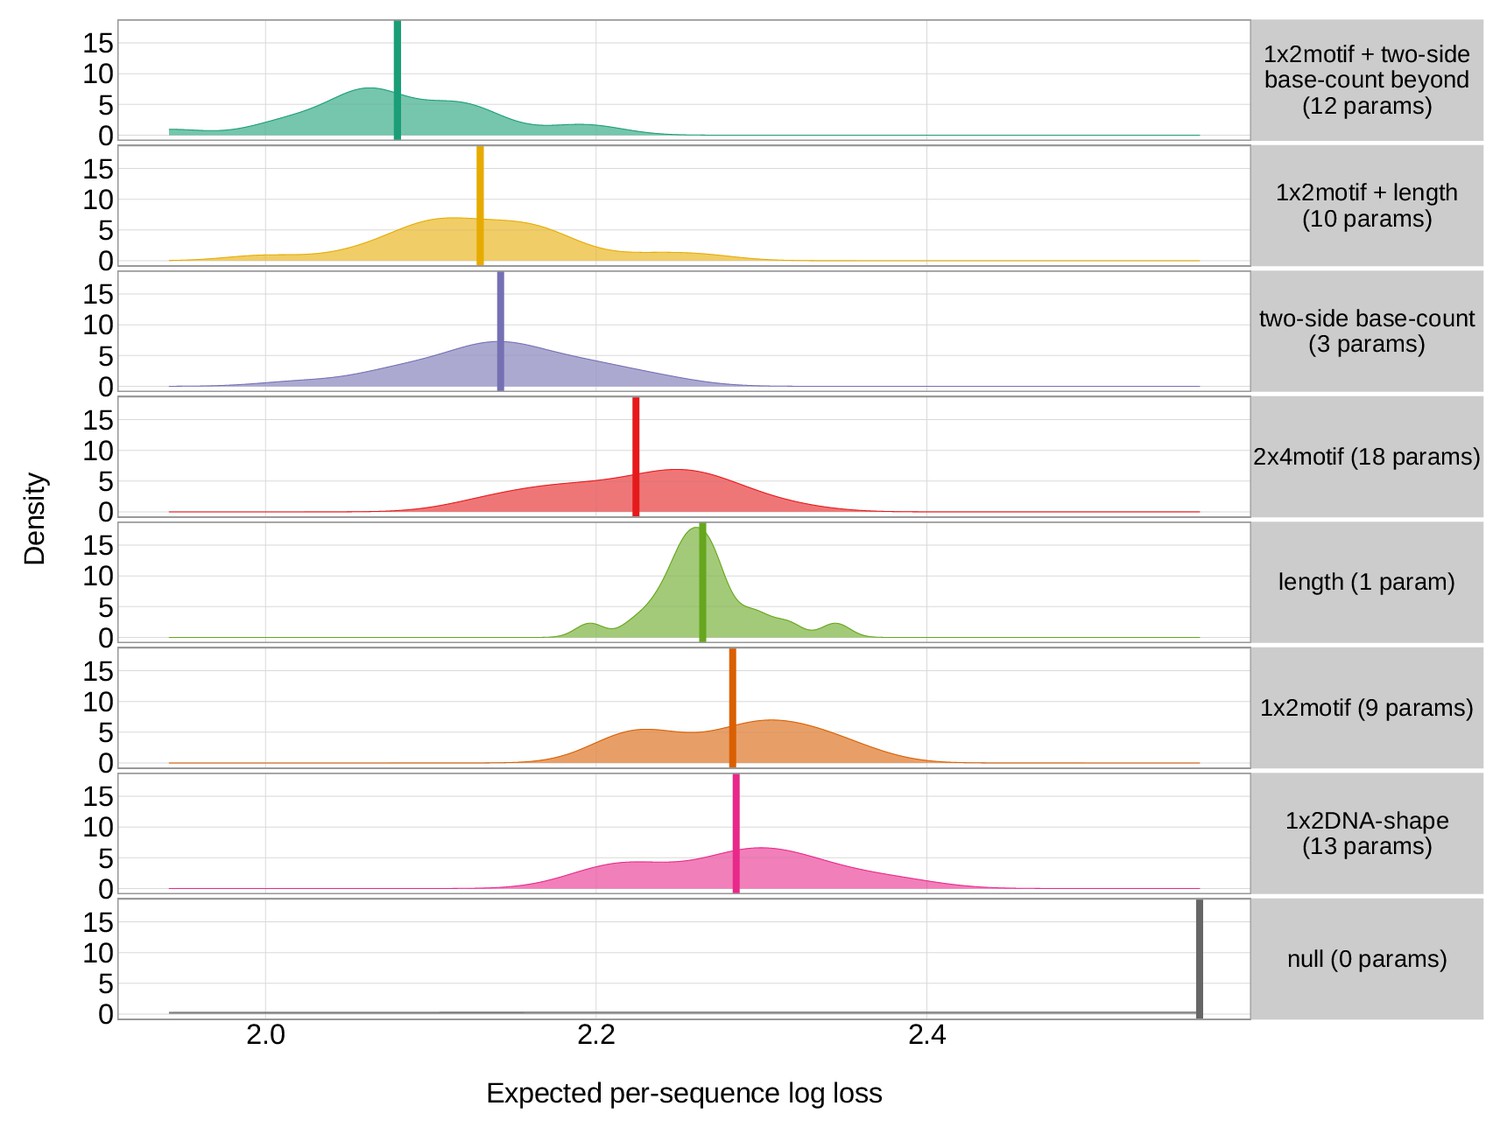
For each model, there was some variation in the expected per-sequence conditional log loss values computed across the 20 random, held-out subsets of the V-gene training data set.
The average expected per-sequence conditional log loss values are shown as vertical lines. For each model, there was some variation in the expected per-sequence conditional log loss values computed across the 20 random, held-out subsets of the V-gene training data set. The average expected per-sequence conditional log loss values are shown as vertical lines.
Figure 4 with 7 supplements
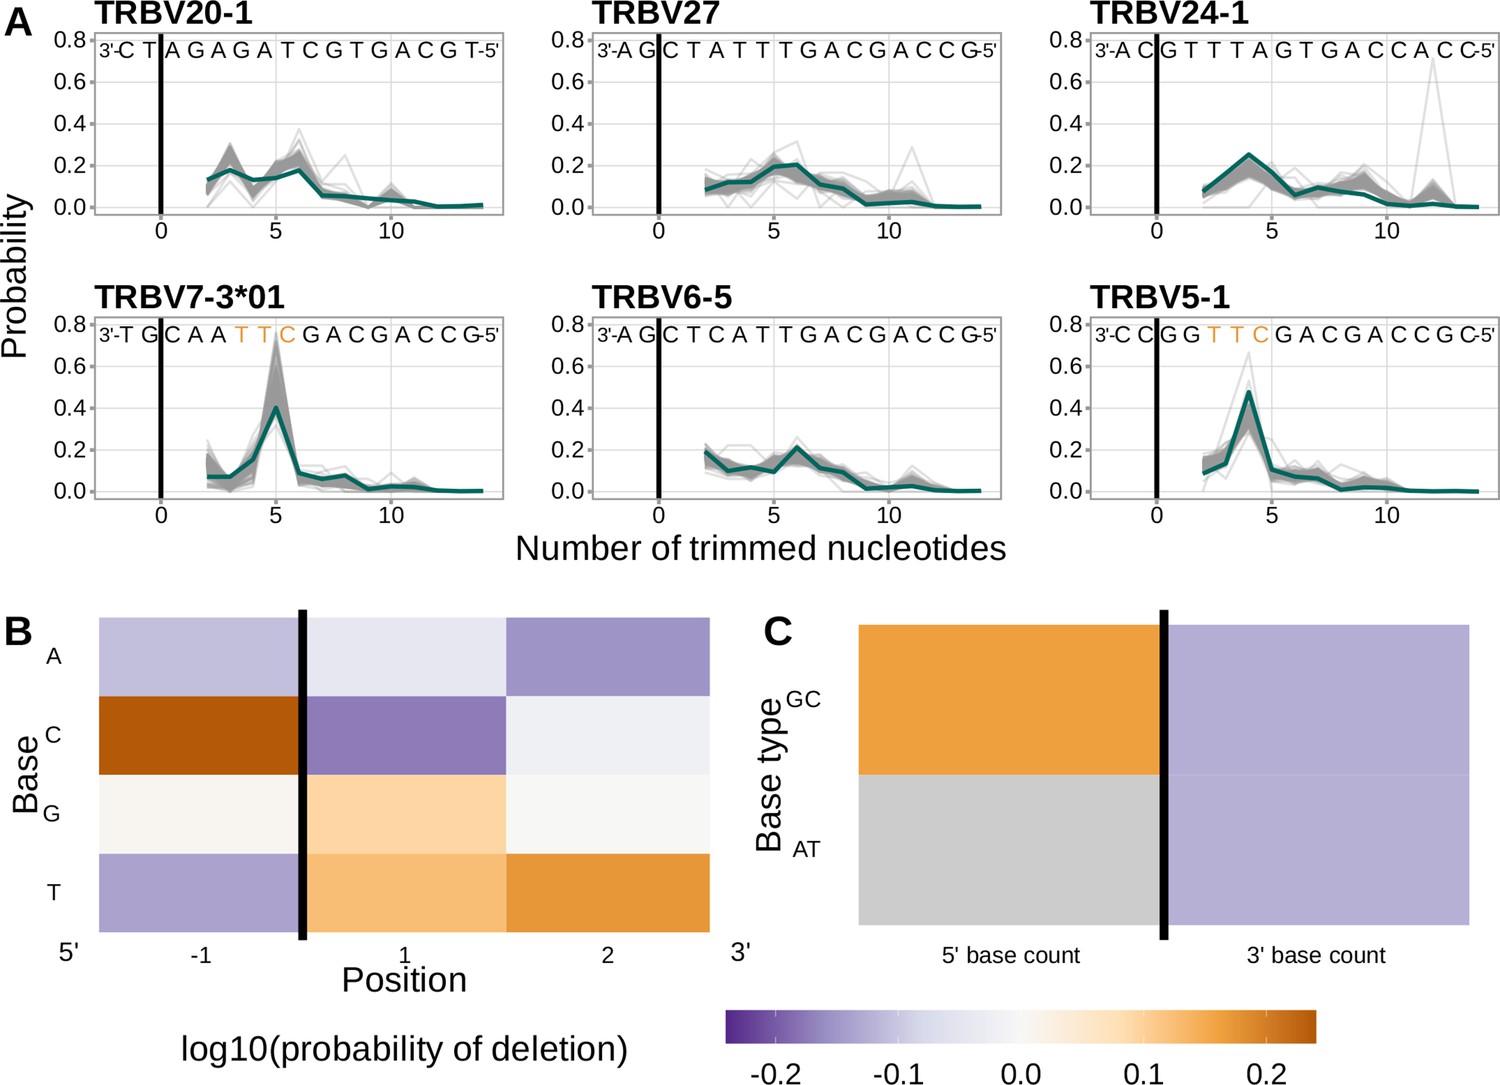
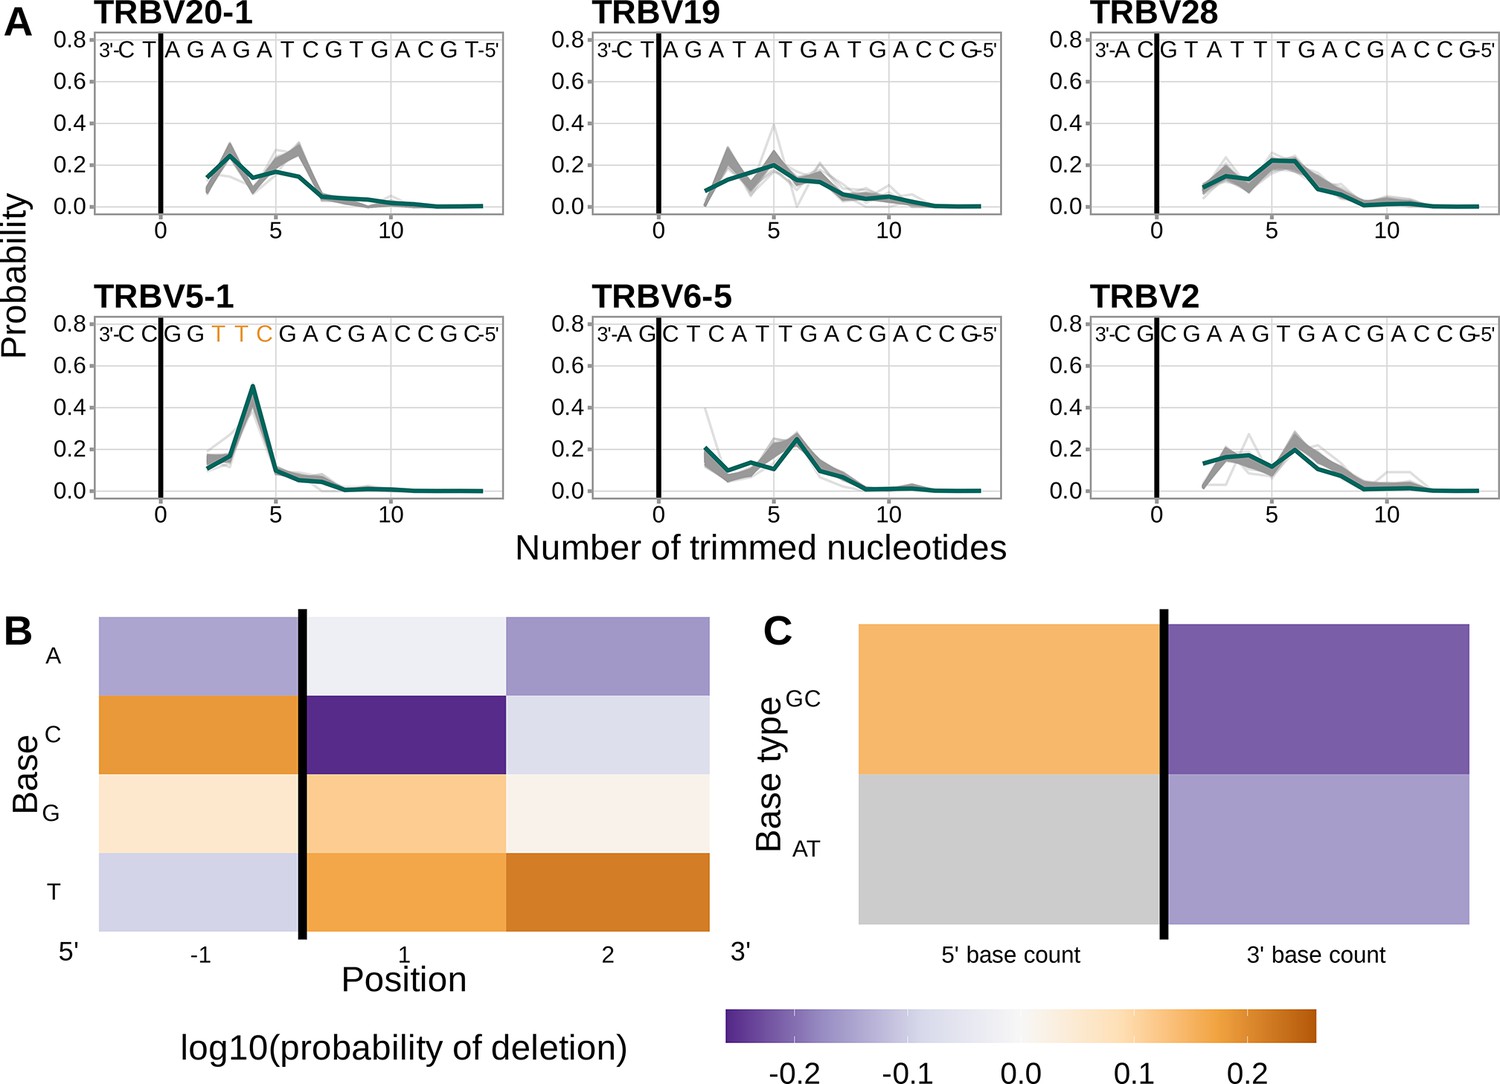
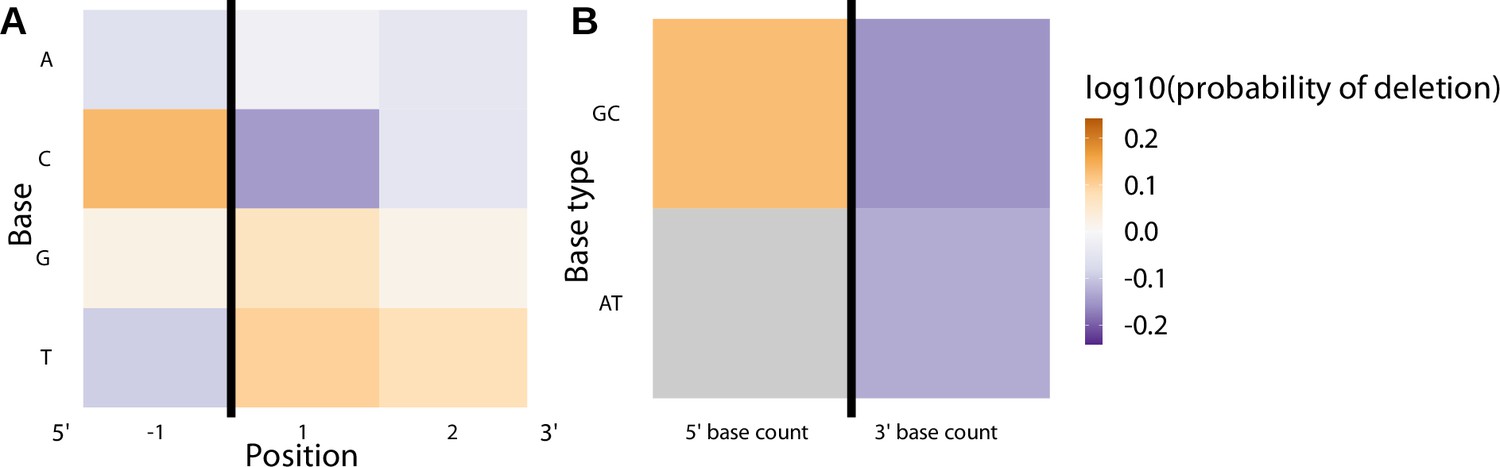
Performance of the 1×2 motif + two-side base-count beyond model.
(A) Inferred trimming profiles using the 1×2 motif + two-side base-count beyond model have good predictive accuracy overall; here, we show the inferred trimming profiles (in blue) for the most frequently used V-genes. Gene-specific trimming profiles for each individual in the training data set are shown in gray. The sequence context with the highest probability of trimming (3’-TTC-5’ or 3’-TGC-5’) from (B and C) is highlighted in orange. (B) Position-weight-matrix of the local sequence context dependence of V-gene trimming probabilities consisting of 1 nucleotide 5’ of the trimming site and 2 nucleotide 3’ of the trimming site from fitting the 1×2 motif + two-side base-count beyond model. Positions 5’ and 3’ of the trimming site have a strong effect on the probability of trimming. (C) Inferred two-side base-count beyond model coefficients from fitting the 1×2 motif + two-side base-count beyond model suggest that the count of GC bases 5’ of the motif has a strong positive effect on the trimming probability whereas the count of GC and/or AT bases 3’ of the motif has a negative effect. The count of AT nucleotides 5’ of the motif (shown in gray) was not included in this model. The black vertical line corresponds to the trimming site. Each inferred coefficient is given as the change in log10 odds of trimming at a given site resulting from an increase in the feature value, given that all other features are held constant.
-
Figure 4—source data 1
Inferred and observed trimming profiles for the most frequently used V-genes in the V-gene training data set.
- https://cdn.elifesciences.org/articles/85145/elife-85145-fig4-data1-v1.tsv
-
Figure 4—source data 2
Inferred 1x2 motif + two-side base-count beyond model coefficients.
- https://cdn.elifesciences.org/articles/85145/elife-85145-fig4-data2-v1.tsv
Figure 4—figure supplement 1
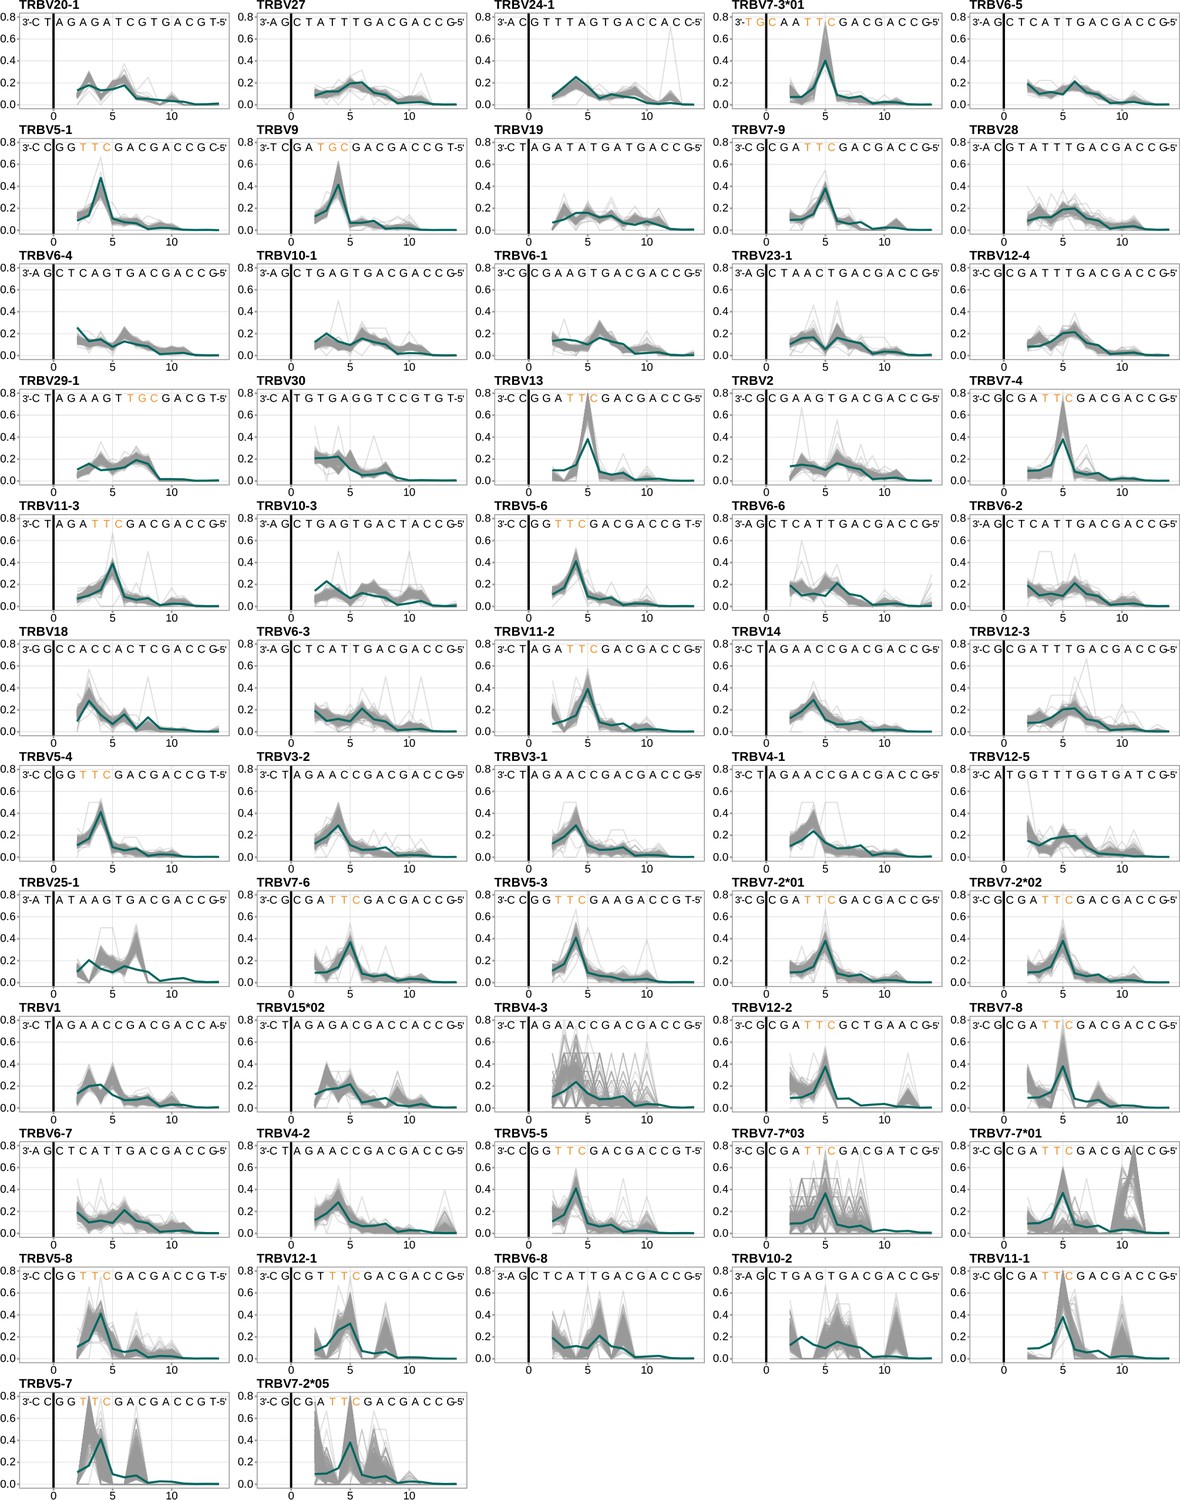
Performance of the 1×2 motif + two-side base-count beyond model across all TRB V-genes, ordered by the frequency of usage in the training data set.
Inferred trimming profiles (shown in blue) using the 1×2 motif + two-side base-count beyond model have good predictive accuracy for most V-genes. Gene-specific trimming profiles for each individual in the training data set are shown in gray. The sequence context with the highest probability of trimming (3’-TTC-5’ or 3’-TGC-5’ from Figure 4B) is highlighted in orange. The black vertical line corresponds to the trimming site.
Figure 4—figure supplement 2

Including all gene sequence nucleotides in the two-side base-count terms, instead of restricting to double-stranded nucleotides, leads to very similar inferred coefficients and model fit.
(A) Inferred trimming profiles (shown in blue) from a 1×2 motif + two-side base-count beyond model which includes all nucleotides 3’ of the motif (regardless of double-stranded status) in the 3’-base-count term show good predictive accuracy for the most frequently used V-genes. The fit for this model is very similar to the original 1×2 motif + two-side base-count beyond model which only includes double-stranded nucleotides in the base-count terms. Gene-specific trimming profiles for each individual in the training data set are shown in gray. (B) Position-weight-matrix of the local sequence context dependence of V-gene trimming probabilities consisting of 1 nucleotide 5’ of the trimming site and 2 nucleotides 3’ of the trimming site from fitting a 1×2 motif + two-side base-count beyond model which uses all nucleotides 3’ of the motif in the 3’-base-count term. (C) Inferred two-side base-count beyond model coefficients from fitting a 1×2 motif + two-side base-count beyond model which uses all nucleotides 3’ of the motif in the 3’-base-count term. All inferred coefficients from this model are similar to the original 1×2 motif + two-side base-count beyond model which only includes double-stranded nucleotides in the base-count terms. The count of AT nucleotides 5’ of the motif (shown in gray) was not included in this model. The black vertical line corresponds to the trimming site. Each inferred coefficient is given as the change in log10 odds of trimming at a given site resulting from an increase in the feature value, given that all other features are held constant.
Figure 4—figure supplement 3
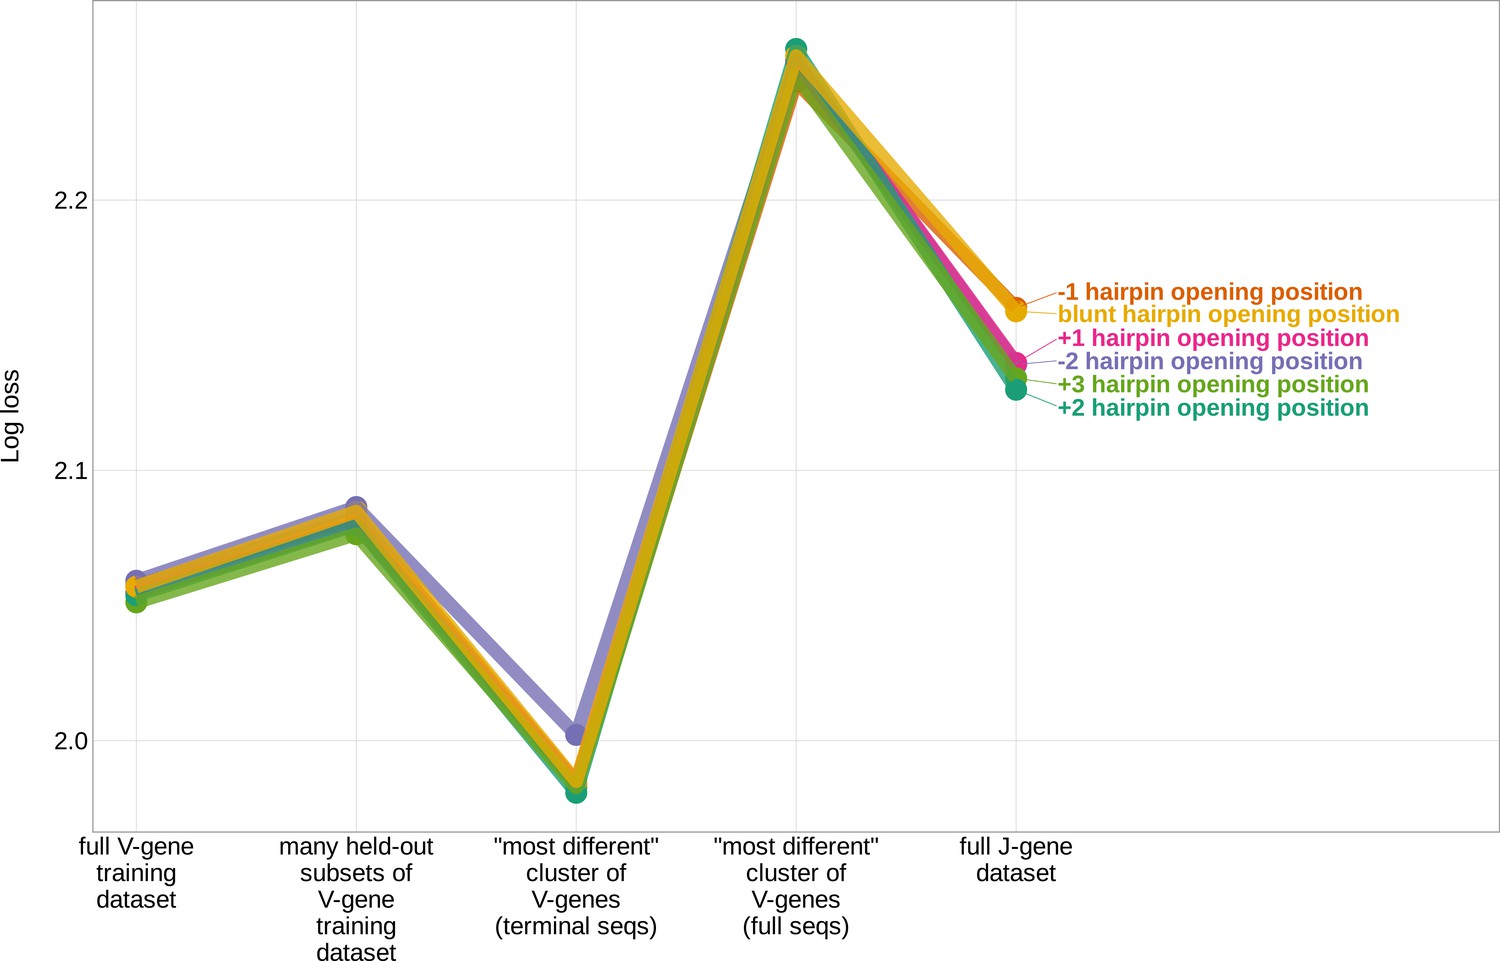
The assumed position of the initial hairpin-opening nick during the early stages of V(D)J recombination has little effect on the inferred coefficients and model fit.
Expected per-sequence conditional log loss computed for the 1×2 motif + two-side base-count beyond model, using the full V-gene training data set, many random, held-out subsets of the V-gene training data set, a held-out subset of the V-gene training data set containing a group of V-genes defined to be the ‘most-different’ using the terminal sequences (last 25 nucleotides of each sequence), a held-out subset of the V-gene training data set containing a group of V-genes defined to be the ‘most-different’ using the full gene sequences, and the full J-gene data set. Each model was trained using the designated hairpin-opening-position assumption (see Appendix 4 for hairpin-opening-position definitions). Each model was trained using the full V-gene training data set with the held-out group or ‘most-different’ group (if applicable) removed. Lower log loss corresponds to better a model fit.
Figure 4—figure supplement 4
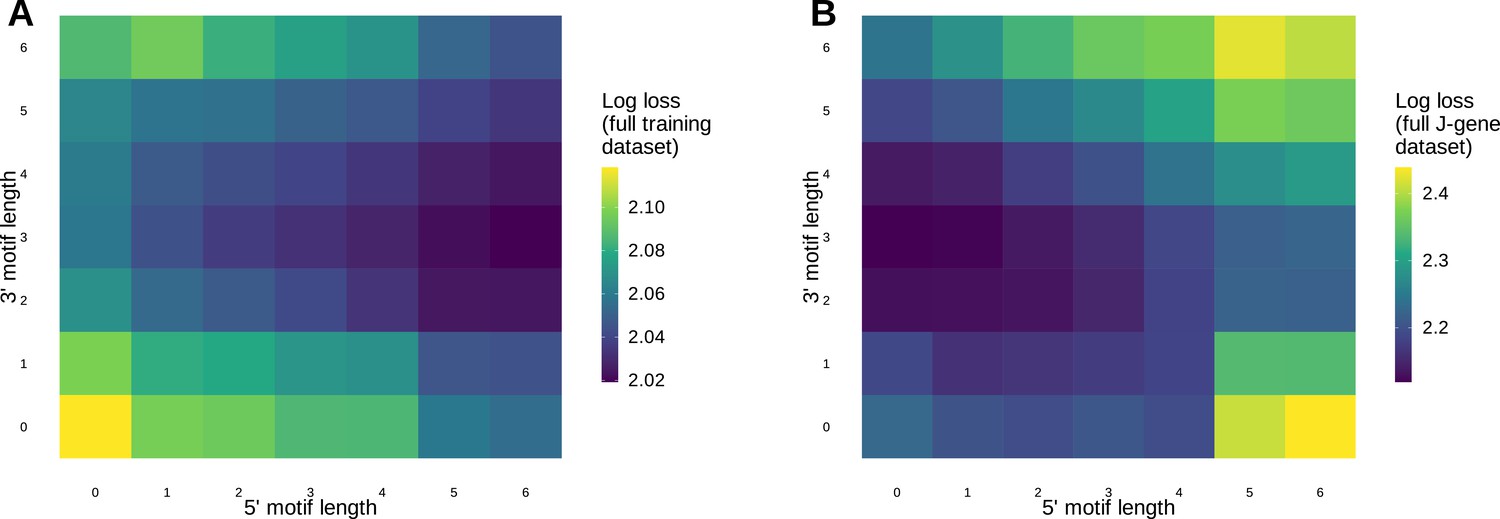
Models containing a small motif (e.g.a 1×2 motif) achieve similar predictive accuracy and are more generalizable compared to models containing a larger motif.
(A) Log loss computed using the full V-gene training data set for motif + two-side base-count beyond models containing a varying number of bases 3’ and 5’ of the trimming site within the motif. (B) Log loss computed using the full J-gene data set for motif + two-side base-count beyond models containing a varying number of bases 3’ and 5’ of the trimming site within the motif. Each model was trained using the full V-gene training data set as described in the Materials and methods. Lower log loss corresponds to better a model fit. Models containing small motifs have worse model fit when evaluating log loss using the full V-gene training data set (A), but have better model fit when evaluating log loss using the full J-gene data set (B).
Figure 4—figure supplement 5
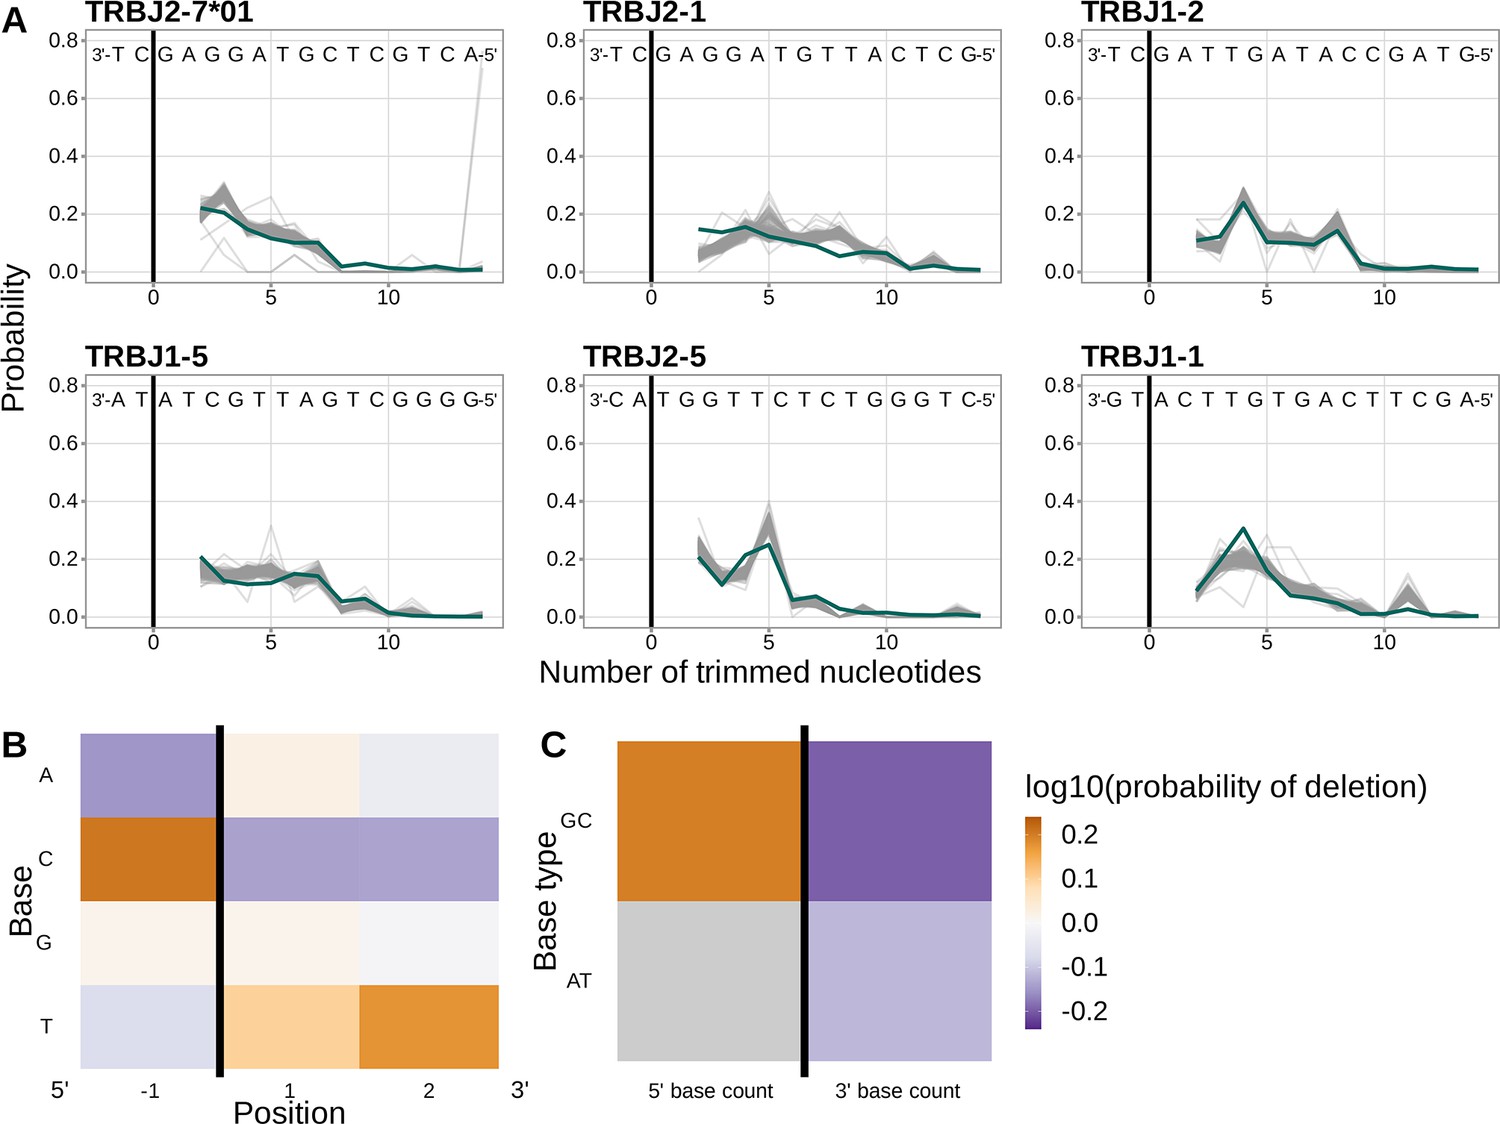
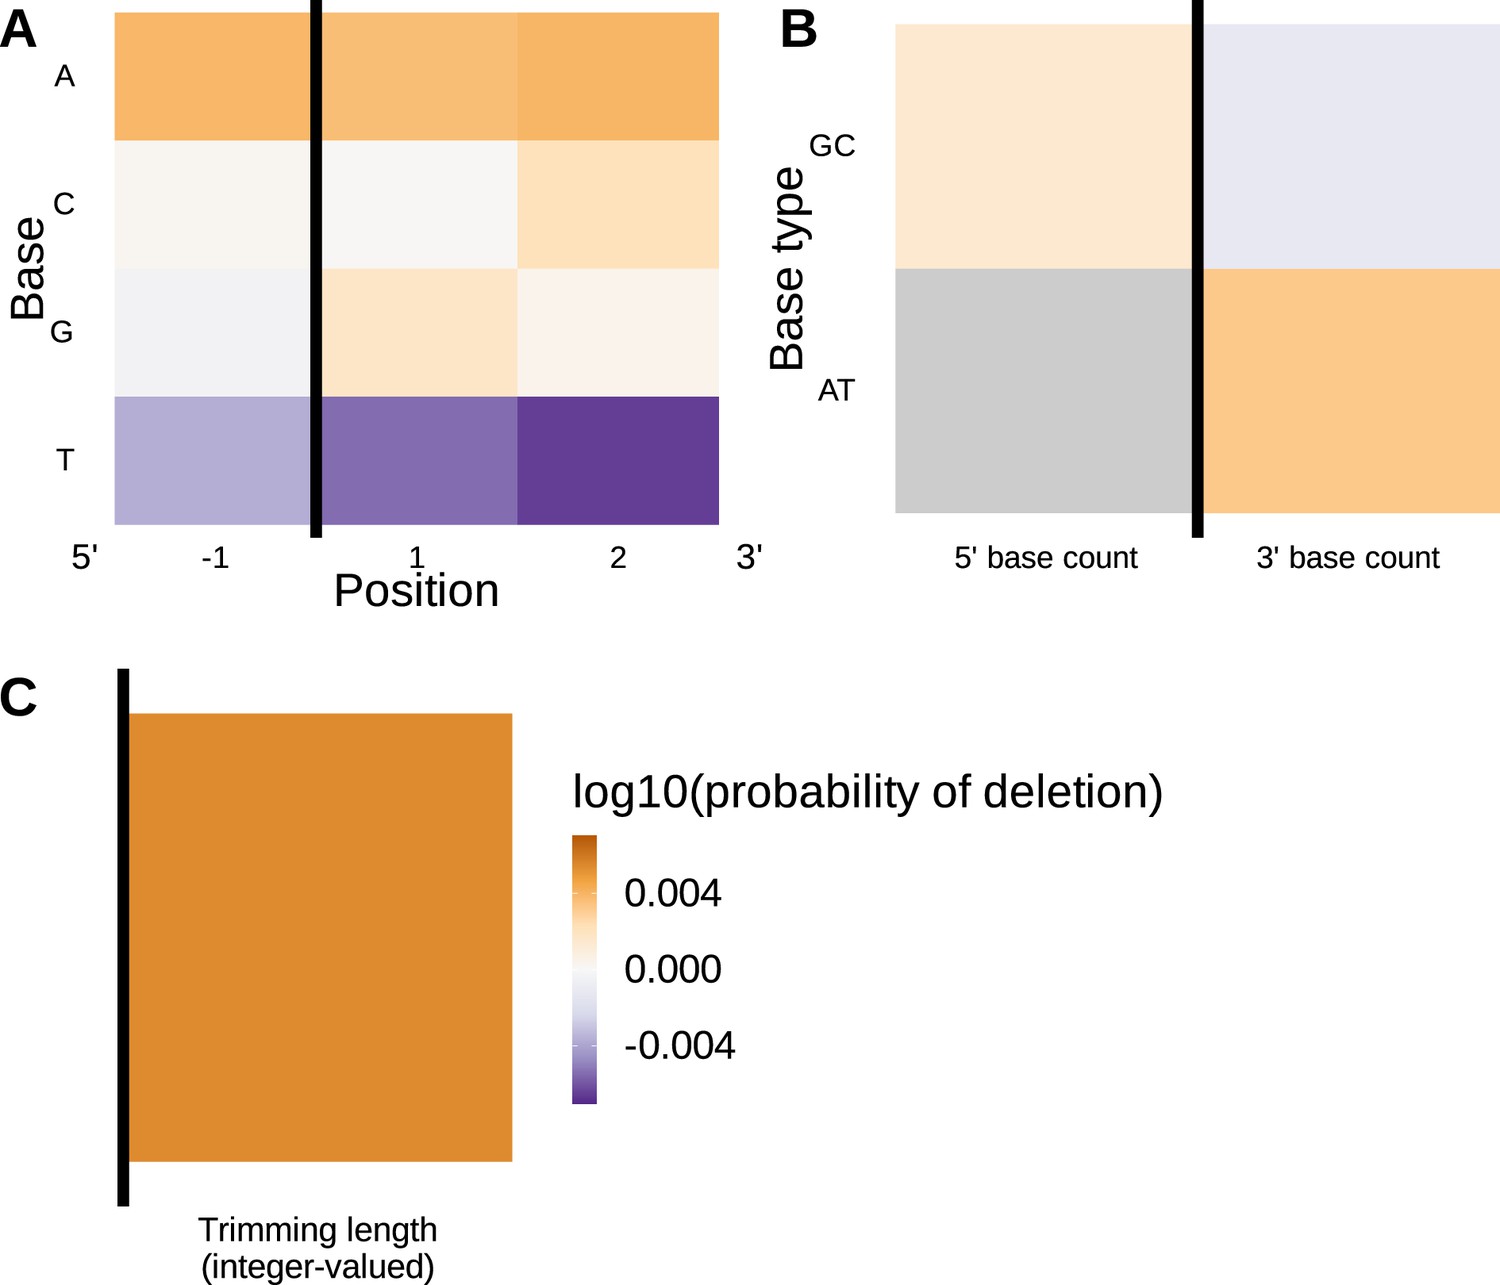
Inferred coefficients from a 1×2 motif + two-side base-count beyond model trained using only J-gene sequences are highly similar to those from the model trained using the V-gene training data set.
(A) Inferred trimming profiles (shown in blue) using the 1×2 motif + two-side base-count beyond model trained using J-gene sequences have good predictive accuracy for the most frequently used J-genes. Gene-specific trimming profiles for each individual in the training data set are shown in gray. (B) Position-weight-matrix of the local sequence context dependence of J-gene trimming probabilities consisting of 1 nucleotide 5’ of the trimming site and 2 nucleotides 3’ of the trimming site from fitting the 1×2 motif + two-side base-count beyond model using J-gene sequences. Positions 5’ and 3’ of the trimming site have a strong effect on the probability of trimming. (C) Inferred two-side base-count beyond model coefficients from fitting the 1×2 motif + two-side base-count beyond model using J-gene sequences suggest that the count of GC bases 5’ of the motif has a strong positive effect on the trimming probability whereas the count of GC and/or AT bases 3’ of the motif has a negative effect. The count of AT nucleotides 5’ of the motif (shown in gray) was not included in this model. The black vertical line corresponds to the trimming site. Each inferred coefficient is given as the change in log10 odds of trimming at a given site resulting from an increase in the feature value, given that all other features are held constant.
Figure 4—figure supplement 6
Inferred coefficients from a 1×2 motif + two-side base-count beyond model trained using only productive V-gene sequences are highly similar to those from the model trained using the non-productive V-gene training data set.
(A) Inferred trimming profiles (shown in blue) using the 1×2 motif + two-side base-count beyond model trained using productive V-gene sequences have good predictive accuracy for the most frequently used V-genes. Gene-specific trimming profiles for each individual in the training data set are shown in gray. (B) Position-weight-matrix of the local sequence context dependence of V-gene trimming probabilities consisting of 1 nucleotide 5’ of the trimming site and 2 nucleotides 3’ of the trimming site from fitting the 1×2 motif + two-side base-count beyond model using productive V-gene sequences. Positions 5’ and 3’ of the trimming site have a strong effect on the probability of trimming. (C) Inferred two-side base-count beyond model coefficients from fitting the 1×2 motif + two-side base-count beyond model using productive V-gene sequences suggest that the count of GC bases 5’ of the motif has a strong positive effect on the trimming probability whereas the count of GC and/or AT bases 3’ of the motif has a negative effect. The count of AT nucleotides 5’ of the motif (shown in gray) was not included in this model. The black vertical line corresponds to the trimming site. Each inferred coefficient is given as the change in log10 odds of trimming at a given site resulting from an increase in the feature value, given that all other features are held constant.
Figure 4—figure supplement 7
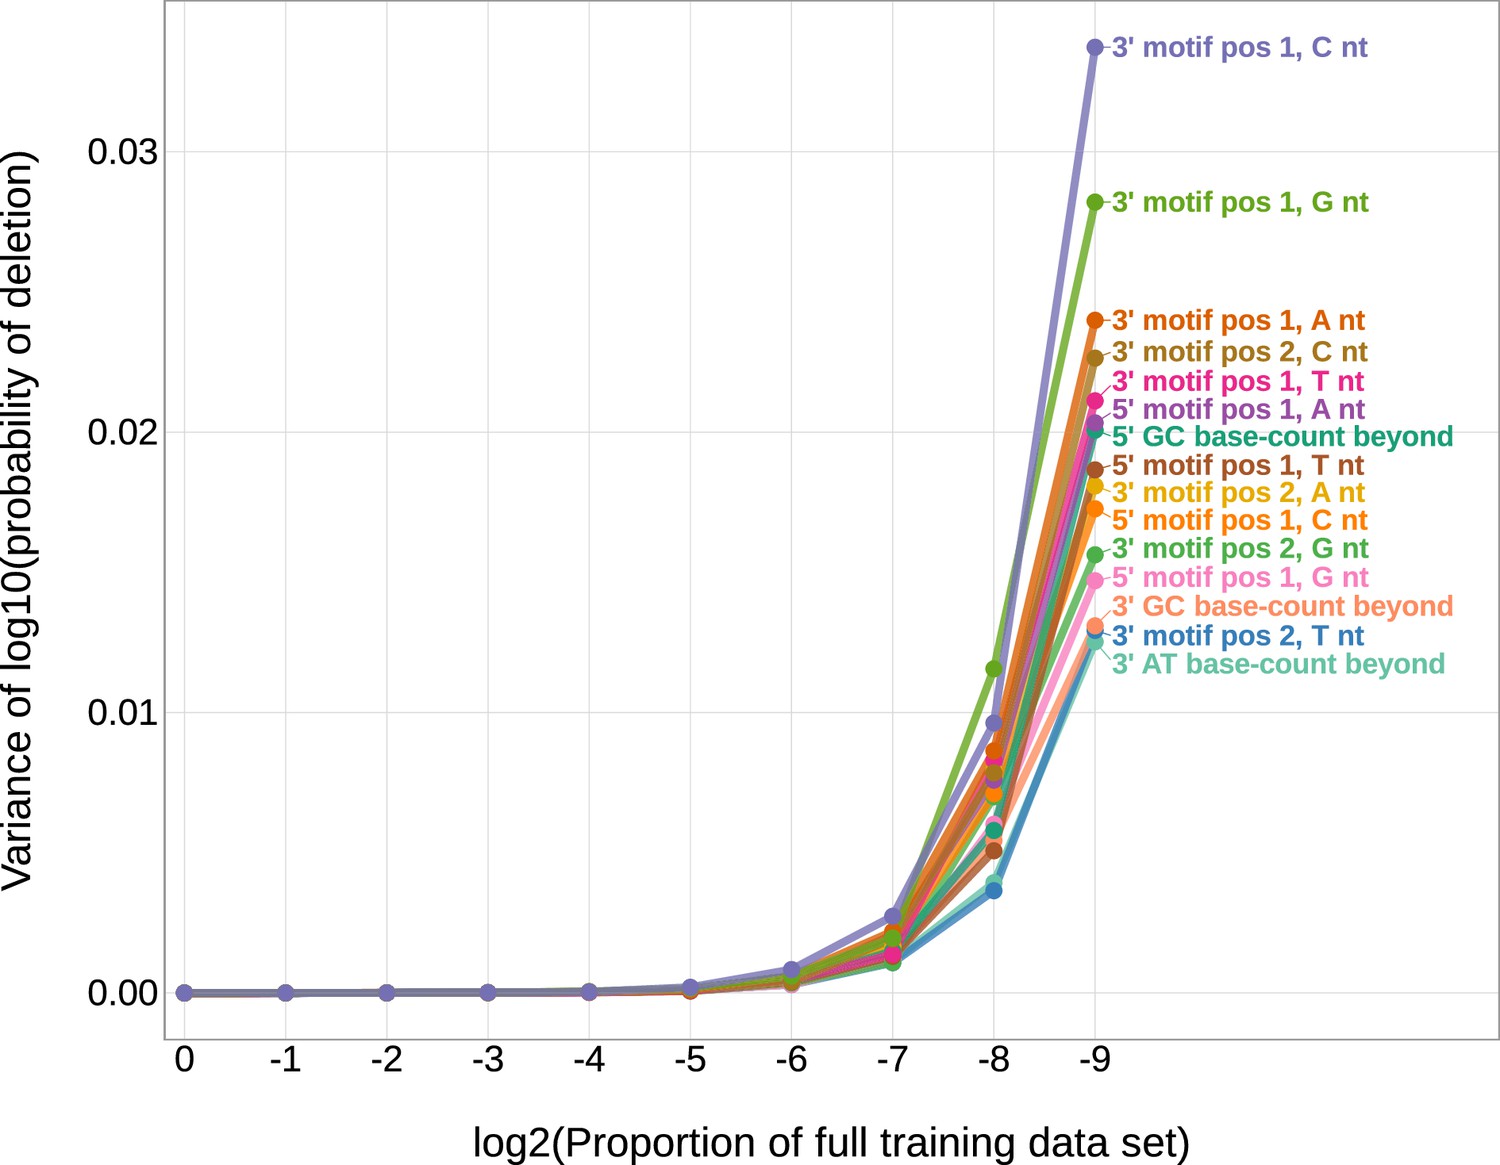
The magnitudes of the inferred coefficients from the 1×2 motif + two-side base-count beyond model have minimal variance when changing the number of sequences included in the training data set.
The magnitudes of the inferred coefficients from the 1×2 motif + two-side base-count beyond model have minimal variance when changing the number of sequences included in the training data set. The original V-gene training data set contains 21,193,153 sequences. When sub-sampling the original V-gene training data set and re-training the model, the inferred coefficients are stable until the size of the training data set reaches around 82,800 sequences (e.g. log2(proportion of the full training data set) is equal to – 8) or below.
Figure 5

The 1×2 motif coefficients represent a gene-segment-wide trimming motif.
(A) Distribution of the difference in per-gene root mean squared error (RMSE) between the 1×2 motif + two-side base-count beyond model and the two-side base-count model. V-genes with an RMSE difference less than –0.127 (gray vertical line) were in the lowest 10% of all RMSE differences. These ‘improved genes’ showed a large RMSE improvement when including motif terms in the model. (B) Inferred trimming profiles for TRBV9, the gene which showed the largest RMSE improvement in (A). TRBV9 had an RMSE difference of –0.31. (C) Inferred trimming profiles for TRBV13, the gene which showed the second largest RMSE improvement in (A). TRBV13 had an RMSE difference of –0.15. The inferred trimming profiles for TRBV9 and TRBV13 using models which contain motif terms have very low prediction error even when the genes are not included in the model training data set. Gene-specific trimming profiles for each individual in the training data set are shown in gray. The sequence context with the highest probability of trimming (3’-TTC-5’ or 3’-TGC-5’ from Figure 4B) are highlighted in orange.
-
Figure 5—source data 1
Per-gene mean squared error difference between the 1×2 motif + two-side base-count beyond model and the two-side base-count model.
- https://cdn.elifesciences.org/articles/85145/elife-85145-fig5-data1-v1.tsv
-
Figure 5—source data 2
Inferred and observed trimming profiles for the genes with largest root mean squared error (RMSE) improvement.
- https://cdn.elifesciences.org/articles/85145/elife-85145-fig5-data2-v1.tsv
Figure 6 with 1 supplement
Inferred single nucleotide polymorphism (SNP)-parameter-interaction coefficients from fitting the 1×2 motif + two-side base-count beyond SNP-interaction model.
Note that the inferred coefficients for each main parameter (as shown in Figure 4) are not displayed here; only the inferred interaction coefficients between the SNP and each parameter are shown. (A) Inferred interaction coefficients between rs41298872 SNP genotype and motif parameters for 1-nucleotide position 5’ of the trimming site and 2-nucleotide positions 3’ of the trimming site. The interaction coefficients between the SNP genotype and the presence of A nucleotides (at all positions 3’ of the motif) are significant. This figure is a different representation of the information shown in (A). (B) Inferred interaction coefficients between rs41298872 SNP genotype and two-side base-count beyond model coefficients. The interaction coefficients between the SNP genotype and the count of AT nucleotides 3’ of the motif are significant. The interaction coefficient between the SNP genotype and the count of AT nucleotides 5’ of the motif (shown in gray) was not included in this model. The black vertical line corresponds to the trimming site. Each inferred interaction coefficient is given as the change in log10 odds of trimming at a given site resulting from an increase in the feature value and a change in genotype, given that all other features are held constant.
-
Figure 6—source data 1
Inferred 1×2 motif + two-side base-count beyond, single nucleotide polymorphism (SNP) interaction model coefficients.
- https://cdn.elifesciences.org/articles/85145/elife-85145-fig6-data1-v1.tsv
Figure 6—figure supplement 1
The significance of the 3’-AT-nucleotide count single nucleotide polymorphism (SNP)-interaction coefficient appears to be related to length effects rather than nucleotide content.
Inferred SNP-interaction coefficients from fitting the 1×2 motif + two-side base-count beyond proportion + length SNP interaction model. (A) Inferred interaction coefficients between rs41298872 SNP genotype and motif parameters for 1-nucleotide position 5’ of the trimming site and 2-nucleotide positions 3’ of the trimming site. The interaction coefficients between the SNP genotype and the presence of T nucleotides (at all positions in the motif) are significant. (B) Inferred interaction coefficients between rs41298872 SNP genotype and two-side base-count beyond model coefficients. The interaction coefficient between the SNP genotype and the count of AT nucleotides 5’ of the motif (shown in gray) was not included in this model. None of the interaction coefficients are significant. (C) Inferred interaction coefficients between rs41298872 SNP genotype and the length coefficient. The black vertical line corresponds to the trimming site. Each inferred coefficient is given as the change in log10 odds of trimming at a given site resulting from an increase in the feature value, given that all other features are held constant.
Figure 7 with 4 supplements
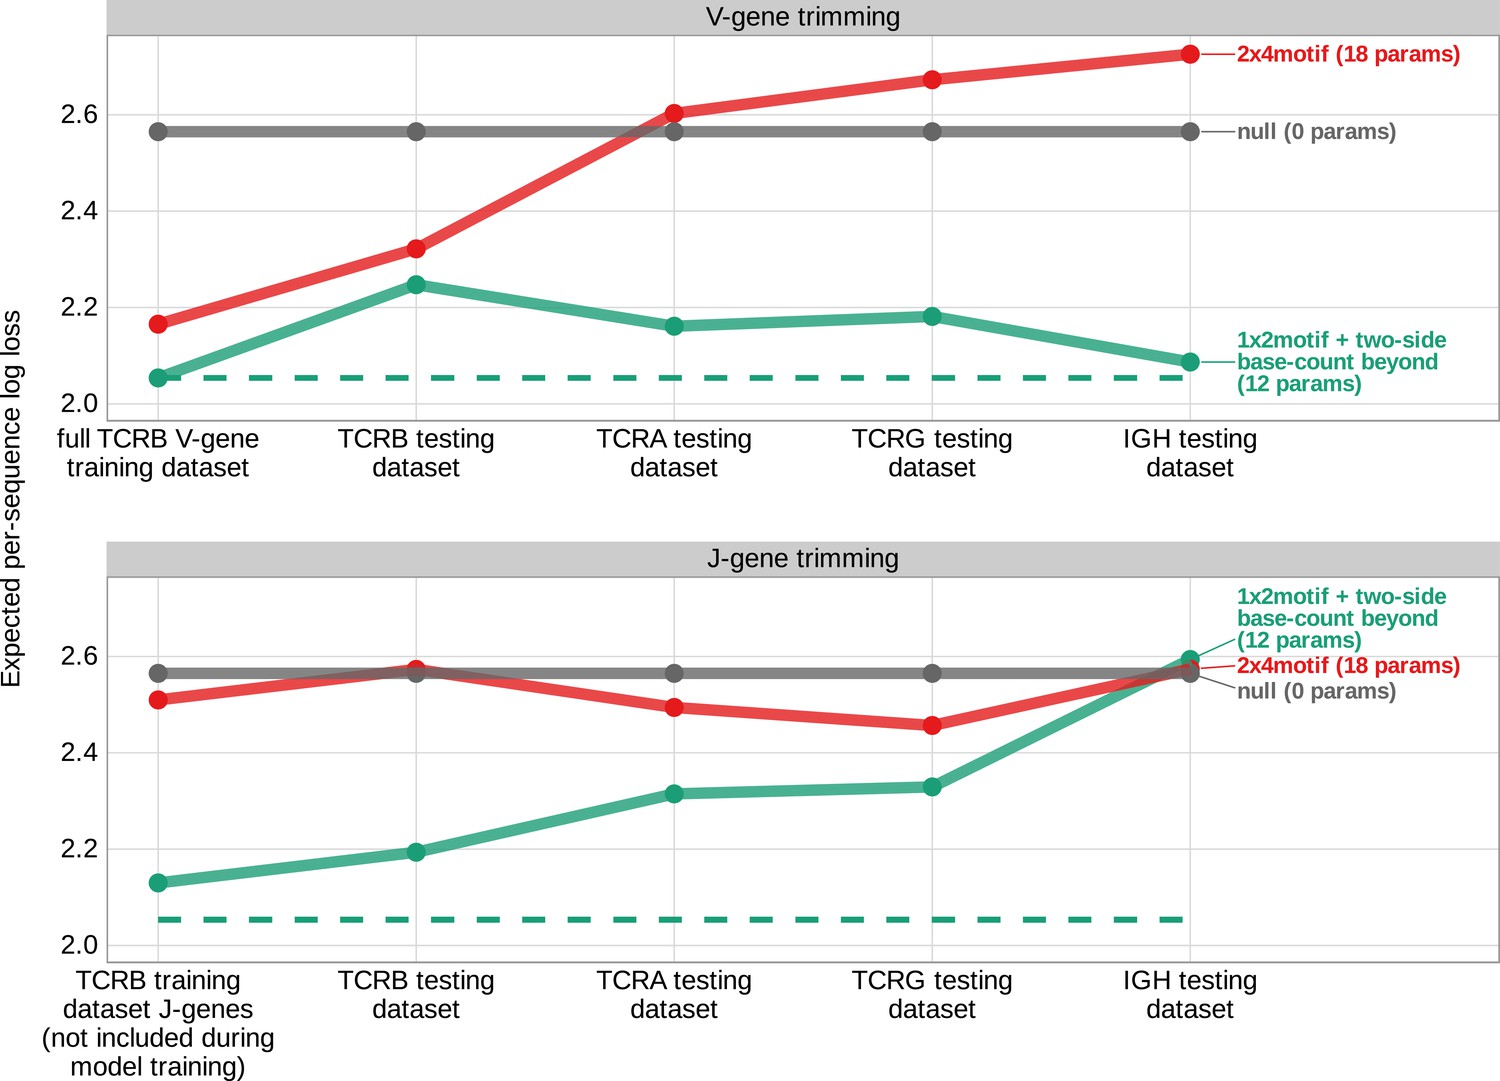
Expected per-sequence conditional log loss computed for various models using the T cell receptor β V-gene training data set and non-productive V- and J-gene sequences from several independent testing data sets.
Each model was trained using the full non-productive TCRβ V-gene training data set. Lower expected per-sequence log loss corresponds to a better model fit. The 1×2 motif + two-side base-count beyond model has the best model fit and generalizability across all testing data sets. The horizontal dashed line corresponds to the expected per-sequence log loss of the 1×2 motif + two-side base-count beyond model computed for V-gene trimming using the non-productive TCRβ V-gene training data set.
-
Figure 7—source data 1
Expected per-sequence conditional log loss reported for each model and testing data set.
- https://cdn.elifesciences.org/articles/85145/elife-85145-fig7-data1-v1.tsv
Figure 7—figure supplement 1
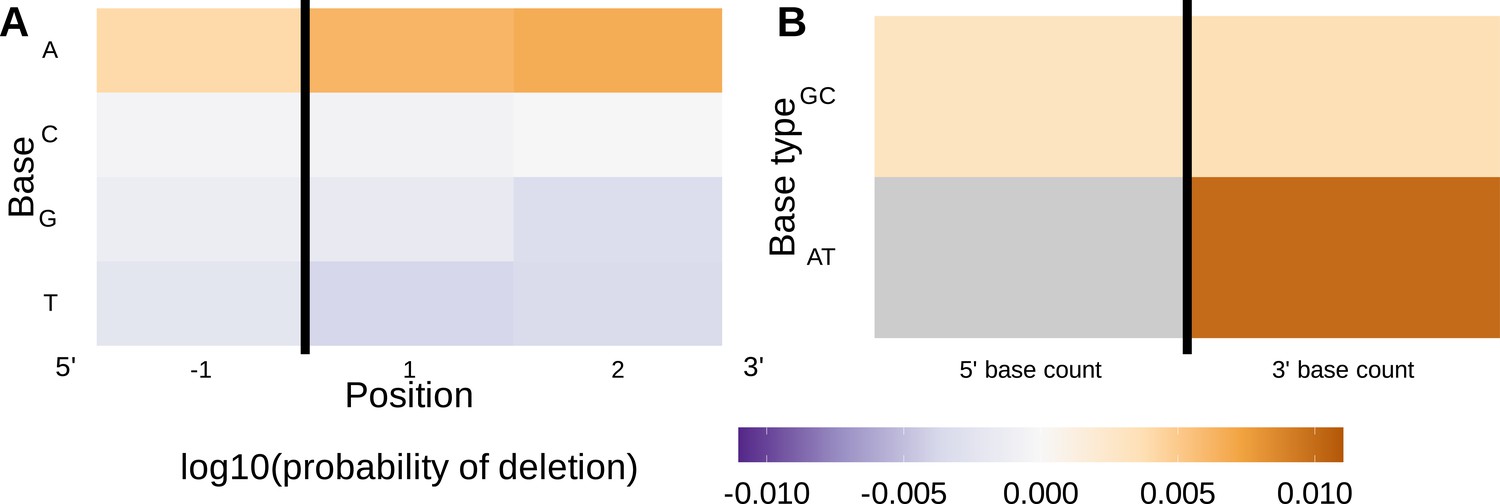
Differing methods of sequence annotation have little to no effect on the model fit or performance.
(A) Position-weight-matrix of the local sequence context dependence of V-gene trimming probabilities consisting of 1 nucleotide 5’ of the trimming site and 2 nucleotides 3’ of the trimming site from fitting the 1×2 motif + two-side base-count beyond model using parsimony-annotated sequences. (B) Inferred two-side base-count beyond model coefficients from fitting the 1×2 motif + two-side base-count beyond model using parsimony-annotated sequences. These inferred coefficients are highly similar to the original 1×2 motif + two-side base-count beyond model trained using IGoR-annotated sequences (Figure 4). The count of AT nucleotides 5’ of the motif (shown in gray) was not included in this model. The black vertical line corresponds to the trimming site. Each inferred coefficient is given as the change in log10 odds of trimming at a given site resulting from an increase in the feature value, given that all other features are held constant.
Figure 7—figure supplement 2

Model performance is similar for productive sequences compared to non-productive sequences from each testing data set.
Expected per-sequence conditional log loss computed for various models using the T cell receptor β V-gene training data set and productive V- and J-gene sequences from several independent testing data sets. Each model was trained using the full non-productive TCRβ V-gene training data set. Lower expected per-sequence log loss corresponds to a better model fit. The 1×2 motif + two-side base-count beyond model has the best model fit and generalizability across all testing data sets. The horizontal dashed line corresponds to the expected per-sequence log loss of the 1×2 motif + two-side base-count beyond model computed for V-gene trimming using the non-productive TCRβ V-gene training data set.
Figure 7—figure supplement 3

Using the 1×2 motif + two-side base-count beyond model, the weight of the two-side base-count beyond terms are dominant relative to the 1×2 motif terms for every testing data set.
The weight of the 1×2 motif and two-side base-count beyond model terms varies by data set. (A) The scale coefficient for the two-side base-count beyond model terms is larger than the motif scale coefficient for every data set. (B) The expected per-sequence conditional log loss of each of these new models is only slightly better compared to the original 1×2 motif + two-side base-count beyond model. Horizontal and vertical dashed gray lines correspond to the TCRβ V-gene training data set. The black solid line corresponds to the line.
Figure 7—figure supplement 4
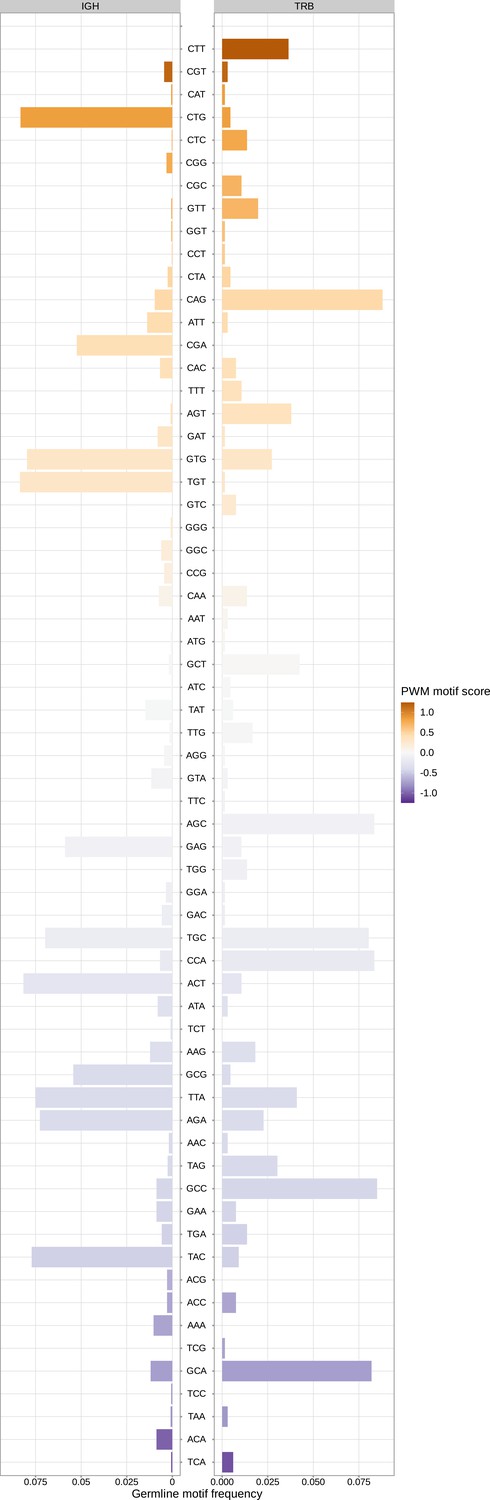
Sequence motifs appear at varying frequencies within the germline TRB and IGH genes.
Germline frequency of sequence motifs in IGH and TRB loci. Sequence motifs that lead to a large increase in trimming probabilities in the model (e.g. a large, positive position-weight-matrix-style motif score) appear at relatively low frequencies within the germline IGH genes. This may explain the weakness of the motif-related signal within IGH data sets (Figure 7—figure supplement 3).
Appendix 2—figure 1
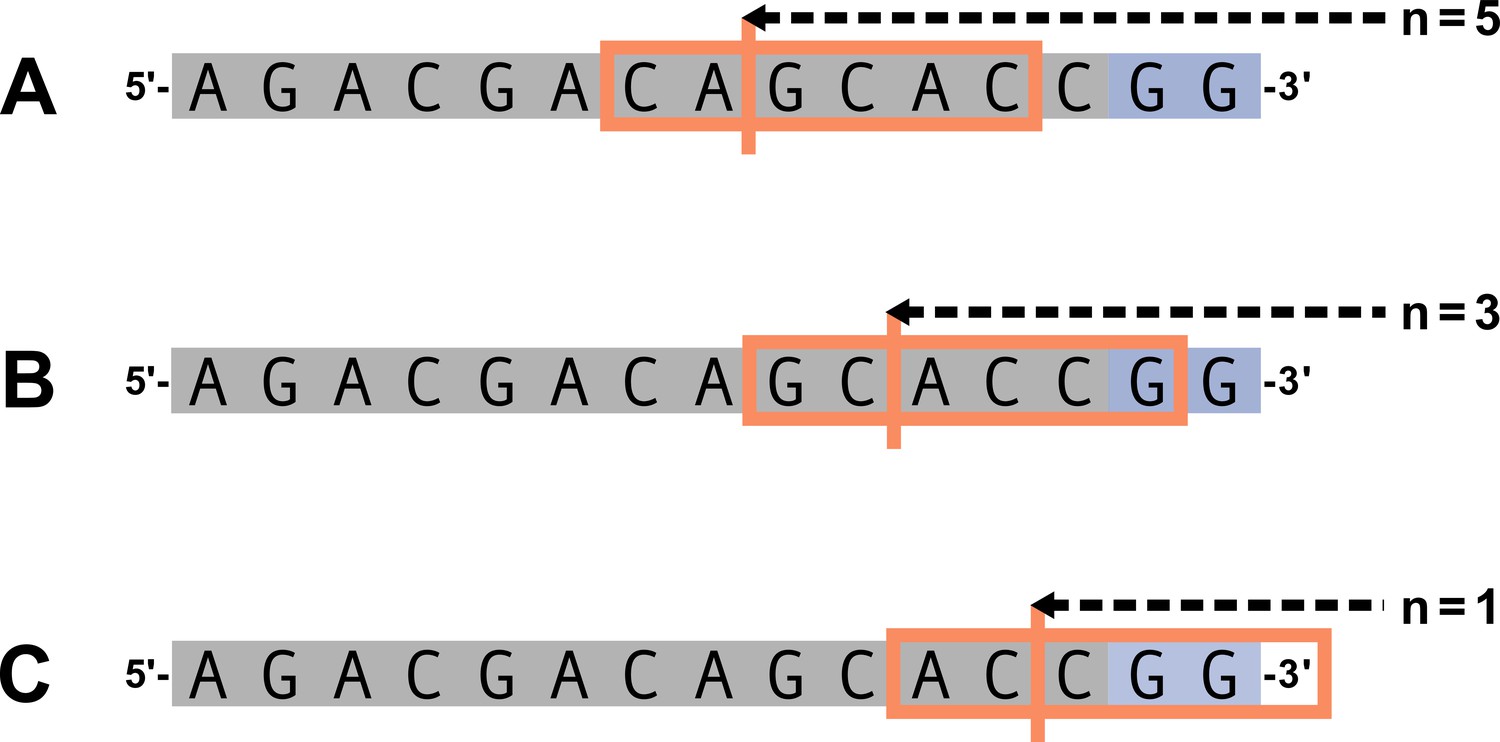
Summary of trimming motif parameters.
Let and . The 6-nucleotide trimming motif given by (Equation 13) is shown in the orange box and the trimming site is shown by the vertical orange line. An arbitrary gene sequence is highlighted in gray and the two possible P-nucleotides are highlighted in purple. (A) For , the 6-nucleotide trimming motif will not contain P-nucleotides. (B) For , the 6-nucleotide trimming motif will contain one P-nucleotide. (C) For , the trimming motif will contain two P-nucleotides and will be ‘incomplete’ (contain less than 6 nucleotides).
Appendix 2—figure 2
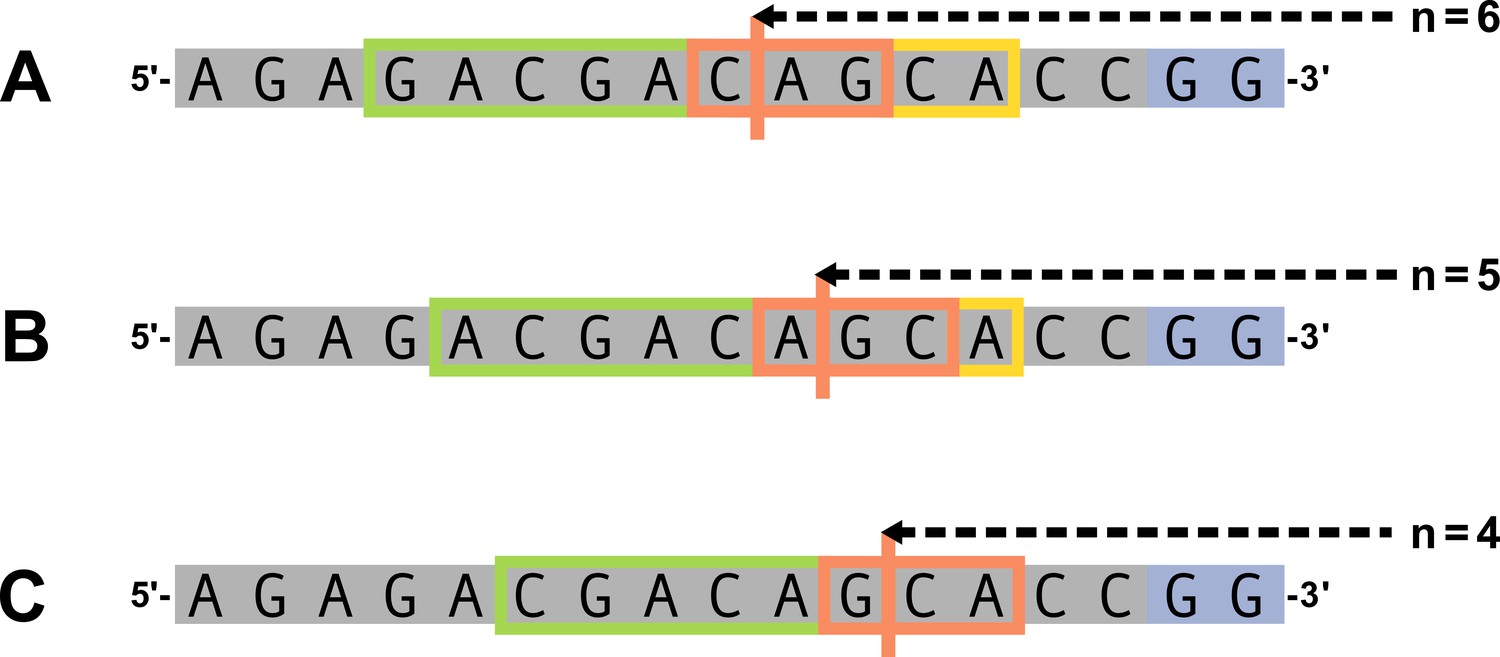
Summary of base-count parameters.
Let , , and . An arbitrary gene sequence is highlighted in gray and the two possible P-nucleotides are highlighted in purple. The trimming site is shown by the vertical orange line and the ‘trimming motif,’ as defined in (Equation 13), is shown by the orange box. The nucleotides included in the count of AT and GC nucleotides 5’ of the trimming site, beyond the ‘trimming motif,’ are expressed by (Equation 15) and are shown in the green box. The nucleotides included in the count of AT and GC nucleotides 3’ of the trimming site, beyond the ‘trimming motif,’ are expressed by (Equation 16) and are shown in the yellow box. As described in the text, we are assuming that the initial hairpin nick occurs at the +2 position leading to a 4-nucleotide-long 3’ single-stranded-overhang. We exclude these single-stranded nucleotides in the 3’-base-count-beyond sequence. In this figure, the 4 nucleotides nearest to the 3’ side of each sequence (this includes the two P-nucleotides and the two 3’-most gene sequence nucleotides) are considered single-stranded and will not be included in the 3’-base-count-beyond sequence. (A) For , 2 nucleotides 3’ of the trimming site will be used in the 3’ sequence base-counts. (B) For , 1 nucleotide 3’ of the trimming site will be used in the 3’ sequence base-counts. (C) For , all nucleotides 3’ of the trimming site are considered single-stranded and, thus, no nucleotides will be used for the 3’ sequence base-counts.
Appendix 2—figure 3
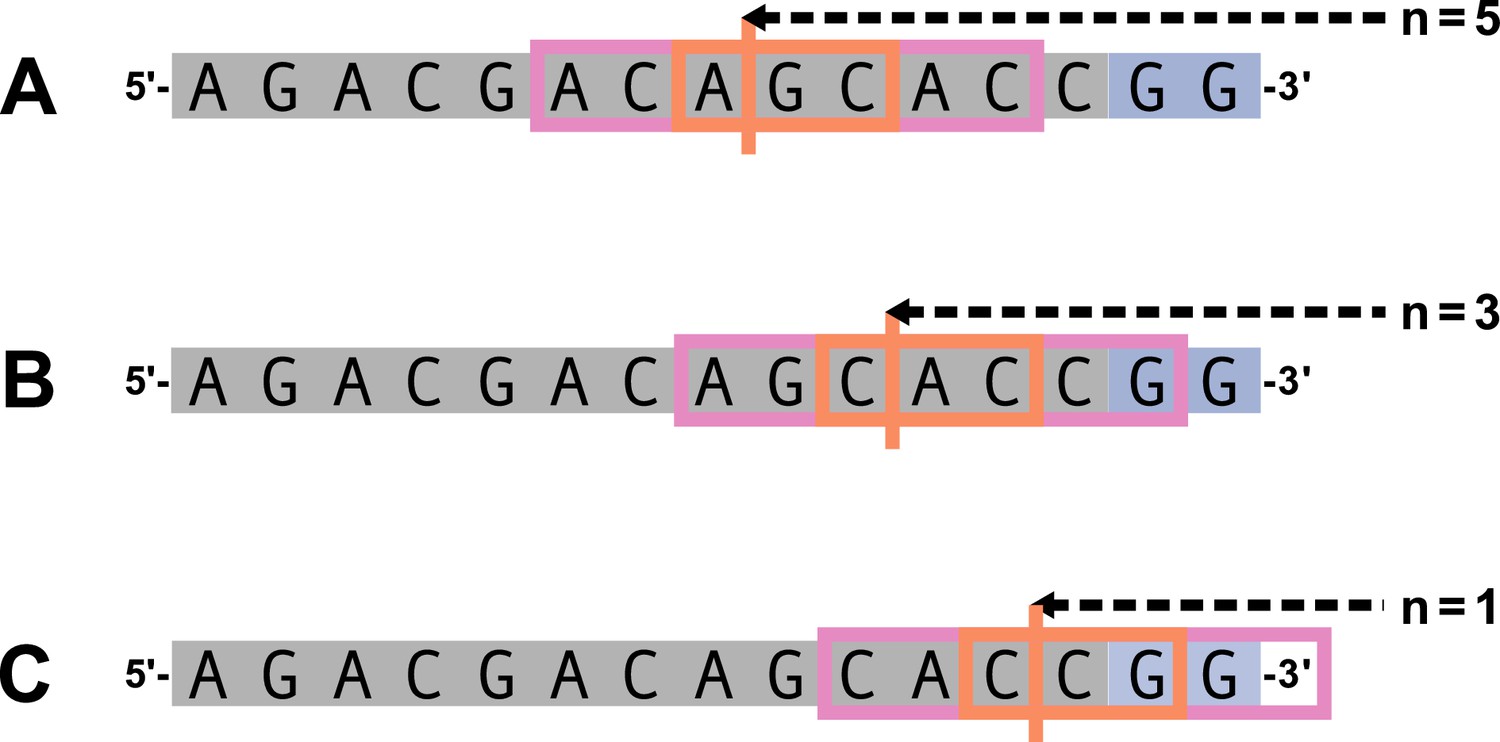
Summary of DNA-shape parameters.
Let and . The 3-nucleotide trimming sequence window is shown in the orange box and the trimming site is shown by the vertical orange line. The 7-nucleotide expanded trimming sequence window is represented by the pink boxes in addition to the original trimming sequence window orange box. An arbitrary gene sequence is highlighted in gray and the two possible P-nucleotides are highlighted in purple. (A) For , both the 7-nucleotide expanded trimming sequence window and the original 3-nucleotide trimming sequence window will not contain P-nucleotides. (B) For , the 7-nucleotide expanded trimming sequence window will contain one P-nucleotide and the original 3-nucleotide trimming sequence window will not contain P-nucleotides. (C) For , the 7-nucleotide expanded trimming sequence window will be ‘incomplete’ (contain less than 7 nucleotides), and thus, will be invalid for estimating DNA-shape for the nucleotides within the original trimming sequence window.
Appendix 3—figure 1
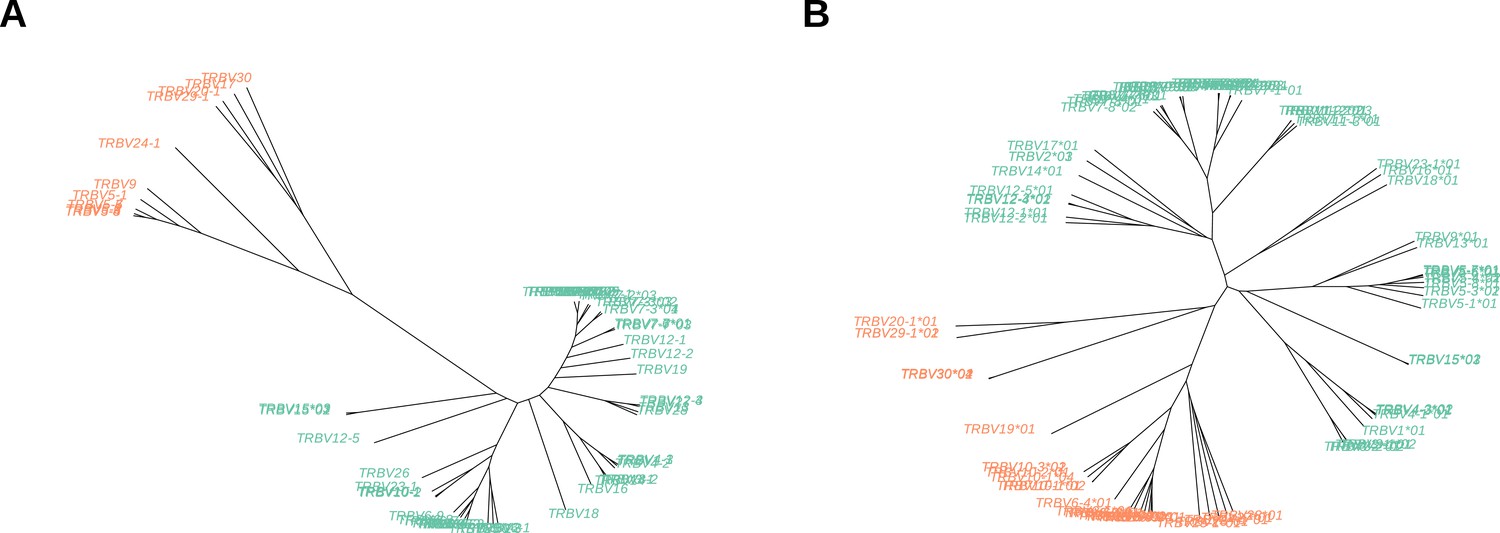
Un-rooted trees of ‘terminal‘ V-gene sequences (A) and full-length V-gene sequences (B) derived from hierarchical clustering.
Tips are colored according to cluster membership. The tips corresponding to the ‘most-different’ group within each tree are colored in orange.
Appendix 4—figure 1
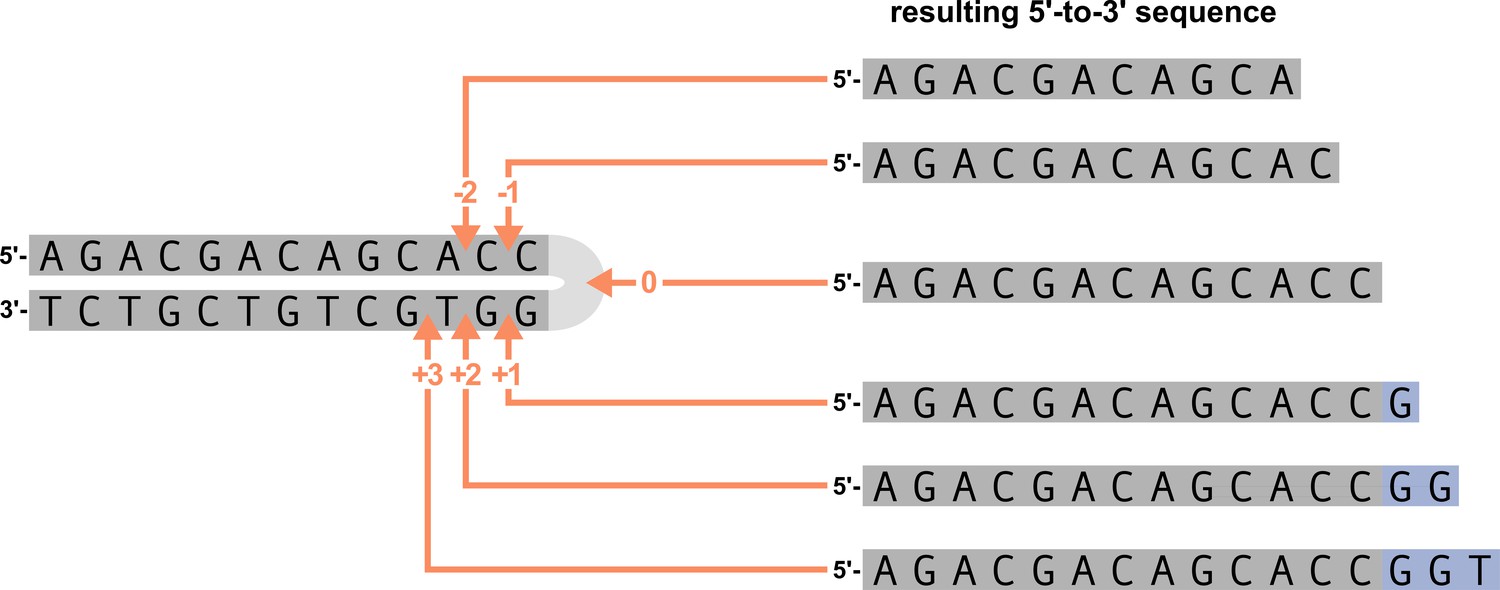
An arbitrary DNA hairpin can be nicked opened at various positions near the hairpin (left figure).
Hairpin nick position 0 refers to a nick at the tip of the hairpin, position –1 refers to a nick before the last nucleotide on the 5’ strand, position +1 refers to a nick before the last nucleotide on the 3’ strand, etc. The resulting 5’-to-3’ sequences from the various nick positions for the arbitrary gene sequence are shown on the right. Nucleotides originating from the 5’ strand of the DNA hairpin are highlighted in gray and P-nucleotides (originating from the 3’ strand of the DNA hairpin) are highlighted in purple. The various hairpin nick positions lead to 5’-to-3’ sequences that contain different amounts of P-nucleotides. Hairpin nick positions gt0 lead to 5’-to-3’ sequences that contain P-nucleotides, nick positions equal to zero lead to 5’-to-3’ sequences without P-nucleotides, and nick positions < 0 lead to 5’-to-3’ sequences without P-nucleotides and with portions of the original 5’ DNA hairpin strand removed.
Tables
Table 1
Summary of all parameter-specific coefficients and covariate functions for a trimming site and gene sequence .
Here, and represent the number of nucleotides 5’ and 3’ of the trimming site to be included in the ‘trimming motif,’ respectively, and represents the number of nucleotides 5’ of the trimming site to be included in the base-count.
| Parameter | Model coefficient variables | Parameter-specific covariate function |
|---|---|---|
| Motif parameters | coefficients | (Equation 14) |
| Base-count-beyond parameters | and coefficients | (Equation 17) |
| DNA-shape parameters | coefficients | (Equation 19) |
| Length parameters | coefficients | (Equation 20) |
Appendix 1—table 1
Summary of all notation used in our modeling.
| Variable | Description |
|---|---|
| General notation | |
| Set of all individuals | |
| Index for an individual in the set of all individuals | |
| Total number of TCRs in the repertoire of individual | |
| Index of a sequence in the TCR repertoire of individual | |
| Random variable that represents the gene sequence | |
| General notation for a gene-allele-group sequence oriented 5’-to-3’ | |
| V-gene-allele-group sequence (‘top’ strand oriented 5’-to-3’) | |
| J-gene-allele-group sequence (‘bottom’ strand oriented 5’-to-3’) | |
| Random variable that represents the number of deleted nucleotides | |
| Number of deleted nucleotides from the 3’-side of a gene sequence | |
| Lower bound of ‘reasonable’ trimming amounts, we have defined | |
| Upper bound of ‘reasonable’ trimming amounts, we have defined | |
| The number of TCRs that use gene allele group in the sampled repertoire of individual | |
| The number of TCRs that have gene allele group and nucleotides deleted in the sampled repertoire of individual | |
| Set of all ‘reasonable’ trimming amounts; | |
| Empirical conditional probability density function (Equation 1) | |
| Motif parameter-specific notation | |
| Non-negative integer value that represents the number of nucleotides 5’ of the trimming site to be included in the ‘trimming motif’ | |
| Non-negative integer value that represents the number of nucleotides 3’ of the trimming site to be included in the ‘trimming motif’ | |
| ‘Trimming motif’ sequence (Equation 13) | |
| (Log) position weight matrix coefficient for trimming motif position and nucleotide | |
| Set of all motif coefficients for all positions and nucleotide | |
| Motif-specific covariate function (Equation 14) | |
| Base-count-beyond parameter-specific notation | |
| Non-negative integer value that represents the number of nucleotides 5’ of the trimming site to be included in the 5’ base-count-beyond the ‘trimming motif’ | |
| Count of nucleotides that are A or T in an arbitrary sequence | |
| Count of nucleotides that are G or C in an arbitrary sequence | |
| The nucleotide sequence 5’ of the trimming site, beyond the ‘trimming motif’ (Equation 15) | |
| The nucleotide sequence 3’ of the trimming site, beyond the ‘trimming motif’ (Equation 16) | |
| and | Base-count-beyond model coefficients for the 5’ and 3’ sequence base-counts of A and T nucleotides beyond the trimming motif |
| Set of AT-base-count-beyond model coefficients (includes and ) | |
| and | Base-count-beyond model coefficients for the 5’ and 3’ sequence base-counts of G and C nucleotides beyond the trimming motif |
| Set of GC-base-count-beyond model coefficients (includes and ) | |
| Base-count-beyond-specific covariate function (Equation 14) | |
| DNA-shape parameter-specific notation | |
| ‘Expanded trimming sequence window’ (Equation 18); consists of the ‘trimming motif’ sequence extended by 2 nucleotides in both the 5’ and 3’ direction | |
| E | Nucleotide electrostatic potential |
| W | Nucleotide minor groove width |
| P | Nucleotide propeller twist |
| R | Di-nucleotide roll |
| H | Di-nucleotide helical twist |
| Measure of nucleotide shape for the nucleotide at position within the ‘expanded trimming sequence window’ | |
| Measure of di-nucleotide shape for the di-nucleotide at position within the ‘expanded trimming sequence window’ | |
| DNA-shape coefficients for nucleotide shape type and ‘expanded trimming sequence window’ nucleotide position | |
| DNA-shape coefficients for di-nucleotide shape type and ‘expanded trimming sequence window’ di-nucleotide position | |
| Set of all nucleotide and di-nucleotide DNA-shape coefficients | |
| DNA-shape-specific covariate function (Equation 19) | |
| Length parameter-specific notation | |
| Length specific model coefficient | |
| Length-specific covariate function | |
| Modeling notation | |
| Example model covariate function including motif and base-count-beyond model parameters (Equation 2) | |
| Conditional logit model formulation using the motif and base-count-beyond model covariate function (Equation 3) | |
| Aggregated log-likelihood for the conditional logit model; this likelihood function is un-weighted (Equation 4) and gives every observation uniform treatment in the likelihood | |
| Sampling procedure for the construction of the expected likelihood | |
| Expected log-likelihood for the conditional logit model; this likelihood function (Equation 5) weights each observation by its sampling probability, | |
| Expected log-likelihood for the conditional logit model; this likelihood function (Equation 7) weights each observation by its sampling probability from the empirical joint PDF (Equation 6) | |
| Empirical average per-gene-allele-group frequency used in formulating a subject-independent gene sampling procedure (Equation 8) | |
| Expected log-likelihood for the conditional logit model; this likelihood function (Equation 9) weights each observation using a subject-independent gene sampling procedure (Equation 8) | |
| Model evaluation notation | |
| An arbitrary model trained on a specified training data set | |
| Full V-gene data set | |
| Full J-gene data set | |
| Arbitrary held-out data set | |
| Probability of the arbitrary held-out data set (Equation 21) | |
| Expected per-sequence conditional log loss (Equation 11) of a trained model evaluated on a data set | |
| Expected per-sequence conditional log loss across 20 random held-out data sets (Equation 22) | |
| Per-gene mean squared error (Equation 23) for a gene using a model trained using the V-gene training data set | |
| Coefficient evaluation notation | |
| Test statistic (Equation 12) for evaluating the significance of a single inferred coefficient | |
| Set of SNPs within the gene encoding the Artemis protein that were previously identified to be associated with increasing the extent of trimming (Russell et al., 2022b) | |
| Number of minor alleles in the genotype of an individual for SNP | |
| Set of interaction coefficients between each model parameter and the SNP genotype |
Additional files
Download links
A two-part list of links to download the article, or parts of the article, in various formats.
Downloads (link to download the article as PDF)
Open citations (links to open the citations from this article in various online reference manager services)
Cite this article (links to download the citations from this article in formats compatible with various reference manager tools)
Statistical inference reveals the role of length, GC content, and local sequence in V(D)J nucleotide trimming
eLife 12:e85145.
https://doi.org/10.7554/eLife.85145


