A circular zone of attachment to the extracellular matrix provides directionality to the motility of Toxoplasma gondii in 3D
- Department of Microbiology and Molecular Genetics, University of Vermont Larner College of Medicine, United States
- Department of Molecular Physiology and Biophysics, University of Vermont Larner College of Medicine, United States
Figures
Figure 1
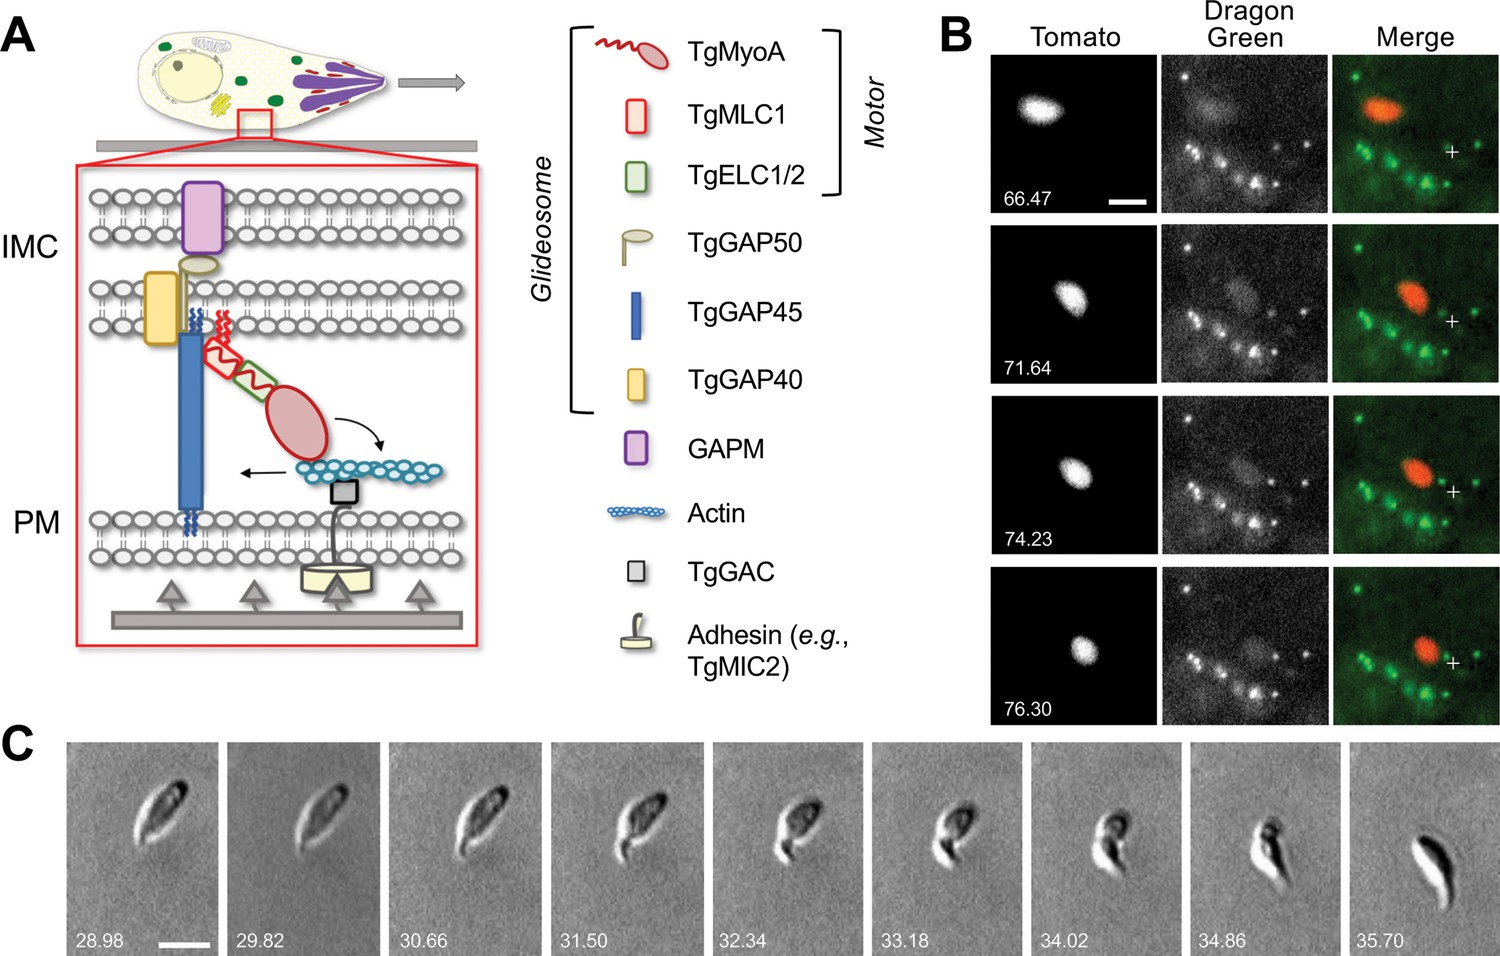
Parasites moving in 3D deform the surrounding Matrigel and undergo periodic constrictions.
(A) In the linear motor model of motility, the TgMyoA motor (TgMyoA and its associated light chains, TgMLC1 and either TgELC1 or TgELC2) is anchored to the parasite’s inner membrane complex (IMC) via TgGAP45 and the transmembrane proteins TgGAP40 and TgGAP50. The lumenal portion of GAP50 is thought to interact with GAPM, a protein that spans the inner IMC membrane and likely connects the entire glideosome to the underlying parasite cytoskeleton. Short actin filaments located between the parasite plasma membrane and the IMC are connected to ligands on the substrate through a linker protein, possibly TgGAC, which binds to the cytosolic tails of surface adhesins such as TgMIC2. The TgMyoA motor displaces the actin filaments rearward; because the motor is connected to the IMC and the actin is connected to the substrate, this causes the parasite to move forward relative to the substrate. The vertical blue and red squiggles on TgGAP45 and TgMLC1 denote lipid anchors that attach the proteins to the IMC (Frénal et al., 2010; Rompikuntal et al., 2021; Foe et al., 2015). Figure modified from Rompikuntal et al., 2021 and re-used here under the terms of a Creative Commons Attribution 4.0 International license. (B) Sequential time series maximum intensity projections (in z) demonstrate that Dragon Green-labeled microspheres embedded within the Matrigel are displaced toward moving tdTomato-expressing parasites; note displacement of the green bead closest to the fixed crosshair in the merged images as the parasite moves from top left to bottom right. See Video 1 for the entire time series, and Video 2 for a second example of bead displacement by a moving parasite. (C) Brightfield images showing a constriction progressing from the anterior to the posterior end of a parasite as the parasite moves forward one body length; see Video 3 for entire time series. All wild-type parasites analyzed (n=99) formed at least one constriction per body length of motility. Scale bars = 5 µm, timestamps in seconds.
Figure 2 with 1 supplement
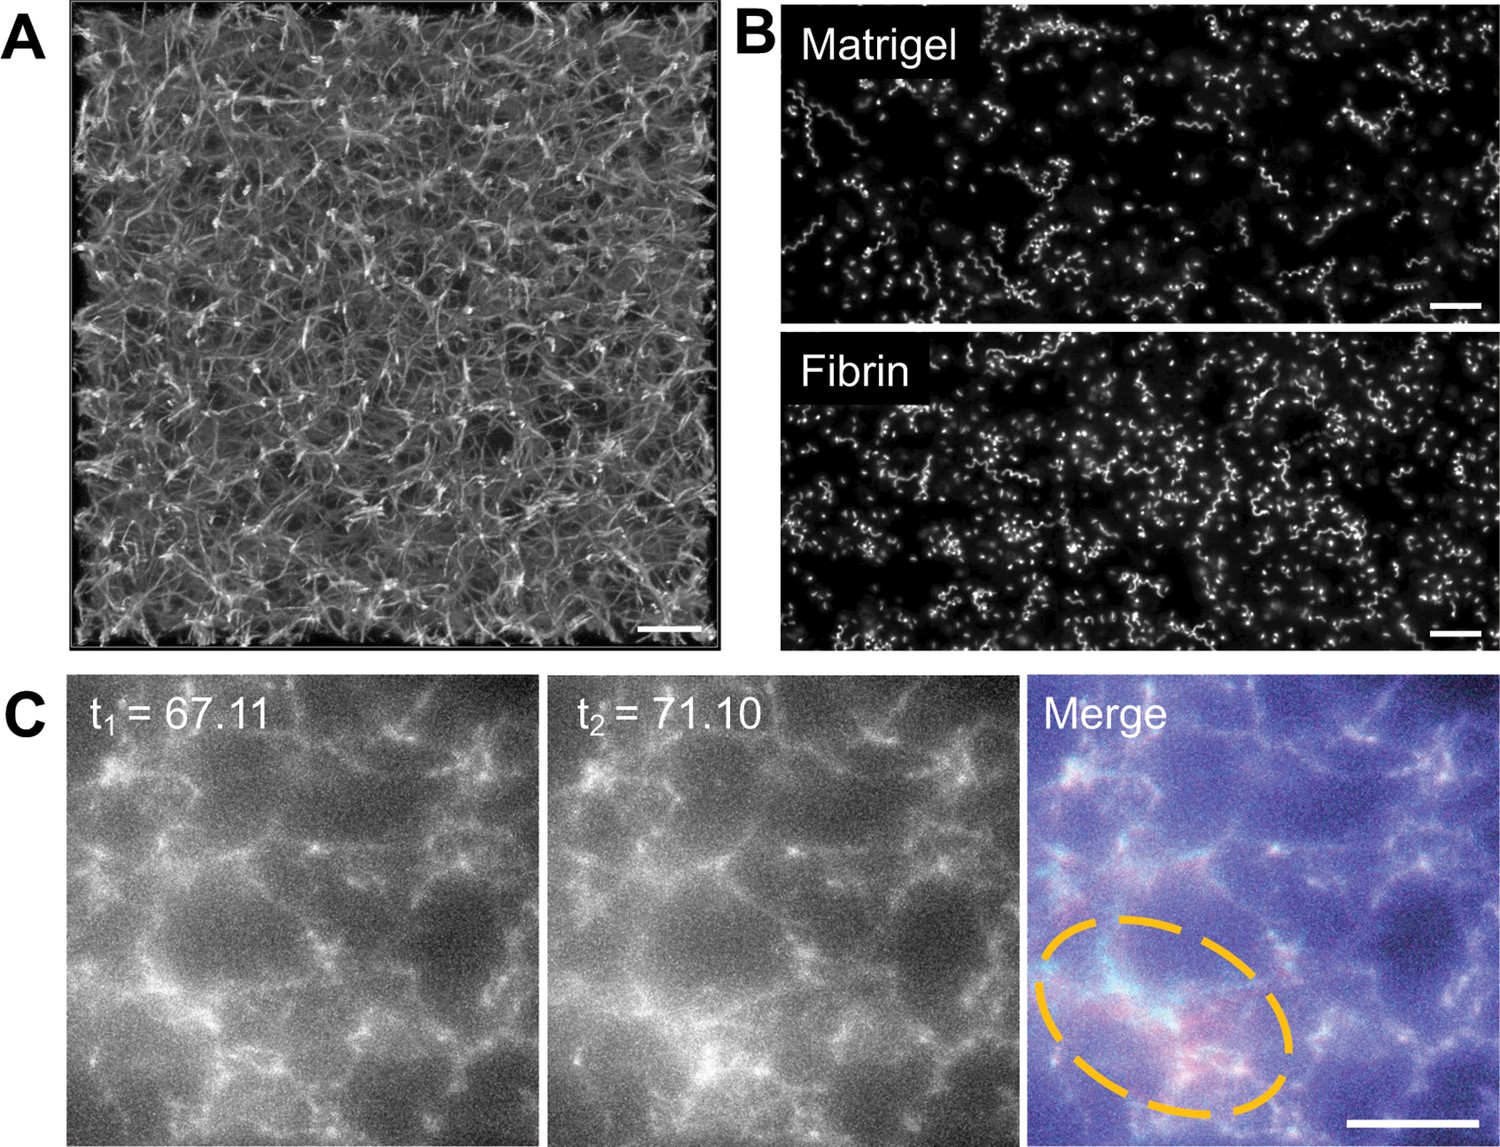
Parasite motility within a 3D fibrin matrix.
(A) Confocal imaging of a 2.25 mg/ml fluorescent fibrin gel. A maximum fluorescence intensity projection of 51 z-slices captured 0.25 µm apart is shown; scale bar = 10 µm. (B) Maximum fluorescence intensity projections showing the trajectories of tdTomato-expressing wildtype parasites moving in 3D in Matrigel (top) vs. fibrin (bottom). See Figure 2—figure supplement 1 for quantitative comparison of the motility parameters in the two matrices. Scale bar = 40 µm. (C) A parasite moving in a 1.3 mg/ml fluorescent fibrin matrix (see Video 5) visibly deforms the matrix, as evident from the non-coincident fluorescence signals in the highlighted area at the time points indicated (merge). Scale bar = 10 µm, timestamps in seconds.
Figure 2—figure supplement 1
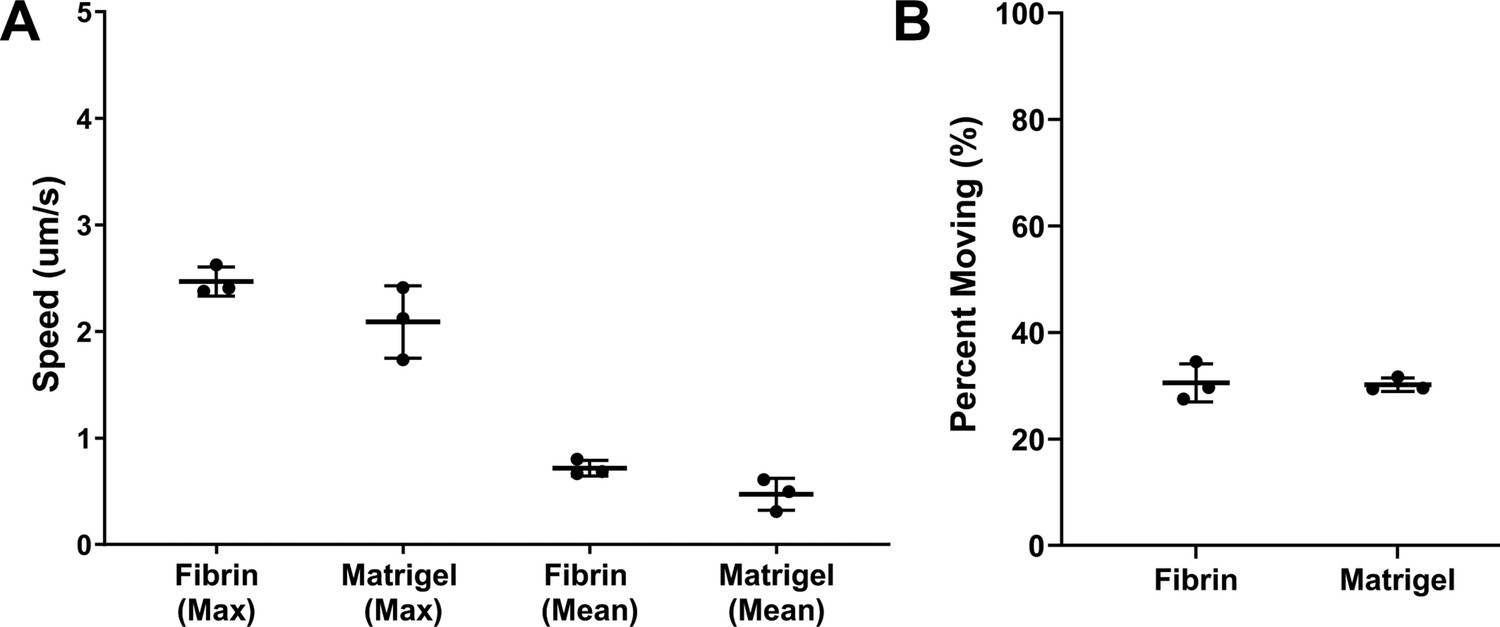
Quantitative comparison of parasite motility in fluorescent fibrin vs. Matrigel.
(A) Comparison of the maximum and mean speeds of parasites in 2.25 mg/ml fibrin vs. Matrigel. (B) Comparison of the proportion of parasites moving in 2.25 mg/ml fibrin vs. Matrigel. Horizontal bars indicate mean (± SD) from three independent biological replicates, each consisting of three technical replicates (Matrigel n=853, Fibrin n=913 parasites total). p>0.05 for each pairwise Matrigel vs. fibrin comparison, Student’s two-tailed t-test.
Figure 3 with 1 supplement
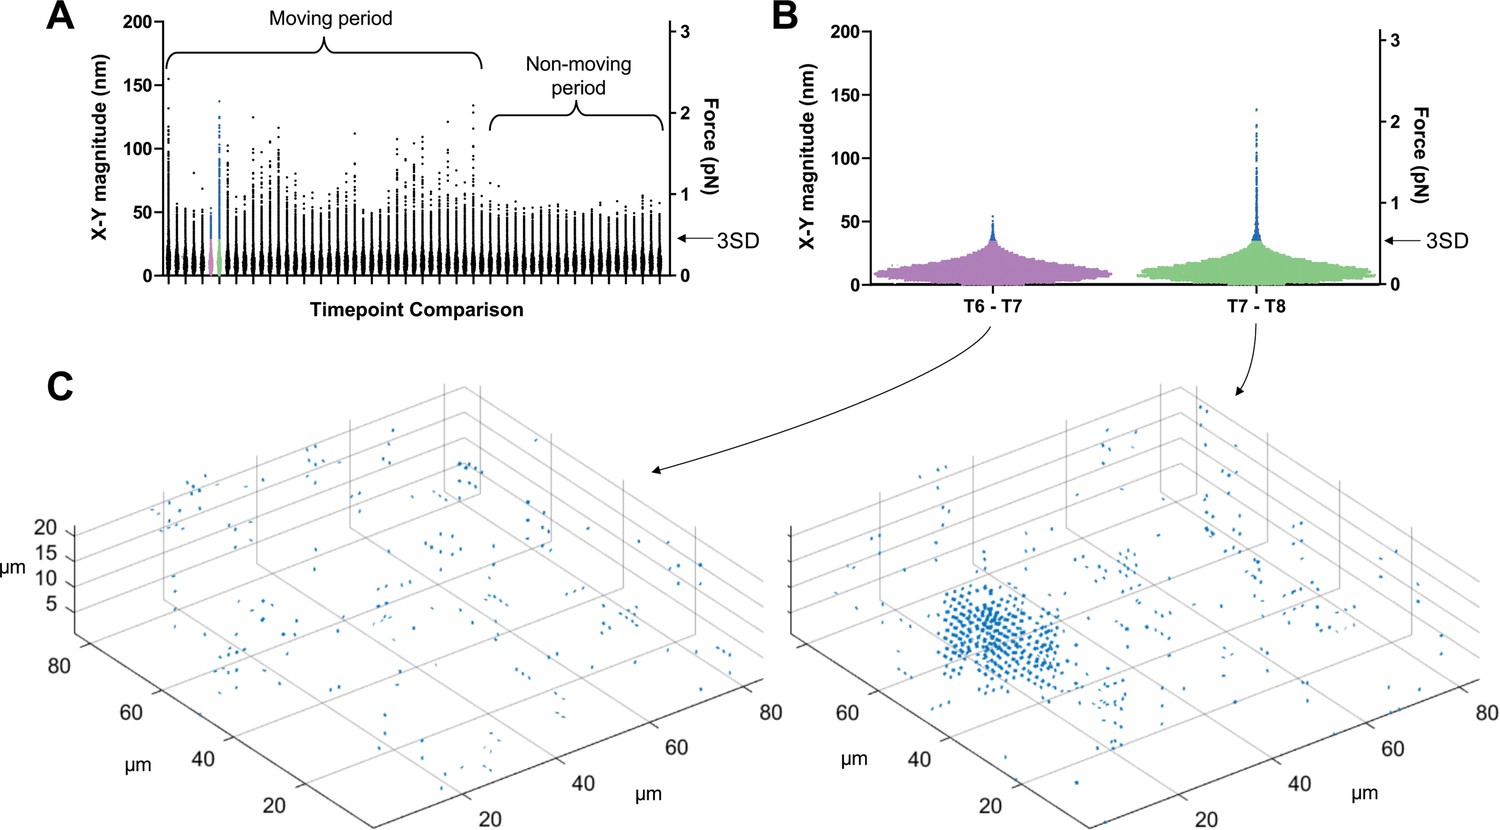
Determining threshold of detection in 3D traction force mapping.
(A) A fluorescent fibrin matrix containing wild-type parasites was imaged over 96 seconds (60 successive image volumes). FIDVC was then used to calculate the 16,807 3D fibrin displacement vectors between pairs of successive time points. The magnitudes of the 16,807 x-y displacement vectors are plotted for each of the 59 pairwise time point comparisons. This dataset contained a single moving parasite, which moved during the first part of the time course but not at the end, as indicated. For each time course, the two consecutive time points that gave the lowest mean x-y displacement vector magnitude were used to set the background threshold for that dataset: any displacements less than three standard deviations (3SD) above this mean were considered background noise. (B) Expanded view of the 16,807 datapoints from the two time point comparisons shown in purple and green in panel A. Arrow indicates the 3SD background threshold; all points above this threshold are colored blue in panels A and B. The moving parasite caused little deformation of the matrix above background between time points 6 and 7 and a greater amount of deformation between time points 7 and 8. (C) Displacement vectors with magnitudes greater than the 3SD background threshold for the two highlighted time point comparisons were mapped back onto the imaging volume; the cluster of displacement vectors evident in the time points 7–8 comparison corresponds to the position of the single moving parasite in the volume.
Figure 3—figure supplement 1
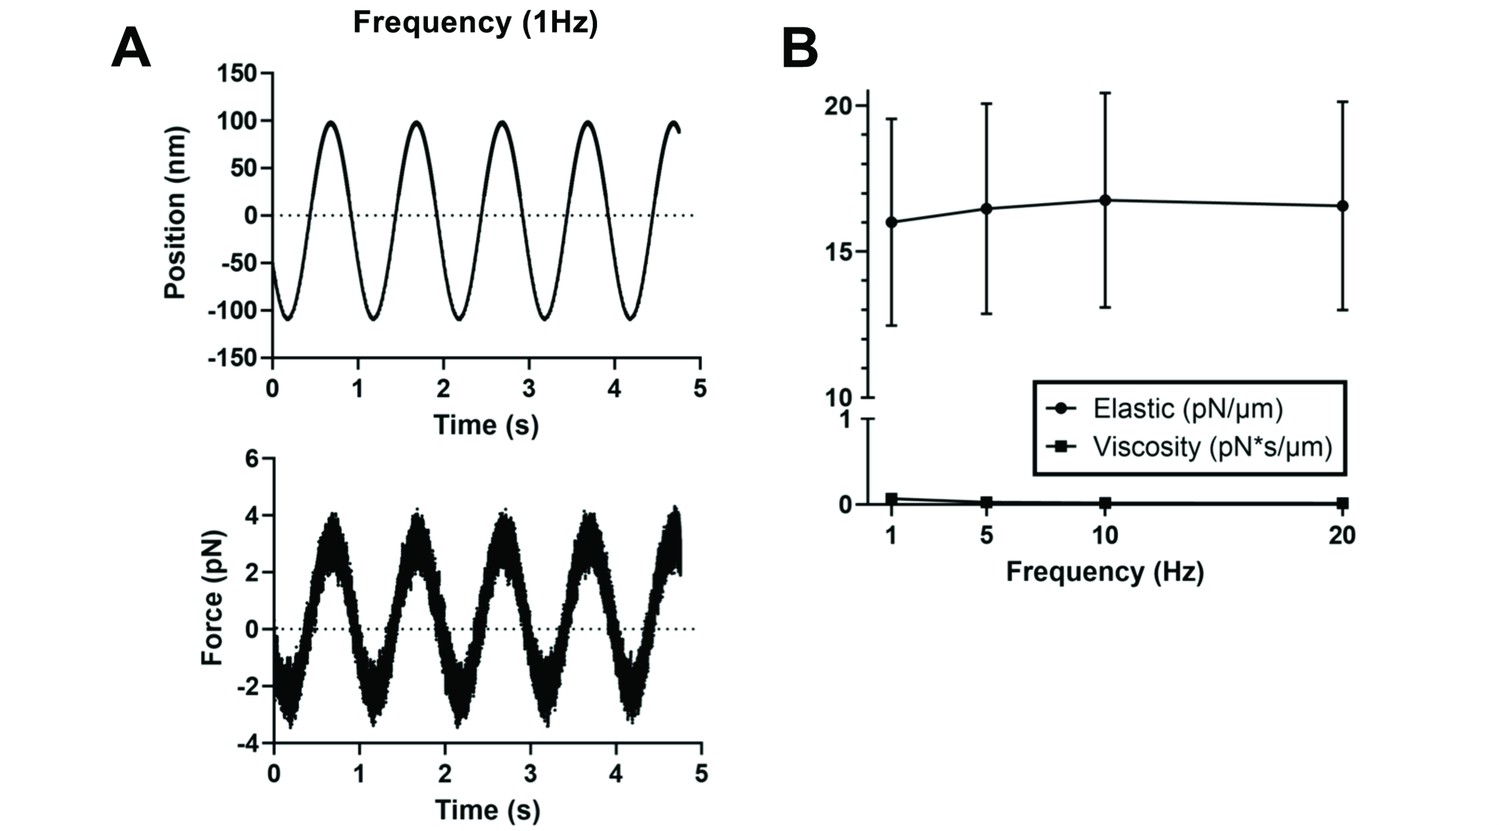
Rheological properties of the fibrin matrix.
The viscoelastic properties of the fibrin matrix were measured by laser trapping of 0.91 µm styrene beads. (A) The laser trap position at 1 Hz (top panel) and the resulting force as measured by the laser trap (bottom) show a primarily in-phase force response. Data from a single bead are shown. (B) The laser trap position and output force at 1–20 Hz were used to calculate the elastic and viscous properties of the matrix; these frequencies were chosen to encompass the approximate speed of a moving parasite. Cumulative data from three independent experiments are shown; n=36 beads analyzed. Bars indicate mean (± SD).
Figure 4 with 3 supplements
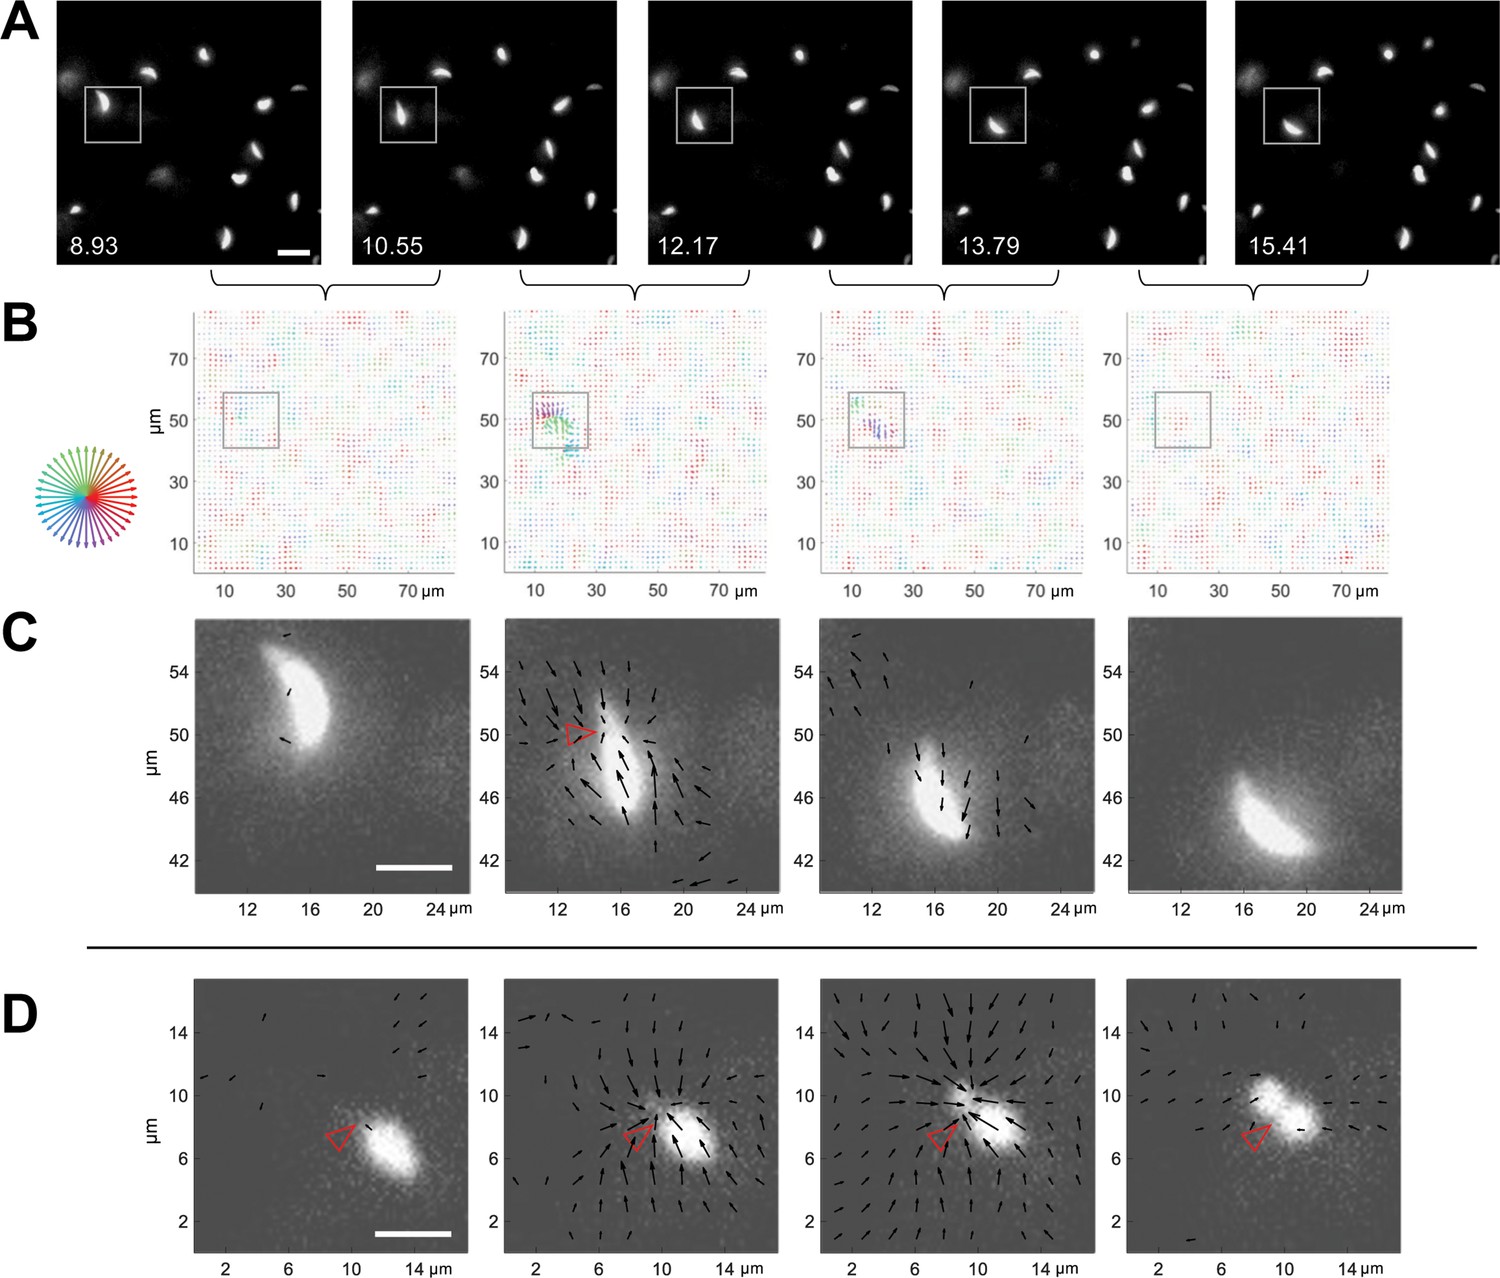
3D traction force mapping in fluorescent fibrin reveals that the matrix is periodically pulled in toward the constriction during parasite motility.
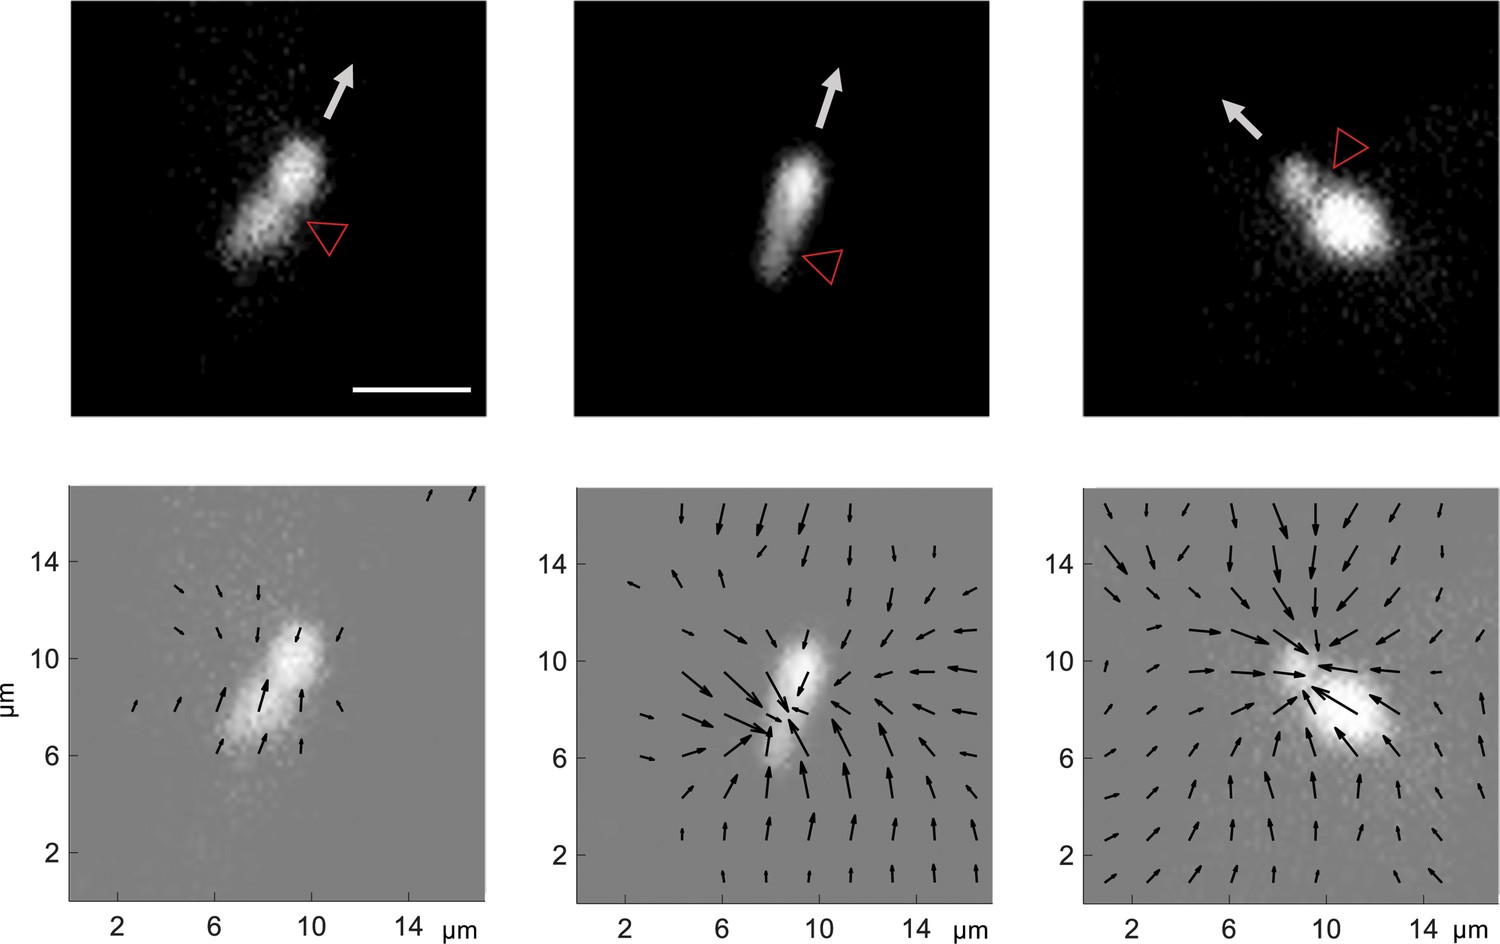
(A) Sequential time series images, in a single z-plane, of a tdTomato-expressing parasite moving in fibrin (boxed). Scale bar = 10 µm, timestamps in seconds. (B) Force maps from the corresponding z subvolume plane of the data shown in panel A; each map depicts the motions of the fluorescent fibrin matrix between the two consecutive time points, as indicated by the brackets. Arrow length (multiplied 24-fold for display) indicates the magnitude of matrix displacement and arrow color the directionality (see color wheel). See Video 7 for the entire time series. (C) Zoomed images showing the force maps from the boxed region of panel B, after background subtraction (see text), overlaid on the parasite images from panel A. Length of arrows indicating displacement magnitude are multiplied 15-fold for display. Note inward displacement of the matrix in the second overlay image, outward displacement (relaxation) of the matrix in the third image, and no detectable displacement vectors in the fourth image even though the parasite continues to move. (D) Zoomed overlays of the force maps (background subtracted) and images of a moving parasite from a second dataset. The inwardly displaced matrix in this example did not relax back to its original position within the time frame of the experiment. Arrow lengths indicating displacement magnitude are multiplied 15-fold for display. See Video 8 for the entire time series. Scale bars in panels C and D=5 µm. Empty red arrowheads indicate position of the constriction.
Figure 4—figure supplement 1
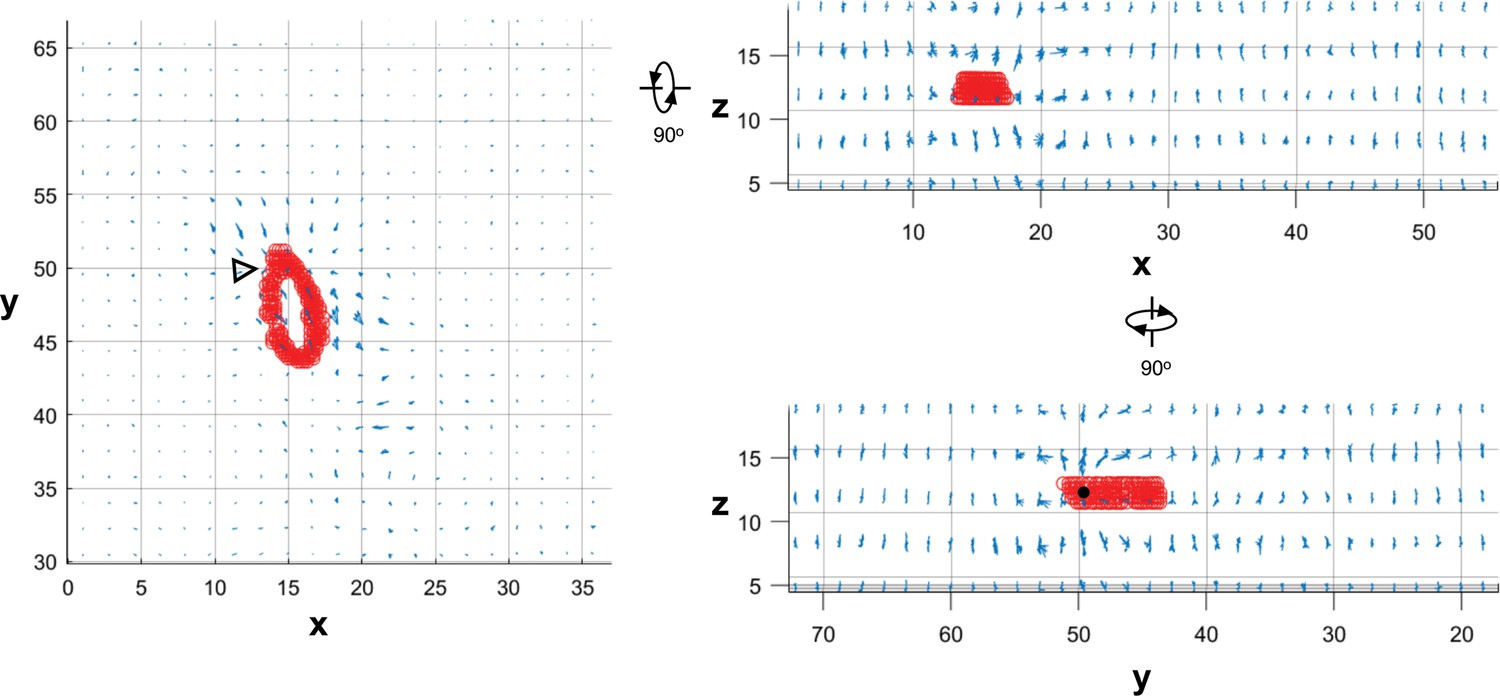
All displacement vectors point in towards a moving parasite.
Matrix displacement vectors from all subvolumes (49 (x) x 49 (y) x 7 (z)) in the image volume were calculated by FIDVC and projected onto the x-y, x-z and y-z planes, as indicated (axis labels are in µm). Length of arrows indicate displacement magnitude and are multiplied 10-fold for display. The data correspond to the parasite shown in the second panel of Figure 4C and frame 2 of Video 7. The moving parasite is outlined on each z slice with red circles, and the position of the constriction is indicated by either an empty arrowhead (x–y) or a black dot (y–z).
Figure 4—figure supplement 2
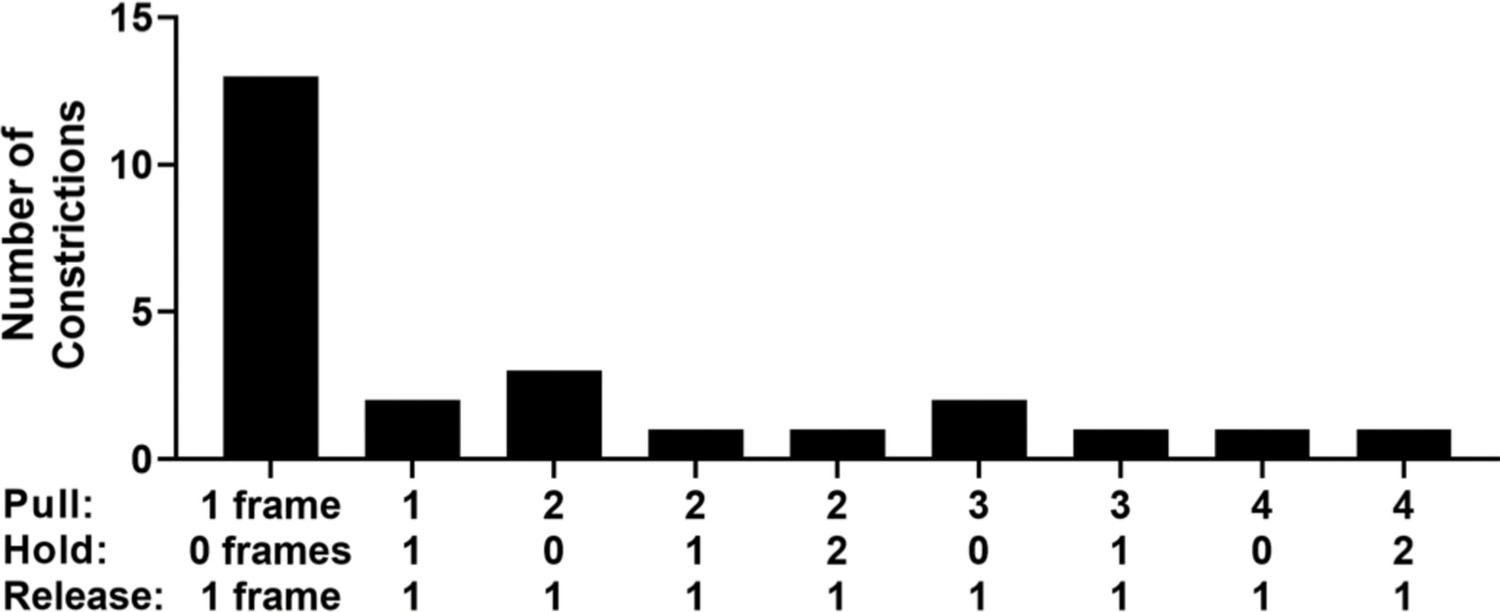
Pattern of pulling, holding, and release of the matrix during individual constriction events.
The number of consecutive frames in which: the matrix displaced in towards the parasite (pull); no further matrix displacement was observed (hold); and the matrix moved away from the parasite towards its original position (release) are indicated. n=9 parasites, 25 constrictions.
Figure 4—figure supplement 3
Additional examples showing that matrix displacement is directed primarily in towards the constriction in moving parasites.
Empty red arrowheads indicate position of the constriction and white arrows the direction of parasite travel. Length of black arrows indicating displacement magnitude are multiplied 15-fold for display. Scale bars = 5 µm.
Figure 5 with 2 supplements
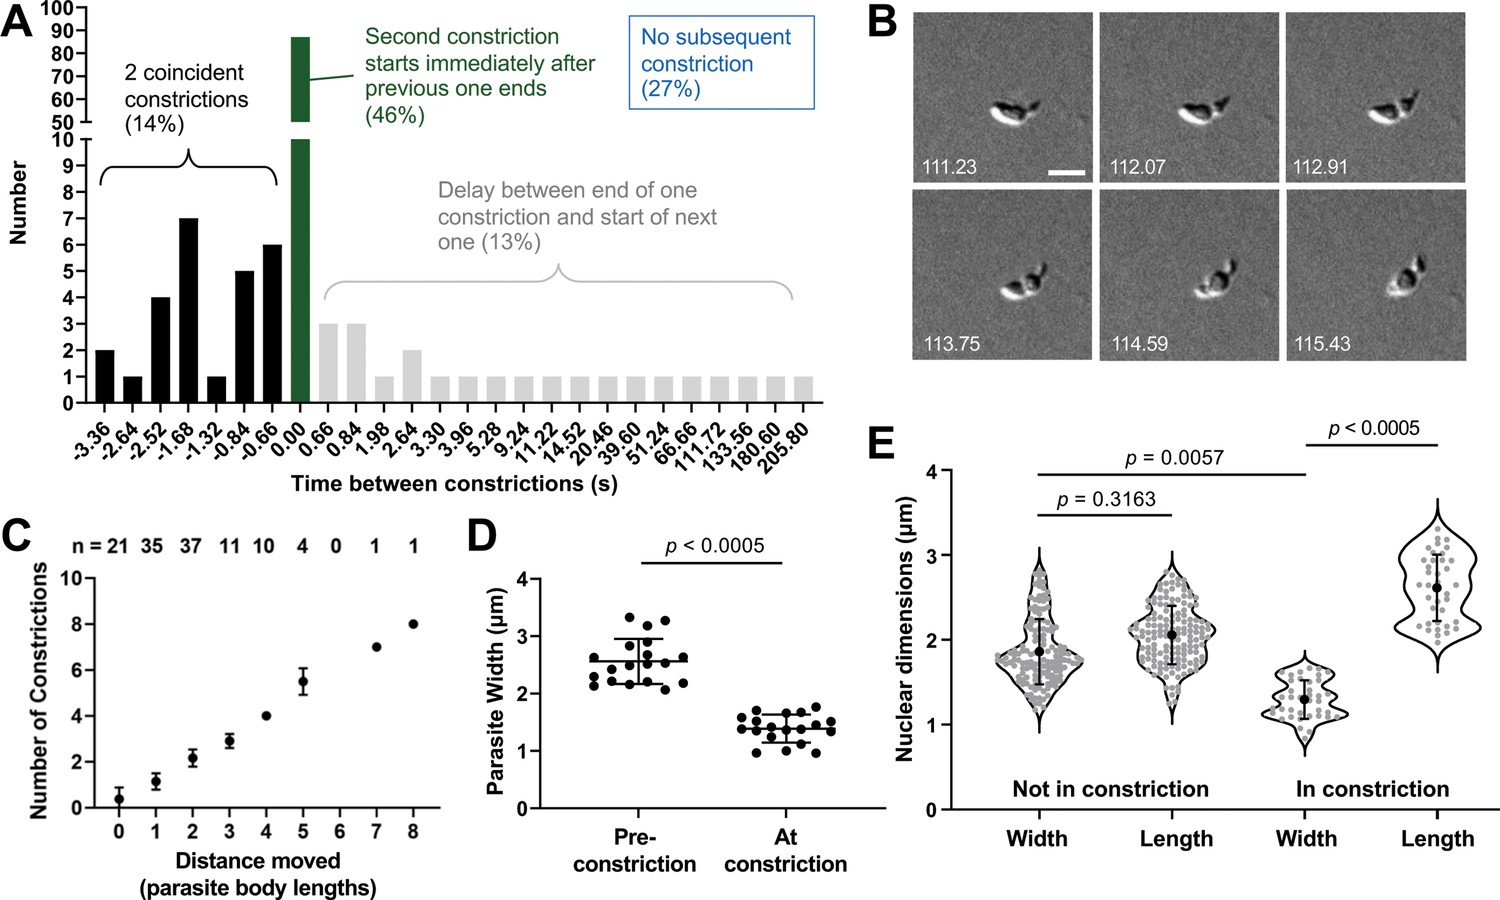
The constrictions are tightly linked with motility and are sufficiently narrow to deform the parasite nucleus.
(A) The time interval between constrictions during motility of individual parasites (n=99 parasites, 188 constrictions). A negative time interval (black bars) corresponds to the presence of two constrictions in the same parasite for the indicated amount of time. Green bars denote back-to-back constrictions and grey bars denote a delay between constrictions for the indicated amounts of time. For 27% of the constrictions (not plotted), no subsequent constriction occurred within the time frame of the experiment. (B) Example of a parasite with two concurrent constrictions; see Video 9 for entire time series. Brightfield images; scale bar = 5 µm; timestamps in seconds. (C) Number of constrictions observed vs. distance traveled, expressed in terms of binned parasite body lengths (i.e. multiples of 7 µm). (D) Width of individual moving parasites, measured at the halfway point along their longitudinal axis, either before the halfway point reached the constriction (‘Pre-constriction’) or as the halfway point was passing through the constriction (‘At constriction’). Data from two independent biological replicates were combined; n=15 parasites, 19 constrictions. (E) Dimensions of the nucleus (determined by Hoechst 33342 staining) in individual parasites during time points when the nucleus was located either ahead of or behind the constriction (‘Not in constriction’) vs. passing through the constriction (‘In constriction’). Nuclear length and width are defined as the nuclear diameters parallel and perpendicular to the long axis of the parasite, respectively. Data from two independent biological replicates were combined; n=9 parasites, 21 constrictions. In panels D and E, bars indicate mean (± SD); samples were compared by Student’s two-tailed t-test.
Figure 5—figure supplement 1
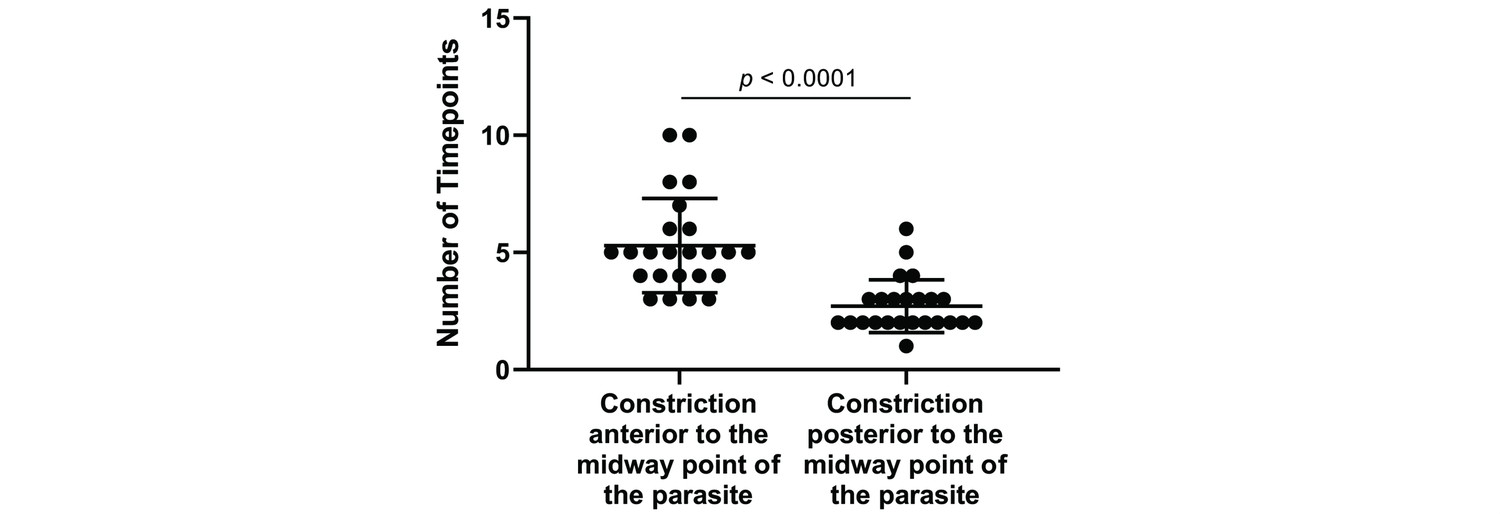
Parasites move faster after the constriction has past the midway point on the parasite’s longitudinal axis.
The number of time points when the constriction was present either anterior or posterior to the midway point along the parasite’s longitudinal axis were determined. Only parasites that progressed through one complete anterior-to-posterior constriction and neither stopped partway nor initiated a second constriction while the original constriction was present were analyzed. Data from two independent biological replicates were combined; n=20 parasites, 24 constrictions. It takes a constriction on average longer (i.e. more time points) to progress from the anterior tip of the parasite to the midway point along the parasite surface than it does from the midway point to the posterior end. Bars indicate mean ± standard deviation; the data were compared by Student’s two-tailed t-test.
Figure 5—figure supplement 2
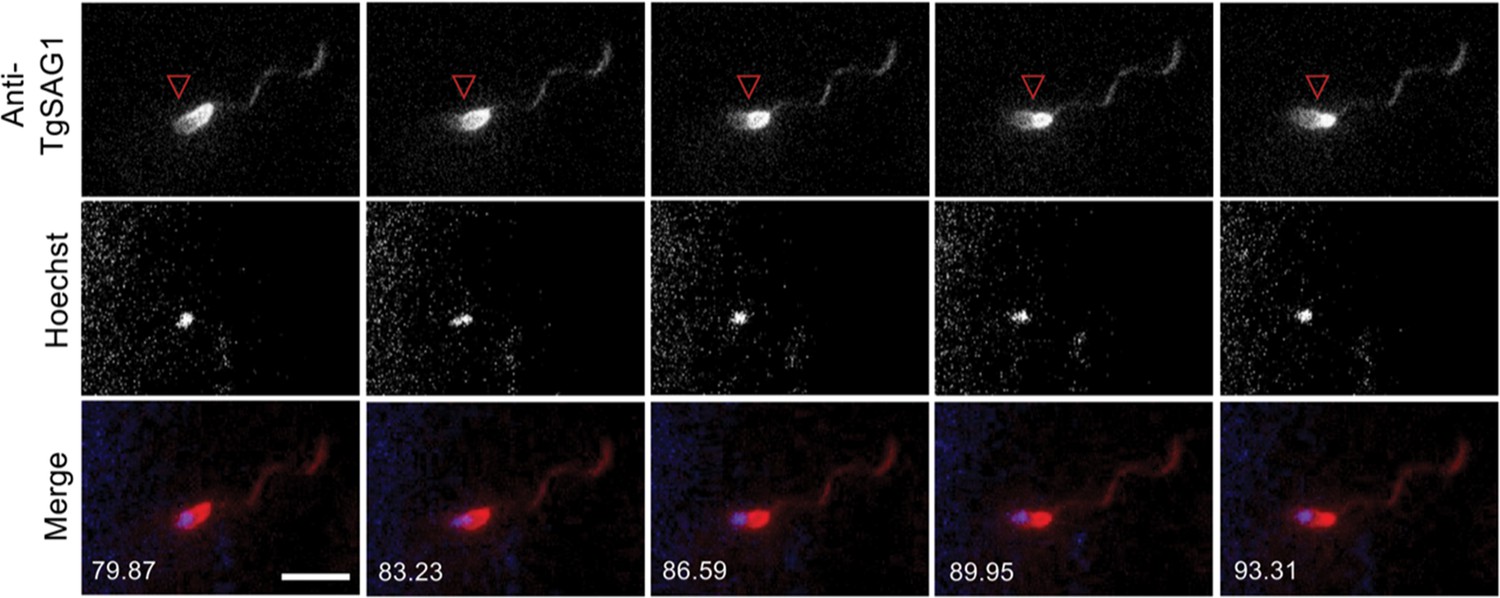
Fluorescent antibody against TgSAG1 is depleted from the parasite surface anterior to the constriction and shed into the Matrigel matrix.
The top panels show the anti-TgSAG1 fluorescent signal; red empty arrowhead marks the location of the constriction. Middle panels show the Hoechst 33342-stained nucleus, which stays in focus throughout the time series. Bottom panels show the merged images (red = anti-TgSAG1, blue = Hoechst 33342). Scale bar = 5 µm; timestamps in seconds. See Video 10 for the entire time series. All moving parasites examined (n=9) deposited trails containing anti-SAG1 in the Matrigel.
Figure 6 with 2 supplements

3D motility and force mapping of parasites lacking TgMyoA or TgMIC2.
(A) Brightfield images showing TgMyoA knockout and TgMIC2 knockout parasites moving within a Matrigel matrix without a detectable constriction. A wild-type parasite undergoing a typical constriction is shown for comparison. The TgMyoA knockout parasite makes right-angled ‘stairstep’ turn, and the TgMIC2 knockout parasite moves erratically in a tightly twisting arc. Scale bar = 5 µm, timestamps in seconds. See Videos 11 and 12 for the entire time series for the TgMyoA and TgMIC2 knockout parasites. (B–E) As in Figure 3A, the plots show the magnitudes of the 16,807 fibrin x-y displacement vectors between each pair of successive image volumes generated in experiments using: (B) TgMyoA knockout parasites; (C) TgMIC2 knockout parasites; (D) wild-type parasites; and (E) no added parasites (fibrin only). Periods during the 96-second time course when parasites were moving are indicated. For each time course, the two consecutive time points that gave the lowest mean displacement magnitude were used to set the background threshold: any displacements less than three standard deviations (3SD) above this mean were considered noise for that dataset. Examples of the force maps surrounding motile TgMyoA and TgMIC2 knockout parasites are shown in Figure 6—figure supplements 1 and 2, respectively.
Figure 6—figure supplement 1
The small number of TgMyoA knockout parasites that move more than one body length produce no detectable force on the fibrin matrix.
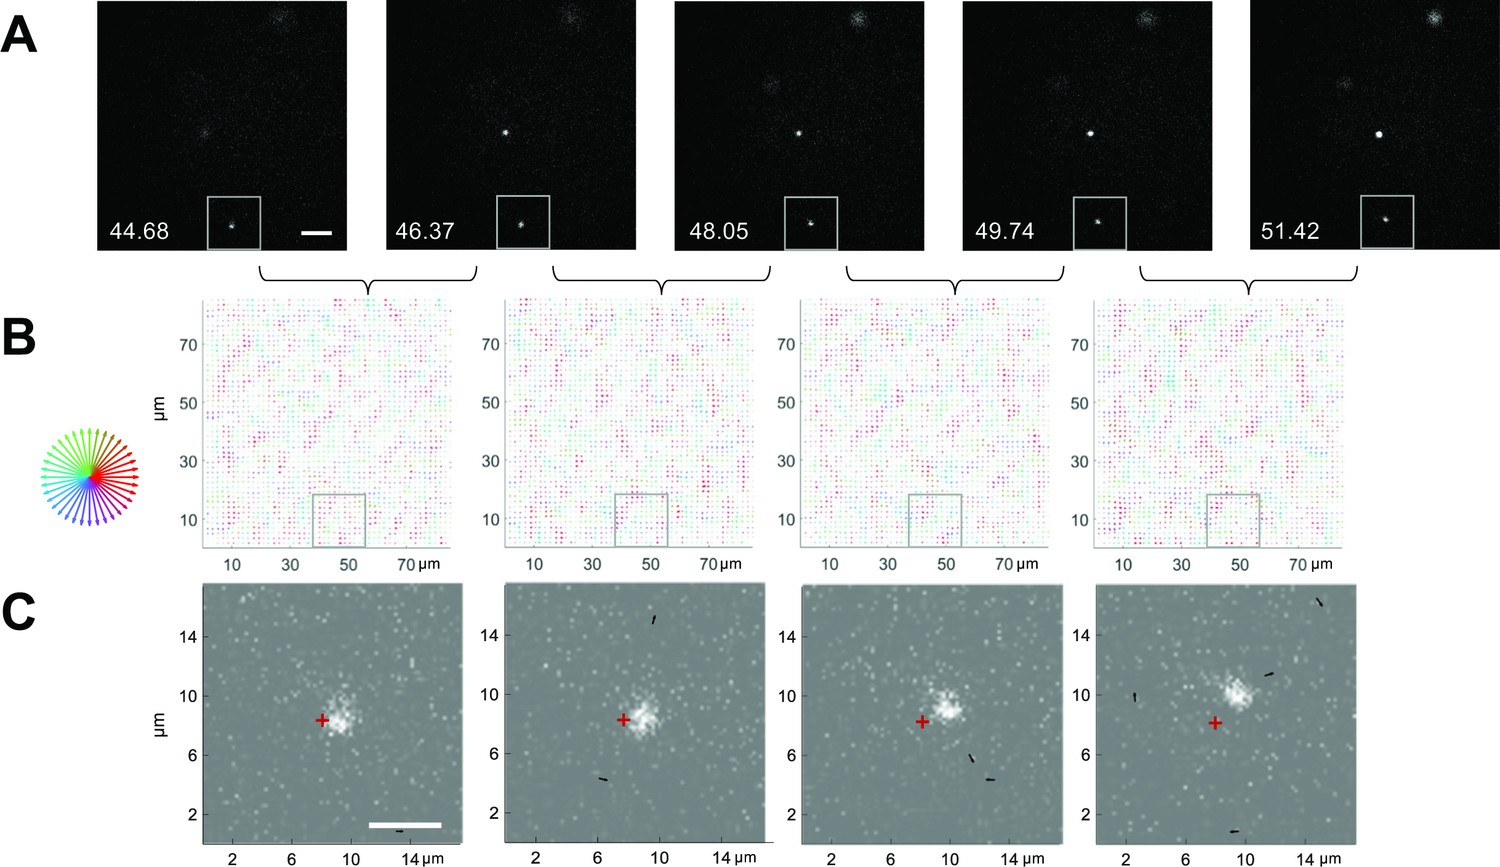
(A) Sequential fluorescence images in a single z-plane of a moving TgMyoA knockout parasite stained with Hoechst 33342 (to label the parasite nucleus), (B) the corresponding force maps, and (C) the zoomed images showing the force maps from panel B (boxed region), with background subtraction, overlaid on the parasite images from panel A. A red crosshair placed at a fixed position in the images in panel (C) illustrates movement of the parasite. The highlighted parasite continued to move for another 24 seconds; no signal above background was seen on the force maps at any time along its trajectory. Length of arrows indicating displacement magnitude are multiplied 24-fold in (B) and 15-fold in (C) for display. Scale bar = 5 µm, timestamps in seconds.
Figure 6—figure supplement 2
Moving TgMIC2 knockout parasites produce no detectable force on the fibrin matrix.
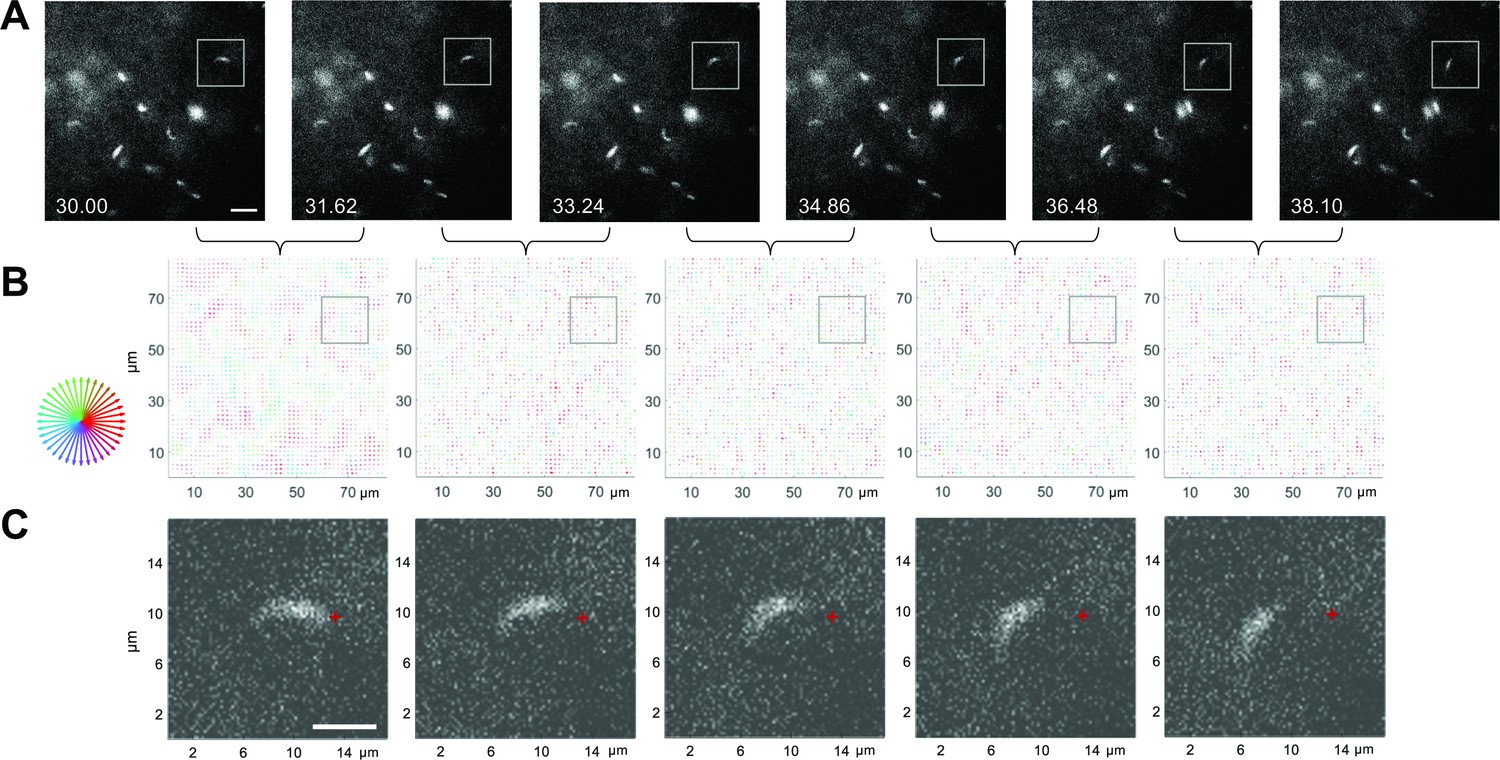
(A) Sequential fluorescence images in a single z-plane of a moving TgMIC2 knockout parasite expressing YFP, (B) the corresponding force maps, and (C) the zoomed images showing the force maps from panel B (boxed region), with background subtraction, overlaid on the parasite images from panel A. A red crosshair placed at a fixed position in the images in panel C illustrates movement of the parasite. The highlighted parasite continued to move for another 18 seconds; no signal above background was seen on the force maps at any time along its trajectory. Length of arrows indicating displacement magnitude are multiplied 24-fold in panel C and 15-fold in panel D for display. Scale bars = 10 µm (panel A), 5 µm (panel C); timestamps in seconds.
Figure 7 with 1 supplement
Knockout of TgMIC2 results in the loss of the constriction and less directional motility.
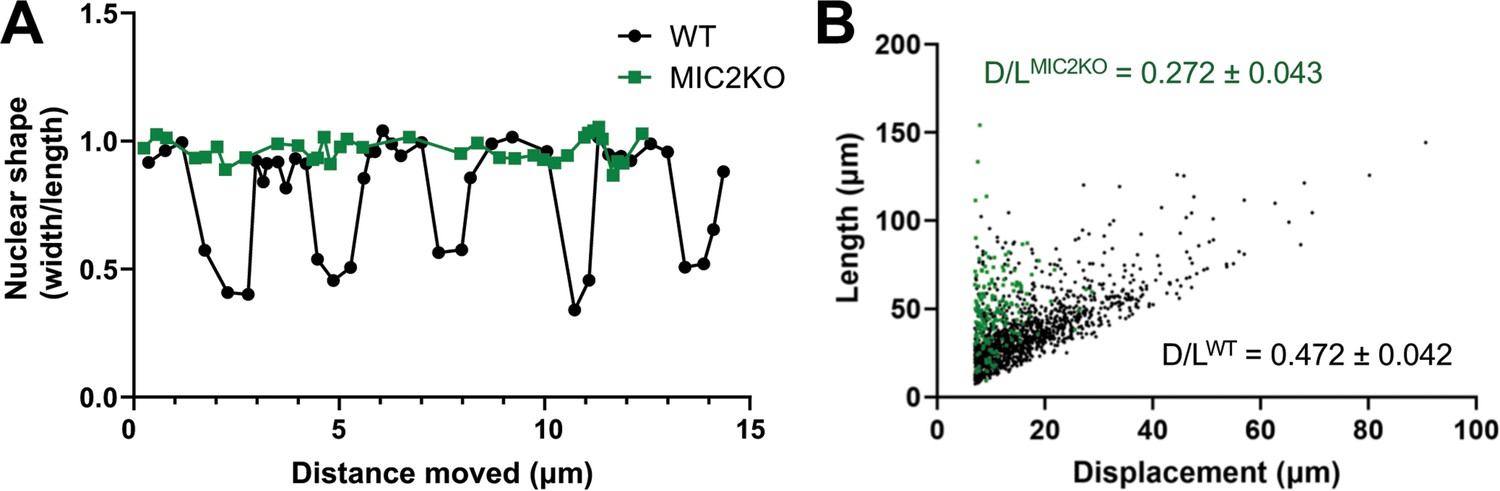
(A) Representative plots of nuclear shape (ratio of the nuclear diameters perpendicular vs. parallel to the long axis of the parasite) in one wildtype and one TgMIC2 knockout parasite (black circles and green squares, respectively), as the parasites moved over time. The wild-type parasite underwent multiple concurrent constrictions along its trajectory. For the combined data from multiple parasites, see Figure 7—figure supplement 1A. (B) Ratio of parasite displacement (D) to trajectory length (L) for wildtype (n=1399) and TgMIC2 knockout (n=165) parasites (black circles and green squares, respectively). The calculated means (± SD) are from three independent biological replicates, each consisting of three technical replicates (see Figure 7—figure supplement 1B). In panels A and B, ‘WT’ refers to the TgMIC2 LoxP parasites (Gras et al., 2017) before treatment with rapamycin to excise MIC2.
Figure 7—figure supplement 1
In parasites lacking TgMIC2, the nuclei do not change shape during 3D motility and the trajectories are less straight than those of wild-type parasites.
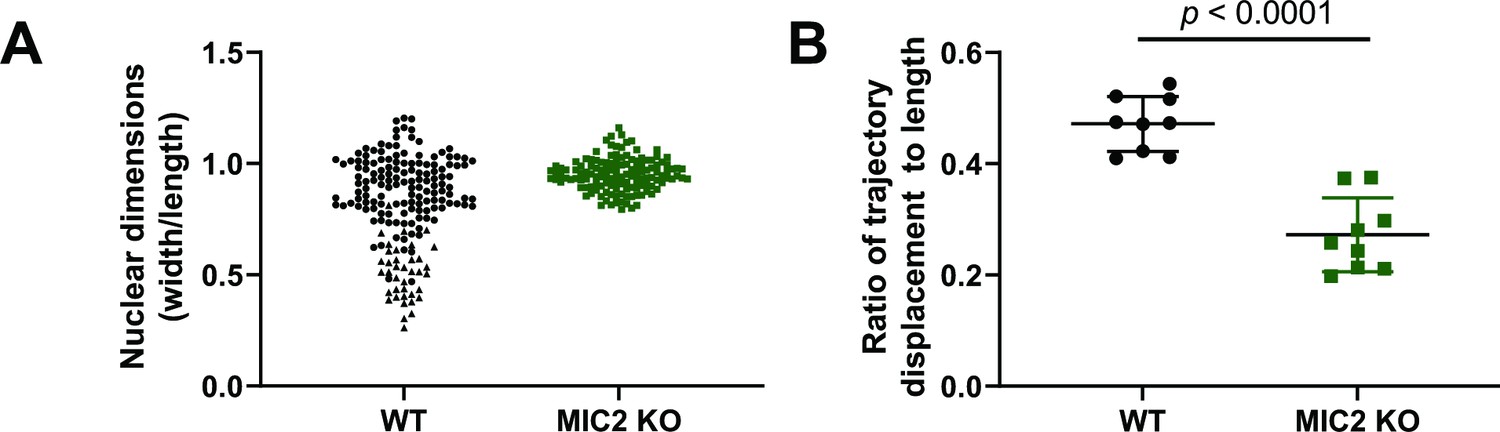
(A) Ratio of nuclear diameter perpendicular (width) vs. parallel (length) to the long axis of the parasite in moving wild-type (WT) and TgMIC2 knockout (MIC2 KO) parasites, over time. For each parasite line, data from two independent biological replicates were combined; n=9 parasites (WT) and n=10 parasites (MIC2 KO). For the WT parasites, triangles indicate time points when the nucleus was passing through a constriction and circles when the nucleus was not passing through a constriction. (B) Ratio of parasite displacement to trajectory length for WT and MIC2 KO parasites. The horizontal bars indicate means (+/-SD) from three independent biological replicates, each consisting of 3 technical replicates; n=1,399 total trajectories (WT) and n=165 total trajectories (MIC2 KO). The individual data points are plotted in Figure 7B. The data were compared by Student’s two-tailed t-test. Note that in panels D and E, “WT” refers to the TgMIC2 LoxP parasites (Gras et al., 2017) before treatment with rapamycin to excise MIC2.
Videos
Video 1
Maximum intensity projection in z of microspheres (green) being displaced due to parasite (red) movement within the Matrigel.
Scale bar = 5 µm, time is shown in hr:min:sec. Single frames from this video are shown in Figure 1B.
Video 2
Microsphere (green) being displaced towards a parasite (red) moving in Matrigel within in a single z plane.
Scale bar = 5 µm, time is shown in hr:min:sec.
Video 3
Brightfield imaging of a parasite undergoing a single constriction.
Scale bar = 5 µm, time is shown in hr:min:sec. Single frames from this video are shown in Figure 1C.
Video 4
Confocal fluorescence imaging of a 2.25 mg/ml fluorescent fibrin gel.
51 x-y slices captured 0.25 µm apart in z were reassembled into the volumetric view shown. Dimensions of the imaged volume are shown at bottom left. See Figure 2A for maximum intensity projection of these data.
Video 5
Deformation of fluorescent fibrin (green) by a parasite (red; bottom) as it moves up through the image stack.
Scale bar = 10 µm, time is shown in hr:min:s. Single frames from this video are shown in Figure 2C.
Video 6
3D displacement map surrounding the moving parasite shown in the second panel of Figure 4C and frame 2 of Video 7.
Length of arrows indicating displacement magnitude are multiplied 10-fold for display. The parasite is outlined on each z plane with red circles. Single frames from this video displaying projections onto the x-y, x-z and y-z planes are shown in Figure 4—figure supplement 1.
Video 7
x-y displacement map overlaid on the moving parasite shown in Figure 4A–C.
Arrow size corresponds to relative displacement magnitude and arrow color to displacement direction as described in Figure 4.
Video 8
x-y displacement map overlaid on the moving parasite shown in Figure 4D.
Arrow size corresponds to relative displacement magnitude and arrow color to displacement direction as described in Figure 4.
Video 9
Brightfield imaging of a parasite undergoing two constrictions at the same time.
Scale bar = 5 µm, time is shown in hr:min:s. Single frames from time points 0:1:51.23 – 0:1:55.43 of this video are shown in Figure 5B.
Video 10
Parasite labeled with Alexa546-conjugated anti-TgSAG1 (red) and Hoechst 33342 (blue) undergoing a constriction.
Scale bar = 5 µm, time is shown in hr:min:s. Note the helical trail of shed fluorescent antibody behind the moving parasite. Single frames from this video are shown in Figure 5—figure supplement 2.
Video 11
Brightfield imaging of a moving TgMyoA knockout parasite.
Scale bar = 5 µm, time is shown in hr:min:sec. Single frames from this video are shown in Figure 6A.
Video 12
Brightfield imaging of a moving TgMIC2 knockout parasite.
Scale bar = 5 µm, time is shown in hr:min:s. Single frames from this video are shown in Figure 6A.
Tables
Table 1
Imaging parameters for the different experiments described.
| Experiment | Objective | Fluorochrome(Excitation/emission wavelengths) | Image spacing in z | Exposure time per image | Number of Image stacks | Total time | Volume(x, y, z) |
|---|---|---|---|---|---|---|---|
| Microspheres (Matrigel) | 60× | DragonGreen (490/507–530 nm) | 41 slices, 1 µm apart | 16ms | 60 | 64 s | 225.3 µm × 84.5 µm×40 µm |
| tdTomato parasites (550/579–608 nm) | |||||||
| Fibrin vs Matrigel and TgMIC2 KO directionality | 20× | Hoechst 33342 (385/420–449 nm) | 41 x 1 µm | 16ms | 120 | 80 s | 665.6 µm × 249.6 µm×40 µm |
| Force Mapping, WT (Fibrin) | 60× | tdTomato parasites (550/579–608 nm) | 50x0.5 µm | 16ms | 60 | 96 s | 225.3 µm × 84.5 µm×24.5 µm |
| Fibrin (635/666–723 nm) | |||||||
| WT, TgMyoA KO, TgMIC2 KO; Brightfield (Matrigel, fibrin) | 60× | N/A: Brightfield | 21 x 1 µm | 40ms | 360 | 302 s | 225.3 µm × 225.3 µm×20 µm |
| Nuclear size vs constriction (Matrigel) | 20× | Hoechst 33342 (385/420–449 nm) | 41 x 1 µm | 16ms | 60 | 80 s | 665.6 µm × 249.6 µm×40 µm |
| Anti-SAG1 Alexa 548 (550/579–608 nm) | |||||||
| TgMyoA KO Force Map (Fibrin) | 60× | Hoechst 33342 (385/420–449 nm) | 50x0.5 µm | 16ms | 60 | 96 s | 225.3 µm × 84.5 µm×24.5 µm |
| Fibrin (635/666–723 nm) | |||||||
| TgMIC2 KO Force Map (Fibrin) | 60× | YFP cytosol (490/507–530 nm) | 50x0.5 µm | 16ms | 60 | 96 s | 225.3 µm × 84.5 µm×24.5 µm |
| Fibrin (635/666–723 nm) |
Additional files
-
MDAR checklist
- https://cdn.elifesciences.org/articles/85171/elife-85171-mdarchecklist1-v2.docx
-
Source code 1
The source code generates 2D and 3D quiver plots of the FIDVC data showing either all vectors or only those vectors above a background threshold.
- https://cdn.elifesciences.org/articles/85171/elife-85171-code1-v2.zip
Download links
A two-part list of links to download the article, or parts of the article, in various formats.
Downloads (link to download the article as PDF)
Open citations (links to open the citations from this article in various online reference manager services)
Cite this article (links to download the citations from this article in formats compatible with various reference manager tools)
A circular zone of attachment to the extracellular matrix provides directionality to the motility of Toxoplasma gondii in 3D
eLife 11:e85171.
https://doi.org/10.7554/eLife.85171


