Defining basic rules for hardening influenza A virus liquid condensates
- Cell Biology of Viral Infection Lab, Instituto Gulbenkian de Ciência, Portugal
- European Molecular Biology Laboratory, Germany
- Cell Biology of Viral Infection Lab, Universidade Católica Portuguesa, Católica Medical School, Católica Biomedical Research Centre, Portugal
Figures
Figure 1
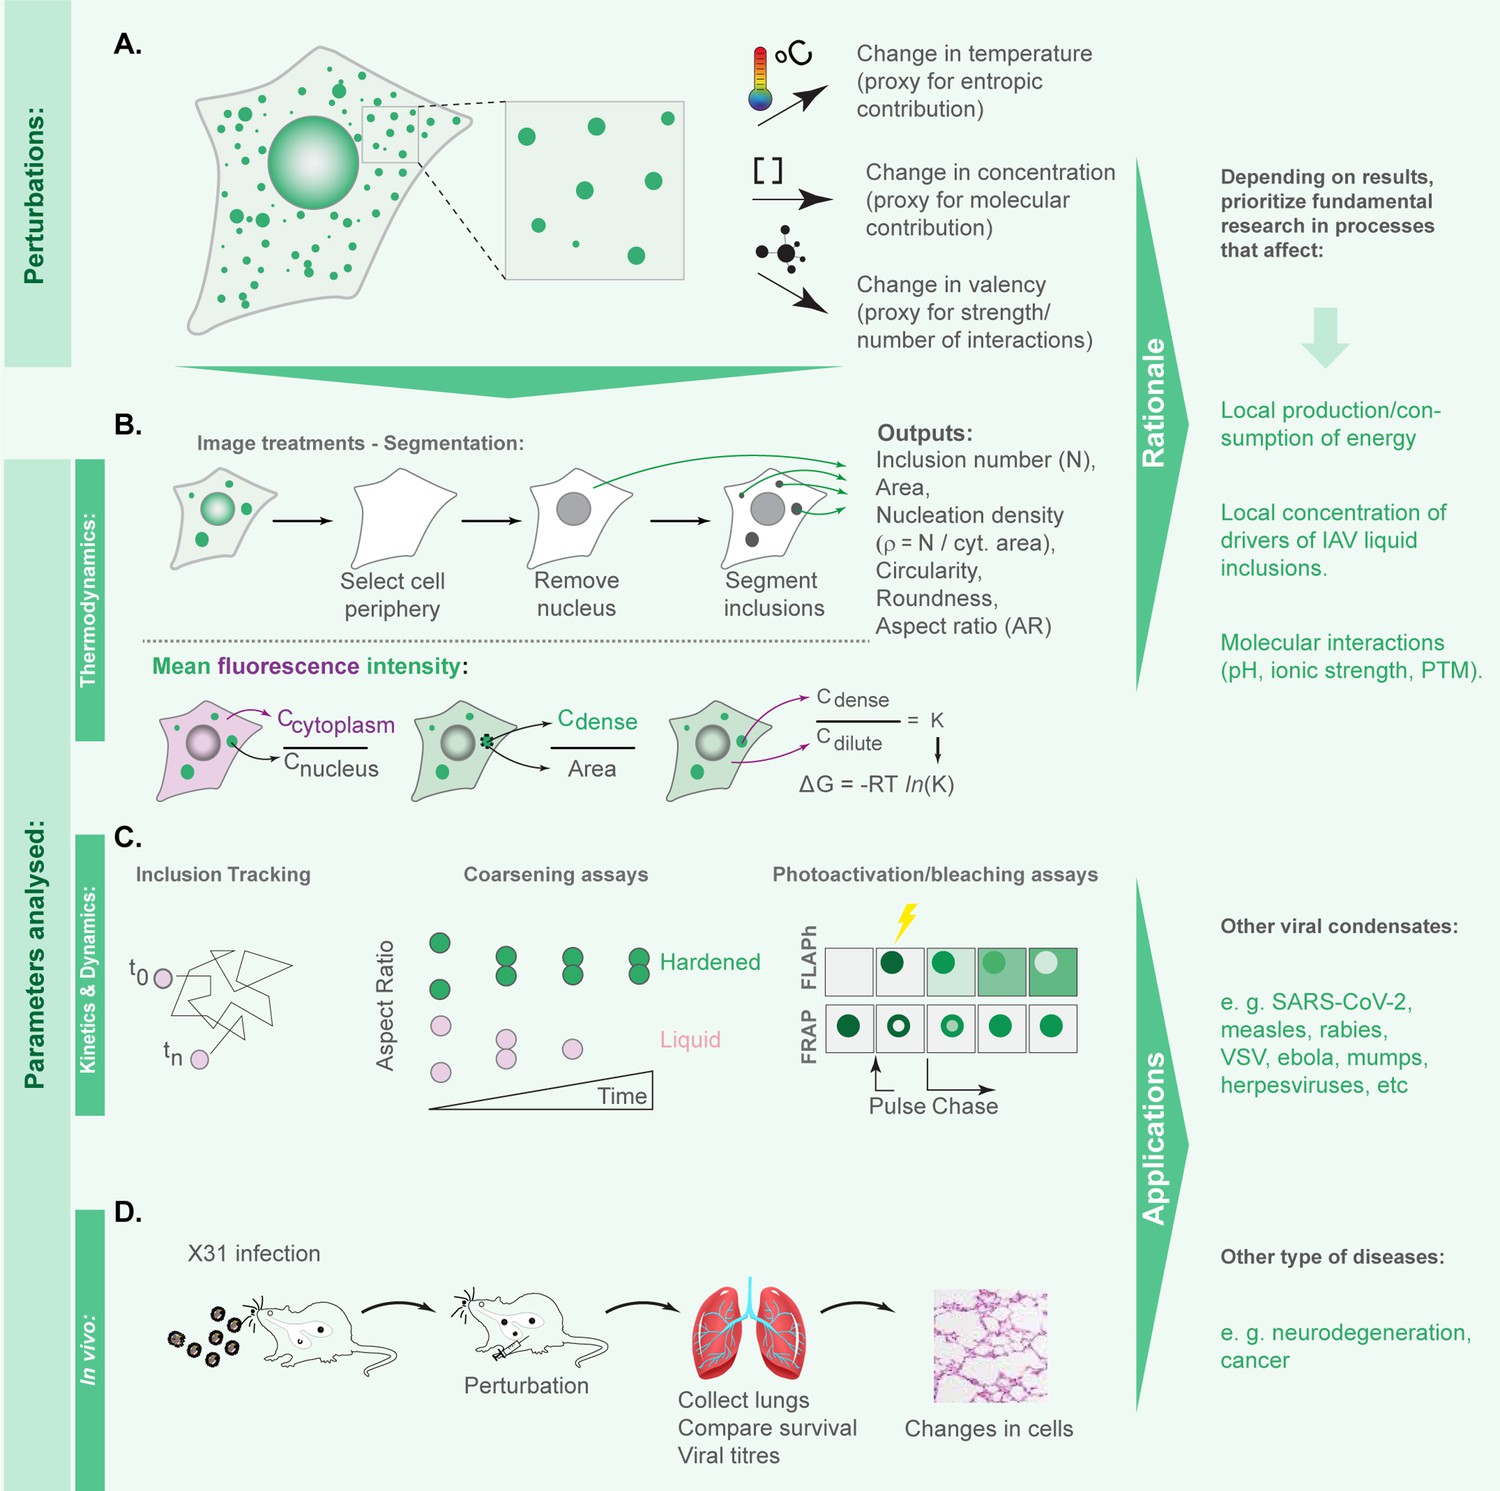
Framework applied in this study to define the hierarchy in effectiveness in hardening influenza A virus (IAV) liquid inclusions or other condensates.
(A) To compare the contributions of entropy, concentration, and valency/strength/type of interactions, we subjected infected cells to the different perturbations: temperature, concentration of viral inclusion drivers (viral ribonucleoproteins [vRNPs] and Ras-related in brain 11a [Rab11a]) and number or strength of interactions between different vRNPs using the well-studied vRNP pharmacological modulator, nucleozin, that increases the number and strength of intersegment interactions. (B) Our aim is to determine which amongst these perturbations impact more dramatically the material properties of viral inclusions and for this we measured number, shape, size, and Gibbs free energy of partition (free energy, ΔG). Methodologically, we segmented circa 20 cells under the different conditions to measure the above-mentioned parameters and the amount of material inside (Cdense) and outside (Cdilute) viral condensates. With this, we calculated the partition coefficient K and extrapolated the ΔG. (C) When ΔG dramatically changed, we assessed how perturbations altered the material properties of IAV inclusions by comparing how fast and how much they moved (using coarsening assays, particle tracking, photobleaching to inspect internal rearrangements, and fluorescence loss after photoactivation [FLAPh]). (D) We also assessed whether the phenotype could be recapitulated in vivo using mice infected with influenza A virus reassortant X31. The overall goal of this framework is to determine, for IAV, how liquid inclusions may be efficiently hardened to prioritise research and development of strategies with that activity. Additionally, the framework may be applied to other systems, including other viruses, for informed decisions on how to harden condensates.
Figure 2 with 1 supplement
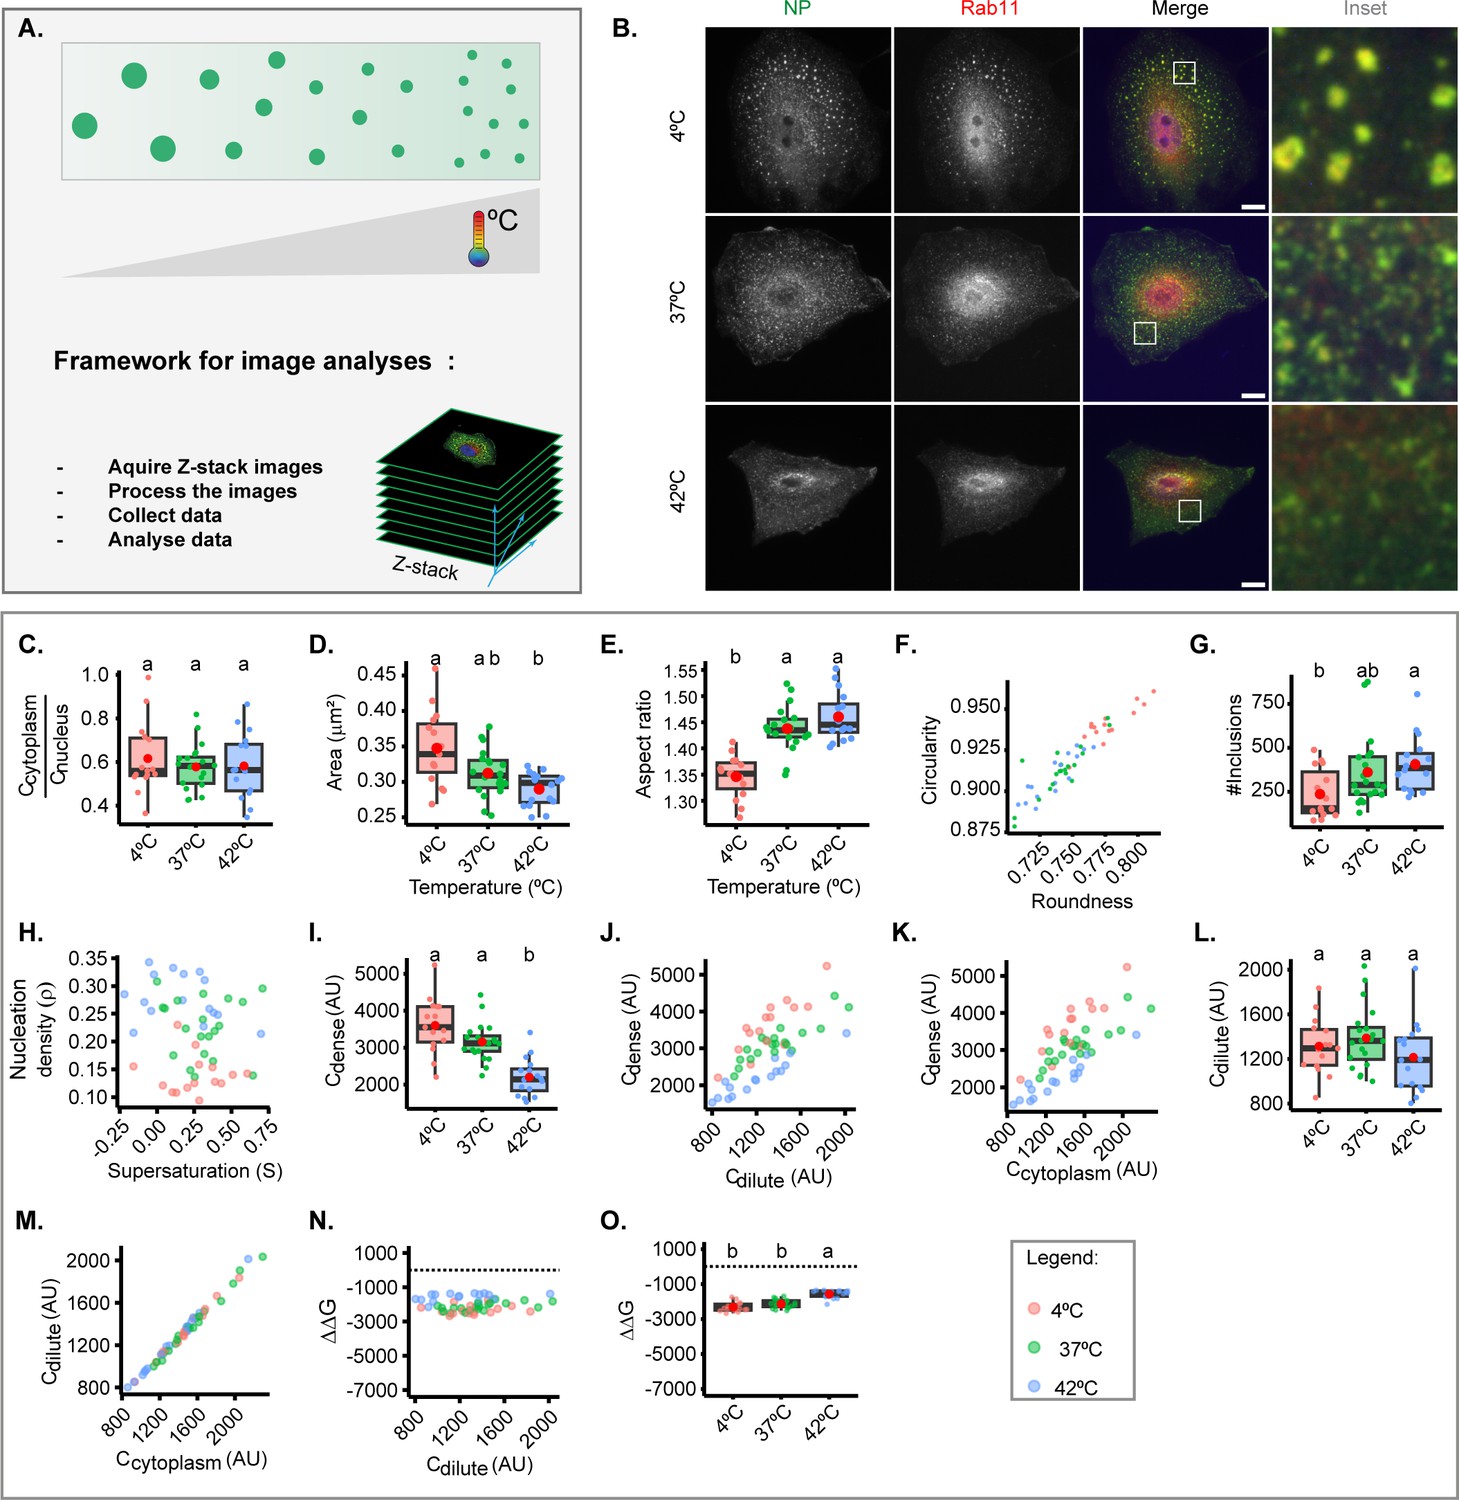
Thermal changes mildly perturb the material properties of inclusions.
A549 were infected at a multiplicity of infection (MOI) of 3 with PR8 virus for 8 hr, incubated at different temperatures (4°C, 37°C, 42°C) for 30 min, fixed, and analysed by immunofluorescence using antibody staining against Rab11 and nucleoprotein (NP) as a proxy for viral ribonucleoprotein (vRNP). The biophysical parameters were extracted from immunofluorescence images (n=15–20), adapting the method published by Riback et al., 2020; Shimobayashi et al., 2021, to determine concentration Cdense as the mean fluorescence intensity of vRNPs in the segmented influenza A virus (IAV) inclusions, while concentration Cdilute was extrapolated from the cytoplasmic vRNP intensity outside the inclusions. Each dot is the average value of a measured parameter within or outside IAV inclusions per cell. Also, size and shape of inclusion were extracted from inclusions after image segmentation. Parameters that were normalised to an infection state without IAV inclusions (3 hr post-infection [hpi]) are indicated by a dashed horizontal line. Above each boxplot, same letters indicate no significant difference between them, while different letters indicate a statistical significance at α=0.05. All data are displayed in Supplementary file 1 (Sheet 1). Abbreviations: AU, arbitrary unit. (A) Representative depiction of the experimental analysis workflow. (B) Representative images of fixed A549 cells infected with PR8 virus showing alterations in viral inclusions at different temperatures. (C). Boxplot depicting the fold change in cytoplasmic to nuclear vRNP concentration; p=0.684 by one-way ANOVA followed by Tukey multiple comparisons of means. (D) Boxplot of mean viral inclusion area (µm2) per cell; p=0.00234 by Kruskal Wallis Bonferroni treatment. (E) Boxplot of aspect ratio of inclusion; p<0.001 by one-way ANOVA followed by Tukey multiple comparisons of means. (F) Scatter plot of inclusions circularity versus roundness. (G) Boxplot showing number of viral inclusions per cell; p<0.001 by one-way ANOVA, followed by Tukey multiple comparisons of means. (H) Scatter plot of nucleation density (ρ = µm–2) versus degree of supersaturation (S=In ), as a measure of propensity to remain dispersed in the cytoplasm. (I) Boxplot of of vRNP concentration within inclusions (Cdense (AU)) p<0.001 by one-way ANOVA, followed by Tukey multiple comparisons of means. (J) Scatter plot of Cdense (AU) versus surrounding cytoplasm (Cdilute, AU). (K) Scatter plot Cdense (AU) versus its total cytoplasmic vRNP concentration (Ccytoplasm, AU). (L) Boxplot showing Cdilute (AU); p=0.203 by one-way ANOVA followed by Tukey multiple comparisons of means. (M) Scatter plot of Cdilute (AU) versus Ccytoplasm (AU). (N) Scatter plot of fold change in free energy of partition (ΔΔG, J/mol) where ΔG = -RTInK, and K = (), and ΔΔG = ΔG – ΔG3 hpi, versus Cdilute (AU). (O) Boxplot of ΔΔG (J/mol); p<0.001 by one-way ANOVA followed by Tukey multiple comparisons of means.
Figure 2—figure supplement 1

Validation of method analysing thermodynamics parameters.
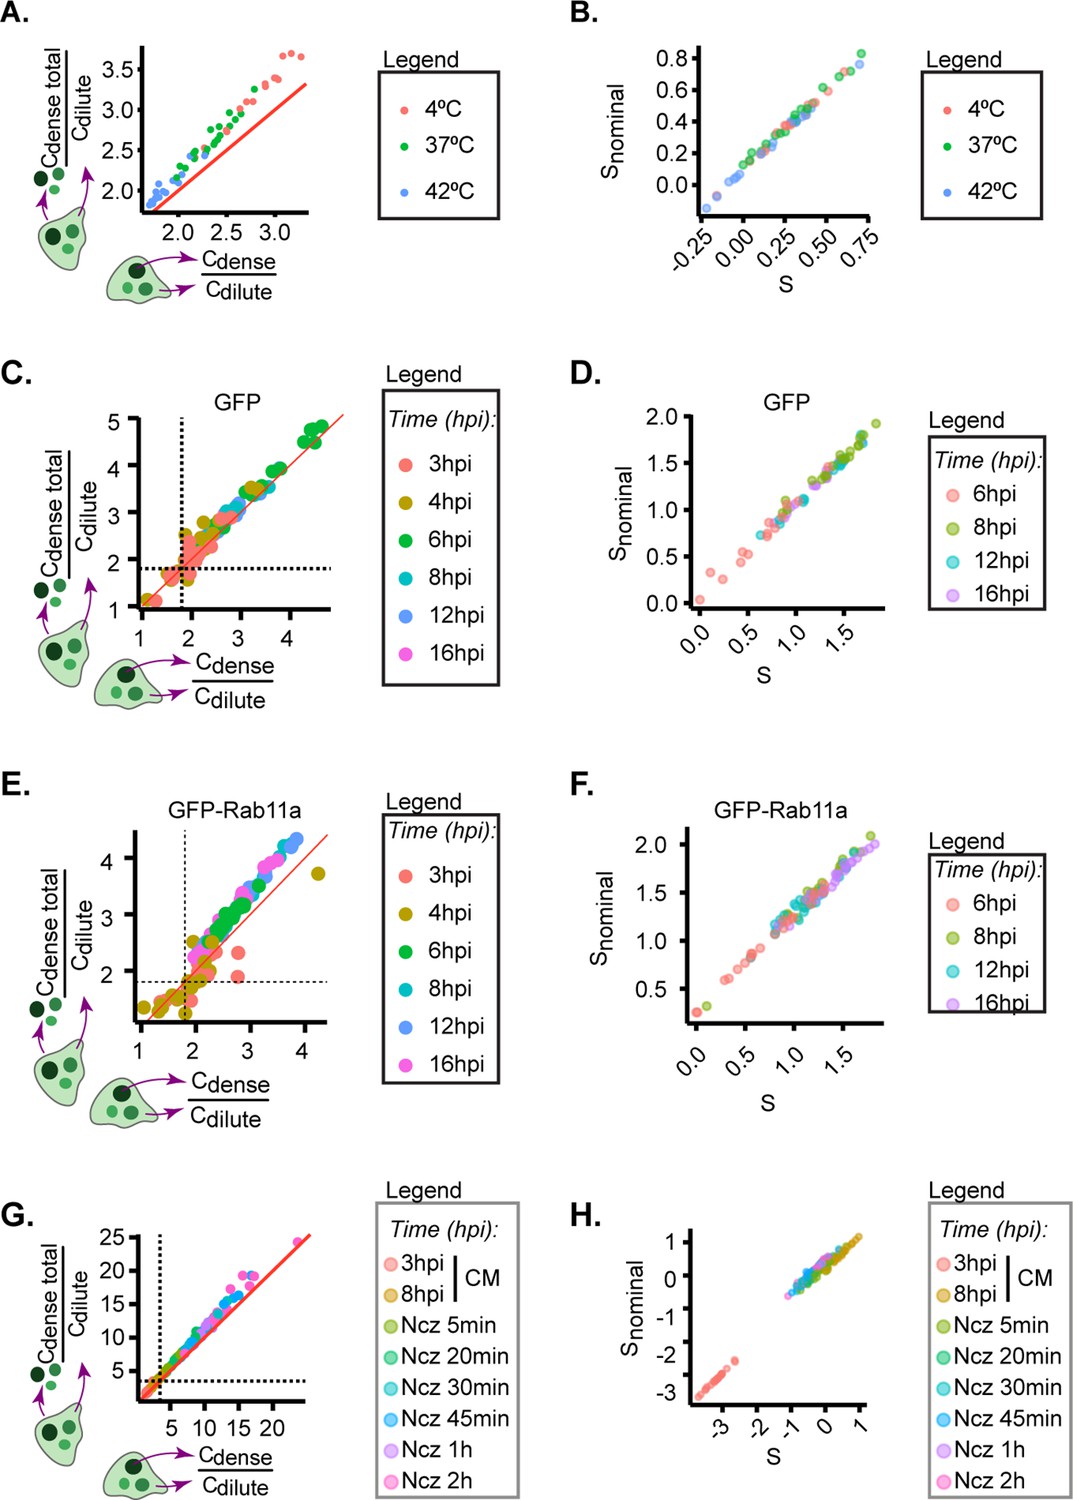
A549 cells expressing (A–D, G–H) endogenous levels of Ras-related in brain 11a (Rab11a) or (E–F) overexpressing Rab11a were infected at an MOI of 3 with PR8 virus for (A–B, G–H) 8 hr before incubating the cells at the indicated (A–B) temperatures, (G–H) nucleozin (Ncz) residence time, or (C–F) at the indicated timepoints. After this, the cells were fixed, and analysed by immunofluorescence using antibody against nucleoprotein (NP) (as a proxy for viral ribonucleoproteins [vRNPs]). Each dot is the average value of measured parameter within or outside influenza A virus (IAV) inclusions per cell. (Number of cells (n)=14-25). (A, C, E, G) are the scatterplots comparing image segmentation strategies to calculate partition coefficient and extrapolate the free energy (see Materials and methods) while (B,D,F,H) is a scatter plot comparing methods for calculating the degree of supersaturation.
Figure 3 with 2 supplements
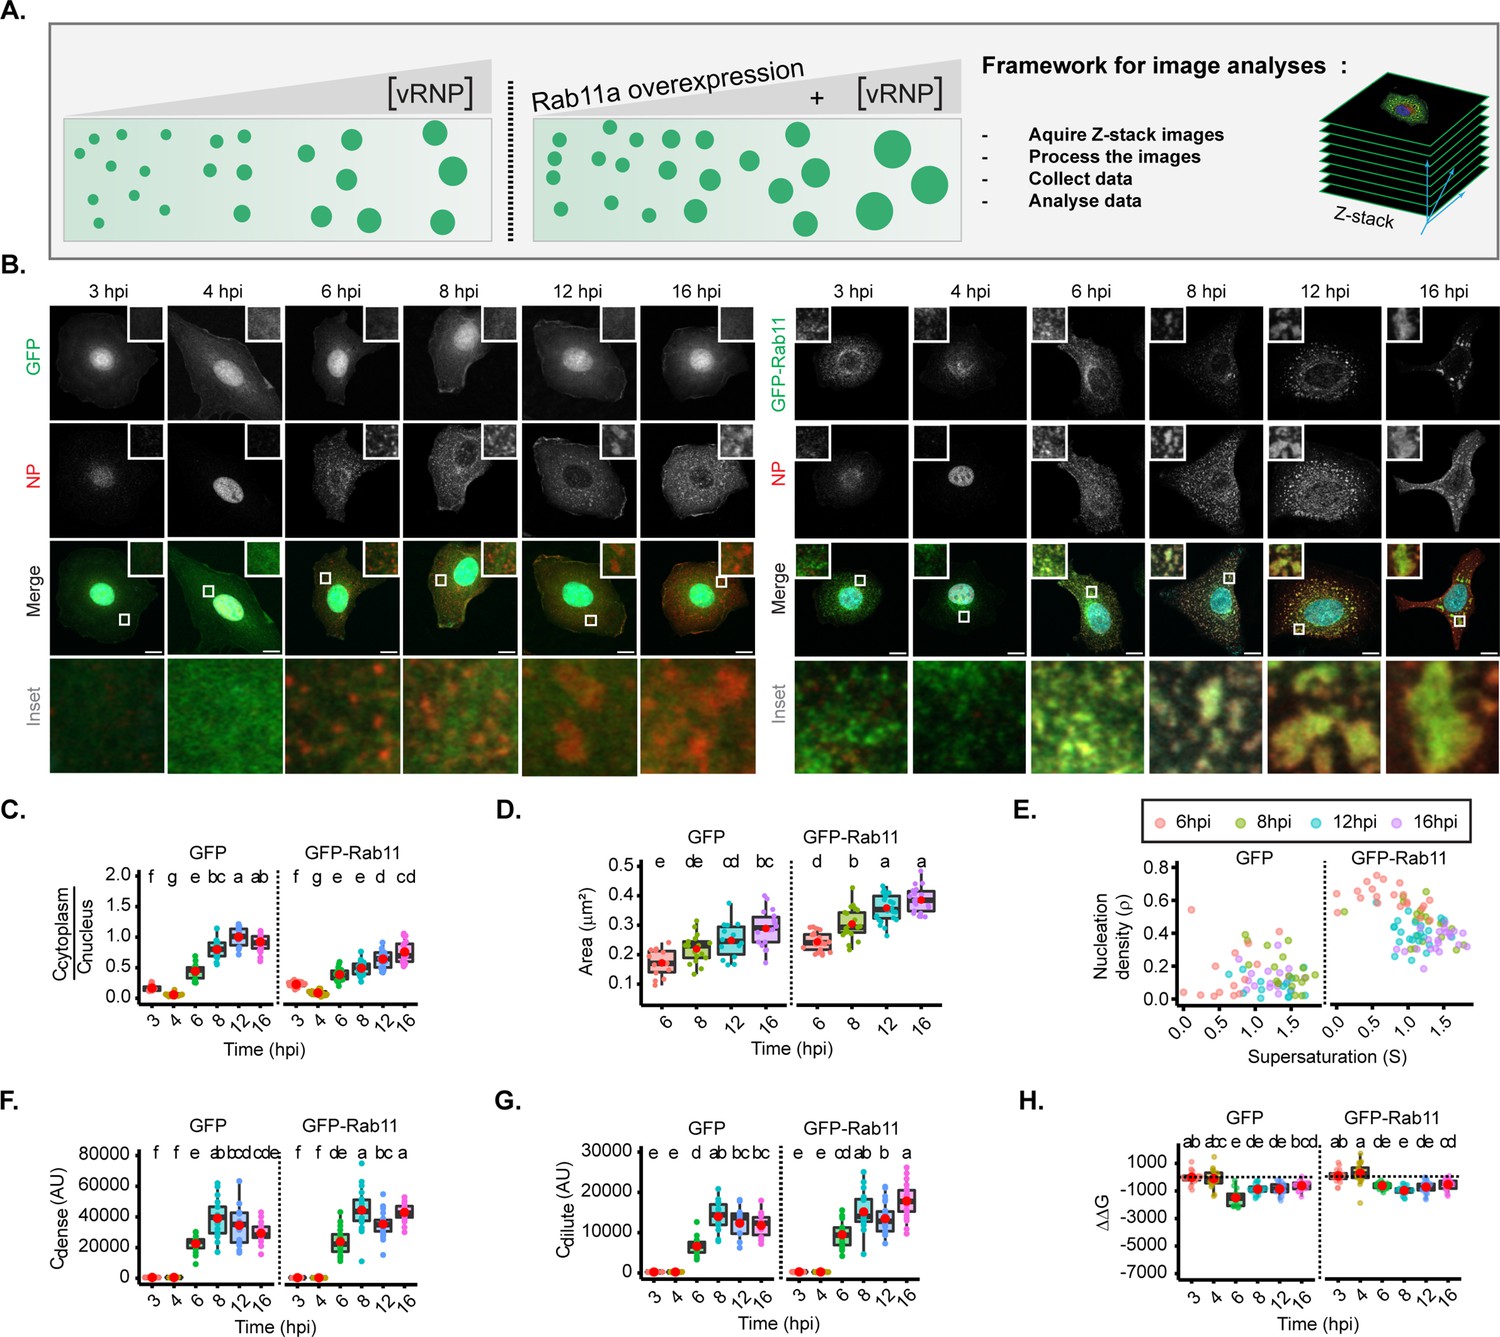
Changes in concentration of viral ribonucleoproteins (vRNPs) and Ras-related in brain 11a (Rab11a) modestly alter the material properties of viral inclusions.
(A–H) A549 cells stably expressing GFP, or GFP-Rab11a-WT were infected at an MOI of 3 with PR8 virus and, at the indicated timepoints, were fixed, and analysed by immunofluorescence using an antibody against nucleoprotein (NP) (as a proxy for vRNPs). (Number of cells (n)=14–18 for GFP and 19–25 for GFP-Rab11-WT). (C–H) Each dot is the average value of measured parameters per cell. Above each boxplot, same letters indicate no significant difference between them, while different letters indicate a statistical significance at α=0.05 using one-way ANOVA, followed by Tukey multiple comparisons of means for parametric analysis, or Kruskal Wallis Bonferroni treatment for non-parametric analysis. All thermodynamic related values are displayed in Supplementary file 1 (Sheets 2 and 3). Abbreviations: AU, arbitrary unit. (A) Representative depiction of the experimental analysis workflow. (B) Immunofluorescence images of infected cells at different hours post-infection (hpi) in cells overexpressing GFP (left) or GFP-Rab11 (right) (both in green); NP (red, as a proxy of vRNPs), and nucleus (blue). Scale bar = 10 µm. (C) Boxplot depicting the fold change in the ratio of cytoplasmic to nuclear vRNPs concentration at different times of infection, with endogenous or overexpressed Rab11a; p<0.001; Kruskal Wallis Bonferroni treatment. (D) Boxplot of mean inclusion area (µm2) per cell; p<0.001 by one-way ANOVA, followed by Tukey multiple comparisons of means. (E) Scatter plot showing nucleation density (ρ, µm–2) versus degree of supersaturation (S). (F) Boxplot of Cdense (AU); p<0.001 by Kruskal Wallis Bonferroni treatment. (G) Boxplot of Cdilute (AU); p<0.001 by Kruskal Wallis Bonferroni treatment. (H) Boxplot of ΔΔG (J/mol); p<0.001 by Kruskal Wallis Bonferroni treatment. Conditions were normalised to an infection state without IAV inclusions (3 hpi) that is indicated by the dashed black line.
Figure 3—figure supplement 1

Validation of method analysing thermodynamics parameters.
A549 cells expressing (A–D, G–H) endogenous levels of Ras-related in brain 11a (Rab11a) or (E–F) overexpressing Rab11a were infected at an MOI of 3 with PR8 virus for (A–B, G–H) 8 hr before incubating the cells at the indicated (A–B) temperatures, (G–H) nucleozin (Ncz) residence time, or (C–F) at the indicated timepoints. After this, the cells were fixed, and analysed by immunofluorescence using antibody against nucleoprotein (NP) (as a proxy for viral ribonucleoproteins [vRNPs]). Each dot is the average value of measured parameter within or outside influenza A virus (IAV) inclusions per cell. (Number of cells (n)=14-25) (A, C, E, G) are the scatter plots comparing image segmentation strategies to calculate partition coefficient and extrapolate the free energy (see Materials and methods) while (B,D,F,H) is a scatter plot comparing methods for calculating the degree of supersaturation.
Figure 3—figure supplement 2
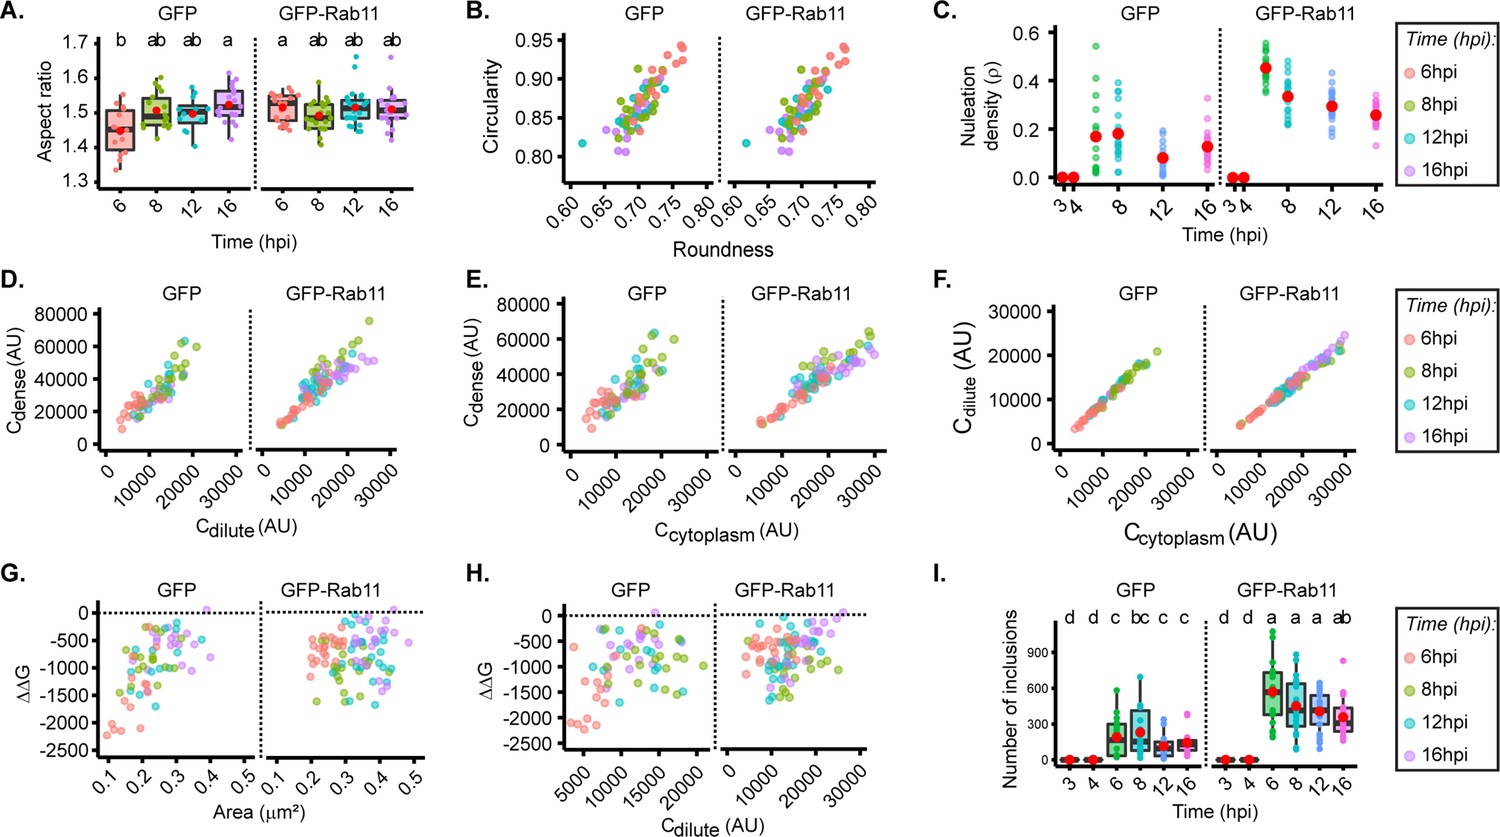
Change in viral ribonucleoprotein (vRNP) and Ras-related in brain 11a (Rab11a) concentration modestly alter inclusions properties.
(A–H) A549 cells stably expressing GFP, or Rab11a-WT, as indicated, were infected at an MOI of 3 with PR8 virus and, at the indicated timepoints, were fixed, and analysed by immunofluorescence using antibody against nucleoprotein (NP) (as a proxy for vRNPs). The cytoplasmic vRNP concentration increases with time of infection (hr post-infection [hpi]) and was used as a proxy for cytoplasmic vRNP concentration changes. Each dot is the average value of measured parameter within or outside influenza A virus (IAV) inclusions per cell. (Number of cells (n)=14-18 for GFP and 19-25 for GFP-Rab11-WT). Above each boxplot, same letters indicate no significant difference between them, while different letters indicate a statistical significance at α=0.05 using one-way ANOVA, followed by Tukey multiple comparisons of means for parametric analysis, or Kruskal Wallis Bonferroni treatment for non-parametric analysis. Abbreviations: AU, arbitrary unit. (A) Boxplot of inclusion aspect ratio at different hpi. p=0.033422; Kruskal Wallis Bonferroni treatment. (B) Scatter plot of inclusion circularity versus roundness at different time post-infection (hpi). (C) Dot plot and model depicting nucleation density (ρ, µm–2) over time of infection (hpi). p=0.001; Kruskal Wallis Bonferroni treatment. (D) Scatter plot of Cdense (AU) versus Cdilute (AU) at different hpi. (E) Scatter plot of Cdense (AU) and Ccytoplasm (AU). (F) Scatter plot of Cdilute (AU) versus Ccytoplasm (AU) with time of infection. (G–H) Conditions were normalised to an infection state without IAV inclusions (3 hpi) that is indicated by the dashed black line. (G) Scatter plot of ΔΔG (J/mol) relative to 3 hpi versus area of inclusion. (H) Scatter plot of ΔΔG versus Cdilute (AU) with time of IAV infection. (I) Boxplot of inclusion number per cell at different hpi. p=0.001; Kruskal Wallis Bonferroni treatment.
Figure 4 with 2 supplements
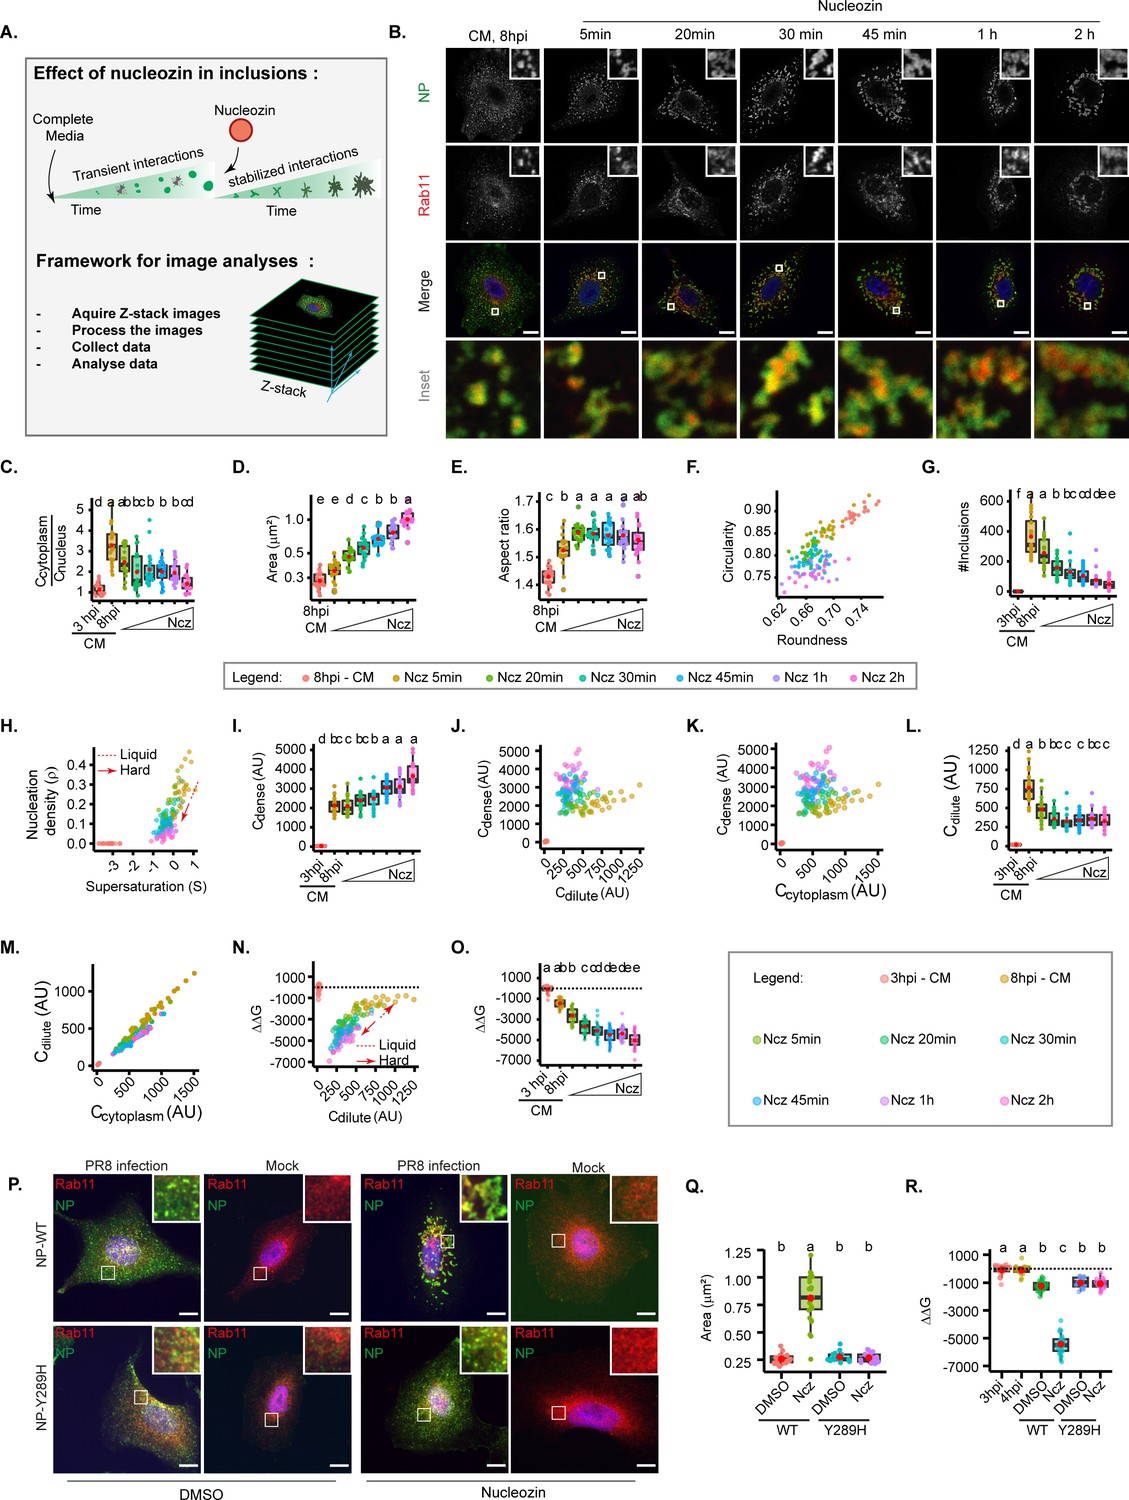
Increasing interaction number and strength stabilises influenza A virus (IAV) inclusions.
A549 cells were infected at an MOI of 3 with PR8 virus for 8 hr, then incubated with 5 µM of nucleozin (Ncz), a viral ribonucleoprotein (vRNP) pharmacological modulator, for different time periods from 5 min to 2 hr, before fixing. Cells were processed for immunofluorescence analysis, using antibodies against nucleoprotein (NP) and Ras-related in brain 11a (Rab11a) (n=20–21). Each dot is the average value of a measured parameter per cell. Conditions normalised to an infection state without IAV inclusions (3 hr post-infection [hpi]) are indicated by a dashed black horizontal line. Above each boxplot, same letters indicate no significant difference between them, while different letters indicate a statistical significance at α=0.05 using one-way ANOVA, followed by Tukey multiple comparisons of means for parametric analysis, or Kruskal Wallis Bonferroni treatment for non-parametric analysis. All the values calculated for the thermodynamics parameters have been included as Supplementary file 1 (Sheet 4). Abbreviations: AU, arbitrary unit, CM, complete media, and Ncz, nucleozin. (A) Representative depiction of the experimental and analysis workflow. (B) Representative images of infected A549 cells subjected (or not) to increasing periods of Ncz treatment. NP (green), Rab11a (red), and nucleus (blue). Scale bar = 10 µm. (C) Boxplot depicting the fold change in the ratio of cytoplasmic to nuclear vRNPs concentration before and after Ncz treatment at 8 hpi; p=6.16e-14 by Kruskal Wallis Bonferroni treatment. (D) Boxplot of mean inclusion area per cell; p<0.001 by Kruskal Wallis Bonferroni treatment. (E) Boxplot of inclusion aspect ratio; p<2e-16 by Kruskal Wallis Bonferroni treatment. (F) Scatter plot of inclusion circularity versus roundness. (G) Boxplot showing the number of inclusions per cell; p<0.001 by Kruskal Wallis Bonferroni treatment. (H) Scatter plot of nucleation density (ρ, µm–2) versus degree of supersaturation (S). (I) Boxplot showing increasing inclusion Cdense (AU) with increasing Ncz incubation period; p<0.001 by Kruskal Wallis Bonferroni treatment. (J) Scatter plot of Cdense (AU) versus Cdilute (AU). (K) Scatter plot of Cdense (AU) and Ccytoplasm (AU). (L) Boxplot showing Cdilute (AU); p<0.001 by Kruskal Wallis Bonferroni treatment. (M) Scatter plot of Cdilute (AU) versus Ccytoplasm (AU). (N) Scatter plot of ΔΔG, J/mol versus Cdilute. (O) Boxplot of fold change in free energy of partition (ΔΔG, cal/mol); p<0.001; Kruskal Wallis Bonferroni treatment. (P) Representative images of A549 cells infected and mock infected with PR8 containing NP-WT and NP-Y289H treated and untreated with nucleozin for 1 hr (n=17–22). Scale bar = 10 µm. (Q) Boxplot of mean inclusion area per cell, per treatment p<0.001 by Kruskal Wallis Bonferroni treatment. (R) Boxplot of fold change in free energy of partition (ΔΔG, cal/mol) of viral inclusions arising in A549 cells infected and mock infected with PR8 containing NP-WT and NP-Y289H; p<0.001; Kruskal Wallis Bonferroni treatment.
Figure 4—figure supplement 1
Validation of method analysing thermodynamics parameters.
A549 cells expressing (A–D, G–H) endogenous levels of Ras-related in brain 11a (Rab11a) or (E–F) overexpressing Rab11a were infected at an MOI of 3 with PR8 virus for (A–B, G–H) 8 hr before incubating the cells at the indicated (A–B) temperatures, (G–H) nucleozin (Ncz) residence time, or (C–F) at the indicated timepoints. After this, the cells were fixed, and analysed by immunofluorescence using antibody against nucleoprotein (NP) (as a proxy for viral ribonucleoprotein [vRNPs]). Each dot is the average value of measured parameter within or outside influenza A virus (IAV) inclusions per cell. (Number of cells (n)=14-25). (A, C, E, G) are the scatterplots comparing image segmentation strategies to calculate partition coefficient and extrapolate the free energy (see Materials and methods) while (B,D,F,H) is a scatter plot comparing methods for calculating the degree of supersaturation.
Figure 4—figure supplement 2
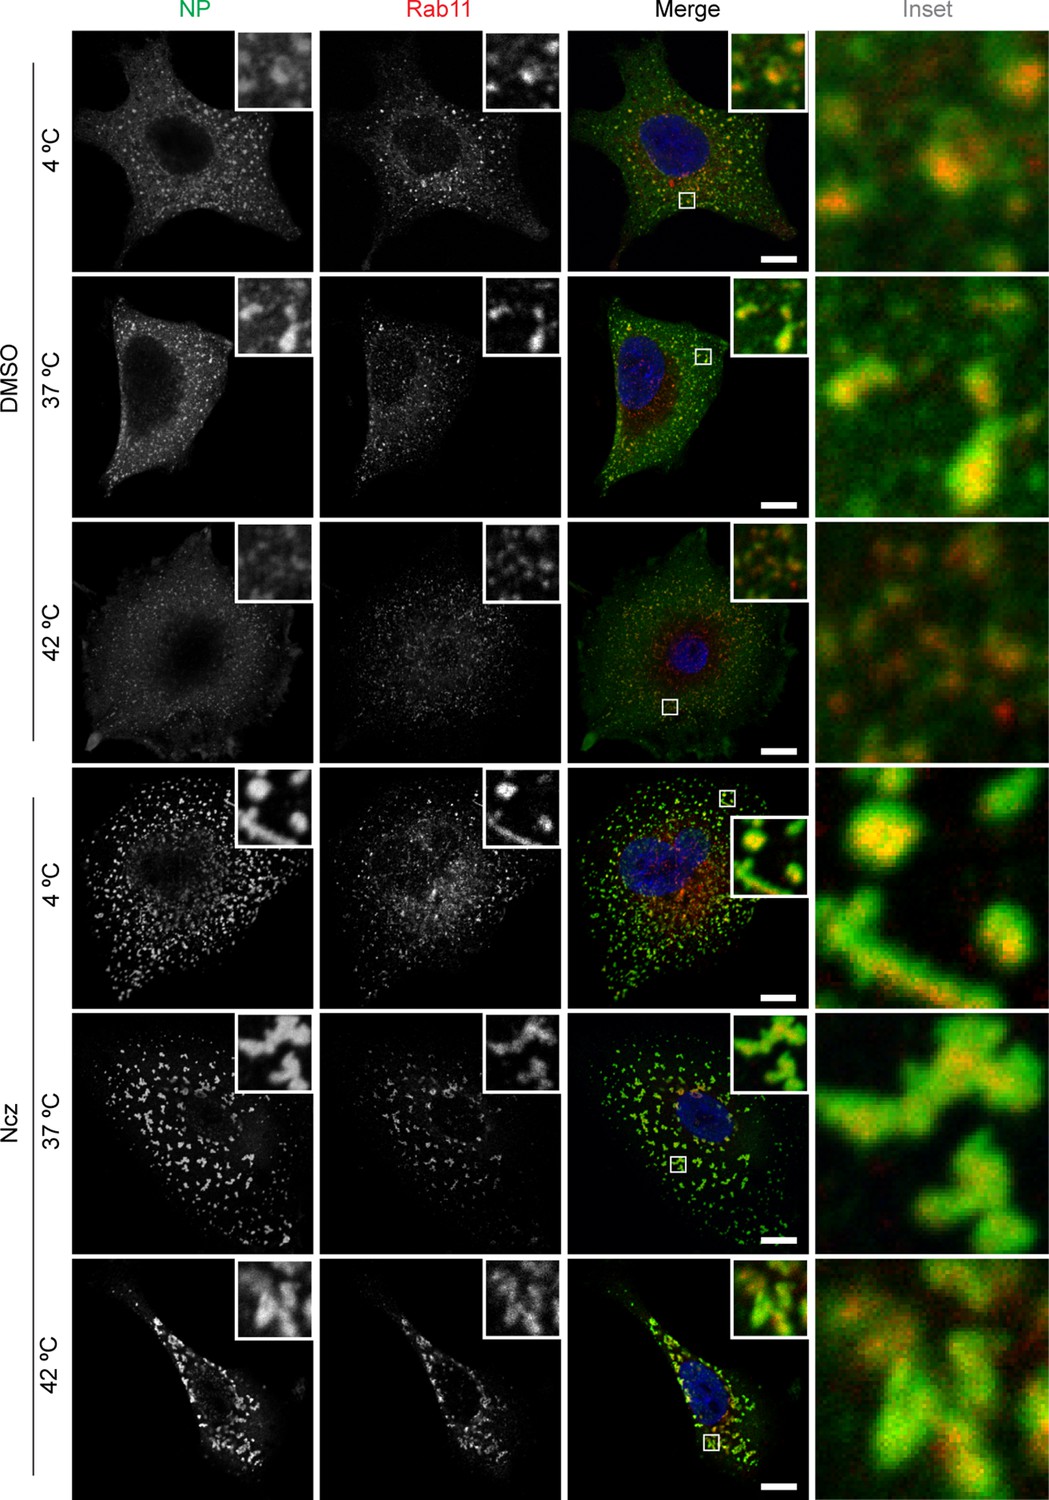
Hardened inclusions are thermally stable.
A459 cells were infected with PR8 at an MOI of 3. At 7.5 hr post-infection (hpi) the infected cells were treated with 5 µM nucleozin (Ncz) or dimethyl sulfoxide (DMSO) for 30 min at 37°C before being subjected to thermal stress at 4°C, 37°C, and 42°C for 20 min and fixed for immunofluorescence analysis by staining with antibody against nucleoprotein (NP) (green), Ras-related in brain 11a (Rab11) (red), and nucleus (blue). Biological replicate = 3. (Representative images of 20-21 cells (n)). Scale bar = 10 µm.
Figure 5 with 12 supplements
Changes in concentration of viral ribonucleoproteins (vRNPs) and Ras-related in brain 11a (Rab11a) modestly alter the material properties of viral inclusions.
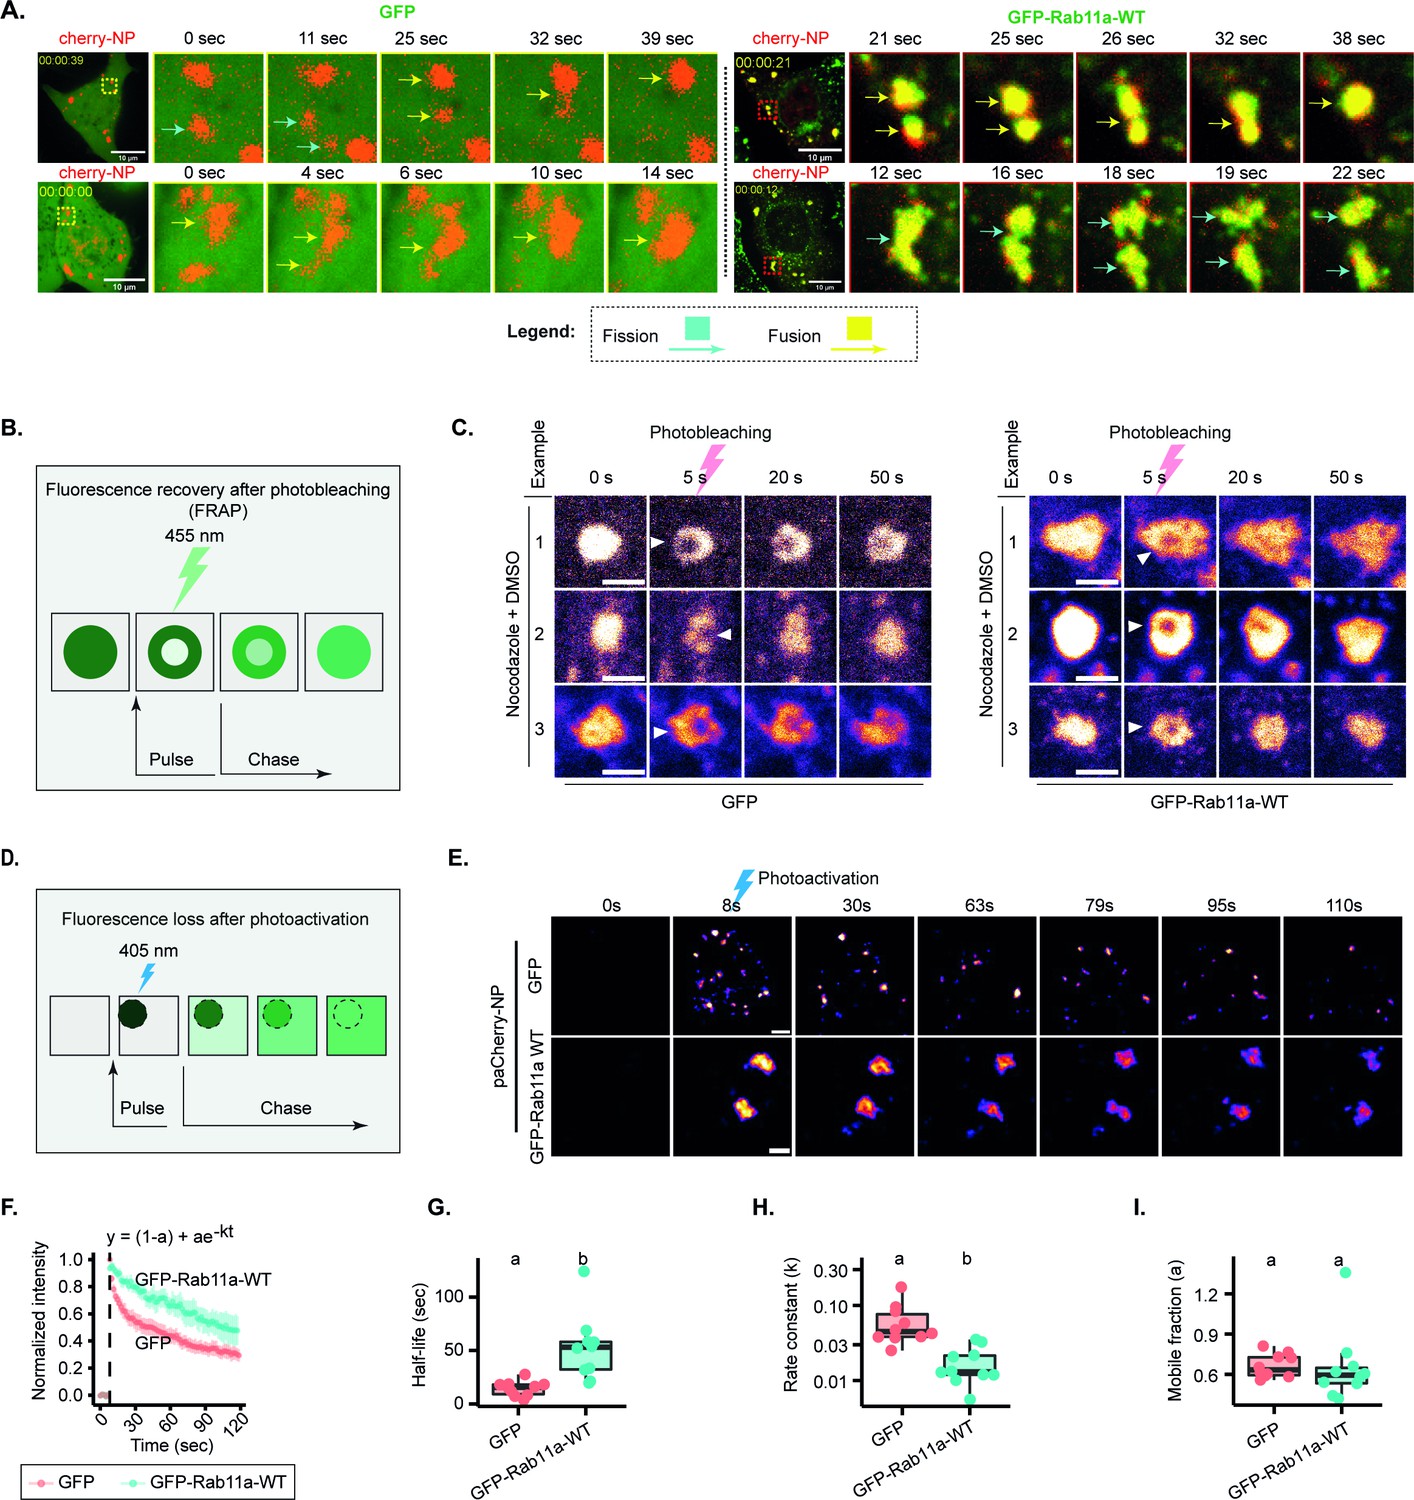
(A–I) A549 cells stably expressing GFP, or Rab11a-WT were transfected with a plasmid encoding mCherry-NP and simultaneously co-infected with PR8 virus at an MOI of 10 and were live imaged at 12–16 hr post-infection (hpi). (Number of cells (n)=10–18 for GFP and GFP-Rab11-WT.) (F–I) Each dot is the average value of measured parameters per cell. Above each boxplot, same letters indicate no significant difference between them, while different letters indicate a statistical significance at α=0.05 using one-way ANOVA, followed by Tukey multiple comparisons of means for parametric analysis, or Kruskal Wallis Bonferroni treatment for non-parametric analysis. All related values are displayed in Supplementary file 1 (Sheet 5). (A) Representative time lapse images of fission (blue arrow) and fusion (yellow arrow) dynamics of viral inclusions in cells with endogenous levels or overexpressing Rab11a (Figure 5—videos 1–4). (B) Schematic depiction of an internal rearrangement of viral inclusion after an ROI within the inclusion is photobleached. (C) At 12 hpi, cells were treated with nocodazole (10 µg/mL) for 2 hr to reduce the highly stochastic motion of liquid influenza A virus (IAV) inclusions in GFP and GFP-Rab11a lines. Small regions inside IAV inclusions were photobleached to assess internal rearrangement of vRNPs (mCherry-NP as proxy). Time lapse pseudo-colour images show internal rearrangements after photobleaching (extracted from Figure 5—videos 5; 6). Scale bar = 2 µm. (D) Schematic of a fluorescence loss after photoactivation (FLAPh) experiment. (E) Time lapse pseudo-colour images showing the fluorescence loss in photoactivated IAV inclusions (photoactivatable paCherry-NP used as proxy) in GFP (n=10) or GFP-Rab11a cell lines (n=10) (extracted from Figure 5—videos 7–12). The analysis is a representative of two biological replicates. Bar = 2 µm. (F) Fluorescence intensity decay of photoactivated (paCherry-NP) normalised to GFP. Coloured lines are single exponential model fitting (y0 = (1-a) + ae-kt) of the data point, dots are the mean of the data per second, and vertical lines denote the standard deviation (SD) per time (s), (Supplementary file 1 (Sheet 5)). (G) Half-life (t1/2 = ) of GFP and GFP-Rab11a developed inclusions decay post-activation (s); p=0.0003 by Kruskal Wallis Bonferroni treatment (Supplementary file 1 (Sheet 5)). (H) Boxplot showing the rate constant, k, of liquid inclusions (using paCherry-NP as proxy) arising in GFP and GFP-Rab11a cell lines; p=0.0003 by Kruskal Wallis Bonferroni treatment (Supplementary file 1 (Sheet 5)). (I) Boxplot showing the immobile fractions from FLAPh experiment calculated by the formula y0 = (1-a) + ae-kt, where 1-a is the immobile fraction arising from GFP and GFP-Rab11a cell lines; p=0.898 by Kruskal Wallis Bonferroni treatment (Supplementary file 1 (Sheet 5)).
Figure 5—video 1
Fusion and fission dynamics of influenza A virus (IAV) inclusions with endogenous Ras-related in brain 11a (Rab11a).
A549 cells expressing endogenous Rab11a were PR8 infected and co-transfected with cherry-NP for 16 hr and subsequently monitored for inclusion fusion and fission events by live imaging. Videos were acquired at the speed of 1 s/frame.
Figure 5—video 2
Fission dynamics of influenza A virus (IAV) inclusions with endogenous Ras-related in brain 11a (Rab11a).
A549 cells expressing endogenous Rab11a were PR8 infected and co-transfected with cherry-NP for 16 hr and subsequently monitored for inclusion fission events by live imaging that are highlighted. Videos were acquired at the speed of 1 s/frame.
Figure 5—video 3
Fusion dynamics of influenza A virus (IAV) inclusions overexpressing Ras-related in brain 11a (Rab11a).
Cell lines overexpressing Rab11a-WT were PR8 infected and co-transfected with cherry-NP for 16 hr, after which fusion events were monitored and highlighted by live imaging. Videos were acquired at the speed of 1 s/frame.
Figure 5—video 4
Fission dynamics of influenza A virus (IAV) inclusions overexpressing Ras-related in brain 11a (Rab11a).
Cell lines overexpressing Rab11a-WT were PR8 infected and co-transfected with cherry-NP for 16 hr, after which fission events were monitored and highlighted by live imaging.
Figure 5—video 5
Photobleaching and observation of recovery after influenza A virus (IAV) inclusions in GFP stable expressing A549 lines.
GFP A549 stable expressing cell lines were infected with PR8 and co-transfected with cherry-NP, treated with nocodazole (Noc), and subsequently photobleached (488 nm) at a region of interest (ROI) in the centre of an inclusion to follow the internal rearrangement by live imaging. Videos were acquired at the speed of 1 s/frame.
Figure 5—video 6
Photobleaching and observation of recovery after in influenza A virus (IAV) inclusions in GFP-Rab11a stable expressing cell lines.
GFP-Rab11a A549 stable expressing cell lines were infected with PR8 and co-transfected with cherry-NP, treated with nocodazole (Noc), and subsequently photobleached (488 nm) at a region of interest (ROI) in the centre of an inclusion to follow the internal rearrangement by live imaging. Videos were acquired at the speed of 1 s/frame.
Figure 5—video 7
Fluorescence loss after photoactivation (FLAPh) in liquid inclusions showing paCherry-NP.
PR8 infected A549 was co-transfected with GFP and paCherry-NP and treated with dimethyl sulfoxide (DMSO) for posterior photoactivation of viral inclusions (with blue light, 405 nm) at a region of interest (ROI). Fluorescence loss in the ROI was monitored over time as viral ribonucleoproteins (vRNPs) (nucleoprotein [NP], as a proxy) were transferred from the activated zone to the inactivated region. We present three videos a–c, the separate channels for paCherry-NP (Figure 5–video 7), GFP (Figure 5—video 8), the merged video (Figure 5—video 9). Videos were acquired at the speed of 1 s/frame.
Figure 5—video 8
Fluorescence loss after photoactivation (FLAPh) in liquid inclusions showing GFP.
Figure 5—video 9
Fluorescence loss after photoactivation (FLAPh) in liquid inclusions showing the merged channels.
Figure 5—video 10
Fluorescence loss after photoactivation (FLAPh) in liquid inclusions in cells overexpressing Ras-related in brain 11a (Rab11a) showing paCherry-NP.
PR8 infected A549 was co-transfected with GFP-Rab11a and paCherry-NP and treated with dimethyl sulfoxide (DMSO) for posterior photoactivation of viral inclusions (with blue light, 405 nm) at a region of interest (ROI). Fluorescence loss in the ROI was monitored over time as viral ribonucleoproteins (vRNPs) (nucleoprotein [NP], as a proxy) were transferred from the activated zone to the inactivated region. We present three videos a–c, the separate channels for paCherry-NP (Figure 5–video 10), GFP-Rab11a (Figure 5—video 11), the merged video (Figure 5—video 12). Videos were acquired at the speed of 1 s/frame.
Figure 5—video 11
Fluorescence loss after photoactivation (FLAPh) in liquid inclusions in cells overexpressing Ras-related in brain 11a (Rab11a) showing GFP-Rab11a-WT.
Figure 5—video 12
Fluorescence loss after photoactivation (FLAPh) in liquid inclusions in cells overexpressing Ras-related in brain 11a (Rab11a) showing the merged channels.
Figure 6 with 10 supplements
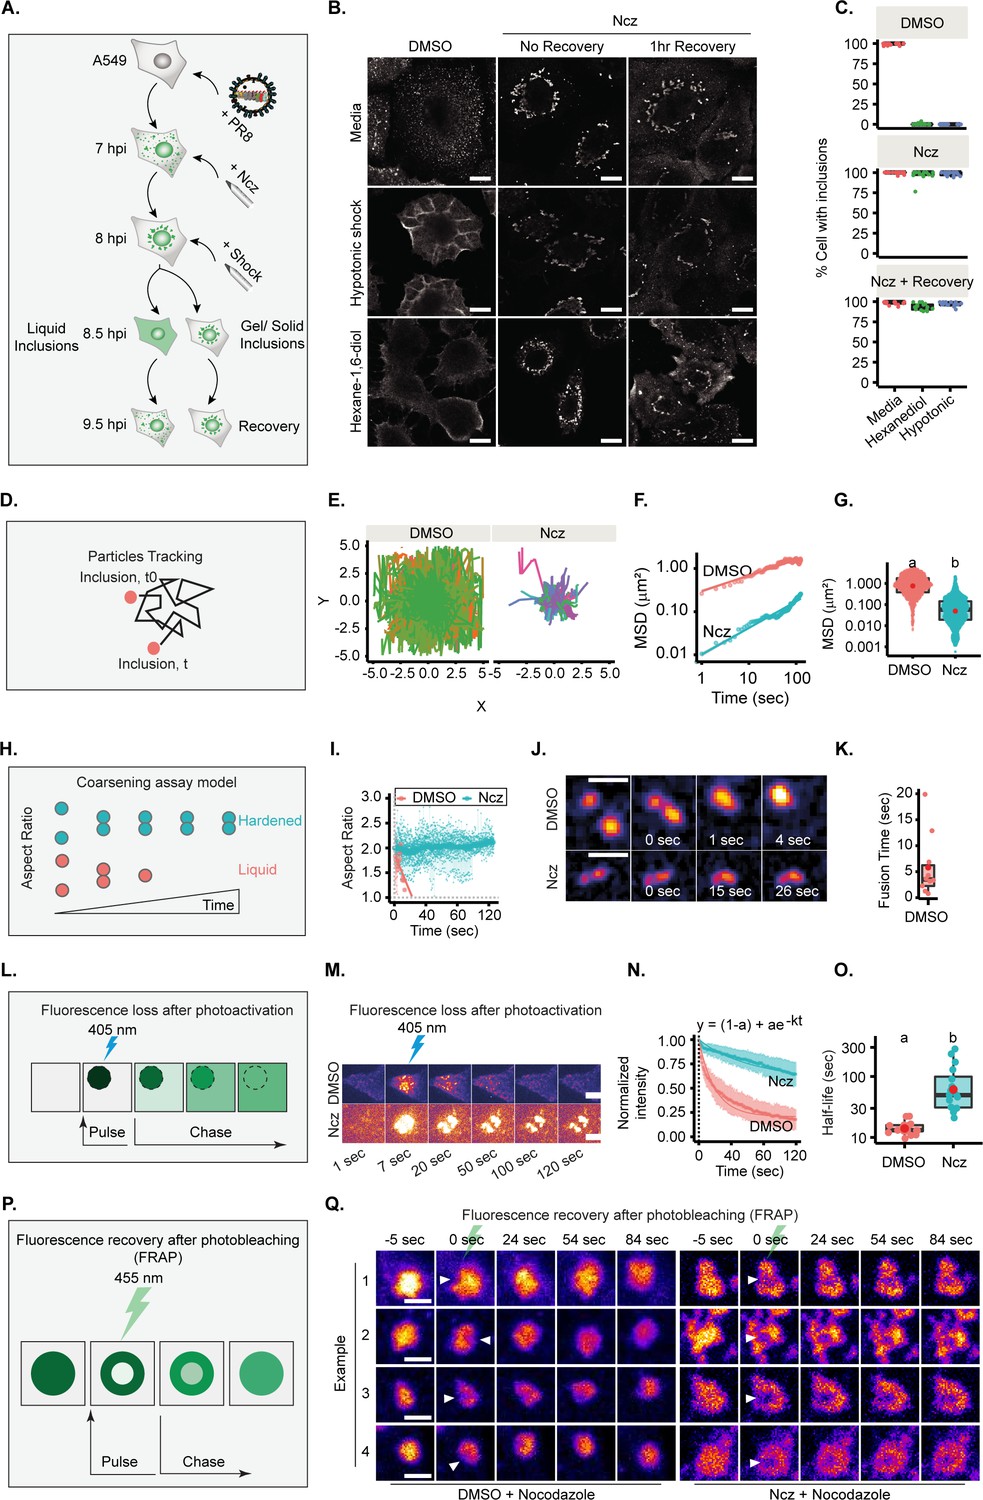
Increasing the strength/type of interactions between viral ribonucleoproteins (vRNPs) changes the material properties of liquid influenza A virus (IAV) inclusions.
(A–C) A549 cells were infected at an MOI of 3 with PR8 virus and treated with 5 µM nucleozin (Ncz) or dimethyl sulfoxide (DMSO) at 7 hr post-infection (hpi). An hour later, cells were treated for 30 min with 80% water (hypotonic shock, Hyp), with 1,6-hexanediol (Hex) or complete media (CM) as control, before allowing recovery from stress treatment in CM for 1 hr. Cells were fixed, stained for NP for analysis by immunofluorescence, and the percentage of cells with IAV inclusions was scored manually. (D–K, P–Q) A549 cells were infected with PR8 virus at an MOI of 10 and simultaneously transfected with plasmids encoding (D–G) GFP-NP, (H–K) mcherry-NP, or (L–O) paGFP-NP and mcherry-NP. Cells were then live imaged after 12 hpi. (A) Experimental schematics of inclusion shock assay. (B) Representative images showing the response of IAV inclusions (nucleoprotein [NP], as proxy) to shock treatments after incubation in Ncz or DMSO. Scale bar = 10 µm. (C) Boxplot showing percentage cells with inclusions, after DMSO or Ncz treatment, by manual scoring; p<0.001 by Kruskal Wallis Bonferroni treatment. Analyses is a representative of three biological replicates. (Number of areas counted =15–17 and number of cells per area counted =39–56, Supplementary file 1 (Sheet 11).) (D) Scheme showing how IAV inclusions were tracked over time. (E) Plot showing inclusion (GFP-NP, as proxy) particle trajectory when treated with DMSO (n=13) or Ncz (n=27). Data analysis was pooled from two biological replicates, Supplementary file 1 (Sheet 6). (F) Graph showing the mean square displacement (µm2) versus time (s) of IAV. (G) Boxplot depicting the resulting mean square displacement (µm2) after 100 s tracking of IAV inclusions; p<0.001 by Kruskal Wallis Bonferroni treatment. (H) Schematics of the coarsening assay model, in which liquid and hardened IAV inclusions are represented by orange and blue dots, respectively. Unlike hardened inclusions, native liquid inclusions would fuse and relax to a spherical droplet. (I) Aspect ratio (AR) was used as a measure of IAV inclusion coalescence into a sphere (analysis is a pool of two biological replicates, n=10 for DMSO and 29 for Ncz). Horizontal grey dash lines depict a perfect sphere (aspect ratio =1). (J) Pseudo-coloured time lapse images of coalescing viral inclusions (GFP-NP used as proxy; extracted from Figure 6—videos 1; 2) in the presence or absence of Ncz. Scale bar = 2 µm. (K) Boxplot of the fusion time (s) of IAV liquid inclusions. Dots represent fusion time of individual fusion event (Supplementary file 1 (Sheet 7)). (L) Schematic of a fluorescence loss after photoactivation (FLAPh) experiment. (M) Time lapse pseudo-colour images showing the fluorescence loss in photoactivated IAV inclusions (photoactivatable GFP-NP used as proxy) upon treatment with Ncz (n=16) or DMSO (n=17) (extracted from Figure 6—videos 3–8). The analysis is a representative of two biological replicates. Bar = 10µm. (N) Fluorescence intensity decay of photoactivated (paGFP-NP) normalised to the corresponding IAV inclusions expressing mcherry-NP. Coloured lines are single exponential model fitting (y0 = (1-a) + ae-kt) of the data point, dots are the mean of the data per second, and vertical lines denote the standard deviation (SD) per time (s), (Supplementary file 1 (Sheet 8)). (O) Half-life (t1/2 = ) of liquid and hardened IAV inclusions decay post-activation (s); p=1.386e-6 by Kruskal Wallis Bonferroni treatment (Supplementary file 1 (Sheet 8)). (P) Schematic depiction of an internal rearrangement of viral inclusion after an ROI within the inclusion is photobleached. (Q) A549 cells were transfected with plasmids encoding mcherry-NP and co-infected with PR8 virus at an MOI of 10. At 12 hr post-infection (hpi), cells were treated with nocodazole (10 µg/mL) for 2 hr to reduce the highly stochastic motion of liquid IAV inclusions and subsequently treated with DMSO or Ncz. Small regions inside IAV inclusions were photobleached to assess internal rearrangement of vRNPs (mCherry-NP as proxy). Time lapse pseudo-colour images show internal rearrangements after photobleaching (extracted from Figure 6—videos 9; 10). Scale bar = 10 µm.
Figure 6—video 1
Coarsening assay in liquid inclusions.
Liquid-like dimethyl sulfoxide (DMSO)-treated inclusions formed in post-infected and GFP-NP co-transfected A549 cells were quantified for their ability to coarsen by live imaging.
Videos were acquired at the speed of 1 s/frame.
Figure 6—video 2
Coarsening assay in hardened inclusions.
Hardened nucleozin-induced inclusions formed in post-infected and GFP-NP co-transfected A549 cells were quantified for their inability to coarsen by live imaging. Videos were acquired at the speed of 1 s/frame.
Figure 6—video 3
Fluorescence loss after photoactivation (FLAPh) in liquid inclusions showing cherry-NP.
PR8 infected A549 was co-transfected with cherry-NP and paGFP-NP and treated with dimethyl sulfoxide (DMSO) for posterior photoactivation of viral inclusions (with blue light, 405 nm) at a region of interest (ROI). Fluorescence loss in the ROI was monitored over time as viral ribonucleoproteins (vRNPs) (nucleoprotein [NP], as a proxy) were transferred from the activated zone to the inactivated region. We present three videos a–d, the separate channels for cherry-NP (Figure 6–video 3), paGFP-NP (Figure 6—video 4), the merged video (Figure 6—video 5). Videos were acquired at the speed of 1 s/frame.
Figure 6—video 4
Fluorescence loss after photoactivation (FLAPh) in liquid inclusions showing paGFP-NP.
Figure 6—video 5
Fluorescence loss after photoactivation (FLAPh) in liquid inclusions showing the merged channels.
Figure 6—video 6
Fluorescence loss after photoactivation (FLAPh) in hardened inclusions showing cherry-NP.
PR8 infected A549 was co-transfected with paGFP-NP and cherry-NP and treated with nucleozin for posterior photoactivation of viral inclusions (with blue light, 405 nm) at a region of interest (ROI). Fluorescence loss in the ROI was monitored over time as viral ribonucleoproteins (vRNPs) (nucleoprotein [NP], as a proxy) were transferred from the activated zone to the inactivated region. We present three videos a–c, the separate channels for cherry-NP (Figure 6–video 6), paGFP-NP (Figure 6—video 7), the merged video (Figure 6—video 8). Videos were acquired at the speed of 1 s/frame.
Figure 6—video 7
Fluorescence loss after photoactivation (FLAPh) in hardened inclusions showing paGFP-NP.
Figure 6—video 8
Fluorescence loss after photoactivation (FLAPh) in hardened inclusions showing the merged channels.
Figure 6—video 9
Photobleaching and observation of recovery after in liquid inclusions.
PR8 infected A549 co-transfected with GFP-NP and cherry-NP were treated with nocodazole (Noc) and subsequently photobleached (488 nm) at a region of interest (ROI) in the centre of an inclusion to follow the internal rearrangement by live imaging. Videos were acquired at the speed of 1 s/frame. Scale bar = 10 µm.
Figure 6—video 10
Photobleaching and observation of recovery in hardened inclusions.
PR8 infected A549 co-transfected with GFP-NP and cherry-NP were treated with both nocodazole and nucleozin and subsequently photobleached (488 nm) at a region of interest (ROI) in the centre of an inclusion to see if internal rearrangement occurred during live imaging. Videos were acquired at the speed of 1 s/frame. Scale bar = 10 µm.
Figure 7
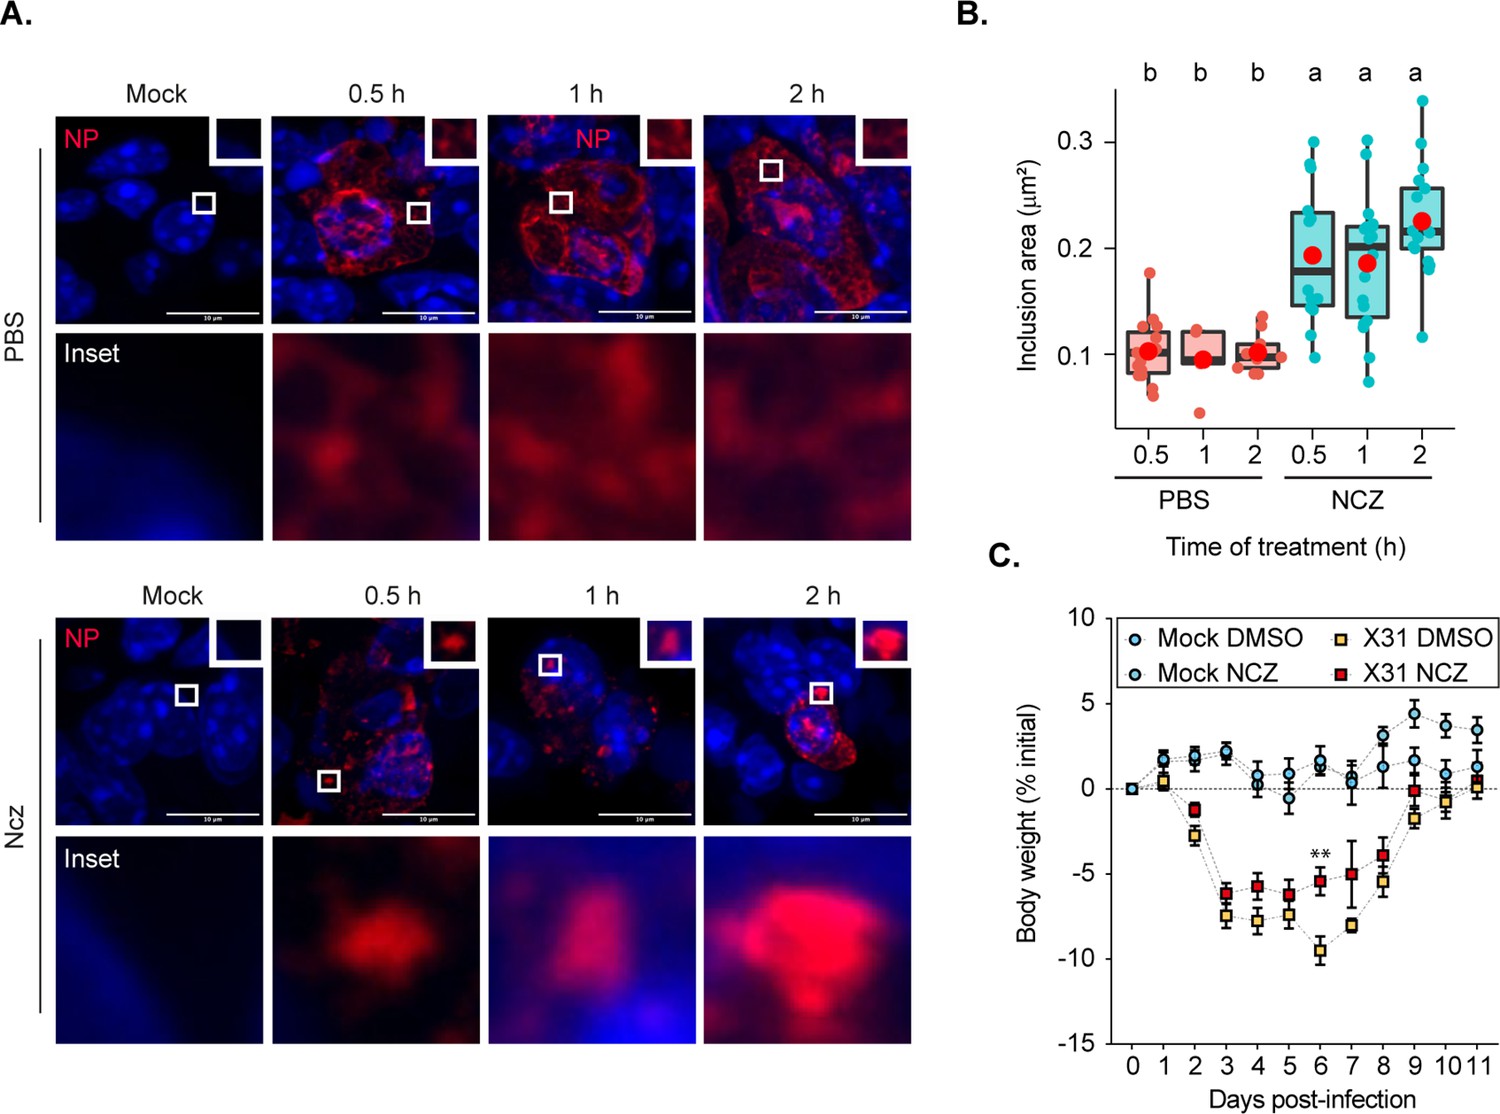
Hardened inclusions emerge in vivo when infected mice are treated with nucleozin.
(A–B) Mice were intranasally infected with 4000 plaque forming units (PFU) of X31 virus, and after 2 days were intranasally administered PBS or 8.3 nmoles/g mice of nucleozin (Ncz) at 30 min, 1 or 2 hr before the collection of the lungs. Data were extracted from inclusions (nucleoprotein [NP], as proxy) from fixed immunofluorescence images of lung tissues (number of cells counted = 446–1694). (A) Representative immunofluorescence images show sections of lung tissue stained for NP (red) and nucleus (blue) after PBS or Ncz treatment. (B) Boxplot showing the mean area (µm2) of inclusions from cells in lung section; p=3.378e-8 by Kruskal Wallis Bonferroni treatment (Supplementary file 1 (Sheet 9)). (C) Mice were pre-treated intraperitoneally with 8.3 nmoles/g mice Ncz or PBS for 1 hr before being intranasally infected with 1000 PFU of X31 virus, injected with a daily dose of Ncz or PBS for 11 days and the weight loss monitored daily. Body weight analysis is from a pool of two biological replicates. The number of mice is, in total, 23 for mock infected mice and 33 for infected mice (Supplementary file 1 (Sheet 10)).
Figure 8 with 6 supplements
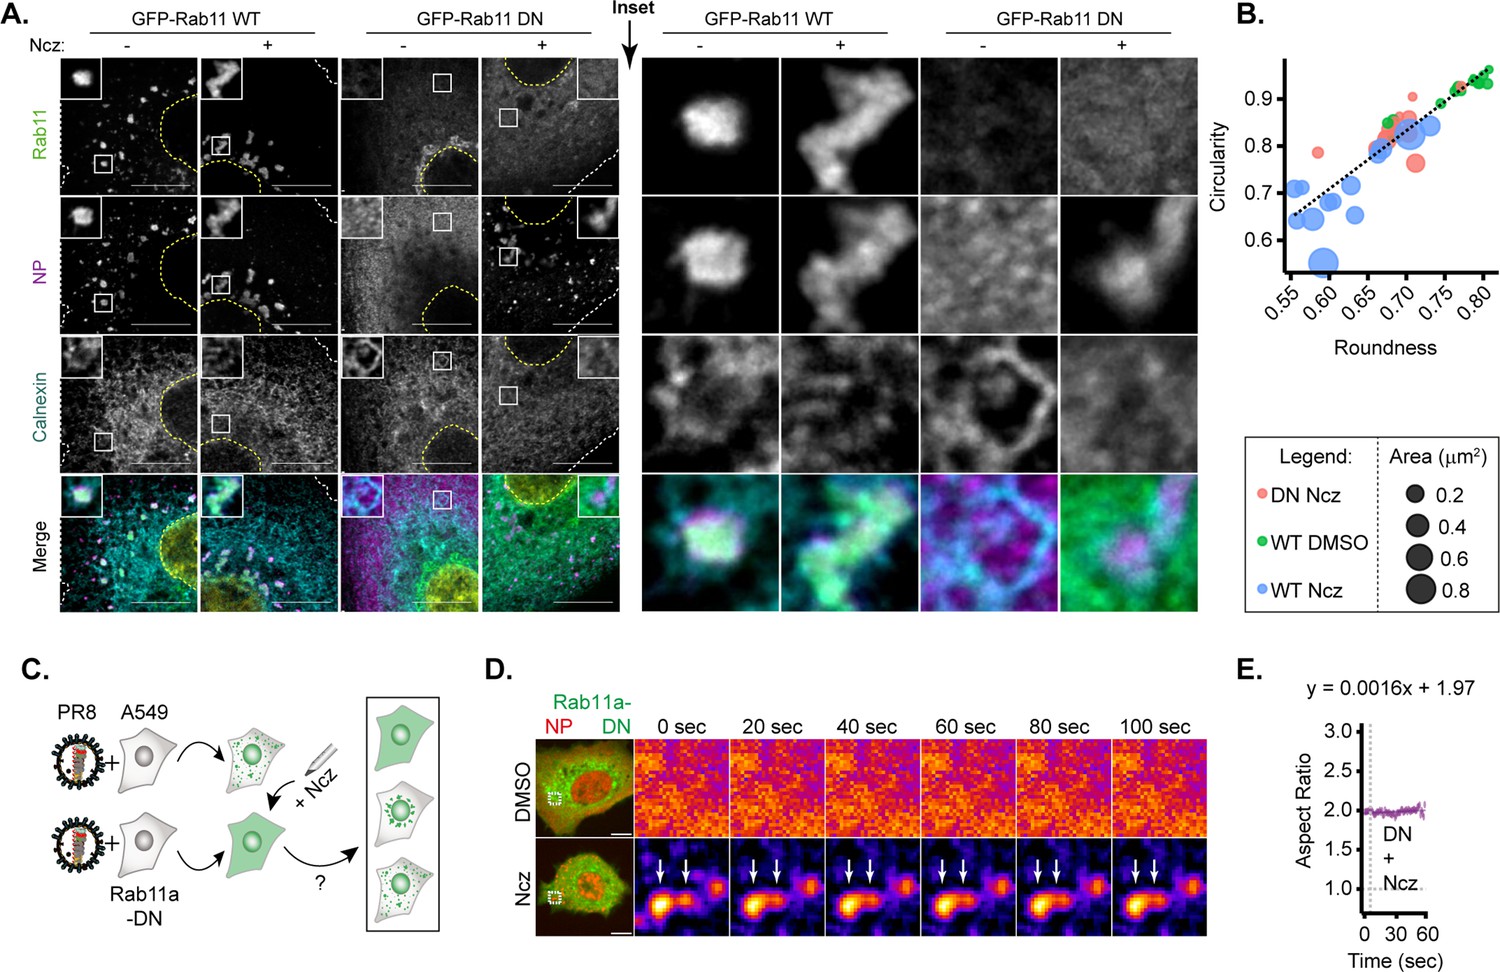
Only hardened inclusions emerge in nucleozin-treated Rab11a-DN cell line.
(A–B) A549 cells constitutively expressing GFP-Rab11a-WT and GFP-Rab11a-DN were infected for 10 hr with PR8 at an MOI of 3 and treated with 5 µM nucleozin (Ncz) (n=10) or dimethyl sulfoxide (DMSO) (n=10) before fixing for analysis by immunofluorescence. The data are a representative analysis from biological duplicates. (A) Representative images of cells analysed by immunofluorescence staining using antibodies against viral protein nucleoprotein (NP) (magenta), host Rab11 (green), and ER (cyan). Nuclei and cell periphery delimited by yellow and white dashed line respectively, and white boxes are insets showing presence or absence of viral inclusions. Scale bar = 10 µm. (B) Scatter plot of circularity versus roundness of viral inclusions. (C–E) A549 cells constitutively expressing GFP-Rab11a-DN were transfected with mcherry-NP and co-infected with PR8 virus at an MOI of 3. At 12 hr post-infection (hpi), the cells were treated with 5 µM Ncz or DMSO for 10 min before imaging. (C) Schematic depicting the possible outcomes when Rab11a-DN cell lines are treated with Ncz. (D) Representative time lapse pseudo-colour images show fusion of IAV inclusions in a coarsening assay of PR8 infected Rab11a-DN cell line treated with Ncz or DMSO (extracted from Figure 8—videos 1–6). (E) Plot depicting the aspect ratio of fusing inclusions over time in infected Rab11a-DN cell line treated with Ncz.
Figure 8—video 1
Coarsening assay of Rab11a-DN cells treated with dimethyl sulfoxide (DMSO) but lacking inclusions showing cherry-NP.
GFP-Rab11a-DN cell lines lacking viral inclusion and coarsening events upon infection and transfection (cherry-NP). We present three videos a–c, the separate channels for cherry-NP (Figure 8–video 1), paGFP-NP (Figure 8—video 2), the merged video (Figure 8—video 3). Videos were acquired at the speed of 1 s/frame.
Figure 8—video 2
Coarsening assay of Rab11a-DN cells treated with dimethyl sulfoxide (DMSO) but lacking inclusions showing paGFP-NP.
Figure 8—video 3
Coarsening assay of Rab11a-DN cells treated with dimethyl sulfoxide (DMSO) but lacking inclusions showing the merged files.
Figure 8—video 4
Coarsening assay of hardened viral inclusions formed by treating Rab11a-DN with nucleozin showing cherry-NP.
GFP-Rab11a-DN cell lines transfected (with cherry-NP) and PR8-infected display a solid-like coarsening behaviour when treated with nucleozin. We present three videos a–c, the separate channels for cherry-NP (Figure 8–video 4), paGFP-NP (Figure 8—video 5), the merged video (Figure 8—video 6). Videos were acquired at the speed of 1 s/frame.
Figure 8—video 5
Coarsening assay of hardened viral inclusions formed by treating Rab11a-DN with nucleozin showing paGFP-NP.
Figure 8—video 6
Coarsening assay of hardened viral inclusions formed by treating Rab11a-DN with nucleozin showing the merged channels.
Figure 9

Hardening of influenza A virus (IAV) inclusions changes its proteome solubility.
(A–E) A549 cells constitutively expressing GFP-Rab11a-WT or GFP-Rab11a-DN were infected for 12 hr with PR8 at an MOI of 5 and treated with 5 µM nucleozin (Ncz) or dimethyl sulfoxide (DMSO) for 1 hr. Thereafter, cells were lysed in mild (NP40) or strong detergent (SDS), while NP40 lysate was ultracentrifuged (100,000 × g) to pellet materials in condensates from the soluble fraction in the supernatant. Soluble and total host and viral proteome were identified by LC-MS/MS and solubility was determined as the ratio of soluble NP40- to SDS-derived total proteome abundances at the indicated timepoints. Data were from two biological replicates. (A) Schematic representation of solubility proteome profiling (SPP). (B) Volcano plot representing relative host protein abundance in Rab11a-WT and Rab11a-DN infected cell lines (at 12 hr post-infection [hpi]) after treatment with Ncz or DMSO. Differentially upregulated proteins in these conditions (statistical significance – see Materials and methods) are indicated in blue dots. (C) Bar graphic comparing abundances of viral proteins (in log2 scale) in Rab11a-WT and Rab11a-DN cell lines PR8-infected (12 hpi) and treated with either Ncz or DMSO. (D) Volcano plot representing relative solubility of host and viral proteins in Rab11a-WT and Rab11a-DN infected cell lines (at 12 hpi) after treatment with Ncz. Differentially soluble proteins in these conditions (statistical significance – see Materials and methods) are indicated in pink and green dots. (E) Bar graph comparing solubility (in log2 scale) of viral proteins when PR8 infected (12 hpi) Rab11a-WT and Rab11a-DN cell lines were treated with either Ncz or DMSO.
Figure 10
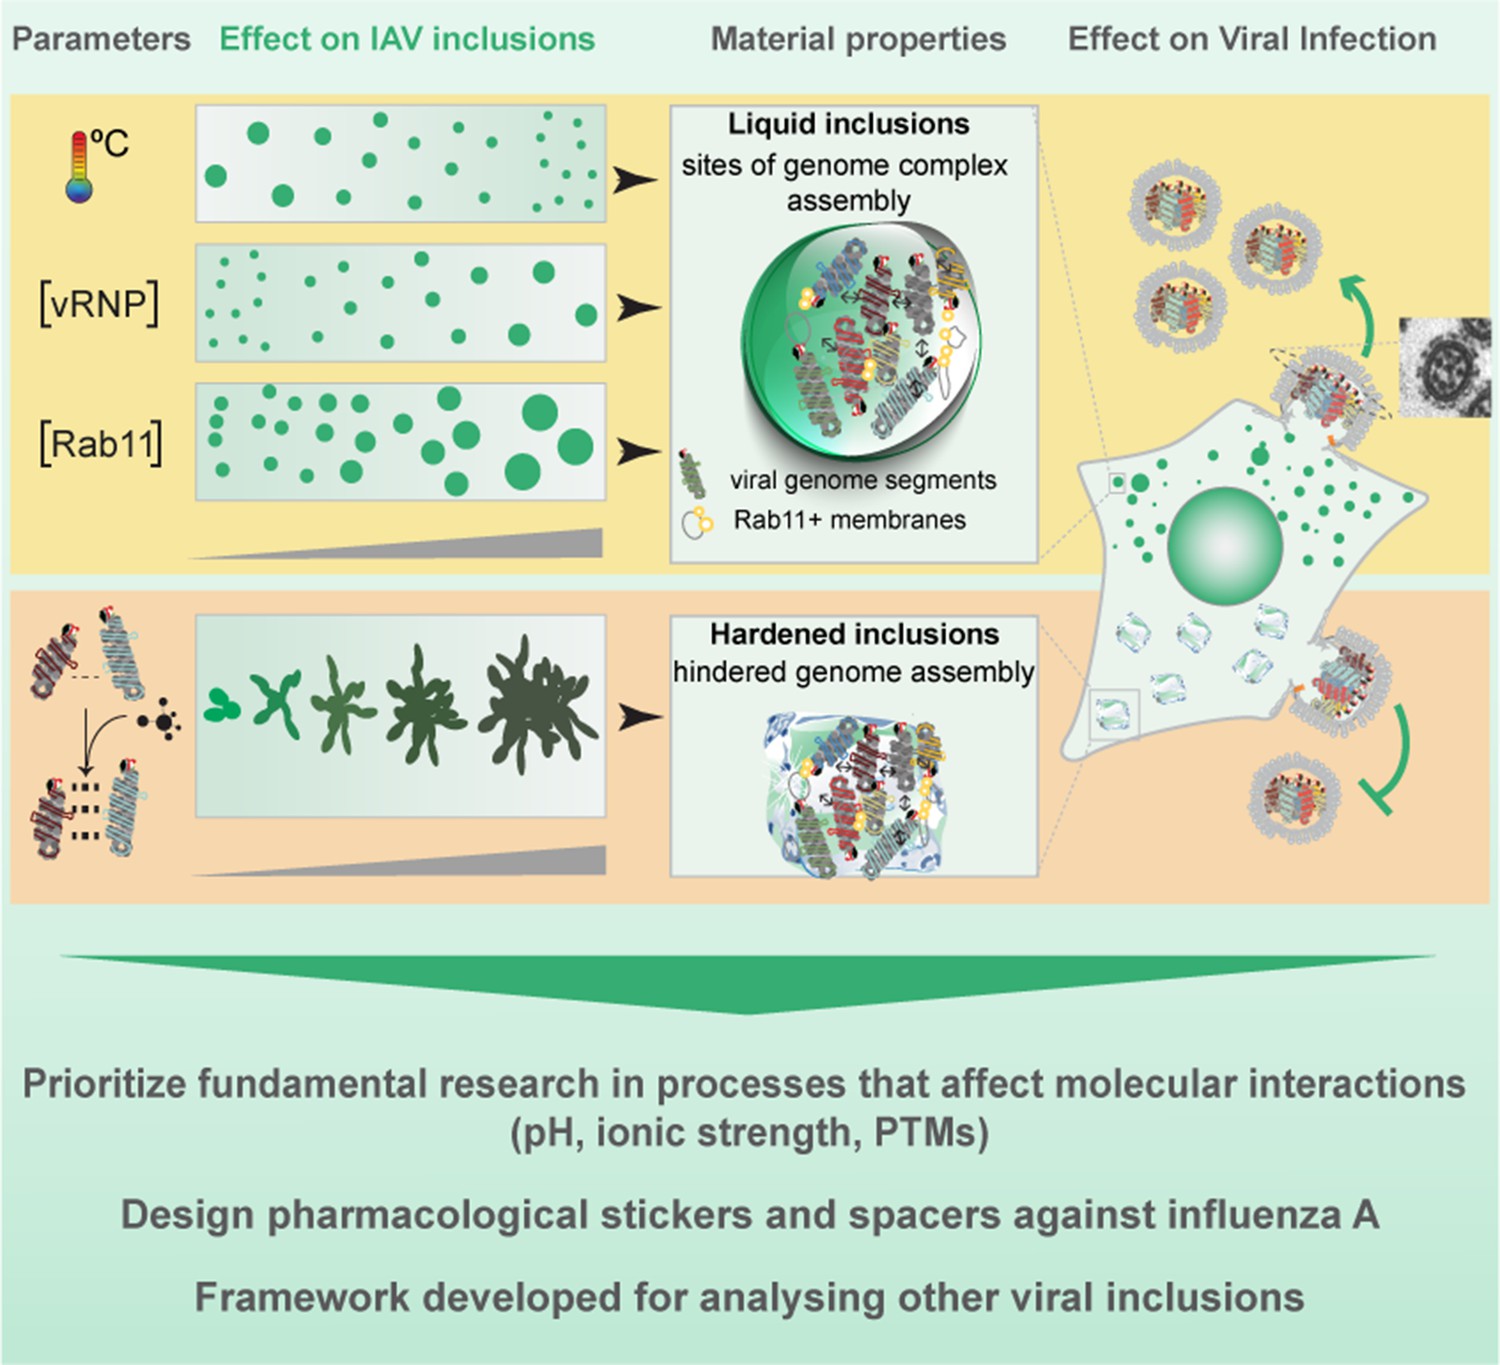
Working model for the strategies to modulate influenza A virus (IAV) liquid inclusions.
Author response image 1
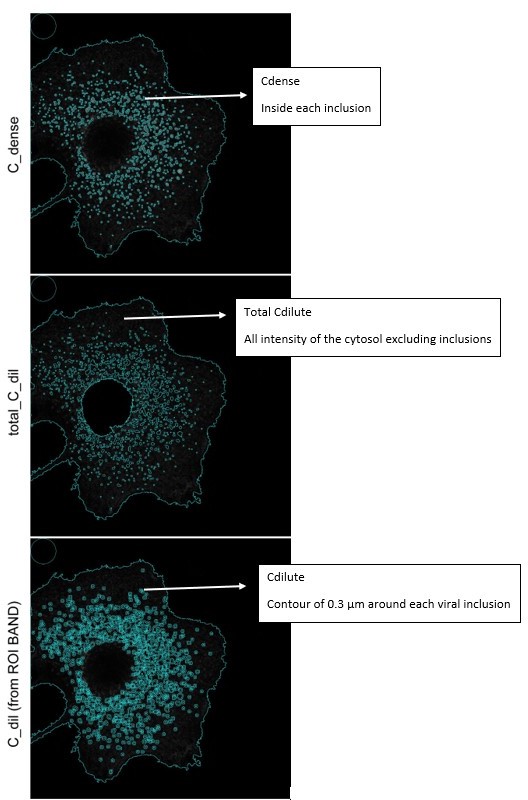
Sample segmentation of viral inclusions and milieu to measure the Cdense and Cdilute respectively.
Tables
Key resources table
| Reagent type (species) or resource | Designation | Source or reference | Identifiers | Additional information |
|---|---|---|---|---|
| Cell line (Homo sapiens) | A549 | ATCC | CCL-185 | Human alvelolar basal cell |
| Cell line (Canis familiaris) | MDCK.1 | ATCC | CRL-2935 | Mardin-Darby canine kidney cell |
| Antibody | Anti-Rab11a (Rabbit polyclonal) | Proteintech | Cat# 15903-1-AP, RRID:AB_2173458 | IF(1:100) |
| Antibody | Anti-Calnexin (Rabbit polyclonal) | Abcam | Cat#22595; RRID:AB_2069006 | IF(1:1000) |
| Antibody | Anti-NP (Mouse monoclonal) | Abcam | Cat#20343; RRID: AB_445525 | IF(1:1000) |
| Recombinant DNA reagent | GFP-NP (plasmid) | Amorim et al., 2011 | N/A | GFP version of NP |
| Recombinant DNA reagent | mCherry-NP (plasmid) | Amorim et al., 2011 | N/A | Cherry version of NP |
| Recombinant DNA reagent | paCherry-NP (plasmid) | This paper | N/A | Cherry photoactivatable version of NP |
| Recombinant DNA reagent | paGFP-NP (plasmid) | This paper | N/A | GFP photoactivatable version of NP |
| Sequence-based reagent | Gipc1_F | This paper | PCR primers | GGGAAAGGACAAAAGGAACCC |
| Sequence-based reagent | Gipc1_R | This paper | PCR primers | CAGGGCATTTGCACCCCATGCC |
| Sequence-based reagent | paGFP_L64F/T65S_Fw | This paper | PCR primers | CCCTCGTGACCACCTTCAGCTACGGCGTGCAGT |
| Sequence-based reagent | paGFP_T203H/A206K_Fw | This paper | PCR primers | GACAACCACTACCTGAGCCACCAGTCCAAGCTGA GCAAAGACCCCAAC |
| Sequence-based reagent | paGFP_V163A_Fw | This paper | PCR primers | GAAGAACGGCATCAAGGCGAACTTCAAGATCCGCC |
| Sequence-based reagent | paCherry_NP_NheI_Fw | This paper | PCR primers | GATCCGCTAGCGGTCGCCACCATGG |
| Sequence-based reagent | paCherry_NP_XhoI_Rv | This paper | PCR primers | GCGCCTCGAGGATCTGAGTCCGGACTTGTA |
| Chemical compound, drug | DMEM, high glucose, pyruvate, no glutamine (Gibco) | Thermo Fisher | Cat# 21969035 | |
| Chemical compound, drug | L-Glutamine | Thermo Fisher | Cat# 25030024 | |
| Chemical compound, drug | OPTIMEM-I W/GLUTAMAX-I (CE) | Thermo Fisher | Cat# 51985026 | |
| Chemical compound, drug | Leibovitz’s L-15 Medium, no phenol red (Gibco) | Life Technologies | Cat# 21083–027 | |
| Chemical compound, drug | Lipofectamine LTX Reagent with PLUS Reagent (Invitrogen) | Thermo Fisher | Cat# 15338100 | |
| Chemical compound, drug | Penicillin-Streptomycin Solution | Biowest | Cat# L0022-100 | |
| Chemical compound, drug | Dimethyl sulfoxide (DMSO) | BioLabs | Cat# B0515A | |
| Chemical compound, drug | Formaldehyde, extra pure, solution 37–41%, AR grade (Fisher Chemical) | Acros | Cat# 10231622 | |
| Chemical compound, drug | Fetal Bovine Serum, qualified, heat inactivated, Brazil (Gibco) | Thermo Fisher | Cat# 10500064 | |
| Chemical compound, drug | Nucleozin | Target Mol | Cat# 282T7330 | |
| Chemical compound, drug | 1,6-Hexanediol | Aldrich | Cat# 240117–50G | |
| Chemical compound, drug | Triton X-100 | Sigma | Cat# X100 | |
| Chemical compound, drug | Dako Faramount Aqueous Mounting Medium | Agilent Technologies | Cat# S3025 | |
| Chemical compound, drug | Complete protease inhibitor cocktail | Merck | Cat# 11836170001 | |
| Chemical compound, drug | PhosphoStop | Merck | Cat# 4906837001 | |
| Chemical compound, drug | RNasin Plus RNase Inhibitor | Promega | Cat# N2615 | |
| Chemical compound, drug | NP-40 | Thermo Fisher Scientific | Cat# FNN0021 | |
| Chemical compound, drug | SDS | NZYTech | Cat# MB01501 | |
| Chemical compound, drug | Benzonase Nuclease HC | Merck | Cat# 71206-3 | |
| Chemical compound, drug | Ethanol | VWR Chemicals | Cat# 20821.330 | |
| Chemical compound, drug | Sequencing Grade Modified Trypsin | Promega | Cat# V5111 | |
| Chemical compound, drug | Lysyl Endopeptidase, Mass Spectrometry | Wako | Cat# 125-05061 | |
| Chemical compound, drug | HEPES | Alfa Aesar | Cat# A14777 | |
| Chemical compound, drug | TMT-16plex reagents | Thermo | Cat# A44522 | |
| Chemical compound, drug | PIERCE BCA protein assay | Thermo | Cat# 23225 | |
| Software, algorithm | FIJI | ImageJ | RRID:SCR_002285 | https://imagej.net/software/fiji/ |
| Software, algorithm | R Project for Statistical Computing | R | RRID:SCR_001905 | https://www.r-project.org/ |
| Software, algorithm | Trackmate plugin | Tinevez et al., 2017; Ershov et al., 2022 | RRID:SCR_002285 | https://imagej.net/plugins/trackmate/ |
| Software, algorithm | limma | Ritchie et al., 2015. | RRID:SCR_010943 | https://bioconductor.org/packages/release/bioc/html/limma.html |
| Software, algorithm | ClusterProfiler (R Bioconductor) | Yu et al., 2012. | RRID:SCR_016884 | https://bioconductor.org/packages/release/bioc/html/clusterProfiler.html |
| Software, algorithm | isobarQuant | Quant | https://doi.org/doi:10.18129/B9.bioc.isobar | https://www.bioconductor.org/packages/release/bioc/html/isobar.html |
| Software, algorithm | Mascot 2.4 (Matrix Science) | Mascot | RRID:SCR_014322 | http://www.matrixscience.com/server.html |
| Other | Hoechst stain | Thermo Fisher Scientific | H3570 | (1 µg/mL) |
Additional files
-
Supplementary file 1
Table with values for all thermodynamic related parameters.
(Sheet 1): Topology, thermodynamics, and material properties of influenza A virus (IAV) inclusions. After PR8 infection (1 MOI), cells were subjected to thermal changes. (Sheets 2–3): Topology, thermodynamics, and material properties of IAV inclusions. After PR8 infection (1 MOI) inclusions were analysed at different hours post-infection (hpi) as viral ribonucleoprotein (vRNP) concentration increases (Sheet 2) or with overexpressed Rab11 (Sheet 3). (Sheet 4): Topology, thermodynamics, and material properties of IAV inclusions. After PR8 infection (1 MOI) inclusions were subjected to nucleozin or dimethyl sulfoxide (DMSO) treatment in WT or the mutant virus NP-Y289H. (Sheet 5): Topology, thermodynamics, and material properties of IAV inclusions. After PR8 infection (1 MOI) inclusions were analysed upon FLAPh in native and overexpressing conditions of Rab11. (Sheets 6–8, 11)1: Topology, thermodynamics, and material properties of IAV inclusions. After PR8 infection (1 MOI) inclusions were subjected to live imaging for inclusion tracking (Sheet 6), fusion dynamics (Sheet 7), and FLAPh (Sheet 8). Assessment of the biophysical traits of inclusions upon DMSO or nucleozin treatment subjected to hexanediol and hypotonic shock treatments is shown in (Sheet 11). (Sheets 9–10): Topology, thermodynamics, and material properties of IAV inclusions. Mice was infected with X31 and treated with PBS or nucleozin for the analysis of number of inclusion and topology in lung slices (Sheet 9) and body weight (Sheet 10).
- https://cdn.elifesciences.org/articles/85182/elife-85182-supp1-v2.xlsx
-
Supplementary file 2
Differential analysis of protein solubility changes before and after nucleozin treatment at 12 hr post-infection in WT and Rab11a-DN cell lines.
PR8-infected Rab11a-WT and Rab11a-DN cells were treated with either dimethyl sulfoxide (DMSO) (vehicle) or 5 µM of nucleozin for 1 hr. The protein solubility changes upon nucleozin (or DMSO) treatment in RAB11a-WT and Rab11a-DN cells is listed in this table.
- https://cdn.elifesciences.org/articles/85182/elife-85182-supp2-v2.xlsx
-
Supplementary file 3
Differential analysis of protein abundance changes before and after nucleozin treatment at 12 hr post-infection in WT and Rab11a-DN cell lines.
- https://cdn.elifesciences.org/articles/85182/elife-85182-supp3-v2.xlsx
-
MDAR checklist
- https://cdn.elifesciences.org/articles/85182/elife-85182-mdarchecklist1-v2.docx
Download links
A two-part list of links to download the article, or parts of the article, in various formats.
Downloads (link to download the article as PDF)
Open citations (links to open the citations from this article in various online reference manager services)
Cite this article (links to download the citations from this article in formats compatible with various reference manager tools)
Defining basic rules for hardening influenza A virus liquid condensates
eLife 12:e85182.
https://doi.org/10.7554/eLife.85182


