The AUX1-AFB1-CNGC14 module establishes a longitudinal root surface pH profile
- Department of Experimental Plant Biology, Faculty of Science, Charles University, Czech Republic
- Institute of Cell and Interaction Biology, Heinrich-Heine-University Düsseldorf, Germany
- Institute of Experimental Botany, Czech Academy of Sciences, Czech Republic
- CEPLAS - Cluster of Excellence on Plant Sciences, Heinrich-Heine-University Düsseldorf, Germany
Figures
Figure 1 with 1 supplement
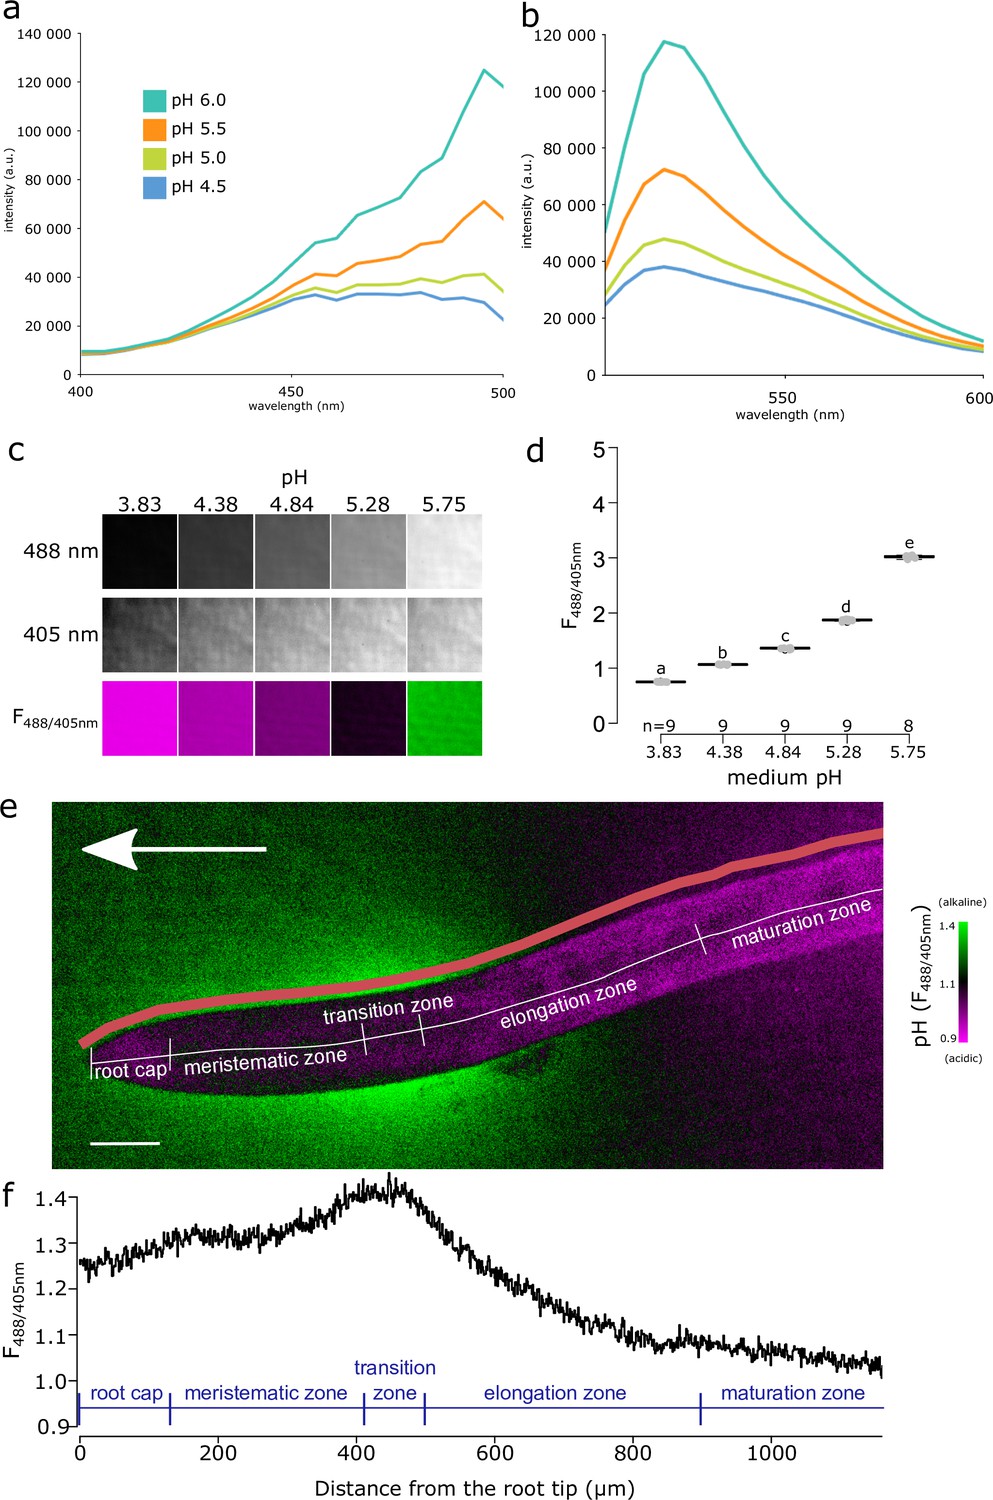
Fluorescein-5-(and-6)-Sulfonic Acid, Trisodium Salt (FS) dye reveals acidic and alkaline domains at the root root surface.
(a, b) The pH dependence of the excitation (a) and emission (b) spectrum of FS in liquid plant growth medium. Excitation spectra were recorded at λEm = 520 nm, emission spectra were excited by λEx = 488 nm. (c) FS fluorescence in solid agar medium at indicated pH values, fluorescence excited by 488 nm, 405 nm and the F488/405 excitation ratio, LUT as in (e). (d) Quantification of the F488/405 excitation ratio in (c). (e) A. thaliana root tip shows the alkaline and acidic surface pH domains, arrow indicates the gravity vector, scale bar = 50 µm. The color of the root itself does reflect pH, as the root itself is not stained by FS (see Figure 1—figure supplement 1f). The pink line shows the region in which F488/405 excitation ratio was plotted in (f). (f) The F488/405 excitation ratio of FS along the longitudinal axis of the root. In (e, f), the typical root zones are depicted for illustration. The source data can be found in Figure 1—source data 1.
-
Figure 1—source data 1
Data used for generating the graphs in the figure.
- https://cdn.elifesciences.org/articles/85193/elife-85193-fig1-data1-v2.xlsx
Figure 1—figure supplement 1
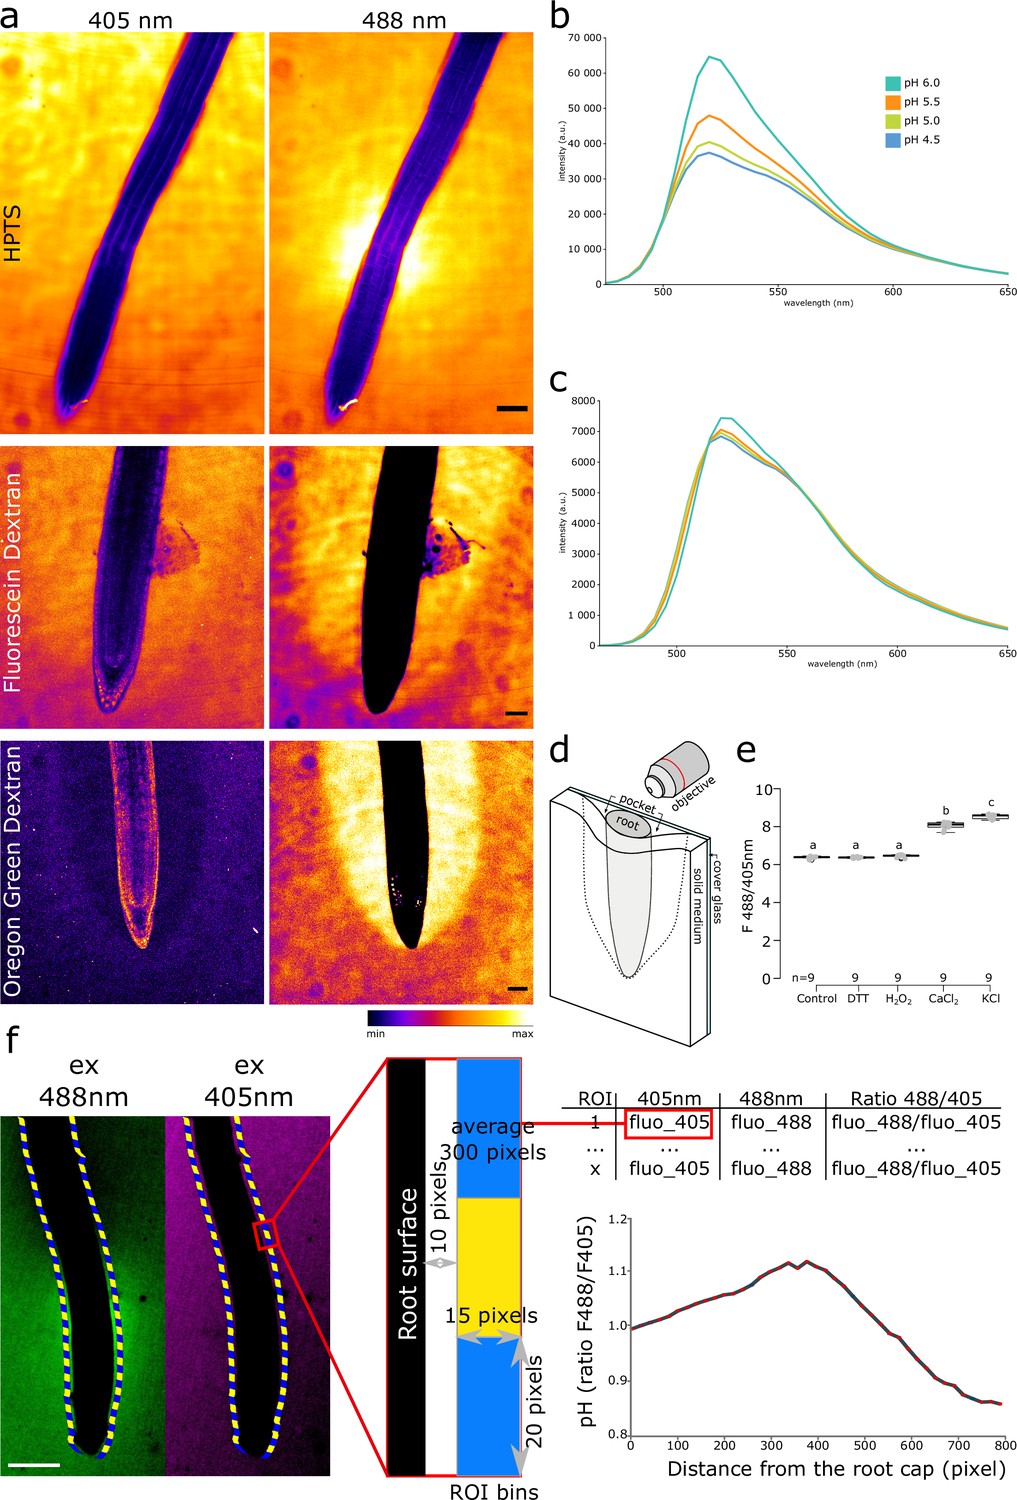
Visualization of root surface pH.
(a) Root surface pH imaged by 8-hydroxypyrene-1,3,6-trisulfonic acid trisodium salt (HPTS), Fluorescein Dextran, and Oregon Green Dextran. For all dyes, the reference excitation channel (405 nm) and the pH-responsive excitation channel (488 nm) are shown. HPTS shows an alkaline domain at the transition zone, while Fluorescein Dextran and Oregon Green Dextran accumulate in a ‘pocket’ (see (d)), preventing the observation of longitudinal pH profile. Emission was recorded at 500–550 nm. Col-0 line was used for HPTS and Oregon Green Dextran, DII-Venus line was used for Oregon Green Dextran. Scale bars = 50 µm. (b, c) pH-dependent FS spectra in liquid ½ MS. (b) Excitation by λEx = 458 nm. (c) Excitation by λEx = 405 nm. (d) Schematic representation of a root mounted into a microscopy chamber on a solid growth medium. Not drawn to scale. (e) FS F488/405 excitation ratio response to redox status and cations in MES buffered agar. Concentrations: 50 mM H2O2, 1 mM DTT, 10 mM CaCl2, 100 mM KCl. (f) The principle of the Along The Root (ATR) surface pH measurements by the FS F488/405 excitation ratio. The root surface is automatically recognized, creating a defined region of interest (ROI) in a 10-pixel distance from the surface. Fluorescence intensities in 488 and 405 nm excitation channels are measured in the ROIs. The data is binned and the FS F488/405 excitation ratio is calculated as a function of distance from the root tip. Scale bar = 100 µm. The source data can be found in Figure 1—figure supplement 1—source data 1.
-
Figure 1—figure supplement 1—source data 1
Data used for generating the graphs in the figure.
- https://cdn.elifesciences.org/articles/85193/elife-85193-fig1-figsupp1-data1-v2.xlsx
Figure 2 with 2 supplements
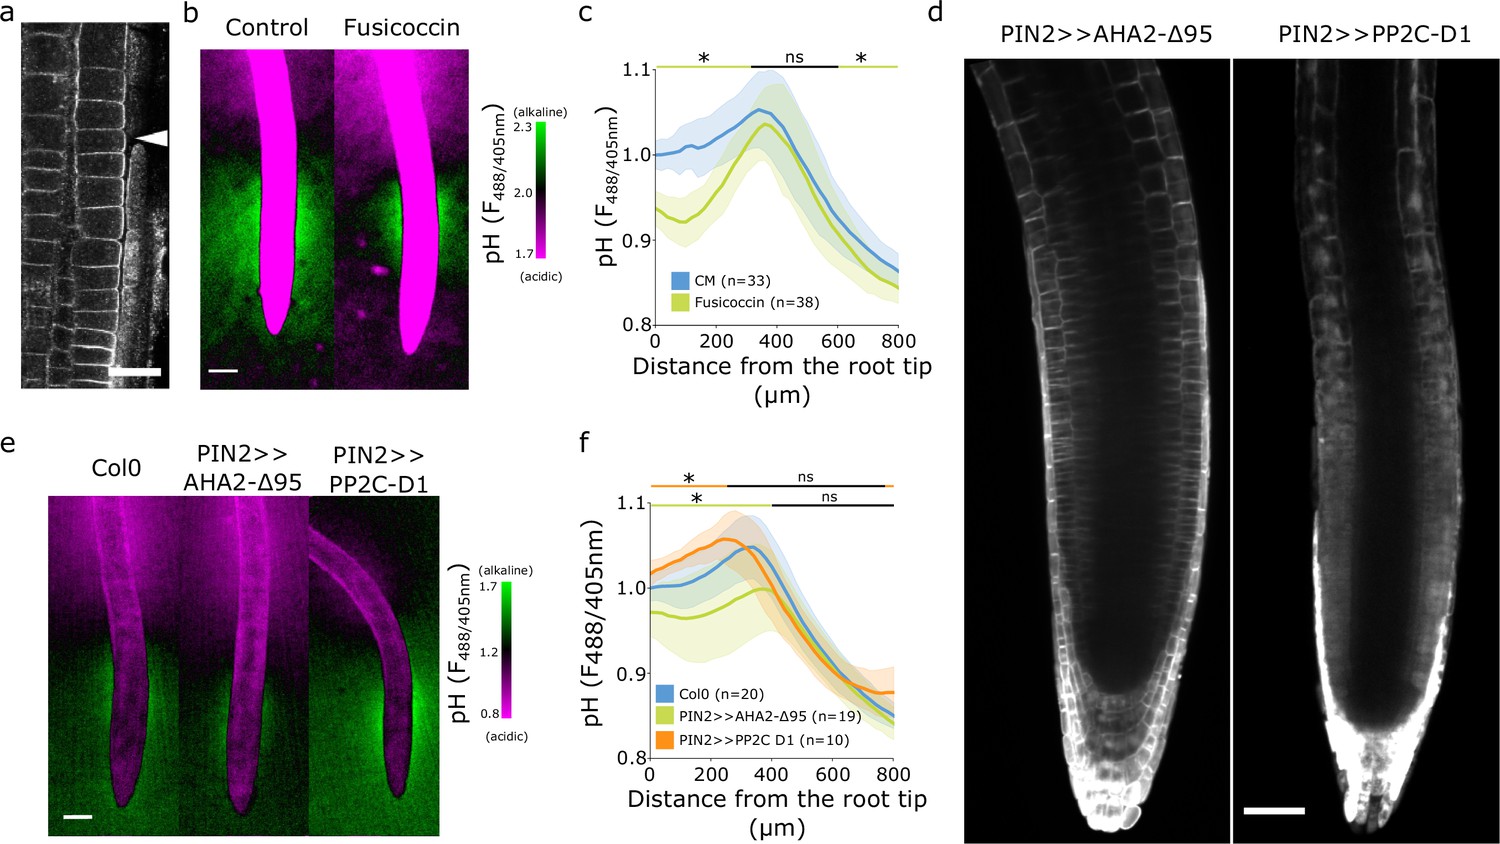
The alkaline domain does not directly depend on proton pump activity.
(a) Immunostaining of AHA proton pumps in the Col-0 root transition zone (arrowhead). Scale bar = 20 µm. (b,c) Root surface pH visualized by FS of wild-type (WT) Col-0 seedlings treated with 0 µM (control) or 2 µM fusicoccin. (b) Representative image (scale bar = 100 µm) and (c) quantifications of FS F488/405 excitation ratio profile. (d) Image of root tips of the tissue-specific inducible lines PIN2 >>AHA2-Δ95-mScarlet and PIN2 >>PP2C-D1-mScarlet seedlings after 4 hr induction by 5 µM estradiol. Scale bar = 50 µm. (e,f) Root surface pH visualized by FS of WT Col-0 and induced PIN2 >>AHA2-Δ95-mScarlet and PIN2 >>PP2C-D1-mScarlet lines. (e) Representative images (scale bar = 100 µm), and (f) quantifications of FS F488/405 excitation ratio profile. For (c) and (f), the bars above the curves mark regions with non-significant (ns) and significant (*: p-value <0.05) statistical difference in comparison to control. The source data can be found in Figure 2—source data 1.
-
Figure 2—source data 1
Data used for generating the graphs in the figure.
- https://cdn.elifesciences.org/articles/85193/elife-85193-fig2-data1-v2.xlsx
Figure 2—figure supplement 1
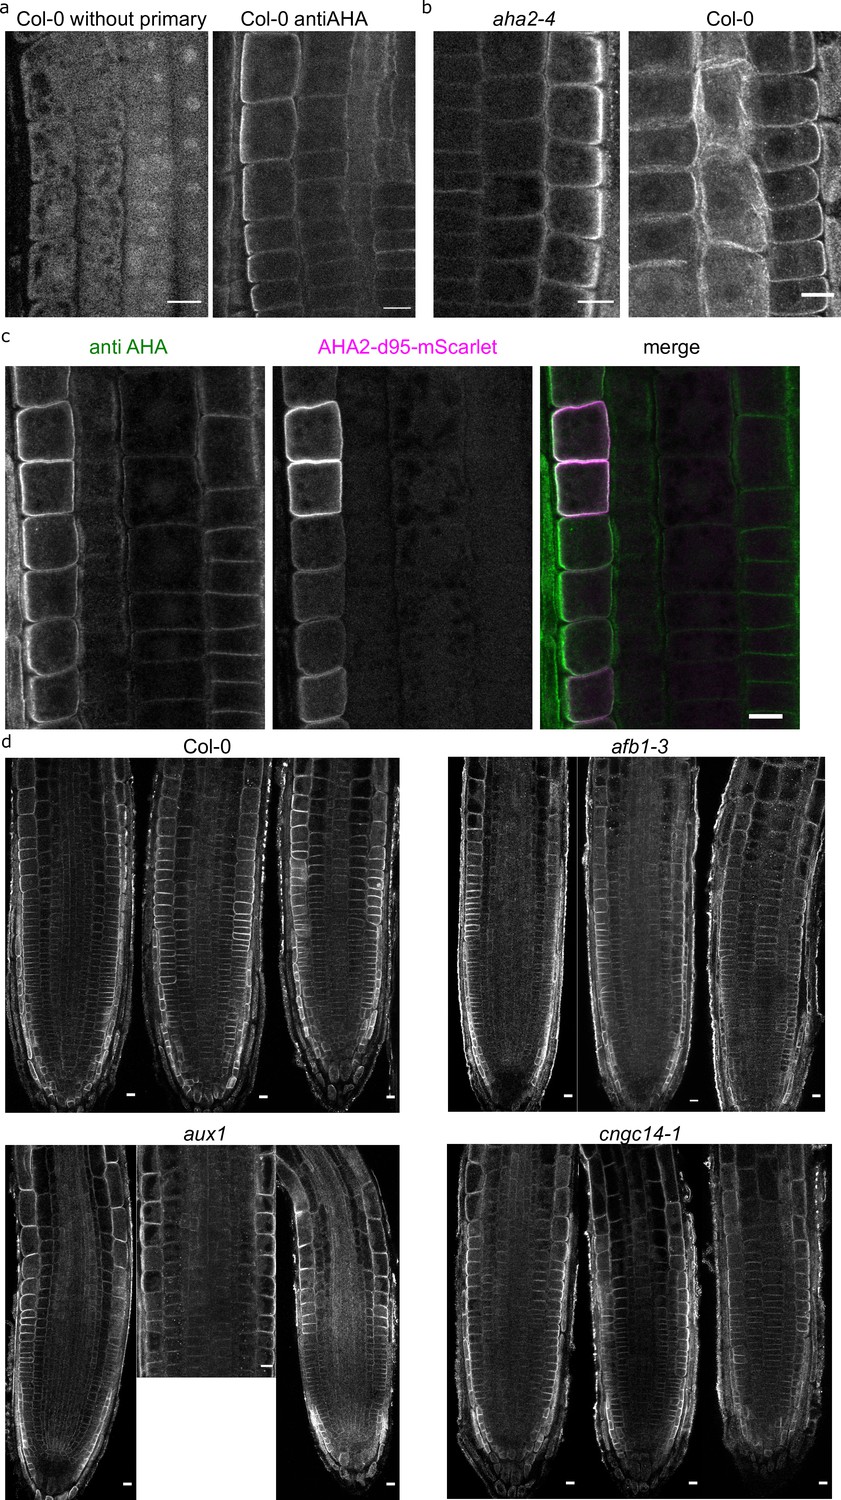
Immunolocalization of AHAs.
(a) Immunostaining of AHA proton pumps in Col-0 roots (right) and a root where the primary antiAHA antibody was omitted (left). (b) The antiAHA antibody labeling in the aha2-4 mutant and the Col-0 controls shows that the antibody recognizes multiple AHA paralogs. (c) The colocalization of antiAHA antibody signal (green) with the AHA2-d95-mScarlet (magenta) demonstrates that the antiAHA antibody recognizes the AHA2 paralogue. Note the increased signal intensity of the antiAHA antibody in the cell file with induced AHA2-d95-mScarlet expression. (d) Immunostaining of AHA proton pumps in Col-0, afb1-3, aux1, and cngc14-1 primary root tips. Three root tips for each genotypes are shown. Scale bars in all images = 10 µm.
Figure 2—figure supplement 2
The influence of genetic manipulation of AHAs on root surface pH.
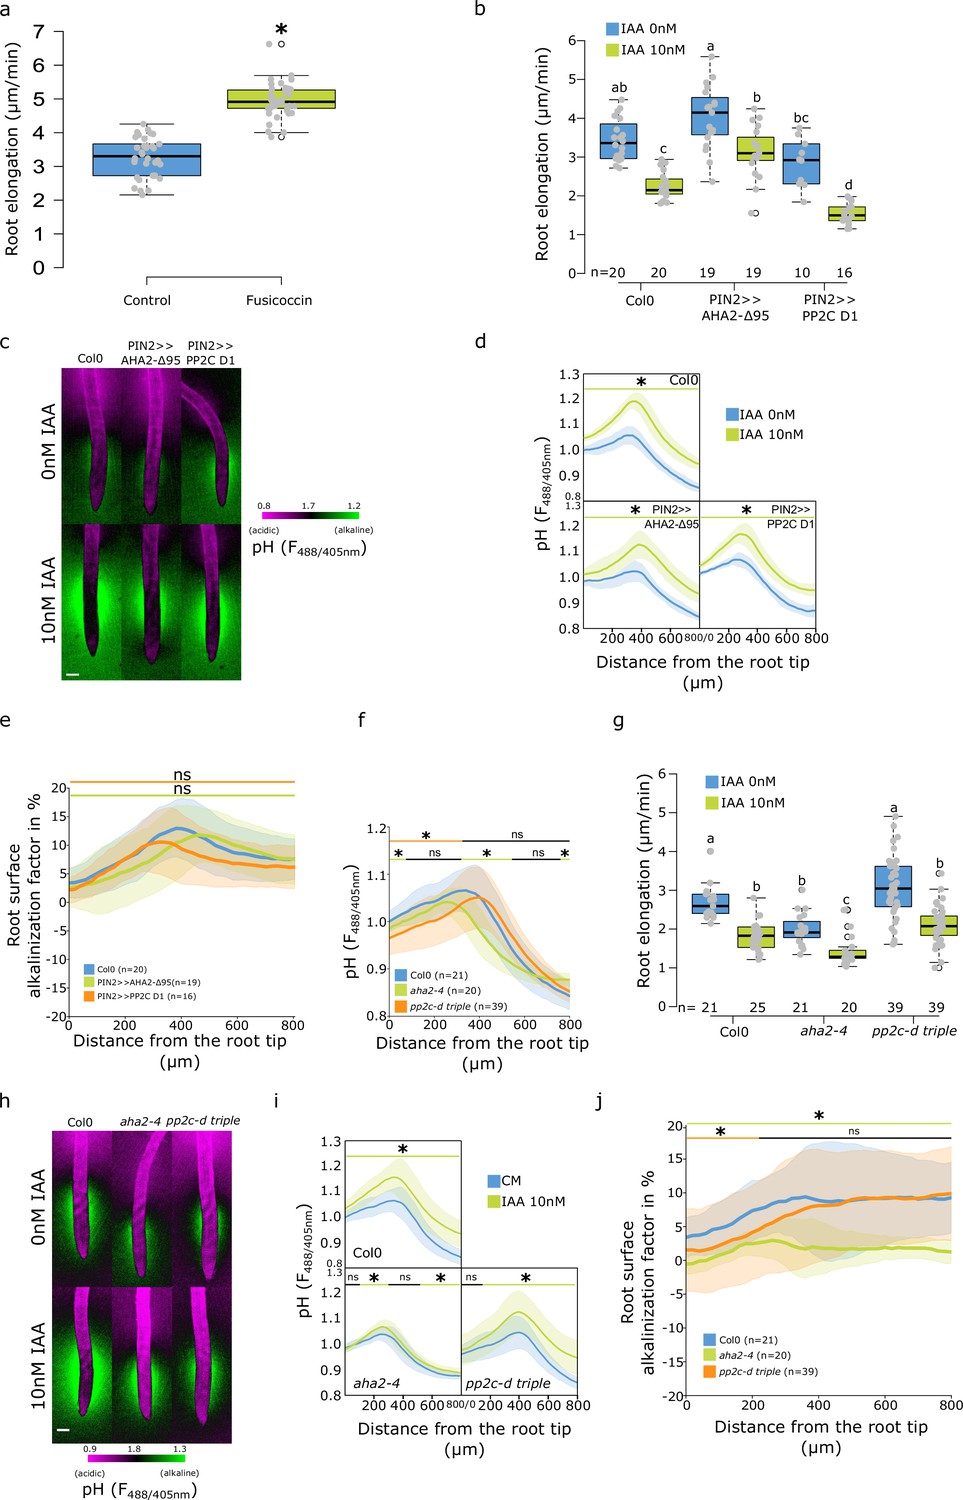
(a) Root elongation (µm/min) of Col-0 treated with 0 or 2 µM fusicoccin. Growth was measured over 40 min of imaging. (b–e) Roots of Col-0 and PIN2 >>AHA2-Δ95 and PIN2 >>PP2C-D1 lines after 4 hr induction by 5 µM estradiol and 20 min treatment with 0 or 10 nM indole-3-acetic acid (IAA). (b) Root elongation (µm/min) measured over 40 min. (c) Representative images of pH visualization by FS; scale bar = 100 µm. (d) Root surface pH quantification by FS F488/405 excitation ratio. (e) Comparison of root surface alkalinization induced by IAA expressed as a factor in % (ratio of individual IAA-treated surface pH profile/average control profile × 100). (f–j) Roots of Col-0, aha2-4 and pp2c-d triple mutants treated for 20 min with 0 or 10 nM IAA. (f) Root surface FS F488/405 excitation ratio in control condition. (g) Root elongation (µm/min) measured over 40 min. (h) Representative images of pH visualization by FS; scale bar = 100 µm. (i) Root surface FS F488/405 excitation ratio in response to IAA. (j) Root surface IAA alkalinization factor (as in (e)). For (a,b,g), the letters on top of boxes correspond to the statistical groups. For (d,e,f,i,j), the bars above the curves mark regions with non-significant (ns) and significant (*: p-value <0.05) statistical difference in comparison to control. The source data can be found in Figure 2—figure supplement 2—source data 1.
-
Figure 2—figure supplement 2—source data 1
Data used for generating the graphs in the figure.
- https://cdn.elifesciences.org/articles/85193/elife-85193-fig2-figsupp2-data1-v2.xlsx
Figure 3 with 1 supplement
Auxin influx by AUX1 is essential for the initiation of the alkaline domain.
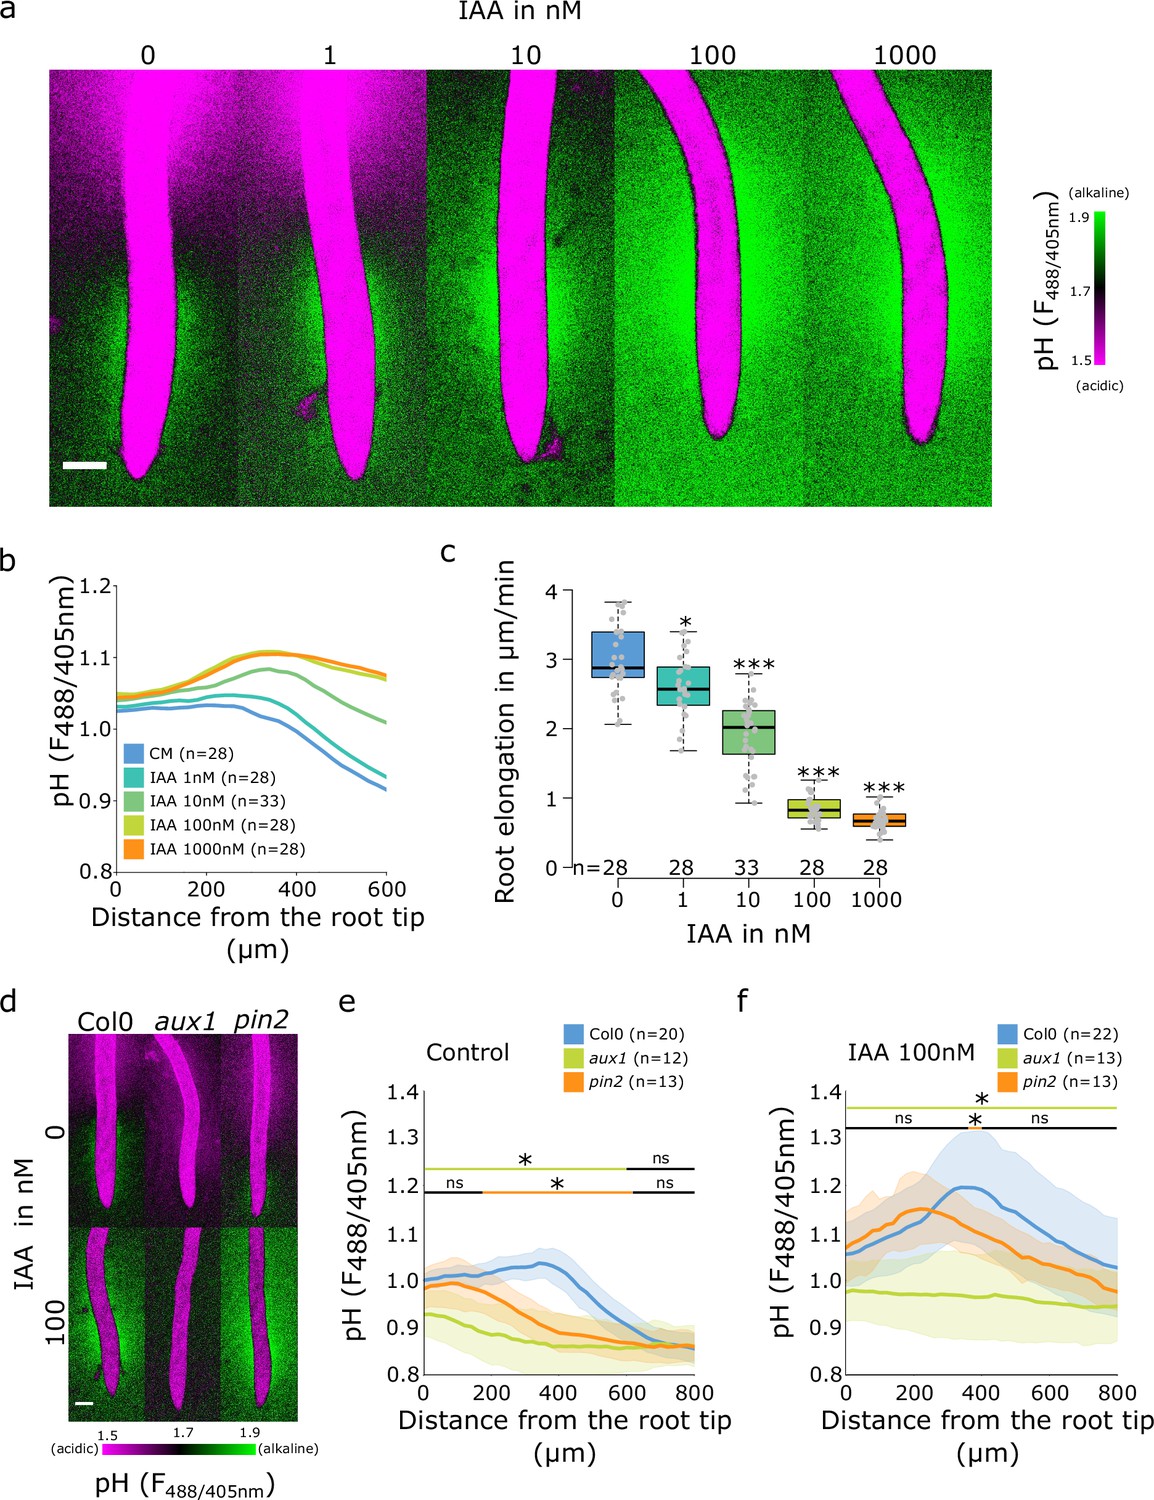
(a–c) Surface pH correlates with growth rate-dose response of Col-0 roots to indole-3-acetic acid (IAA) auxin. (a) Representative images of root surface pH visualized by FS after 20 min IAA treatment. (b) Quantifications of FS F488/405 excitation ratio profile. (c) Root elongation rate (µm/min) measured over a 40 min period. (d–f) Root surface pH visualized by FS of Col-0, aux1 and pin2 mutants after 20 min treatment with 0 or 100 nM IAA. (d) Representative images. (e) Quantification of FS F488/405 excitation ratio profile in (e) control condition and (f) in response to 100 nM IAA. For (b,e,f), the bars above the curves mark regions with non-significant (ns) and significant (*: p-value <0.05) statistical difference in comparison to control. For (c), *: p-value <0.05, ***: p-value <0.0005. Scale bars = 100 µm. The source data can be found in Figure 3—source data 1.
-
Figure 3—source data 1
Data used for generating the graphs in the figure.
- https://cdn.elifesciences.org/articles/85193/elife-85193-fig3-data1-v2.xlsx
Figure 3—figure supplement 1
The role of auxin transport in regulation of root surface pH.
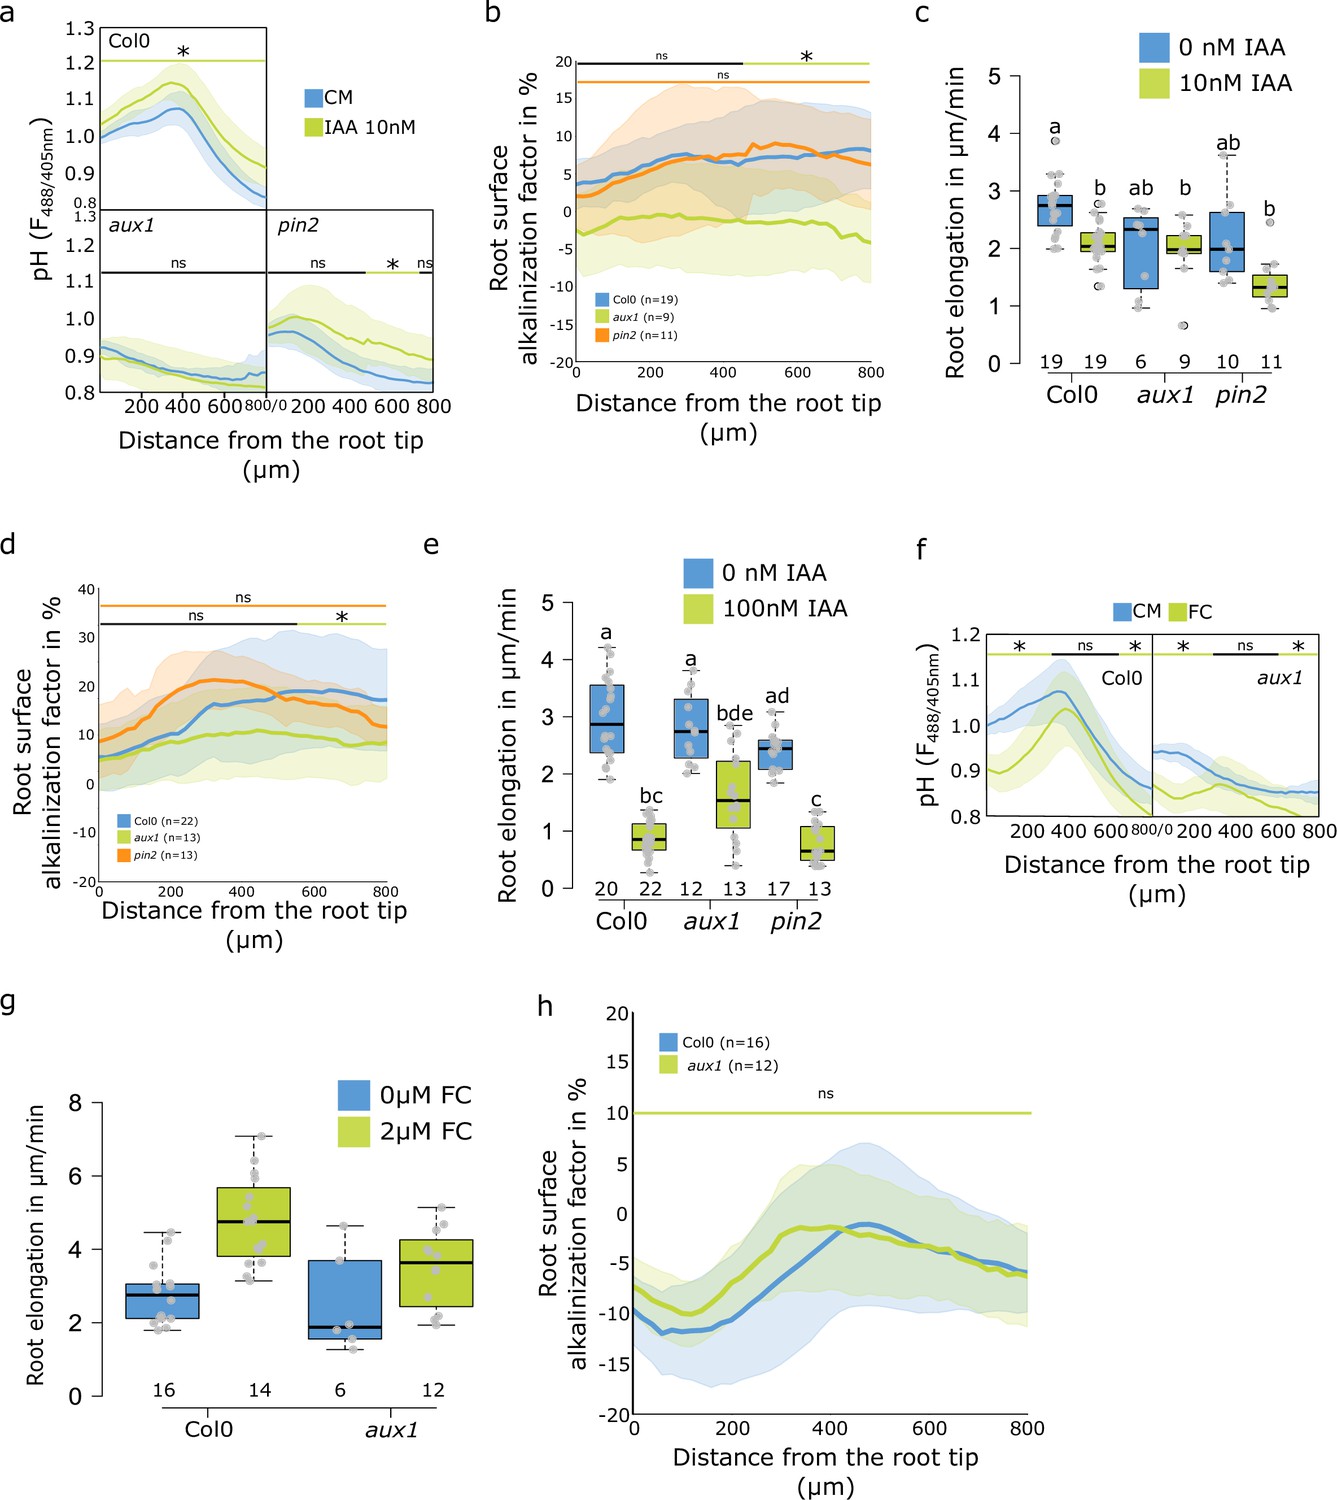
(a–c) Roots of Col-0, aux1 and pin2 mutants after 20 min treatment with 0 or 10 nM indole-3-acetic acid (IAA). (a) Root surface FS F488/405 excitation ratio. (b) Root surface alkalinization induced by IAA expressed as a factor in % (ratio of individual IAA-treated surface pH profile/average control profile × 100). (c) Root elongation (µm/min) measured over 40 min. (d,e) Roots of Col-0, aux1 and pin2 mutants after 20 min treatment with 0 or 100 nM IAA. (d) Root surface alkalinization factor (as in (b)). (e) Root elongation (µm/min) measured over 40 min. (f–h) Roots of Col-0 and aux1 mutant after 20 min treatment with 0 or 2 µM fusicoccin. (f) Root surface FS F488/405 excitation ratio. (g) Root elongation (µm/min) measured over 40 min. (h) Root surface alkalinization factor induced by 2 µM fusicoccin. For (c,e,g), the letters on top of boxes correspond to the statistical groups. For (a,b,d,f,h), the bars above the curves mark regions with non-significant (ns) and significant (*: p-value <0.05) statistical difference in comparison to control. The source data can be found in Figure 3—figure supplement 1—source data 1.
-
Figure 3—figure supplement 1—source data 1
Data used for generating the graphs in the figure.
- https://cdn.elifesciences.org/articles/85193/elife-85193-fig3-figsupp1-data1-v2.xlsx
Figure 4 with 2 supplements
Rapid auxin signaling steers root surface pH.
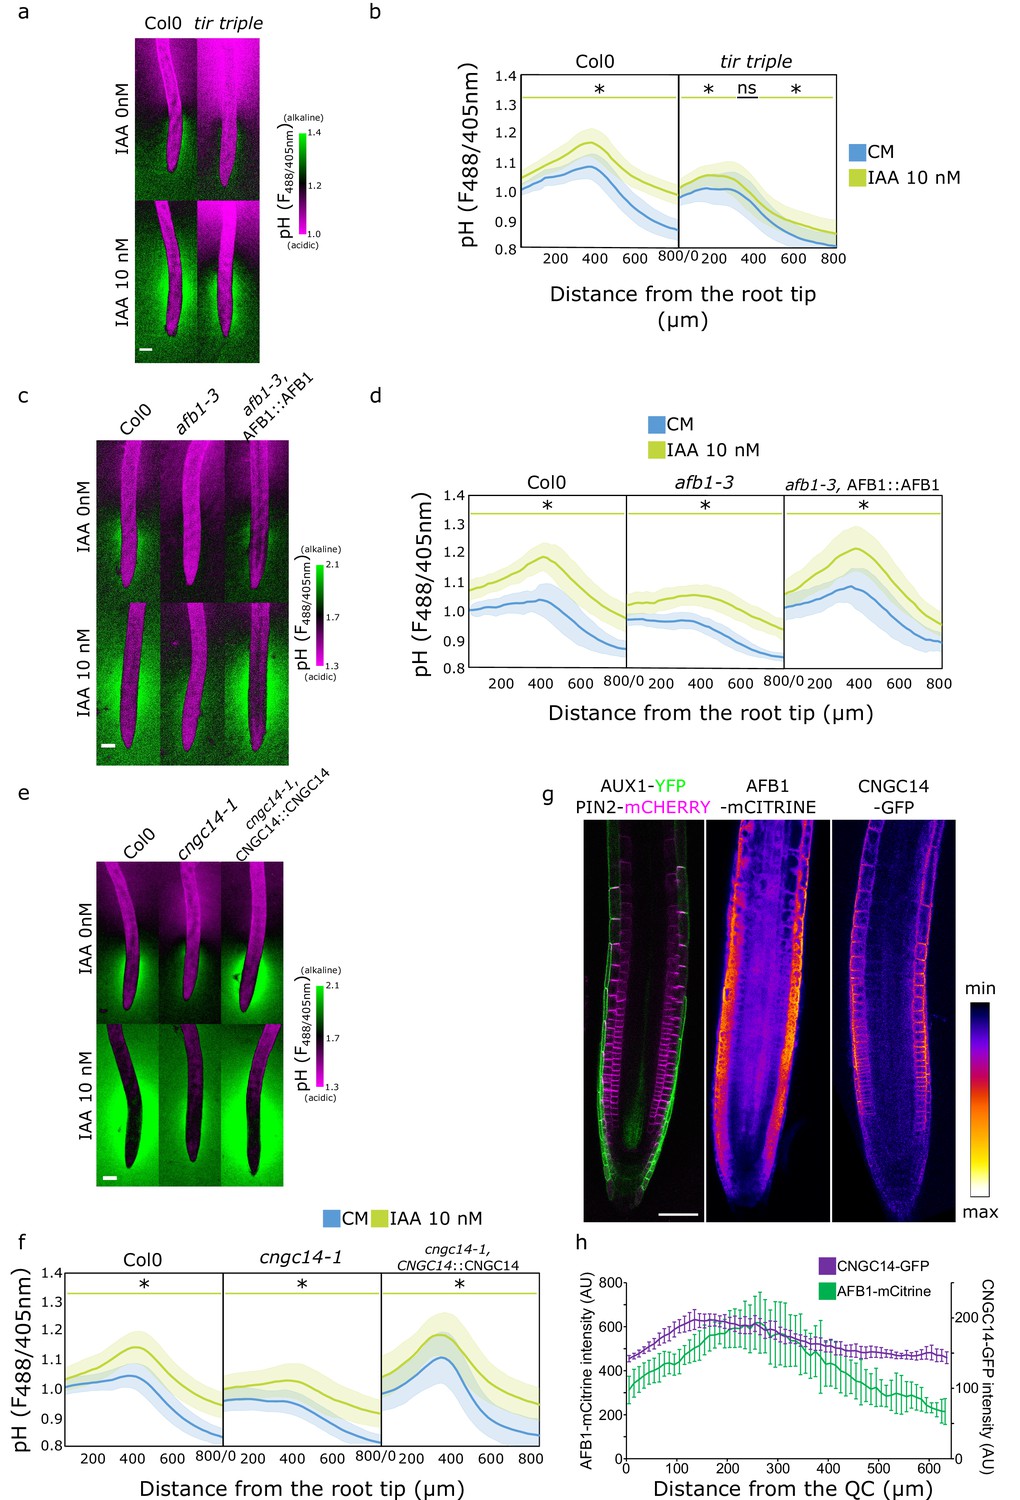
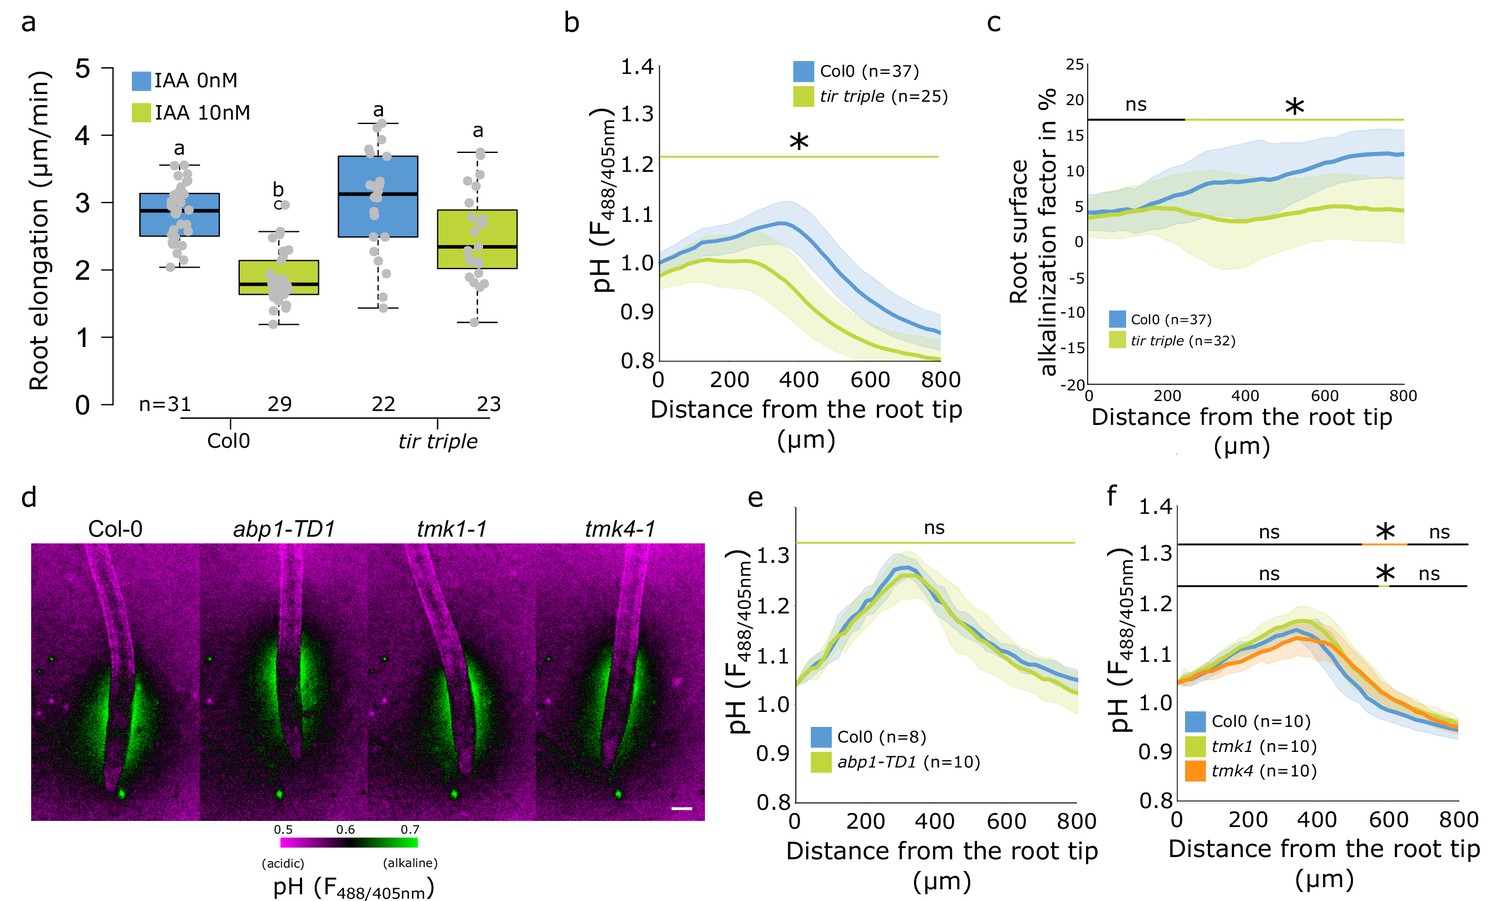
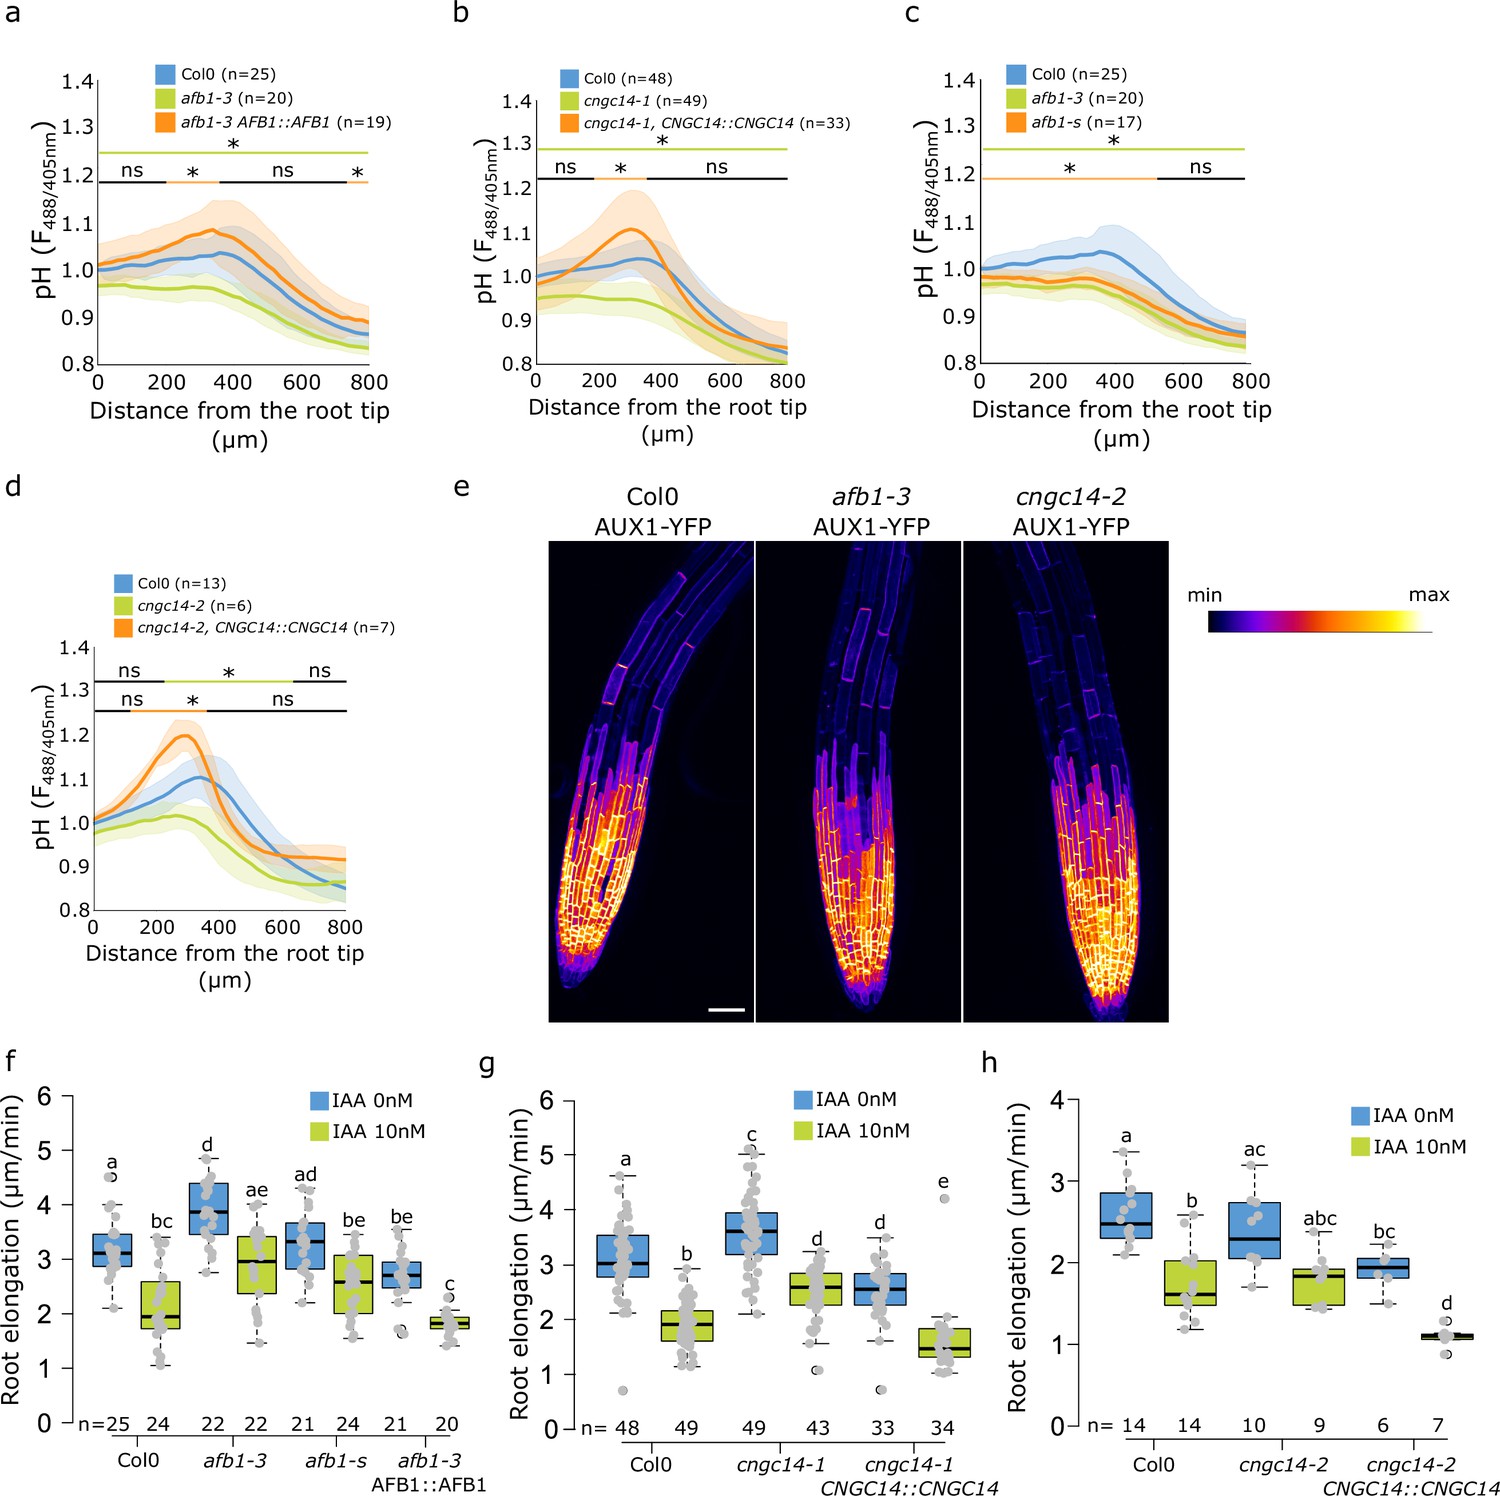
(a, b) Root surface pH of Col-0 and tir triple mutant after 20 min treatment with 0 or 10 nM indole-3-acetic acid (IAA). (a) Representative images of pH visualization by FS and (b) quantification of FS F488/405 excitation ratio profile. (c–d) Root surface pH of Col-0, afb1-3 mutant, and AFB1::AFB1-mCitrine/afb1-3 complemented line after 20 min treatment with 0 or 10 nM IAA. (c) Representative images of pH visualization by FS and (d) quantification of FS F488/405 excitation ratio. (e–f) Root surface pH of Col-0, cngc14-1 mutant, and CNGC14::CNGC14-GFP/cngc14-1 complemented line after 20 min treatment with 0 or 10 nM IAA. (e) Representative images of pH visualization by FS and (f) quantification of FS F488/405 excitation ratio. (g) Localization of AUX1, PIN2, AFB1, and CNGC14 proteins driven by their respective native promoters. For (b,d,f), the bars above the curves mark regions with non-significant (ns) and significant (*: p-value <0.05) statistical difference in comparison to control. Scale bars = 100 µm (a,c,e) or 50 µm (g). (h) Quantification of AFB1-mCitrine and CNGC14-GFP signal intensity in the root epidermis, n=9 (AFB1) and n=15 (CNGC14) roots; error bars = st.dev. The source data can be found in Figure 4—source data 1.
-
Figure 4—source data 1
Data used for generating the graphs in the figure.
- https://cdn.elifesciences.org/articles/85193/elife-85193-fig4-data1-v2.xlsx
Figure 4—figure supplement 1
The role of TMK-ABP1 signaling in regulation of root surface pH.
(a–c) Roots of Col-0 and tir triple mutant after 20 min treatment with 0 or 10 nM indole-3-acetic acid (IAA). (a) Root elongation (µm/min) measured over 40 min. (b) Root surface FS F488/405 excitation ratio profiles in control condition.(c) Root surface alkalinization factor induced by IAA (ratio of individual IAA-treated surface pH profile/average control profile × 100). (d–f) Representative images of root surface pH visualization by FS (d) and quantification of FS F488/405 excitation ratio profiles (e,f) in abp1-TD1, tmk1-1, tmk4-1, and control roots. For (a) the letters on top of boxes correspond to the statistical groups. In (d), scale bar = 100 µm. In (e,f), the bars above the curves mark regions with non-significant (ns) and significant (*: p-value <0.05) statistical difference in comparison to control. The source data can be found in Figure 4—figure supplement 1—source data 1.
-
Figure 4—figure supplement 1—source data 1
Data used for generating the graphs in the figure.
- https://cdn.elifesciences.org/articles/85193/elife-85193-fig4-figsupp1-data1-v2.xlsx
Figure 4—figure supplement 2
Root surface pH and growth of additional afb1 and cngc14 mutant alleles.
(a) Comparison of root surface FS F488/405 excitation ratio profiles of Col-0, afb1-3 mutant and AFB1::AFB1-mCitrine/afb1-3 complemented line; comparison of genotypes from Figure 4d. (b) Comparison of root surface FS F488/405 excitation ratio profiles of Col-0, cngc14-1 mutant and complemented line CNGC14::CNGC14-GFP/cngc14-1; comparison of genotypes from Figure 4f. (c) Comparison of root surface FS F488/405 excitation ratio profiles of Col-0, afb1-1s and afb1-3 mutants in control conditions. (d) Root surface FS F488/405 excitation ratio profiles of Col-0, cngc14-2 mutant and the CNGC14::CNGC14-GFP/cngc14-2 complemented line. (e) Localization of AUX1-YFP in the indicated mutant lines, scale bar = 50 µm. (f–h) Root elongation rates (µm/min) in control and indole-3-acetic acid (IAA)-treated roots measured over 40 min in the indicated lines. For (f,g,h), the letters on top of boxes correspond to the statistical groups. In (a–d), the bars above the curves mark regions with non-significant (ns) and significant (*: p-value <0.05) statistical difference in comparison to control. The source data can be found in Figure 4—figure supplement 2—source data 1.
-
Figure 4—figure supplement 2—source data 1
Data used for generating the graphs in the figure.
- https://cdn.elifesciences.org/articles/85193/elife-85193-fig4-figsupp2-data1-v2.xlsx
Figure 5 with 1 supplement
Rapid auxin signaling pathway is required for surface alkalinization during rapid gravitropic responses.
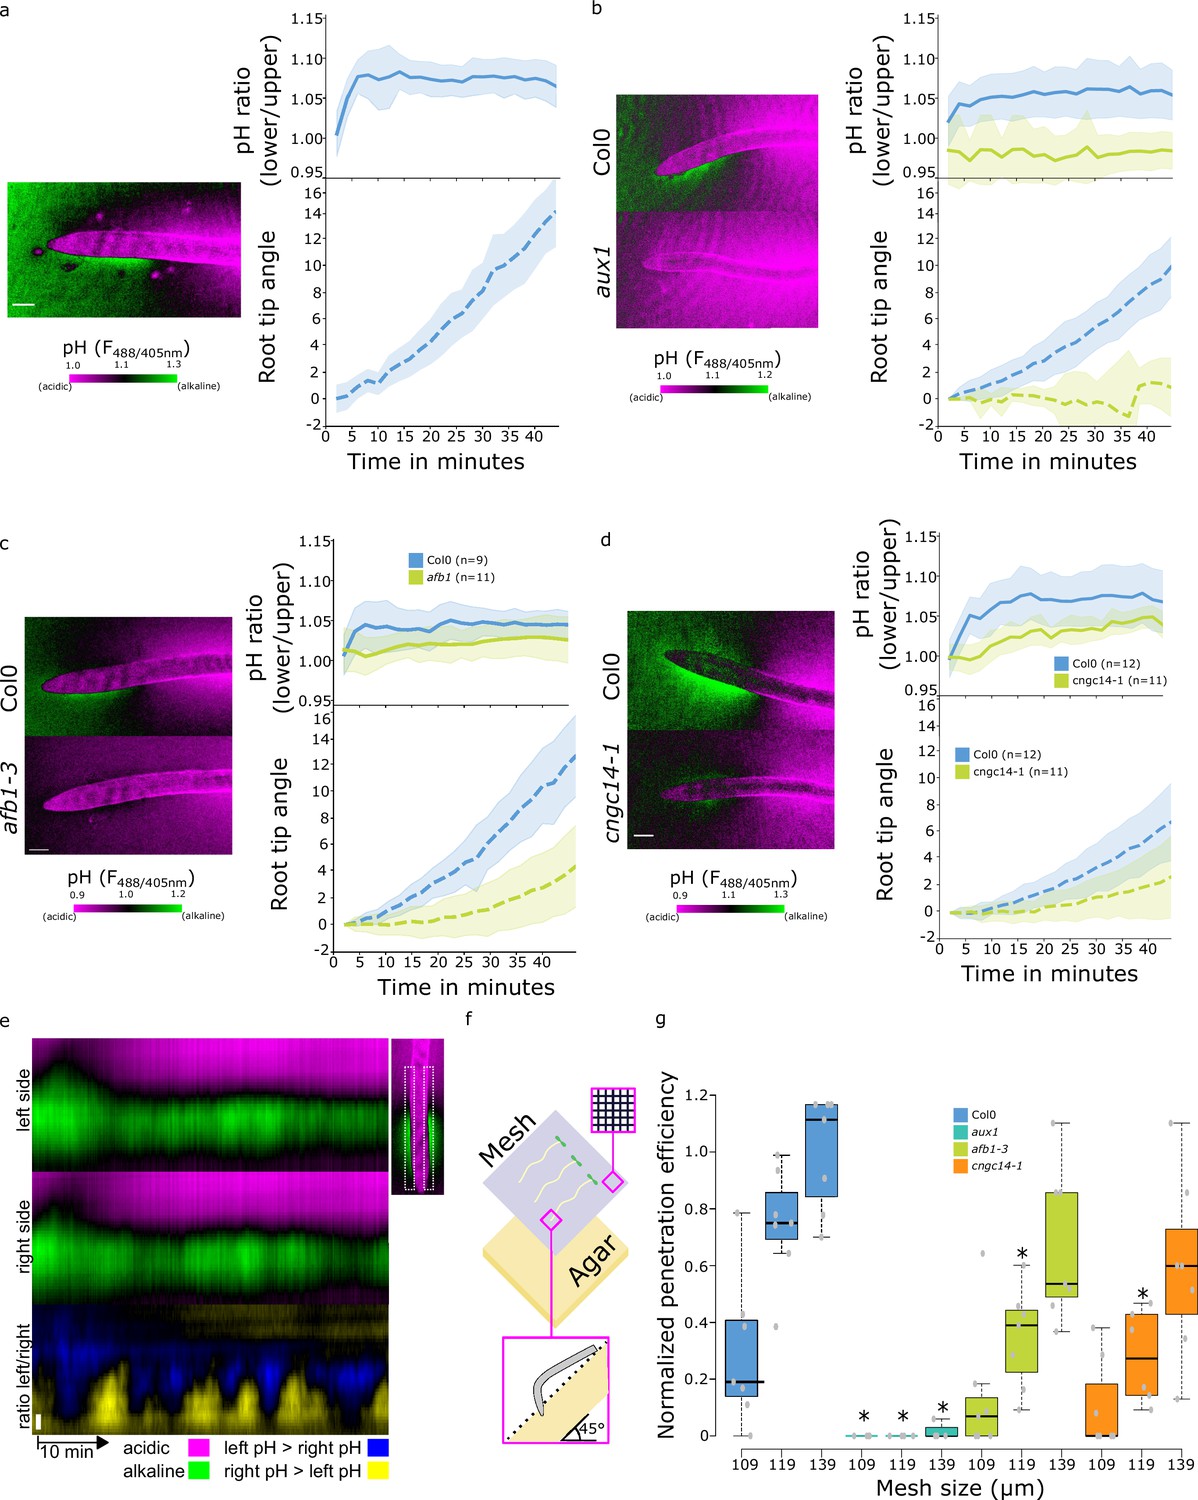
(a–c) Surface pH dynamics and root tip bending angle during gravitropic response in (a) Col-0, (b) Col-0 and aux1, (c) Col-0 and afb1-3, (d) Col-0 and cngc14-1 lines. A representative image of pH visualization by FS, quantification of the FS F488/405 excitation ratio of lower/upper root transition zones, and root tip angle dynamics over time are shown for each line. Representative images were taken 40 min after gravistimulation. (e) Root surface pH oscillations in vertically growing Col-0 roots. The FS F488/405 excitation ratio images for left and right root sides and their left/right ratio are shown. (f,g) Root tip penetration test in 45° inclined media covered with mesh of different pore sizes (109, 119, and 139 µm). (f) Schematics of the experimental setup. (g) Quantitation of Col-0, aux1, afb1-3, and cngc14-1 mesh penetration efficiencies. For (g), statistical differences with p-value <0.05 indicated by *. All scale bars = 100 µm. The source data can be found in Figure 5—source data 1.
-
Figure 5—source data 1
Data used for generating the graphs in the figure.
- https://cdn.elifesciences.org/articles/85193/elife-85193-fig5-data1-v2.xlsx
Figure 5—figure supplement 1
Surface pH dynamics and root tip bending angle during gravitropic responses of indicated lines and treatments.
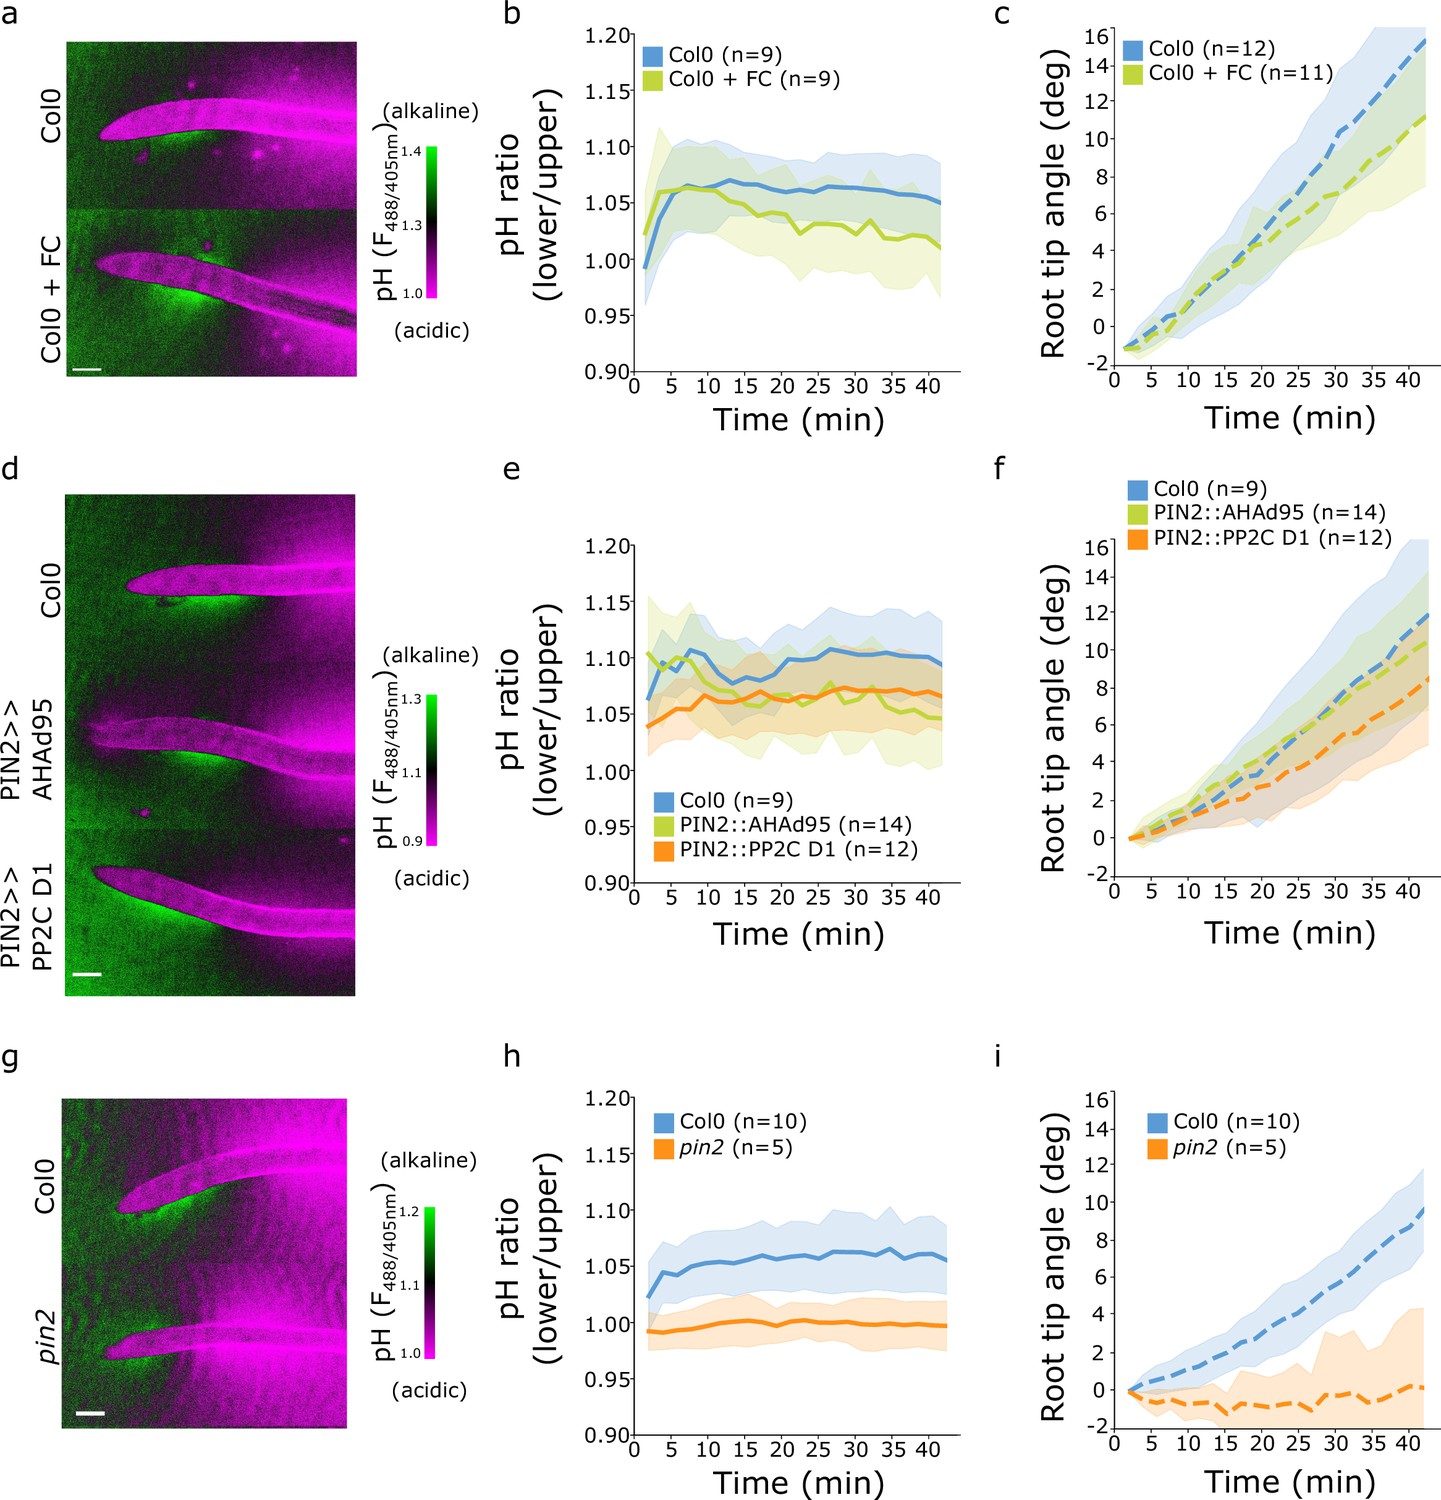
(a,d,g) Representative images of pH visualization by FS taken 40 min after gravistimulation. (b,e,h) Quantification of the FS F488/405 excitation ratio of lower/upper root transition zones. (c,f,i) Root tip angle dynamics as a function of time after gravistimulation. (a–c) Col-0 treated for 20 min with 0 or 2 µM fusicoccin. (d–f) Col-0, PIN2>>AHA2-Δ95 and PIN2>>PP2C-D1 lines induced for 4 hr with 5 µM estradiol. (g–i) Col-0 and pin2 mutants. Scale bars = 100 µm. The source data can be found in Figure 5—figure supplement 1—source data 1.
-
Figure 5—figure supplement 1—source data 1
Data used for generating the graphs in the figure.
- https://cdn.elifesciences.org/articles/85193/elife-85193-fig5-figsupp1-data1-v2.xlsx
Videos
Video 1
Compilation of gravitropic responses of indicated mutant lines and controls.
Video 2
High-resolution dynamics of root surface pH in Col-0 root.
Video 3
High-resolution dynamics of root surface pH in Col-0, aux1, afb1, and cngc14 roots.
The movie is assembled from individual movies, the lookup table is set identically for all genotypes.
Additional files
-
MDAR checklist
- https://cdn.elifesciences.org/articles/85193/elife-85193-mdarchecklist1-v2.pdf
-
Source code 1
Python script used for plotting the surface pH as the funciton of distance from the root tip.
- https://cdn.elifesciences.org/articles/85193/elife-85193-code1-v2.zip
-
Source code 2
R script used for generating the root elongation boxplots and the associated statistics.
- https://cdn.elifesciences.org/articles/85193/elife-85193-code2-v2.zip
-
Source code 3
R script for comparing root surface pH profiles.
- https://cdn.elifesciences.org/articles/85193/elife-85193-code3-v2.zip
-
Source code 4
R script for comparing root surface pH profiles.
- https://cdn.elifesciences.org/articles/85193/elife-85193-code4-v2.zip
-
Source data 1
The results of the statistical tests for all the figures.
- https://cdn.elifesciences.org/articles/85193/elife-85193-data1-v2.xlsx
Download links
A two-part list of links to download the article, or parts of the article, in various formats.
Downloads (link to download the article as PDF)
Open citations (links to open the citations from this article in various online reference manager services)
Cite this article (links to download the citations from this article in formats compatible with various reference manager tools)
The AUX1-AFB1-CNGC14 module establishes a longitudinal root surface pH profile
eLife 12:e85193.
https://doi.org/10.7554/eLife.85193


