Organelle proteomic profiling reveals lysosomal heterogeneity in association with longevity
- State Key Laboratory of Cellular Stress Biology, School of Life Sciences, Faculty of Medicine and Life Sciences, Xiamen University, China
- Huffington Center on Aging, Baylor College of Medicine, United States
- Developmental Biology Graduate Program, Baylor College of Medicine, United States
- Janelia Research Campus, Howard Hughes Medical Institute, United States
- Molecular and Cellular Biology Graduate Program, Baylor College of Medicine, United States
- Institute of Organic Chemistry and Biochemistry, Czech Republic
- Institute for Chemistry, Engineering and Medicine for Human Health (ChEM-H), Stanford University, United States
- Department of Chemical Engineering and Genetics, Stanford University, United States
- Department of Molecular and Cellular Biology, Baylor College of Medicine, United States
Figures
Figure 1 with 1 supplement
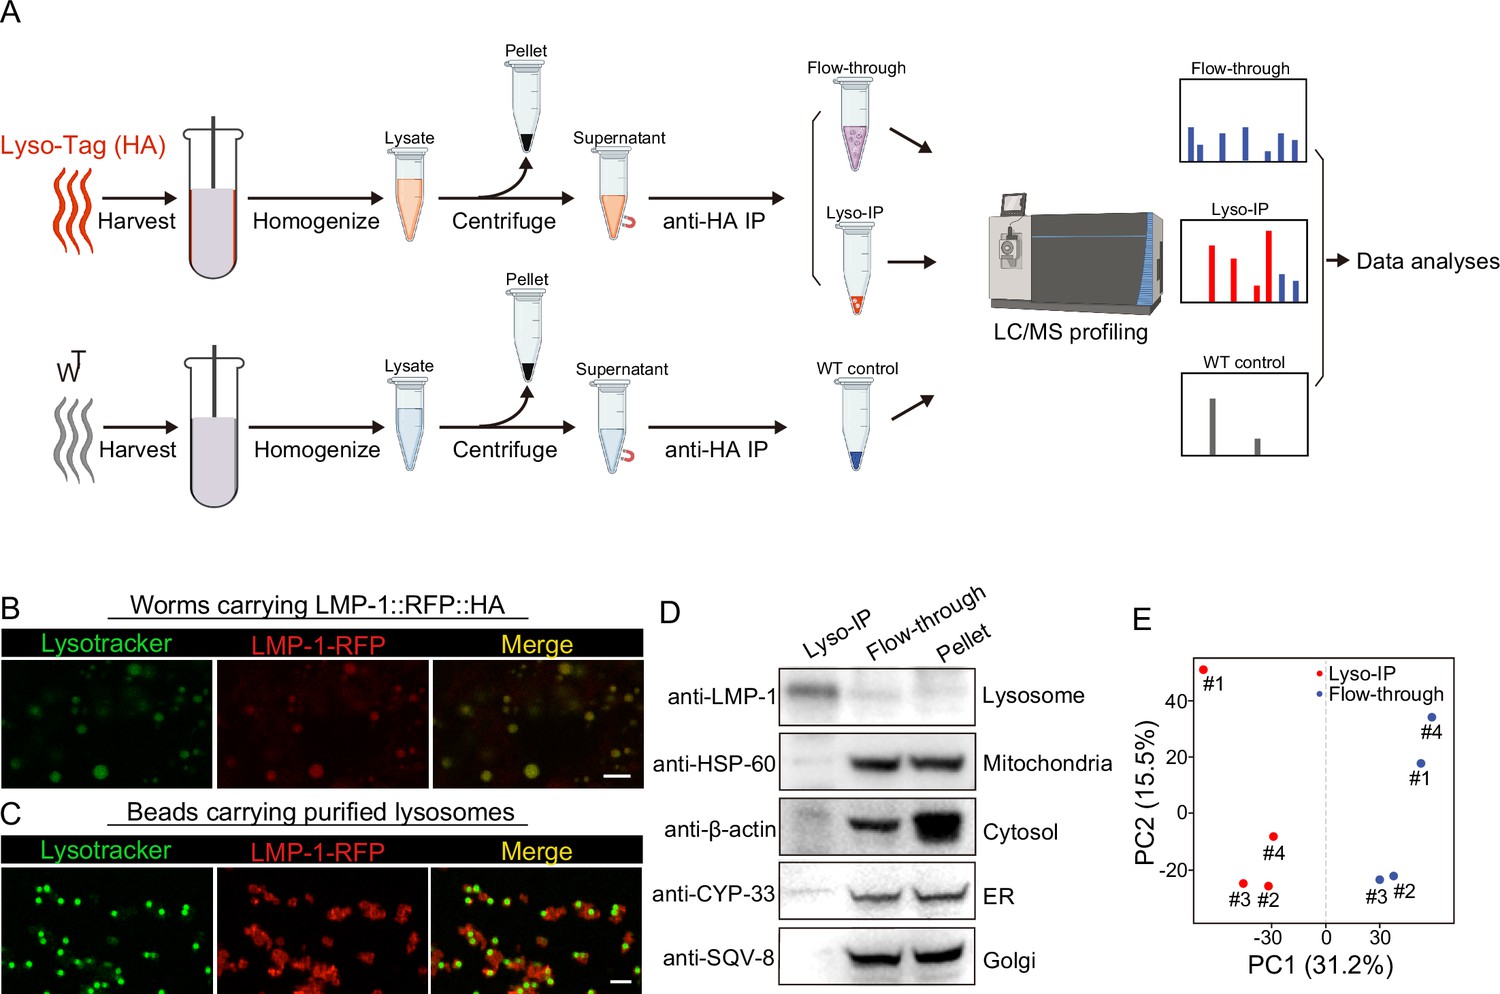
Rapid lysosome isolation coupled with proteomic profiling.
(A) Schematic of the workflow for immunoprecipitation-based lysosome purification (Lyso-IP) and mass spectrometry-based proteomic profiling to identify lysosome-enriched proteomes in C. elegans.(B) Example images of transgenic strains carrying LMP-1 Lyso-Tag (LMP-1::RFP-3×HA) with LysoTracker staining to mark lysosomes in vivo. Scale bar = 5 µm. (C) Example images of beads carrying purified lysosomes from Lyso-IP with LysoTracker staining to mark intact lysosomes in vitro. Scale bar = 5 µm.(D) Western blot for protein markers of different subcellular compartments using purified lysosomes (Lyso-IP), paired non-lysosomal fractions (Flow-through) or Pellet. (E) Principal components analysis (PCA) of four independent biological replicates of Lyso-IP and Flow-through samples.
-
Figure 1—source data 1
Western blots shown in Figure 1.
- https://cdn.elifesciences.org/articles/85214/elife-85214-fig1-data1-v2.zip
Figure 1—figure supplement 1
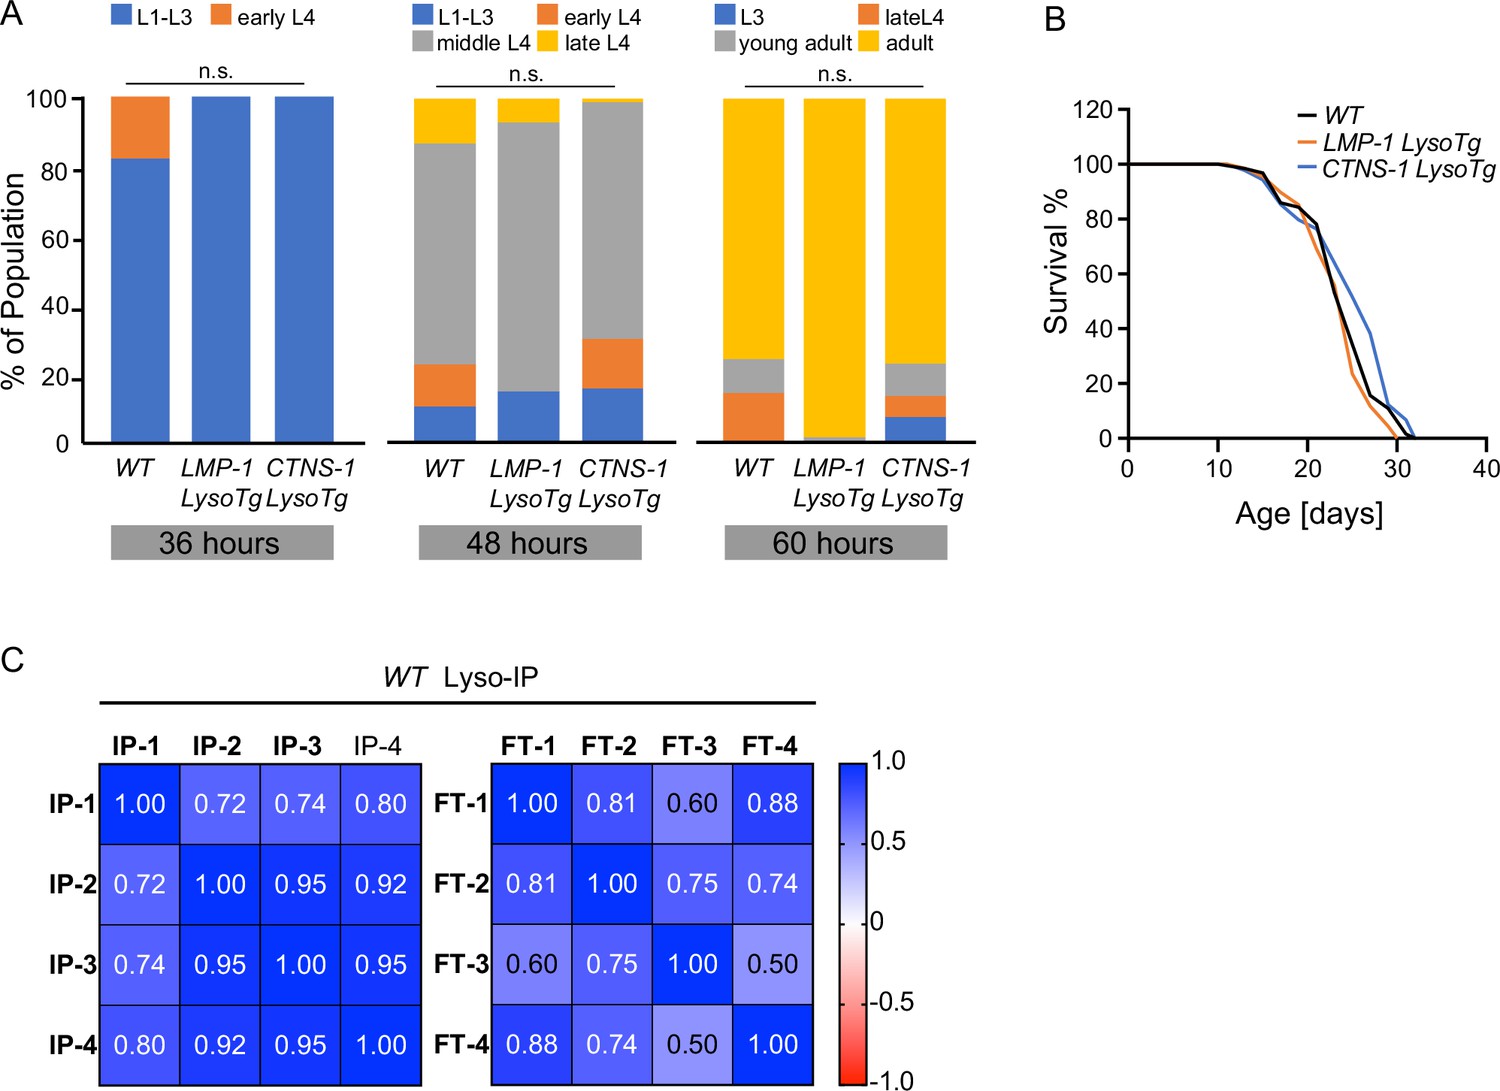
Analysis of LysoTg lines and Lyso-IP profiling in wild-type (WT) worms.
(A) Developmental timing of WT and transgenic strains expressing LMP-1 and CTNS-1 Lyso-Tag (LMP-1 and CTNS-1 LysoTg). n.s. p > 0.05 by Chi-squared test. (B) Lifespan of WT, LMP-1 LysoTg, and CTNS-1 LysoTg worms. The lifespan data are also in Supplementary file 8. (C) Correlation analysis of four independent biological replicates of Lyso-IP (IP) and Flow-through (FT) samples from proteomics analyses.
Figure 2 with 1 supplement
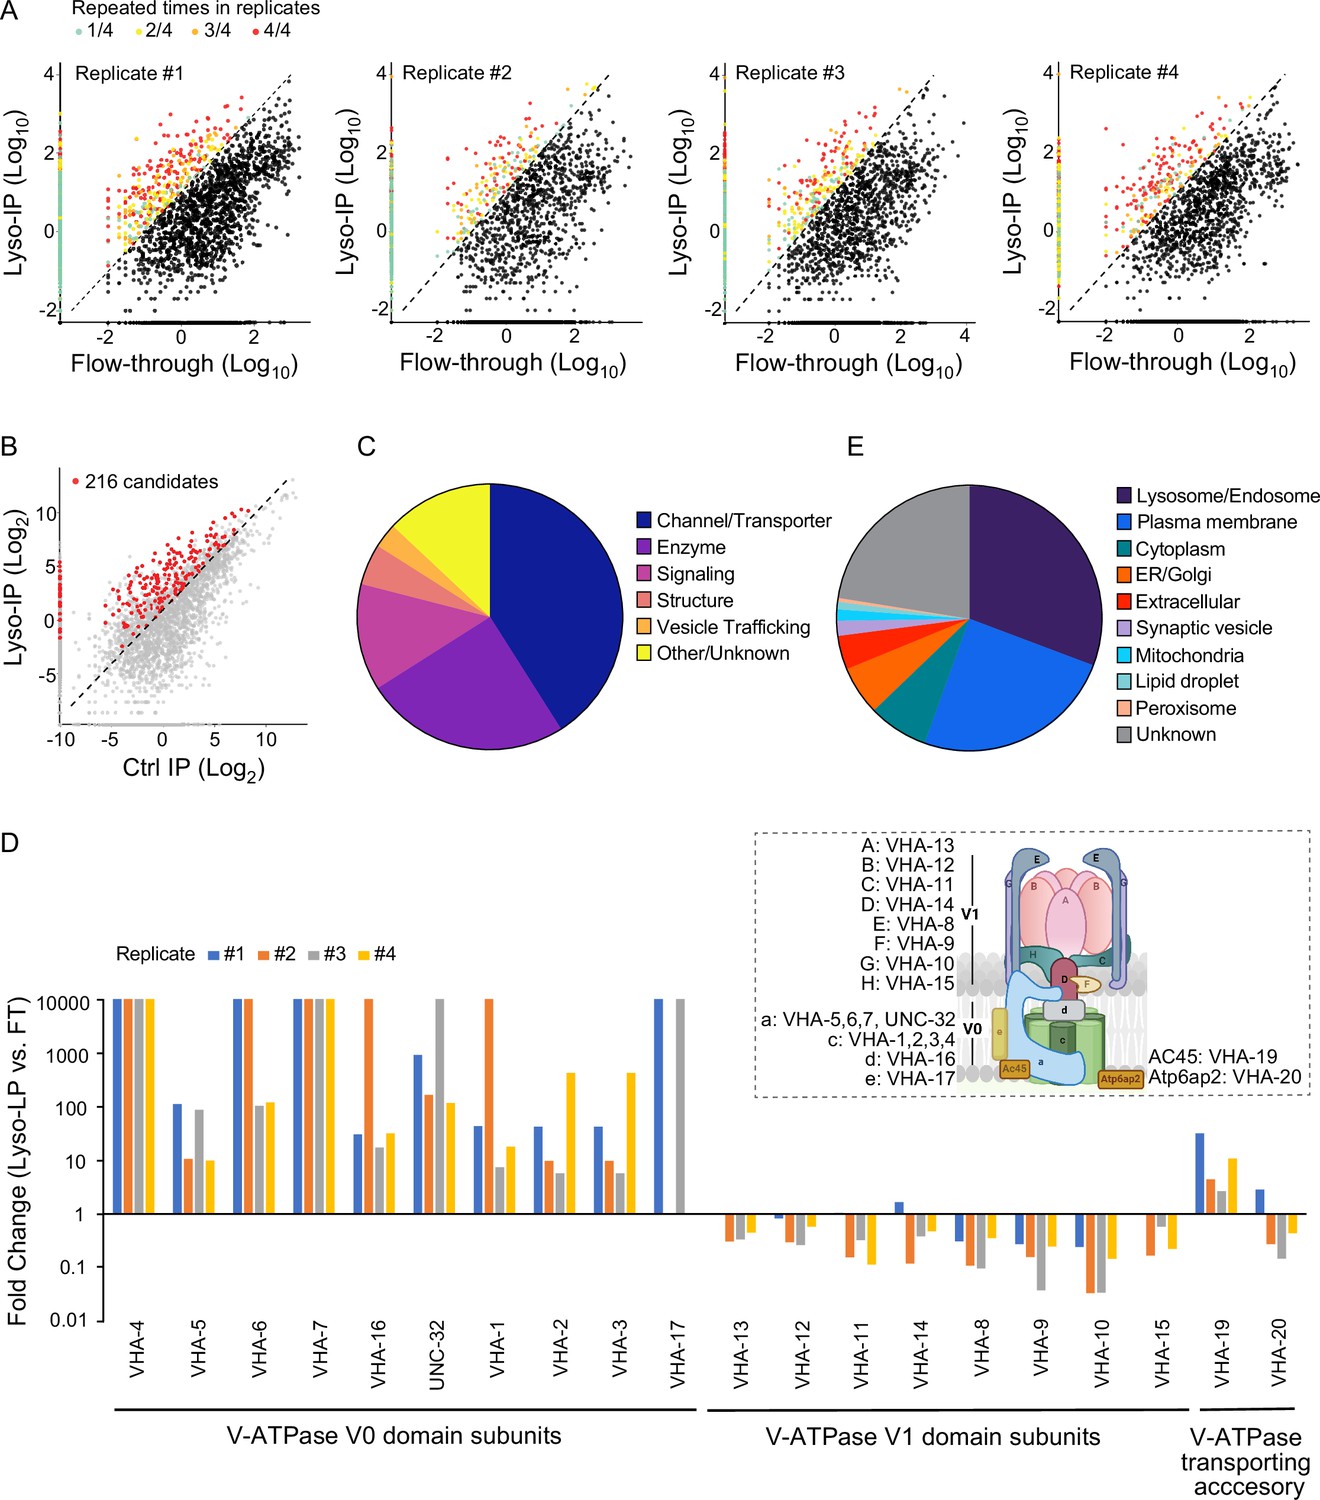
Systematic view of lysosome-enriched proteome.
(A) Scatter plots showing candidate selection from four independent biological replicates in proteomics analyses. Proteins with at least 10-fold higher levels in Lyso-IP samples than in flow-through (FT) controls are highlighted with different colors based on repeated times in four replicates. (B) Scatter plot showing candidate selection with normalization to non-tagged controls using wild-type worms. 216 proteins with over twofold higher levels in Lyso-IP samples than in non-tagged controls are highlighted in red. (C) Pie chart showing molecular function categories of lysosome-enriched proteins. (D) The lysosomal enrichment ratio (Lyso-IP vs. FT) for each subunit of lysosomal vacuolar ATPase (v-ATPase) in four independent replicates is shown. Inserted scheme showing lysosomal V-ATPase assembly. (E) Pie chart showing subcellular location categories of lysosome-enriched proteins.
Figure 2—figure supplement 1

Pie chart showing the proportion of LMP-1 Lyso-IP candidates from wild-type (WT) worms with mammalian homologs.
Figure 3 with 1 supplement

Lysosomal proteome heterogeneity across tissues.
(A) Example images of transgenic strains carrying Lyso-Tag (LMP-1::RFP-3×HA) driven by four different tissue-specific promoters. Scale bar = 20 μm. Scatter plot showing the relative enrichment ratio for each of 216 lysosome-enriched proteins identified from whole-body LMP-1 Lyso-IP in comparison with tissue-specific LMP-1 Lyso-IPs, hypodermis (B), muscle (C), intestine (D), and neuron (E). X-axis, enrichment ratio tissue-specific vs. whole-body; Y-axis, normalized protein abundance over LMP-1; each dot represents the average of three replicates. (F) Heatmap showing the relative enrichment of 216 lysosome-enriched proteins identified from whole-body LMP-1 Lyso-IP in comparison with tissue-specific LMP-1 Lyso-IPs. Group I, comparable ratios between whole-body and tissue-specific Lyso-IPs; Group II, increase in tissue-specific Lyso-IPs (p < 0.05 by Student’s t-test); Group III, decrease in tissue-specific Lyso-IPs (p < 0.05 by Student’s t-test); Group IV, absent in tissue-specific IPs.
Figure 3—figure supplement 1
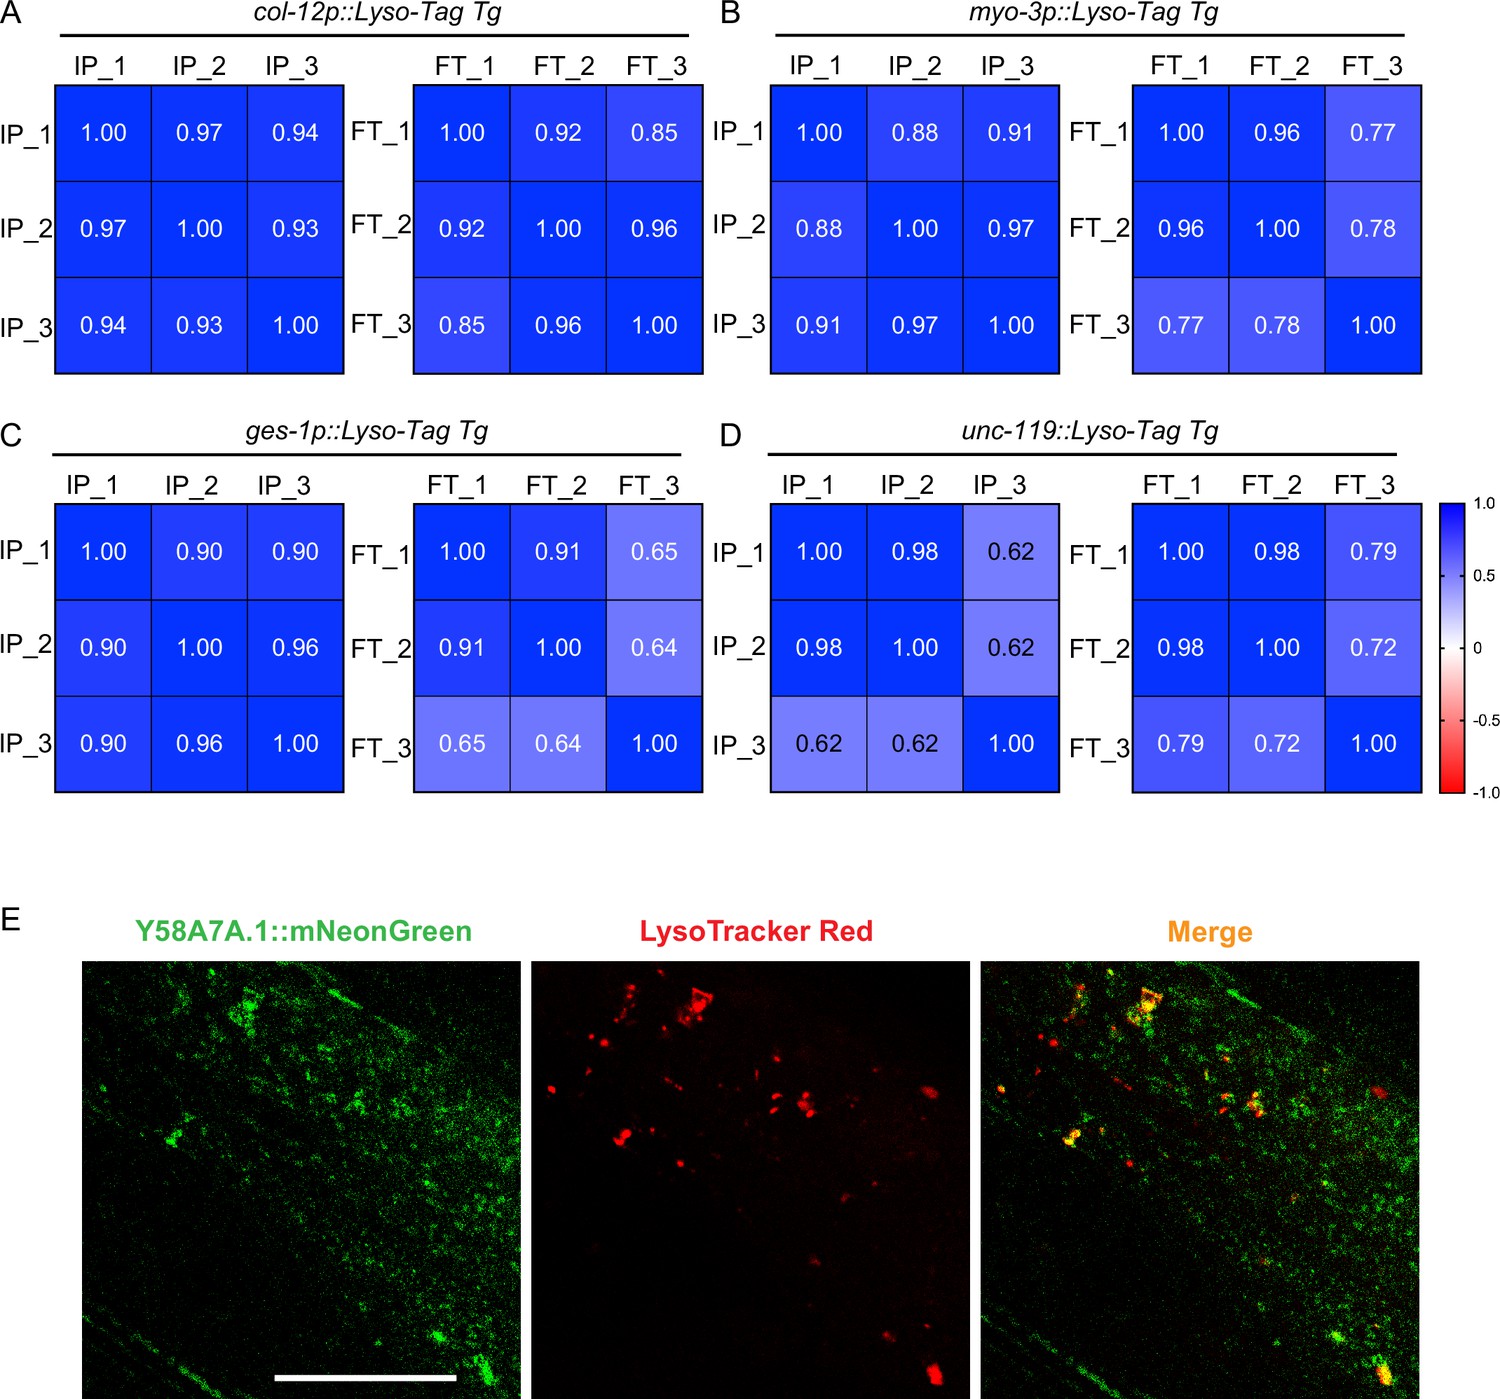
Tissue-specific Lyso-IPs and candidate imaging.
(A–D) Pearson correlation matrices of tissue-specific lyso-IP (IP) samples and flow-through (FT) samples show the correlation among three different replicates. (A) Hypodermis, (B) muscle, (C) intestine, and (D) neuron. (E) Representative images showing colocalization of Y58A7A.1::mNeonGreen and LysoTracker Red in the hypodermis. Scale bar = 20 μm.
Figure 4 with 1 supplement
Lysosomal proteome in different pro-longevity models.
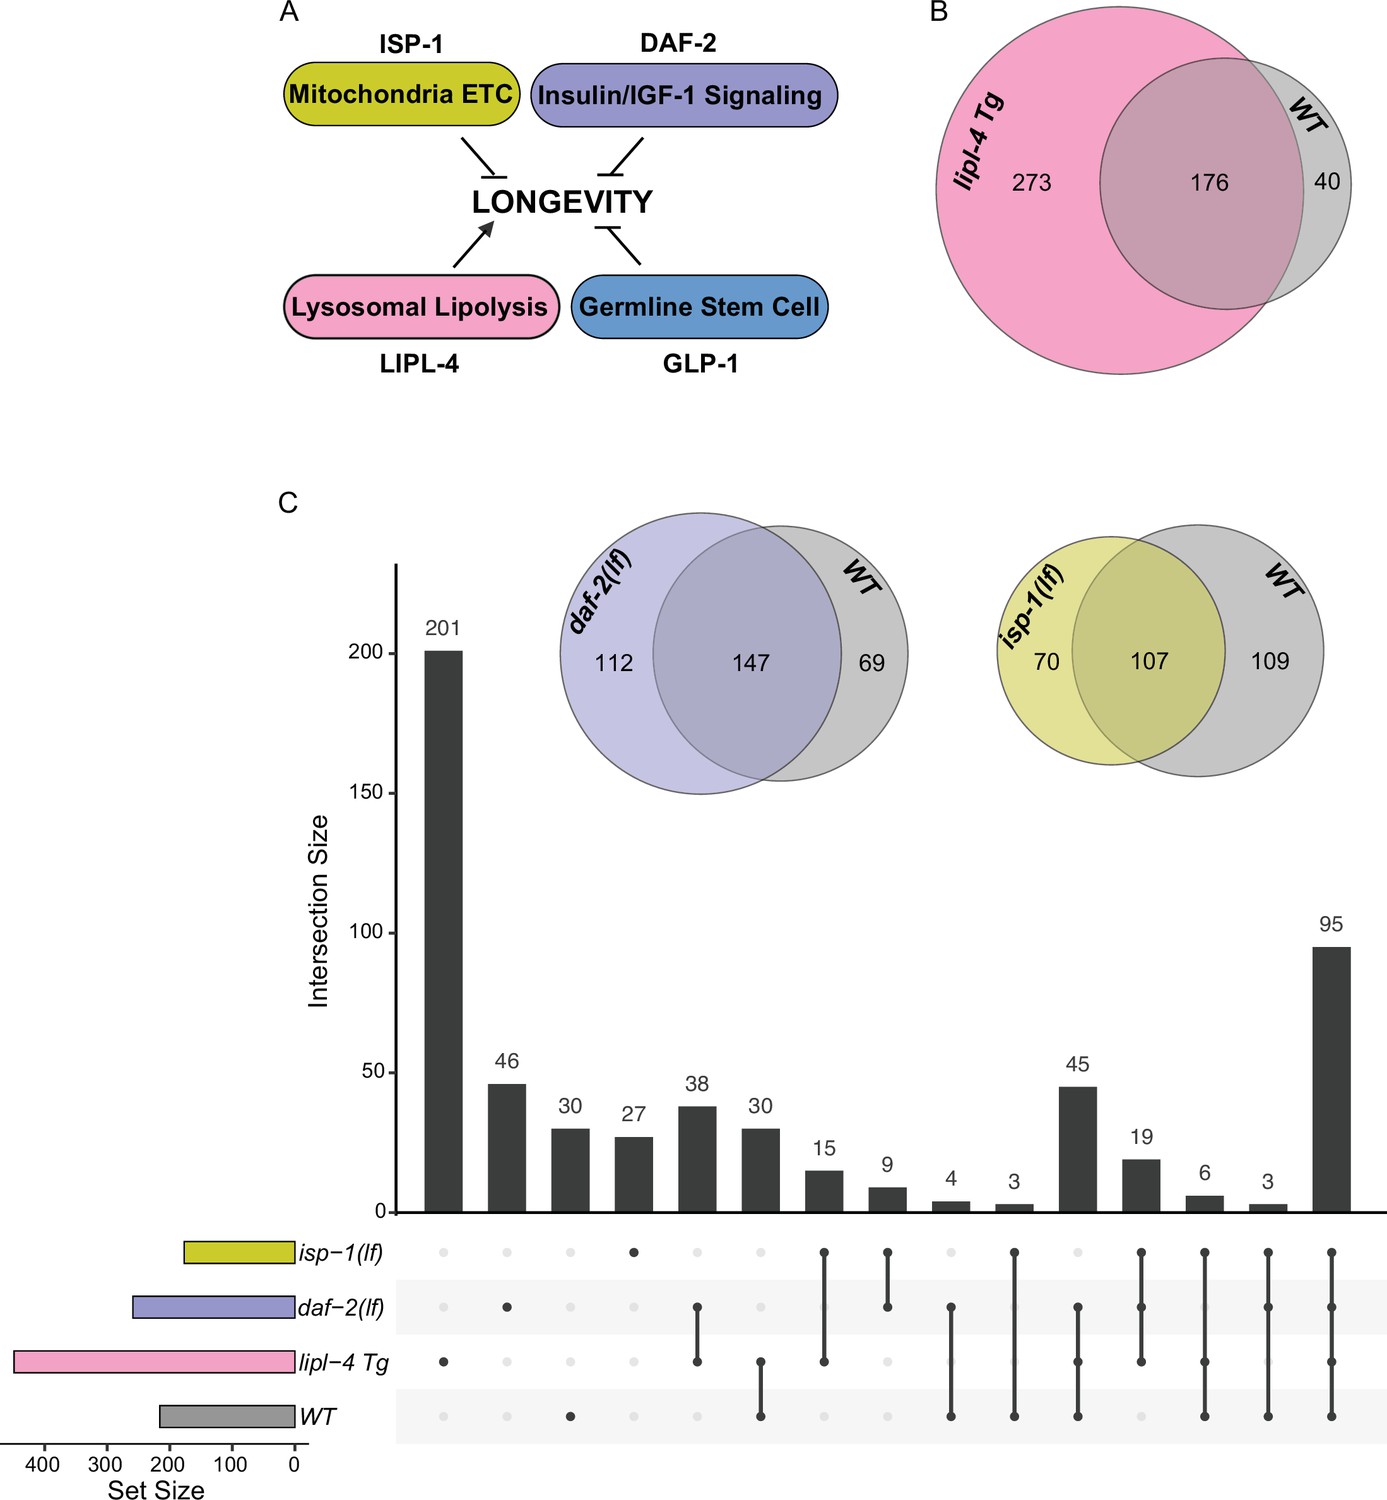
(A) Scheme showing four different longevity regulatory mechanisms used in this study. Loss-of-function mutants (lf) of isp-1, daf-2, and glp-1 reduce mitochondrial electron transport chain (ETC) complex III, insulin/IGF-1 signaling, and germline stem cell proliferation, respectively, leading to lifespan extension; while increasing lysosomal lipolysis by lipl-4 transgenic overexpression (lipl-4 Tg) promotes longevity. (B) Venn diagram showing the overlap between the lysosome-enriched proteomes from wild-type (WT) and lipl-4 Tg worms. (C) Upset graph showing the distribution and overlap of lysosome-enriched proteins across the four pro-longevity models. Inserted Venn diagram showing the overlaps between the lysosome-enriched proteomes of WT worms and the long-lived daf-2(lf) and isp-1(lf) mutants.
Figure 4—figure supplement 1
Lyso-IP analyses from different long-lived strains.
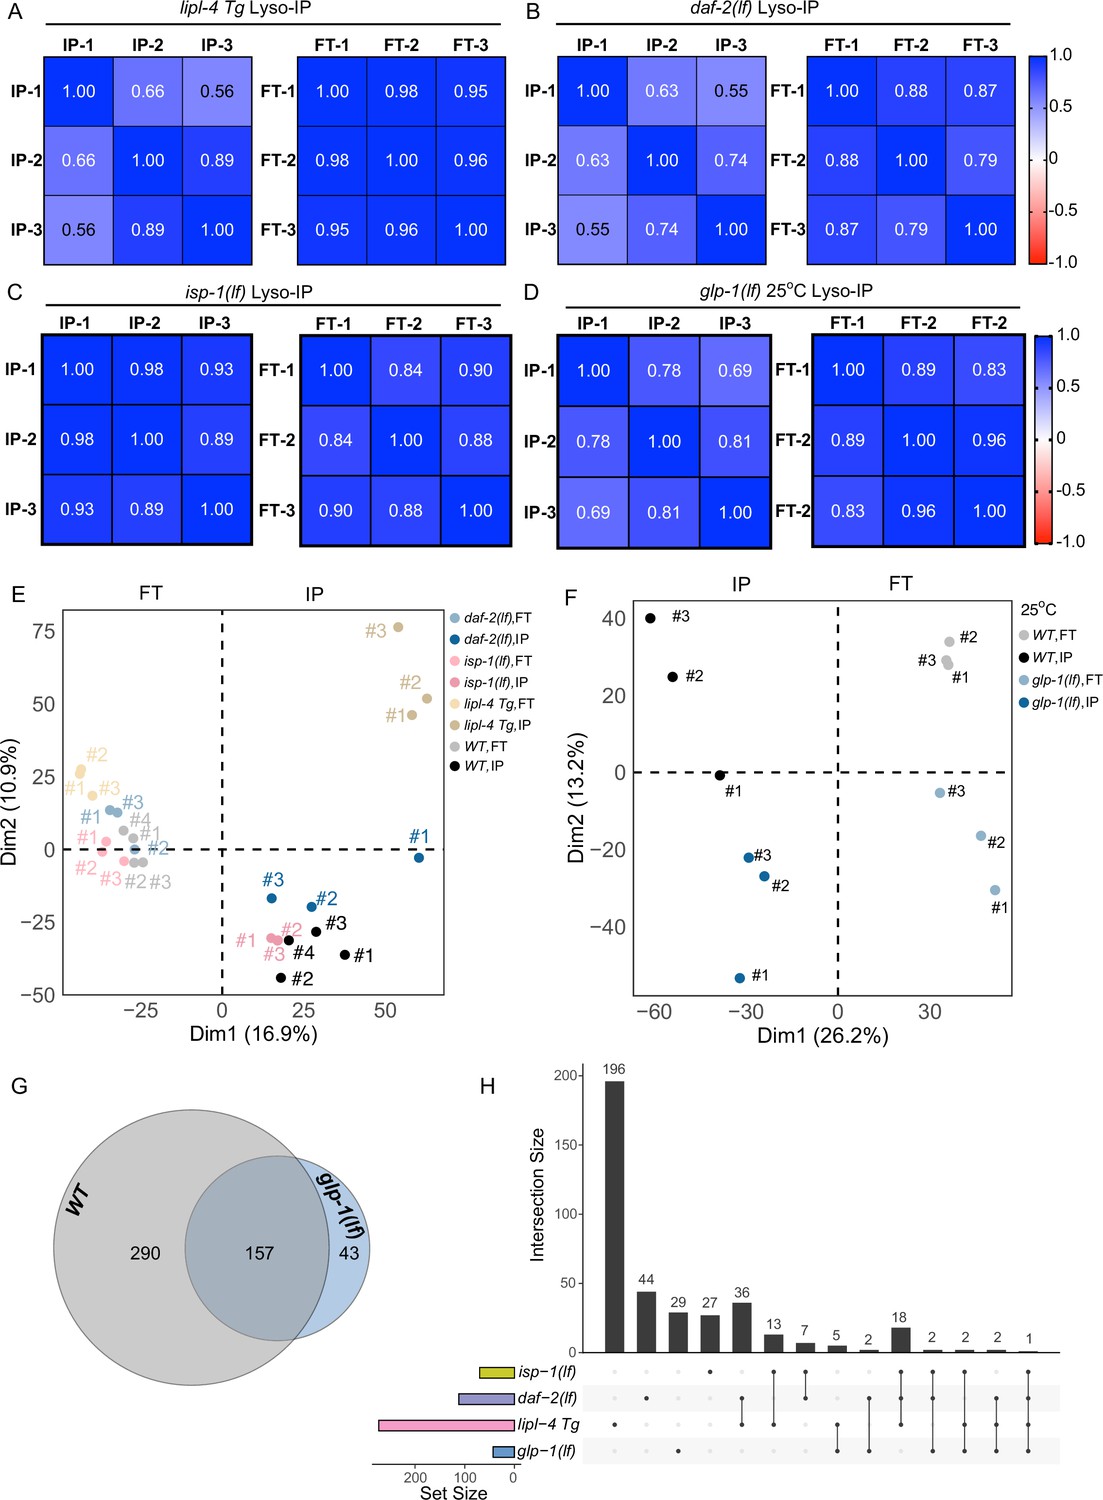
Correlation analysis of three independent biological replicates of Lyso-IP (IP) and Flow-through (FT) from proteomics analyses of the long-lived lipl-4 transgenic strain lipl-4 Tg (A), the daf-2 loss-of-function mutant (daf-2(lf)) (B), the isp-1 loss-of-function mutant (isp-1(lf)) (C) and glp-1 loss-of-function mutant grown at 25°C (glp-1(lf)) (D). (E) Principal components analysis (PCA) of Lyso-IP replicates (IP) and flow-through controls (FT) in LMP-1 Lyso-IP of wild-type (WT), lipl-4 Tg, daf-2(lf), and isp-1(lf) worms. (F) PCA analysis of Lyso-IP replicates (IP) and flow-through controls (FT) in LMP-1 Lyso-IP of WT and glp-1(lf) worms grown at 25°C. (G) Venn diagram showing the overlap between the lysosome-enriched proteomes from WT and glp-1(lf) worms grown at 25°C. (H) Upset graph showing the overlap of lysosome-enriched proteins present in the long-lived worms but absent from WT worms.
Figure 5
Increased enrichment of lysosomal proteins upon lysosomal lipolysis.
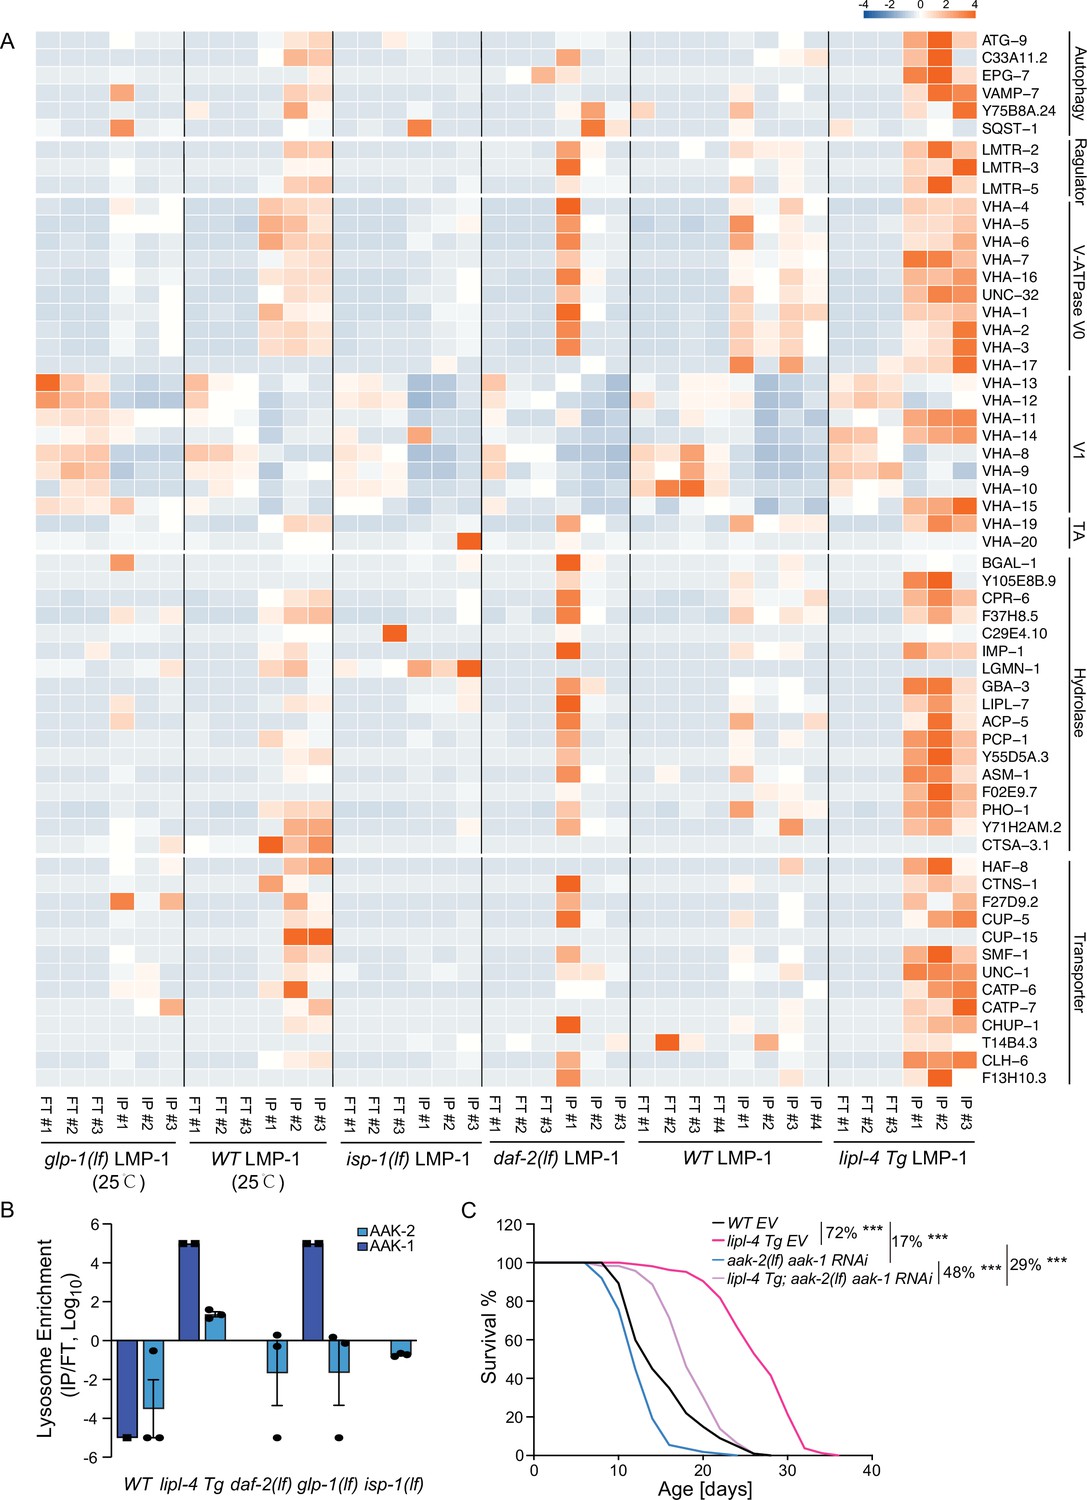
(A) Normalized protein levels (z-score across samples) of autophagy-related components, mTORC1 signaling factors, lysosomal v-ATPase V0, V1, and transporting accessory (TA) subunits, lysosomal hydrolases and transporter proteins from LMP-1 Lyso-IP proteomic analyses of wild-type (WT), lipl-4 Tg, daf-2(lf), and isp-1(lf) worms grown at 20°C and WT and glp-1(lf) worms grown at 25°C. (B) The lysosomal enrichment ratio (Lyso-IP vs. FT) for two homologs of AMP-activated protein kinase (AMPK) catalytic subunits, AAK-1 and AAK-2 in WT, lipl-4 Tg, daf-2(lf), isp-1(lf), and glp-1(lf) worms. (C) Reduction of AMPK using the loss-of-function mutant of aak-2, aak-2(lf) together with aak-1 RNAi knockdown decreases lifespan by 17% and 29% in the WT and lipl-4 Tg background, respectively. As a result, the lifespan extension caused by lipl-4 Tg is reduced from 72% to 48%. ***p < 0.001 by Log-rank test. The lifespan data are also in Supplementary file 8.
Figure 6 with 1 supplement
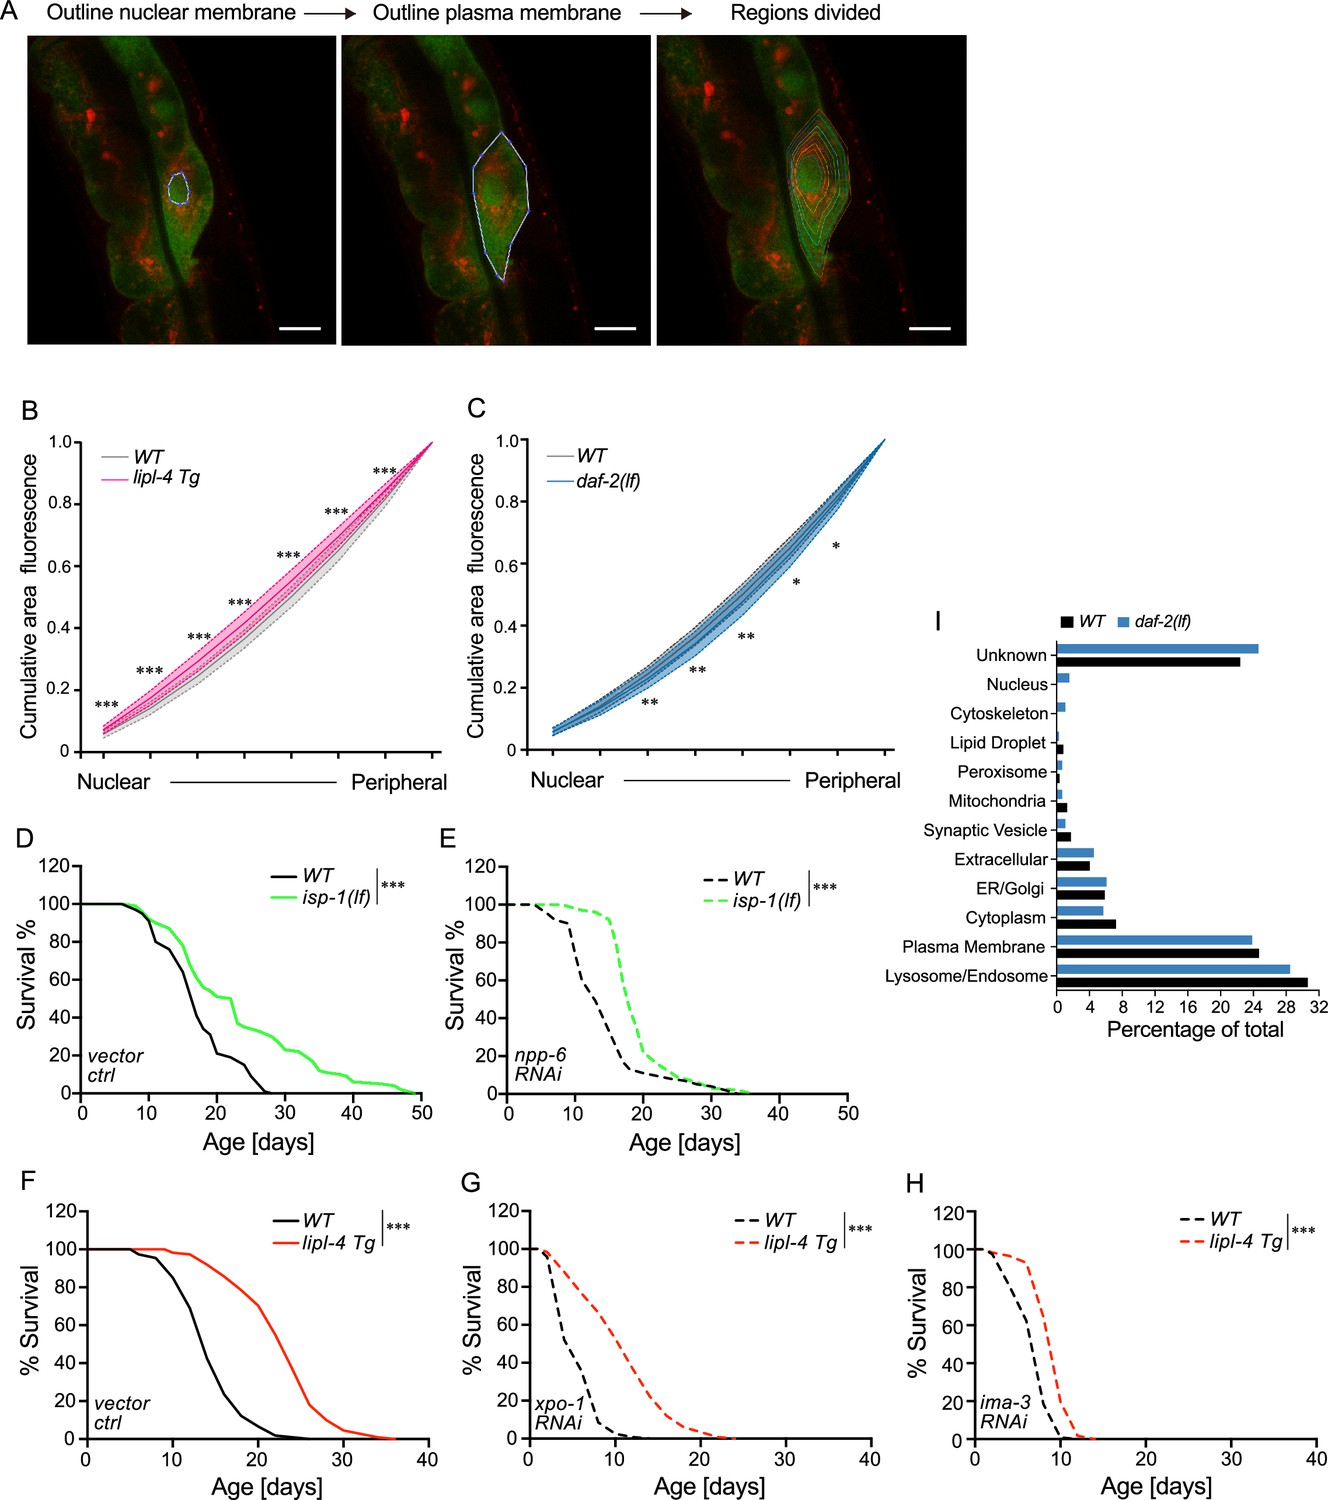
Enhanced lysosome–nucleus proximity contributing to longevity.
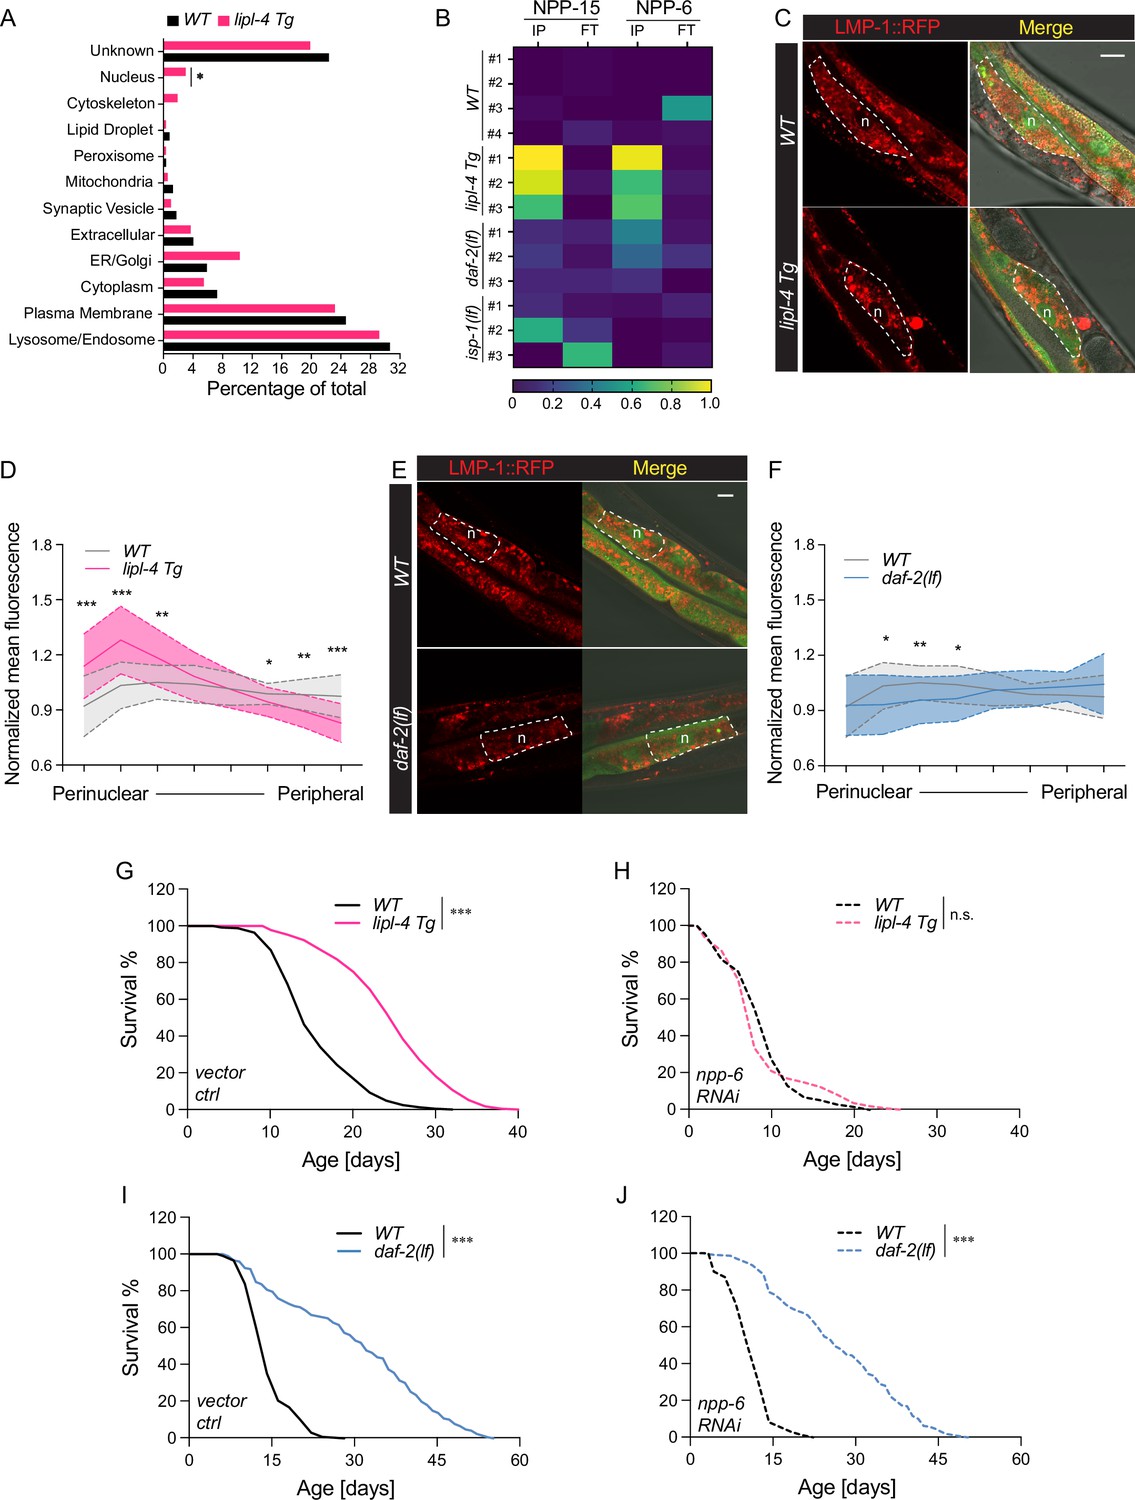
(A) The percentage of proteins with different subcellular localization is compared between lysosome-enriched proteomes from wild-type (WT) and lipl-4 Tg worms. *p = 0.019 by two-sample test for equality of proportions. (B) Heatmap showing the average levels of nucleoporin proteins NPP-6 and NPP-15 in Lyso-IP (IP) and flow-through (FT) samples from WT, lipl-4 Tg, daf-2(lf), and isp-1(lf) worms. Representative images of intestinal cells in WT, lipl-4 Tg (C), and daf-2(lf) (E) worms carrying LMP-1::RFP-3×HA and nucleus-enriched GFP, showing the accumulation of lysosomes around the perinuclear region in the lipl-4 Tg but not daf-2(lf) worms. Dashed lines circle intestinal cells and n marks the nucleus. Scale bar = 20 μm. Line graph showing the spatial distribution of lysosomes from the nuclear to peripheral region quantified by normalized regional RFP fluorescence signals in intestinal cells of WT, lipl-4 Tg (D), and daf-2(lf) (F) worms. N = 50 WT/33 lipl-4 Tg, 33 WT/28 daf-2(lf). Data are represented as mean ± standard deviation (SD). p values for (D) (from left to right): 1.23 × 10⁻⁷, 2.25 × 10⁻⁵, 0.00322, 0.368, 0.273, 0.0447, 0.00268, 1.20 × 10⁻⁵; p values for (F) (from left to right): 0.633, 0.0211, 0.00259, 0.0359, 0.767, 0.151, 0.106, 0.0671. lipl-4 Tg worms show lifespan extension compared to WT worms (G), which is fully suppressed by RNAi knockdown of npp-6 (H). ***p < 0.001, n.s. p > 0.05 by Log-rank test. daf-2(lf) worms show lifespan extension compared to WT worms (I), which is not affected by npp-6 RNAi knockdown (J). ***p < 0.001 by Log-rank test. The lifespan data are also in Supplementary file 8.
Figure 6—figure supplement 1
Lysosomal positioning in longevity regulation.
(A) Summary of the method flow for quantifying the lysosomal distribution in intestinal cells of C. elegans. Scale bar = 10 μm. Curve graph showing the normalized accumulated intensity of lysosomal signals from the nuclear to the peripheral region in wild-type (WT), lipl-4 Tg (B), and daf-2(lf) (C) animals. *p < 0.05; **p < 0.01, ***p < 0.001, ****p < 0.0001, n.s. p > 0.05 by Student’s t-test (unpaired, two-tailed) for each region. N = 50 WT/33 lipl-4 Tg, 33 WT/28 daf-2(lf). Data are represented as mean ± standard deviation (SD). p values for (B) (from left to right): 2.65 × 10⁻⁸, 3.19 × 10⁻⁸, 7.93 × 10⁻⁸, 3.62 × 10⁻⁷, 4.79 × 10⁻⁶, 2.98 × 10⁻⁵, 4.41 × 10⁻⁵; p values for (C) (from left to right): 0.357, 0.0529, 0.00611, 0.00246, 0.00985, 0.0261, 0.0423. isp-1(lf) worms show lifespan extension compared to WT worms (D), which is not affected by RNAi knockdown of npp-6 (E). ***p < 0.001 by Log-rank test. lipl-4 Tg worms show lifespan extension compared to WT worms (F), which is not affected by xpo-1 RNAi knockdown (G) and is partially suppressed by RNAi knockdown of ima-3 (H). ***p < 0.001 by Log-rank test.The lifespan data are also in Supplementary file 8. (I) The percentage of proteins with different subcellular localization is compared between lysosome-enriched proteomes from WT and daf-2 worms.
Figure 7 with 2 supplements
Lysosome-enriched proteome identified with Cystinosin.
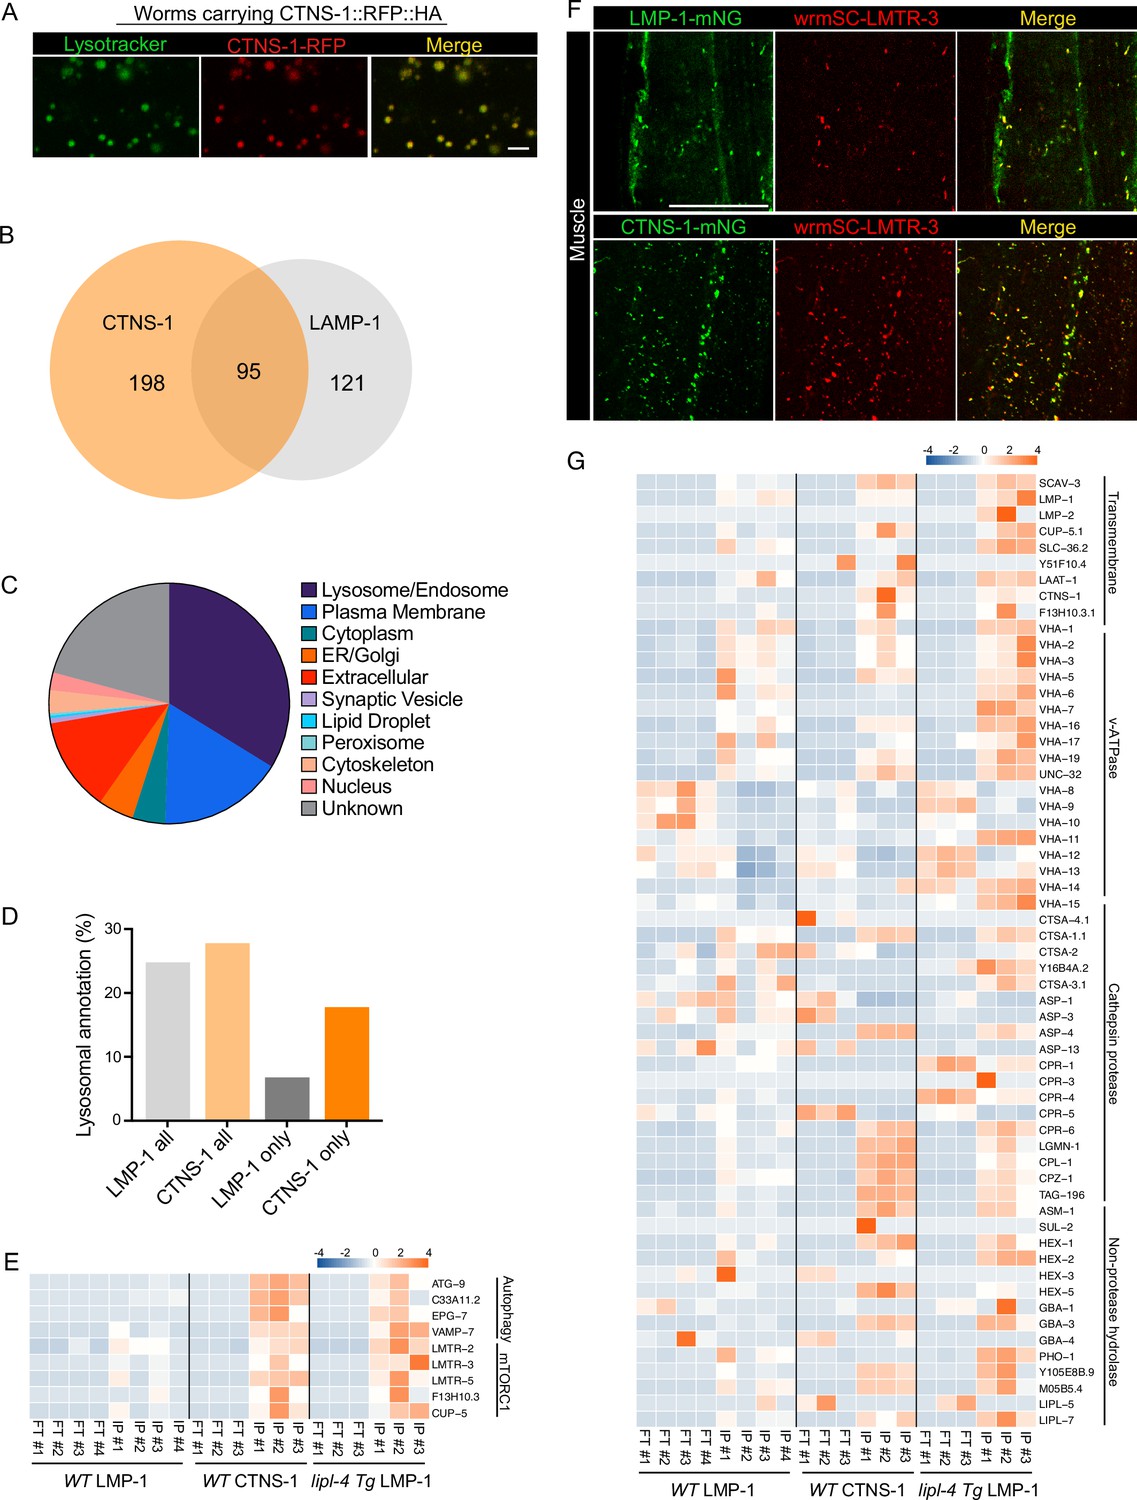
(A) Example images of transgenic strains carrying CTNS-1 Lyso-Tag (CTNS-1::RFP-3×HA) with LysoTracker staining to mark lysosomes in vivo. Scale bar = 5 µm. (B) Venn diagram showing the overlap between lysosome-enriched proteomes using LMP-1 Lyso-IP and CTNS-1 Lyso-IP. (C) Pie chart showing subcellular location categories of lysosome-enriched proteins. (D) The proportion of candidates with lysosomal localization annotation in different candidate groups. ‘LMP-1 all’ and ‘CTNS-1 all’, all candidates from LMP-1 Lyso-IP and CTNS-1 Lyso-IP, respectively; ‘LMP-1 only’ and ‘CTNS-1 only’, candidates only identified from LMP-1 Lyso-IP or CTNS-1 Lyso-IP, respectively. (E) Normalized protein levels (z-score across samples) of autophagy-related components and mTORC1 signaling factors from CTNS-1 Lyso-IP proteomic analyses of wild-type (WT) worms and LMP-1 Lyso-IP proteomic analyses of WT and lipl-4 Tg worms. (F) Representative muscle images in the wrmScarlet::LMTR-3 knock-in line crossed with either LMP-1::mNeonGreen knock-in line or CTNS-1::mNeonGreen knock-in line. Scale bar = 20 μm. (G) Normalized protein levels (z-score across samples) of previously annotated lysosomal proteins from LMP-1 Lyso-IP proteomic analyses of WT and lipl-4 Tg worms and CTNS-1 Lyso-IP proteomic analyses of WT worms.
Figure 7—figure supplement 1
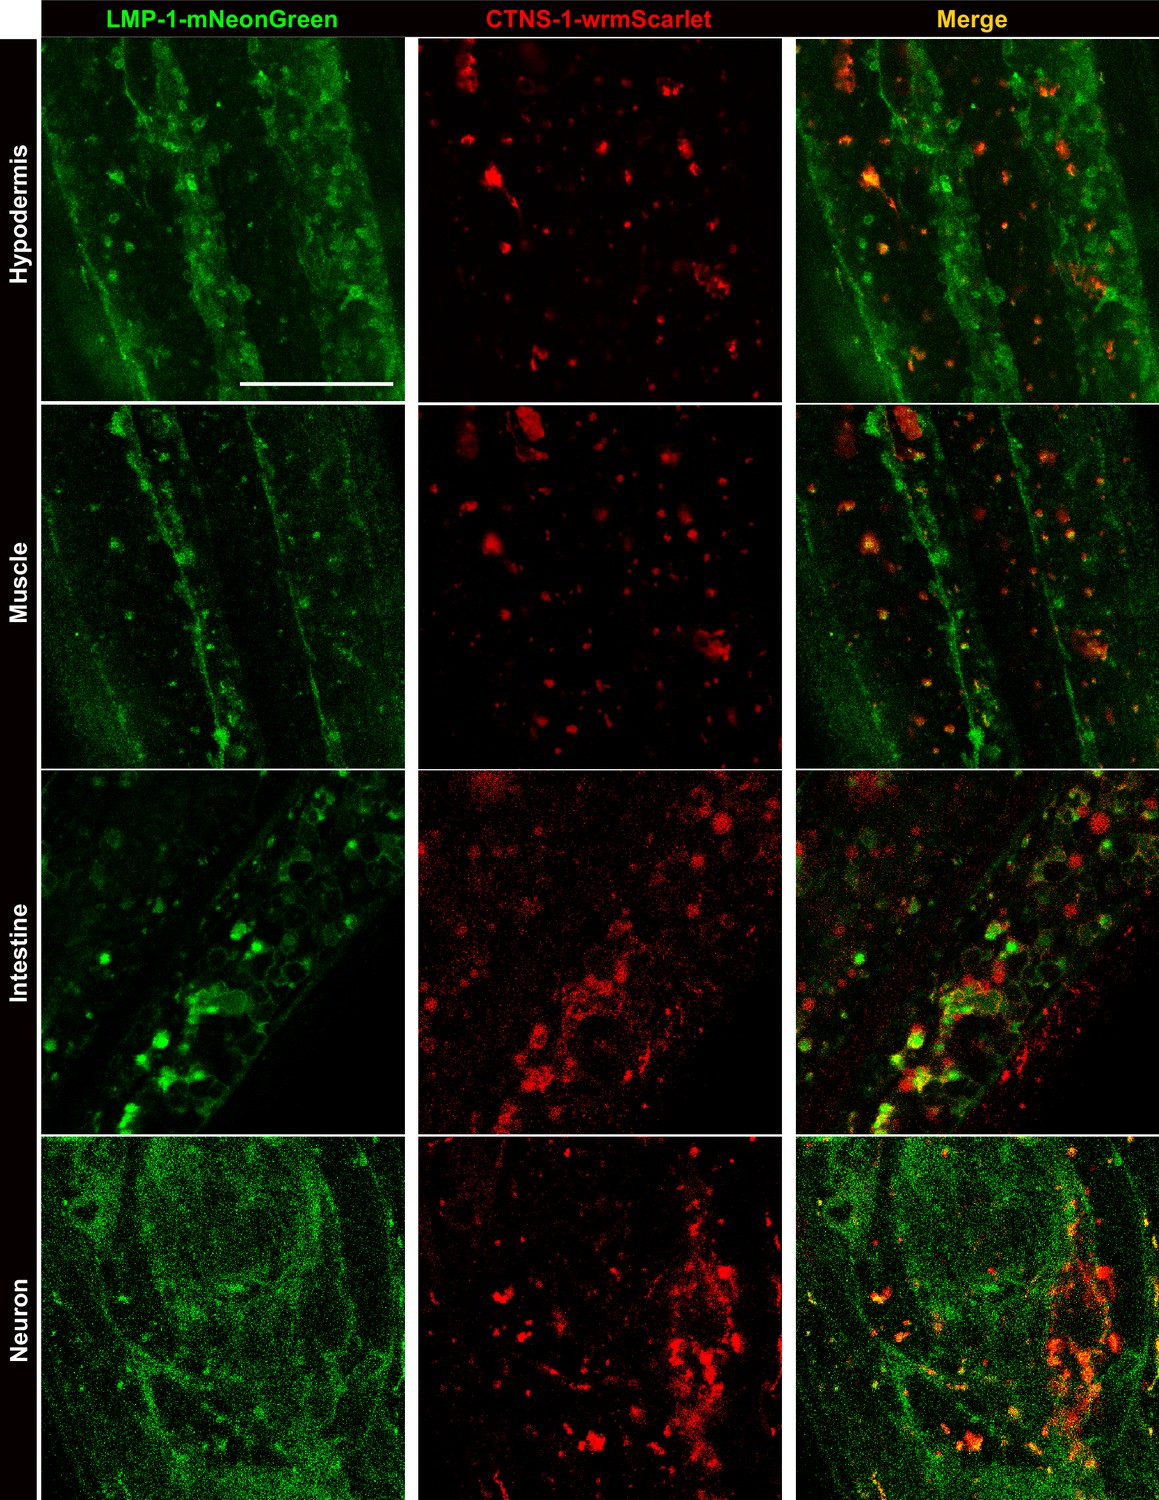
The colocalization between LMP-1::mNeonGreen and CTNS-1::wrmScarlet in different tissues.
Representative images of knock-in lines with both LMP-1::mNeonGreen and CTNS-1::wrmScarlet show partial colocalization between LMP-1 and CTNS-1 signals in different tissues. Scale bar = 20 μm.
Figure 7—figure supplement 2
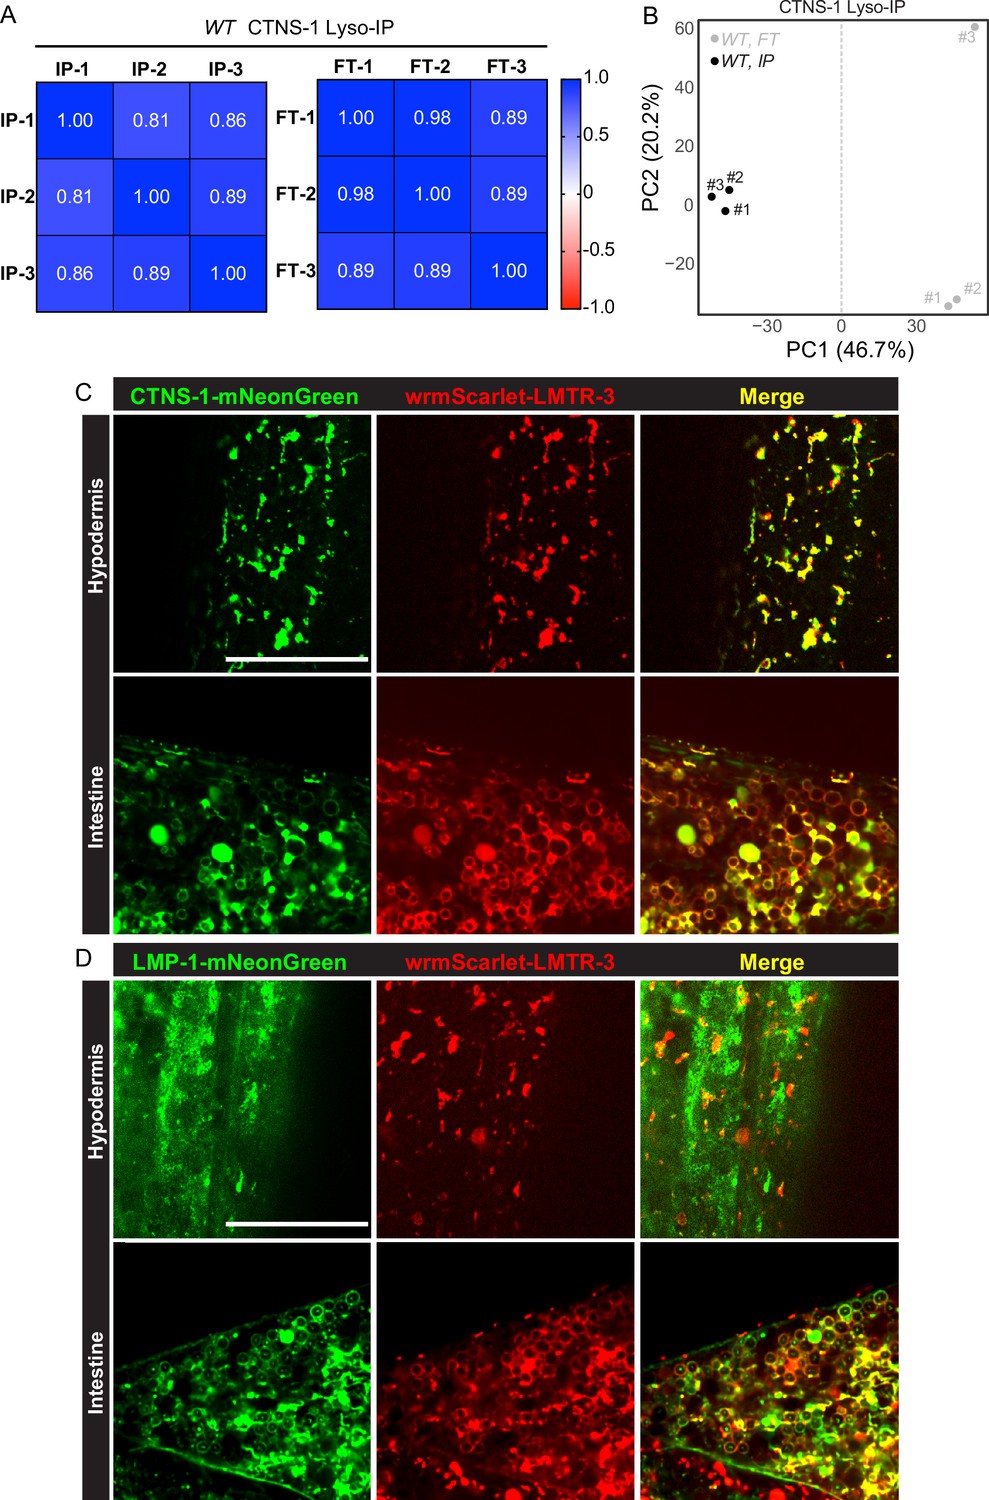
CTNS-1 Lyso-IPs and LMTR-3 imaging analyses.
(A) Correlation analysis of three independent biological replicates of CTNS-1 Lyso-IP (IP) and Flow-through (FT). (B) Principal components analysis (PCA) of three independent biological replicates of CTNS-1 Lyso-IP (IP) and Flow-through (FT). Example images of knock-in lines with wrmScarlet::LMTR-3 and CTNS-1::mNeonGreen (C) and LMP-1::mNeonGreen (D) in hypodermis and intestine. Scale bar = 20 μm.
Figure 8 with 1 supplement

Lysosome-enriched proteins regulating lysosomal functions.
Confocal fluorescence microscopy images of intestinal cells in worms stained with LysoSensor DND-189 and treated with empty vector (A), slc36.2 RNAi (B), R144.6 RNAi (C), vha-5 RNAi (D), and unc-32 RNAi (E). Scale bar = 50 μm. RNAi knockdown of unc-32 or vha-5 decreases the lysosome number (****p < 0.0001) (F) but increases the lysosome size (****p < 0.0001, ***p < 0.001) (G). The average lysosome number and size per pair of intestinal cells were quantified. Data are shown as mean ± standard deviation (SD). Student t-test (unpaired, two-tailed) was performed between the empty vector and RNAi-treated groups. At least three independent experiments with ~10 worms in each were performed for each condition. n.s. p > 0.05, (H) RNAi knockdown of R144.6 and unc-32 (***p < 0.001) increase and decrease lysosomal pH, respectively. Lysosomal pH was calculated based on LysoSensor’s lifetime measured by Fluorescence Lifetime Microscopy. Data are shown as mean ± SD. Student’s t-test (unpaired, two-tailed) was performed between the empty vector and RNAi-treated groups. Two independent experiments with at least five worms in each were performed in R144.6 RNAi and unc-32 RNAi conditions. The vha-5 and slc36.2 RNAi knockdown did not show significant changes in one replicate and were not retested with another replicate. n.s. p > 0.05. (I) The structure of the R144.6 protein predicted by AlphaFold2 supports it as a solute carrier family transporter. (J) Confocal fluorescence microscopy images show that mNeonGreen signals from endogenously tagged R144.6 colocalize with LysoTracker Red signals in the hypodermis. Scale bar = 10 μm.
Figure 8—figure supplement 1
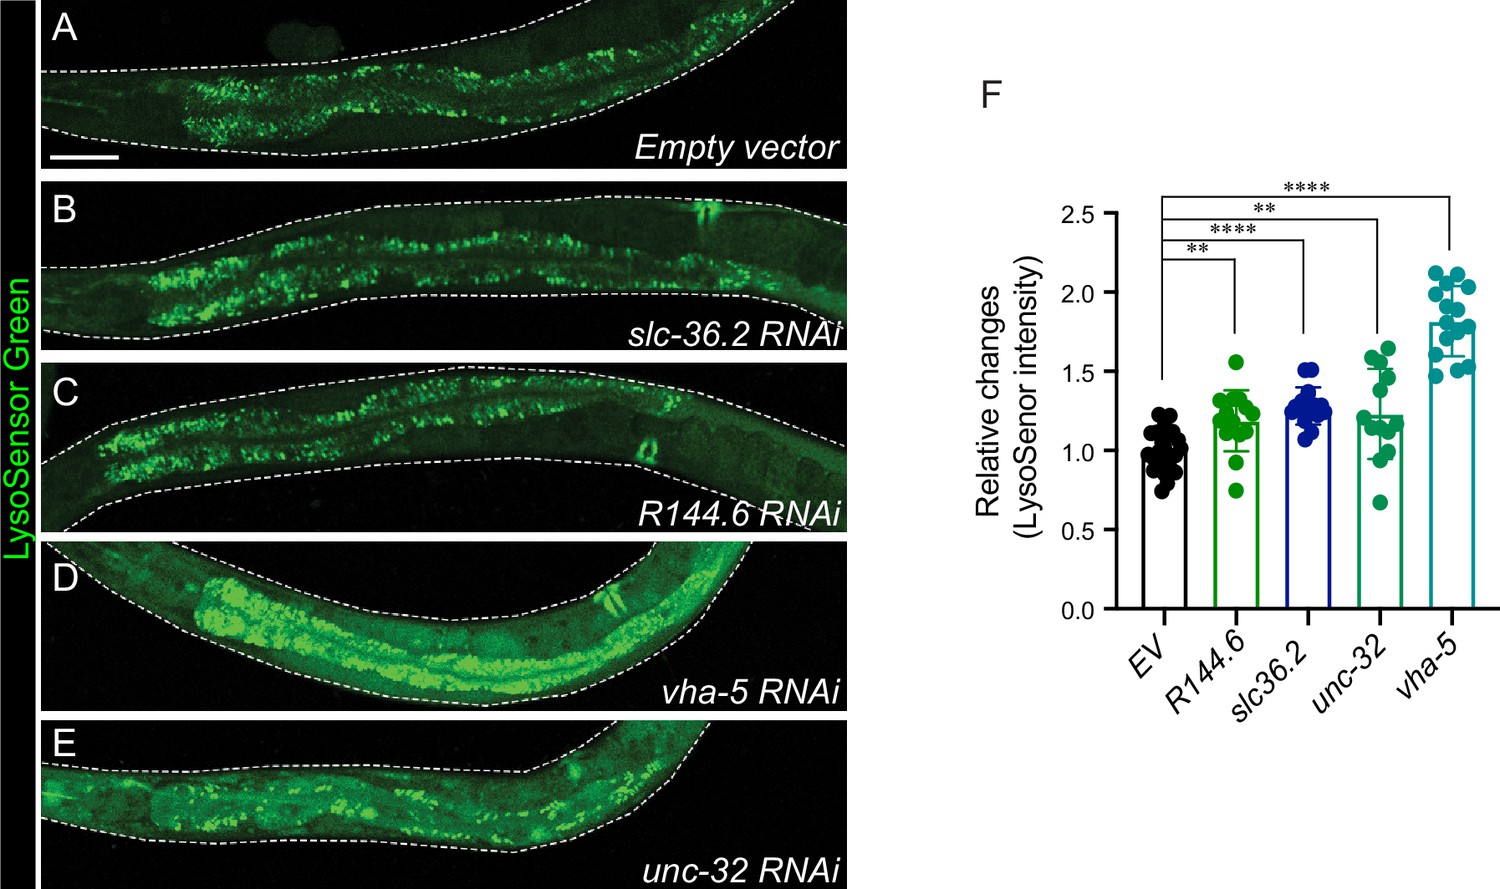
LysoSensor intensity quantification in five candidates.
The LysoSensor signals are visualized by confocal fluorescence microscopy in empty vector (A), slc36.2 RNAi (B), R144.6 RNAi (C), vha-5 RNAi (D), and unc-32 RNAi (E) conditions. Scale bar = 50 μm. The relative LysoSensor changes were quantified in (F). ~10 worms were quantified in each condition. Data are shown as mean ± standard deviation (SD). Student’s t-test (unpaired, two-tailed) was performed between the empty vector and RNAi-treated groups (**p < 0.01, ****p < 0.0001).
Additional files
-
Supplementary file 1
Lysosome-enriched proteins identified from LMP-1 Lyso-IP using wild-type (WT) worms.
- https://cdn.elifesciences.org/articles/85214/elife-85214-supp1-v2.xlsx
-
Supplementary file 2
Lysosome-enriched proteome exhibits tissue specificity.
- https://cdn.elifesciences.org/articles/85214/elife-85214-supp2-v2.xlsx
-
Supplementary file 3
Lysosome-enriched proteins identified from LMP-1 Lyso-IP using lipl-4 Tg worms.
- https://cdn.elifesciences.org/articles/85214/elife-85214-supp3-v2.xlsx
-
Supplementary file 4
Lysosome-enriched proteins identified from LMP-1 Lyso-IP using daf-2(lf) mutant.
- https://cdn.elifesciences.org/articles/85214/elife-85214-supp4-v2.xlsx
-
Supplementary file 5
Lysosome-enriched proteins identified from LMP-1 Lyso-IP using isp-1(lf) mutant.
- https://cdn.elifesciences.org/articles/85214/elife-85214-supp5-v2.xlsx
-
Supplementary file 6
Lysosome-enriched proteins identified from LMP-1 Lyso-IP using glp-1(lf) mutant in 25°C.
- https://cdn.elifesciences.org/articles/85214/elife-85214-supp6-v2.xlsx
-
Supplementary file 7
Lysosome-enriched proteins identified from LMP-1 Lyso-IP using wild-type (WT) worms in 25°C.
- https://cdn.elifesciences.org/articles/85214/elife-85214-supp7-v2.xlsx
-
Supplementary file 8
Summary of lifespan analyses.
- https://cdn.elifesciences.org/articles/85214/elife-85214-supp8-v2.xlsx
-
Supplementary file 9
Lysosome-enriched proteins identified from CTNS-1 Lyso-IP using wild-type (WT) worms.
- https://cdn.elifesciences.org/articles/85214/elife-85214-supp9-v2.xlsx
-
Supplementary file 10
LysoSensor screening of lysosome-enriched proteins shared between LMP-1 and the CTNS-1 Lyso-Ips.
- https://cdn.elifesciences.org/articles/85214/elife-85214-supp10-v2.xlsx
-
Supplementary file 11
File list of mass spectrum samples.
- https://cdn.elifesciences.org/articles/85214/elife-85214-supp11-v2.xlsx
-
MDAR checklist
- https://cdn.elifesciences.org/articles/85214/elife-85214-mdarchecklist1-v2.docx
-
Source code 1
Matlab code for lysosome distribution quantification.
- https://cdn.elifesciences.org/articles/85214/elife-85214-code1-v2.zip
Download links
A two-part list of links to download the article, or parts of the article, in various formats.
Downloads (link to download the article as PDF)
Open citations (links to open the citations from this article in various online reference manager services)
Cite this article (links to download the citations from this article in formats compatible with various reference manager tools)
Organelle proteomic profiling reveals lysosomal heterogeneity in association with longevity
eLife 13:e85214.
https://doi.org/10.7554/eLife.85214


