Competing neural representations of choice shape evidence accumulation in humans
- Department of Psychology, Carnegie Mellon University, United States
- Center for the Neural Basis of Cognition, United States
- Carnegie Mellon Neuroscience Institute, United States
- Department of Biomedical and Health Informatics, University of Washington, United States
- Department of Mathematics, University of Pittsburgh, United States
- Department of Biomedical Engineering, Carnegie Mellon University, United States
Figures
Figure 1 with 4 supplements
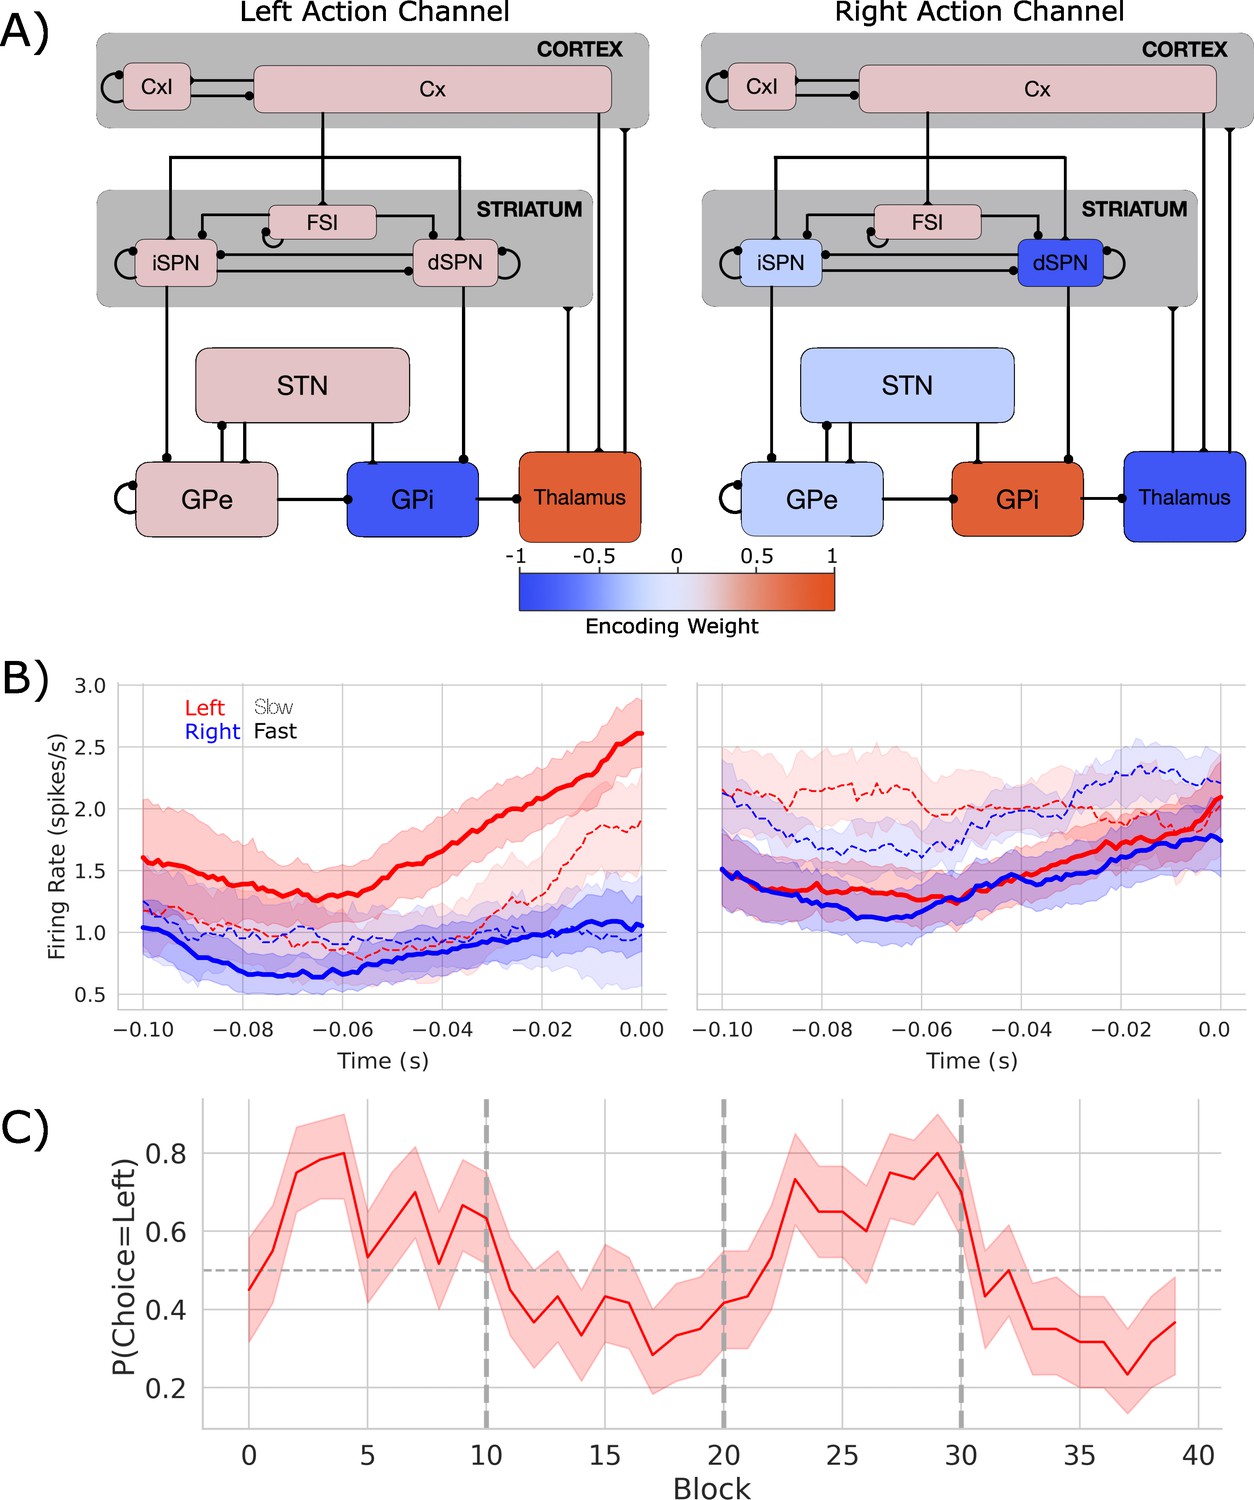
Biologically based cortico-basal ganglia-thalamic (CBGT) network dynamics and behavior.
(A) Each CBGT nucleus is organized into left and right action channels with the exception of a common population of striatal fast spiking interneurons (FSIs) and cortical interneurons (CxI). Values show encoded weights for left and right action channels when a left action is made. Network schematic adapted from Figure 1 of Vich et al., 2022. (B) Firing rate profiles for dSPNs (left panel) and iSPNs (right panel) prior to stimulus onset (t = 0) for a left choice. SPN activity in left and right action channels is shown in red and blue, respectively. Slow and fast decisions are shown with dashed and solid lines, respectively. (C) Choice probability for the CBGT network model. The reward for left and right actions changed every 10 trials, marked by vertical dashed lines. The horizontal dashed line represents chance performance.
Figure 1—figure supplement 1

Simulated cortico-basal ganglia-thalamic (CBGT) nuclei firing rates for a left decision.
Each panel shows the firing rates for a specific CBGT nucleus starting 100 ms prior to a left decision. The decision threshold for thalamus (30 spikes/s) is marked with a horizontal gray line. Note that the y-axes have different limits for different nuclei due to differences of scale in their firing rates.
Figure 1—figure supplement 2

Distributions of cortico-basal ganglia-thalamic (CBGT) nuclei firing rates for slow, intermediate, and fast networks.
Each panel shows the distribution of mean firing rates by CBGT nucleus for each of 300 networks sampled. Mean firing rates are shown for each nucleus for slow (red marker), intermediate (black star), and fast (green marker) networks. Again, note the differences of scale in firing rates over nuclei.
Figure 1—figure supplement 3
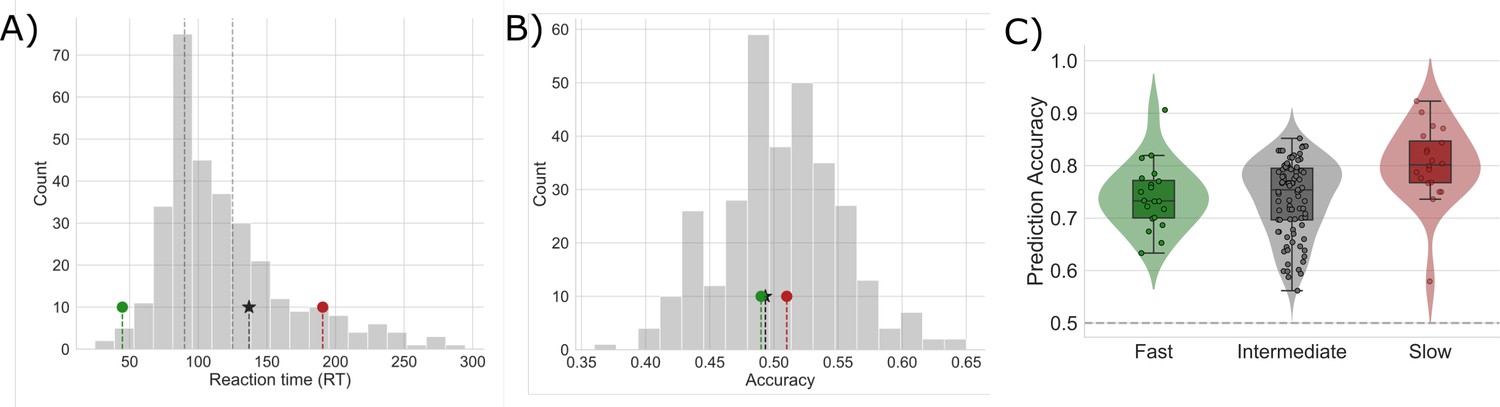
Mean reaction time and accuracy for slow, intermediate, and fast networks.
(A) The distribution of median reaction times (RTs) for each sampled network. The median RT for sample fast (green marker), intermediate (black star), and slow (red marker) networks are shown. Dashed vertical lines mark the first and second tertiles of the RT distribution. (B) The distributions of mean accuracies for each network. (C) Prediction accuracy for each type of sampled network. The horizontal dashed line represents chance prediction performance.
Figure 1—figure supplement 4
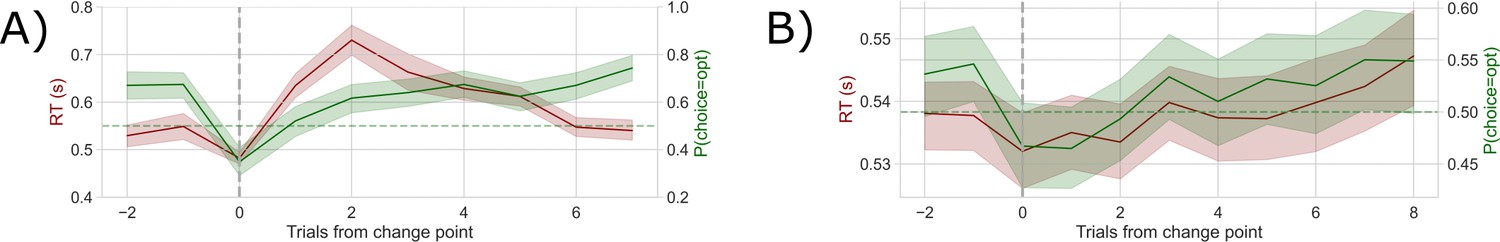
Simulated and human behavior.
Change point evoked reaction times are shown in red and accuracy, or the probability of selecting the optimally rewarding choice, is shown in green. Chance is marked as a green horizontal dashed line. The change point is marked by the vertical gray line. (A) Simulated behavior. (B) Human behavior.
Figure 2 with 1 supplement
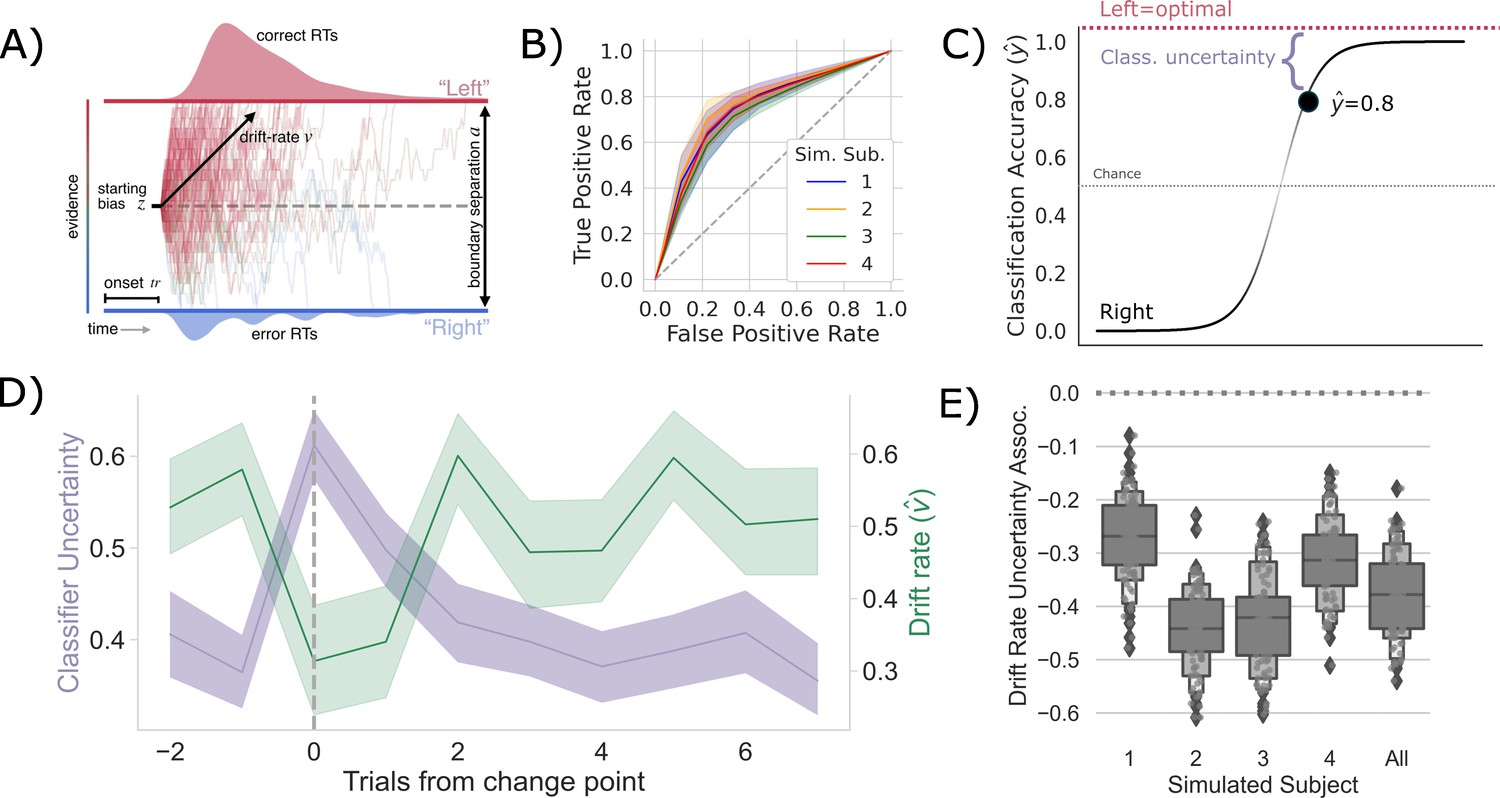
Competition between action plans should drive evidence accumulation.
(A) Decision parameters were estimated by modeling the joint distribution of reaction times and responses within a drift diffusion framework. (B) Classification performance for single-trial left and right actions shown as an Receiver Operating Characteristic (ROC) curve. The gray dashed line represents chance performance. (C) Predicted left and right responses. The distance of the predicted response from the optimal choice represents uncertainty for each trial. For example, here the predicted probability of a left response on the first trial is 0.8. The distance from the optimal choice on this trial and, thereby, the uncertainty , is 0.2. (D) Change point-evoked uncertainty (lavender) and drift rate (green). The change point is marked by a dashed line. (E) Bootstrapped estimates of the association between uncertainty and drift rate. Results for individual participants are presented along with aggregated results.
Figure 2—figure supplement 1

Competition between action plans drives evidence accumulation for fast, intermediate, and slow networks.
(A) Classifier uncertainty (lavender) and estimated drift rate (fast: green, intermediate: gray, and slow: red) dynamics. (B) Bootstrapped estimates of the association between classifier uncertainty and drift rate for each type of network.
Figure 3 with 4 supplements
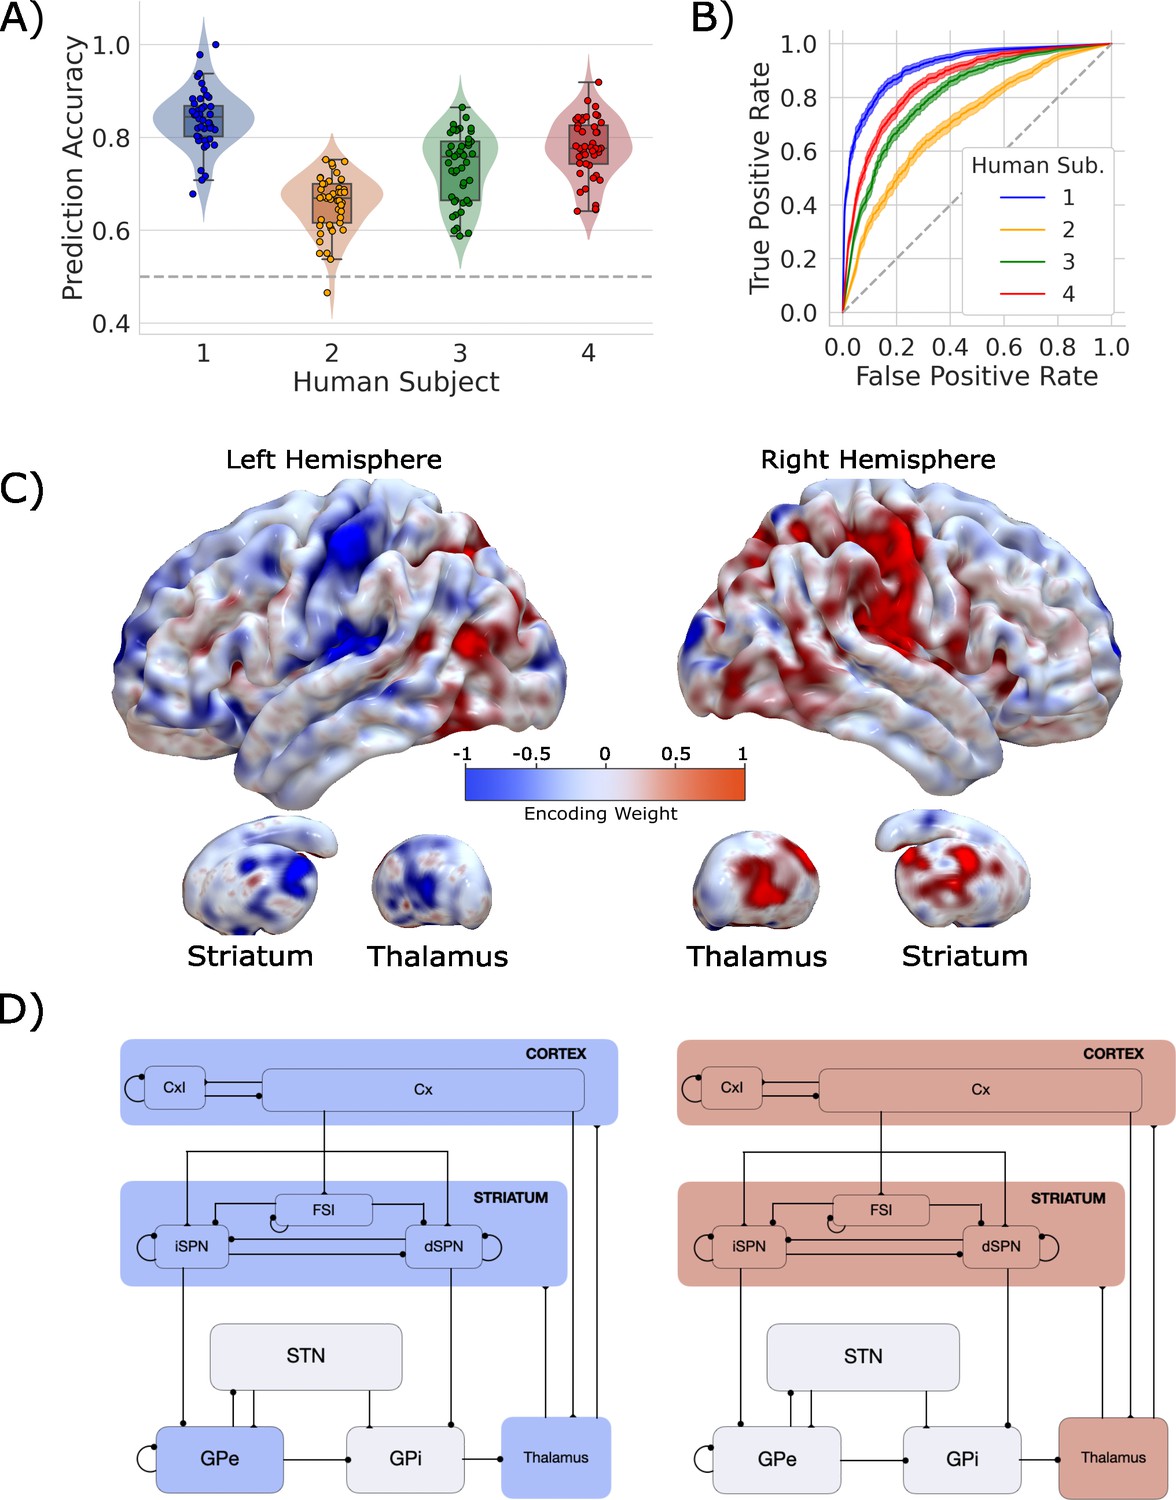
Single-trial prediction of action plan competition in humans.
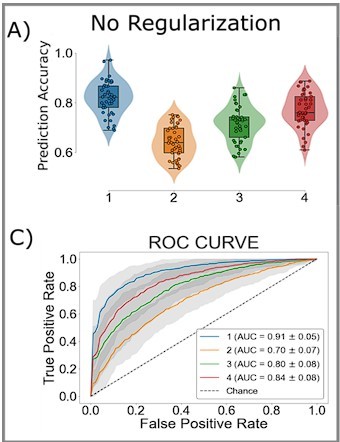
(A) Overall classification accuracy for single-trial actions for each participant. Each point corresponds to the performance for each of the 45 folds in our leave-one-run-out cross-validation procedure. (B) Classification performance for single-trial actions shown as an ROC curve. The gray dashed line represents chance performance. (C) Participant-averaged encoding weight maps in standard space for both hemispheres. (D) The mean encoding weights within each cortico-basal ganglia-thalamic (CBGT) node in both hemispheres. See encoding weight scale above for reference.
Figure 3—figure supplement 1

Experimental design.
The probability of reward for the statistically optimal target (conflict; y-axis) and the rate at which the optimal target shifted (volatility; x-axis) were manipulated according to this design, with each point representing a combination of the two variables. High conflict resulted in a smaller difference in the probability of reward between the optimal and suboptimal targets, while high volatility resulted in frequent switches in the optimal target selection.
Figure 3—figure supplement 2
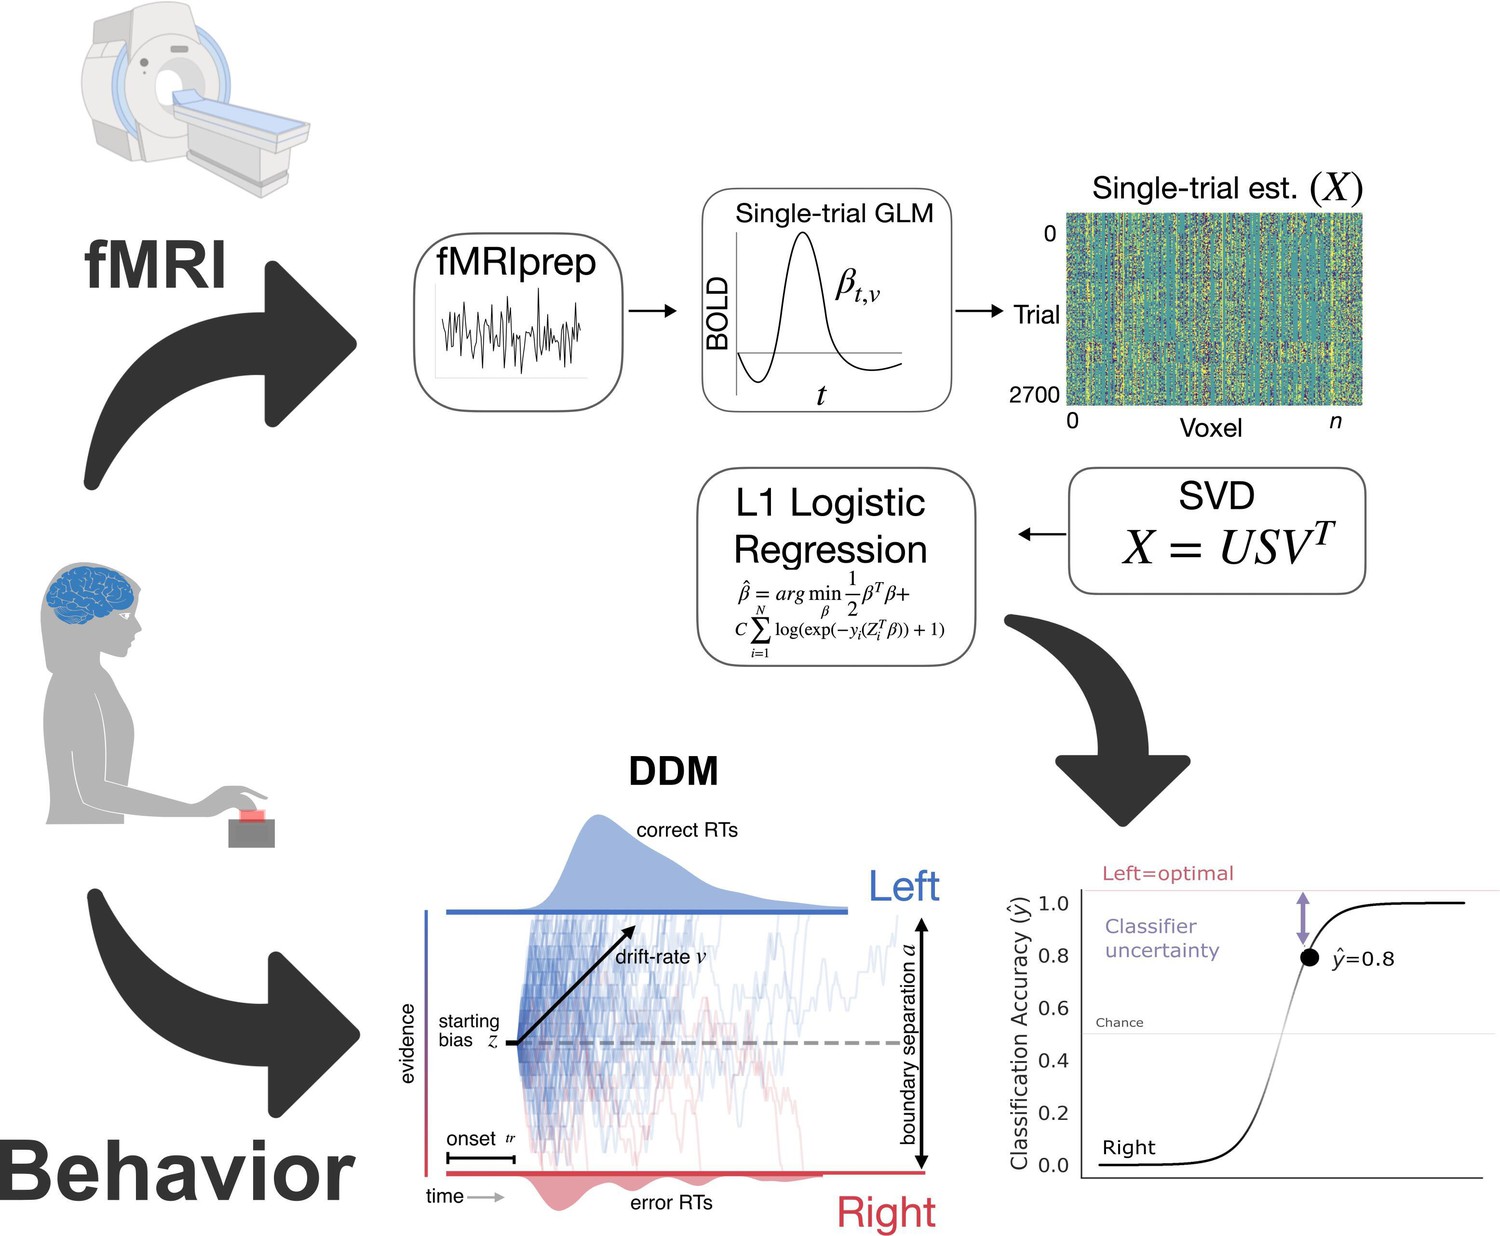
Analysis method.
Inputs. Behavioral responses in the form of reaction time and accuracy, along with trial-by-trial hemodynamic responses, were collected as participants learned the task. In the case of the simulated cortico-basal ganglia-thalamic (CBGT) network, this step involved simulating responses to experimental manipulations. Preprocessing. Data underwent standard preprocessing and then we estimated single-trial hemodynamic responses. Cross-validated prediction model. We reduced the dimensionality of the trial estimate matrix, X, using singular-value decomposition. Then we conducted logistic regression with a sparsity penalty (L1-norm). Outputs. For the imaging data, we predicted left or right responses, here coded as 0 or 1. We calculated classifier uncertainty from the unthresholded response prediction. The distance of this predicted response from the optimal choice represents classifier uncertainty for each trial. Here, the predicted probability of a left response is 0.8. The distance from the optimal choice on this trial, and, thereby, the classifier uncertainty is 0.2. The joint distribution of reaction times and accuracies were also fitted to estimate latent decision parameters using the drift diffusion modelDrift Diffusion Model (DDM).
Figure 3—figure supplement 3

Encoding maps in standardized space for each participant.
Rows represent individual participants. Columns refer to left and right views of the whole brain. Thalamus and striatum are shown beneath each cortical map. Values are z-scored.
Figure 3—figure supplement 4
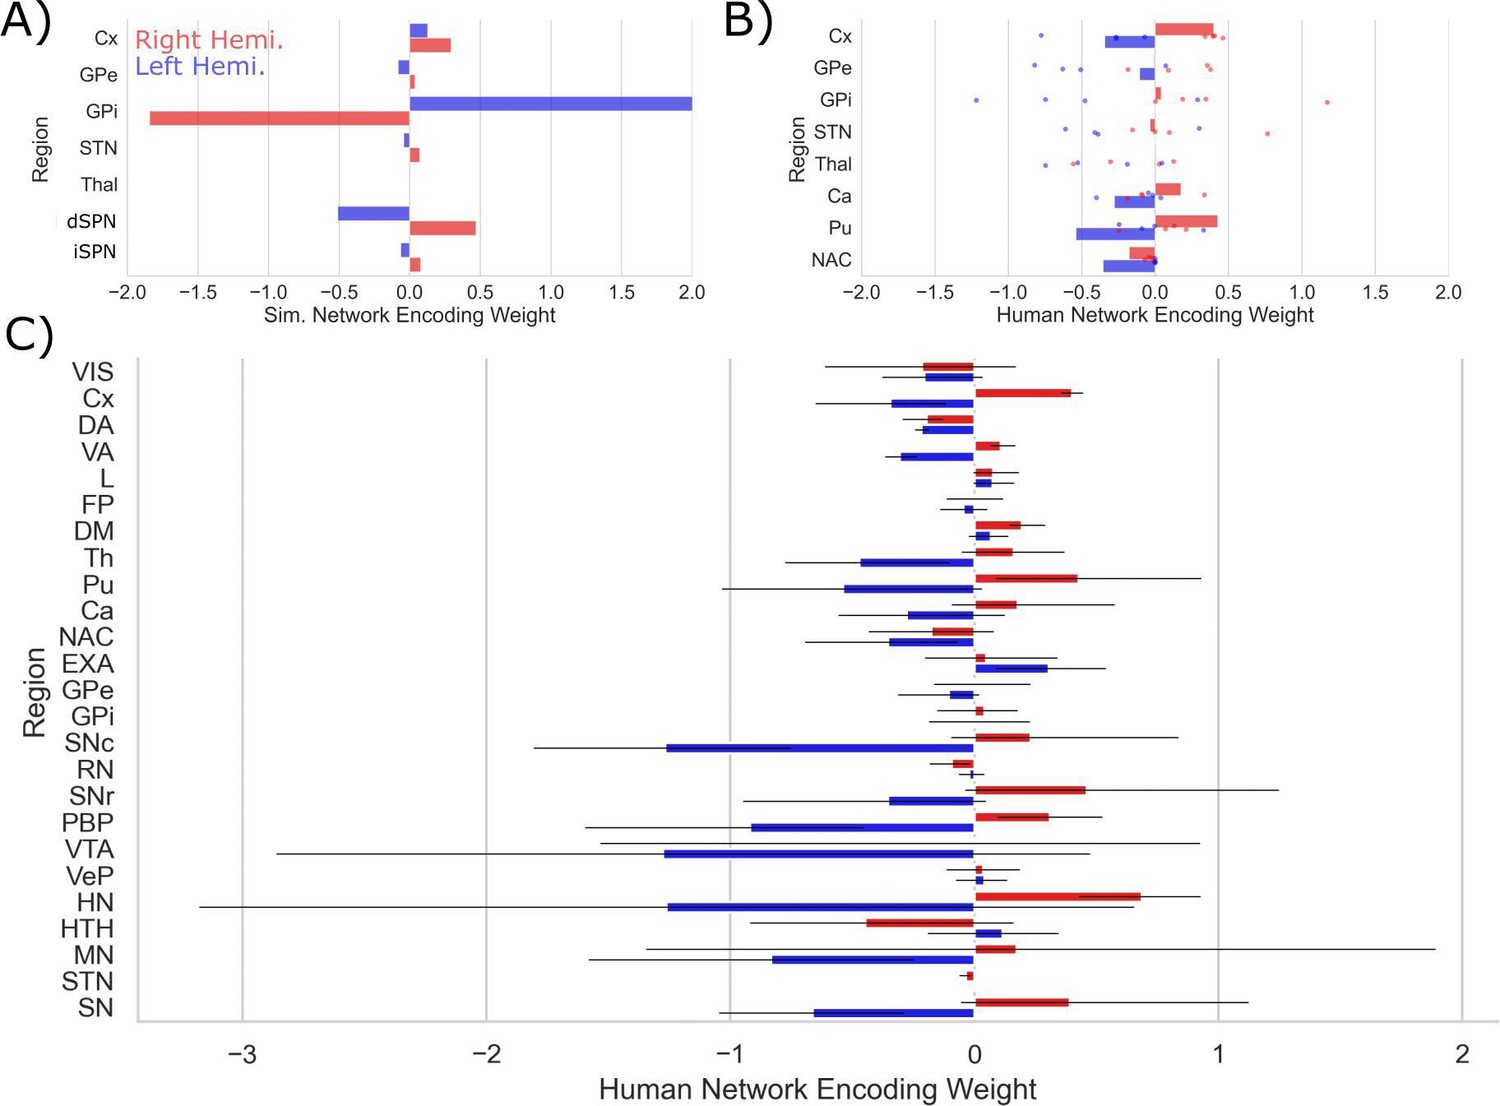
Encoding patterns by CBGT node.
(A) Simulated CBGT encoding weights. (B) Human CBGT encoding weights for comparison with the simulated CBGT network results. Each point represents the average result for each participant. Bars represent participant-averaged data. (C) The full set of human CBGT encoding weights for all captured nodes from whole-brain imaging. Gray error bars represent 95% CIs over participants. Left hemisphere weights are marked in blue and right hemisphere weights are marked in red.
Figure 4 with 1 supplement
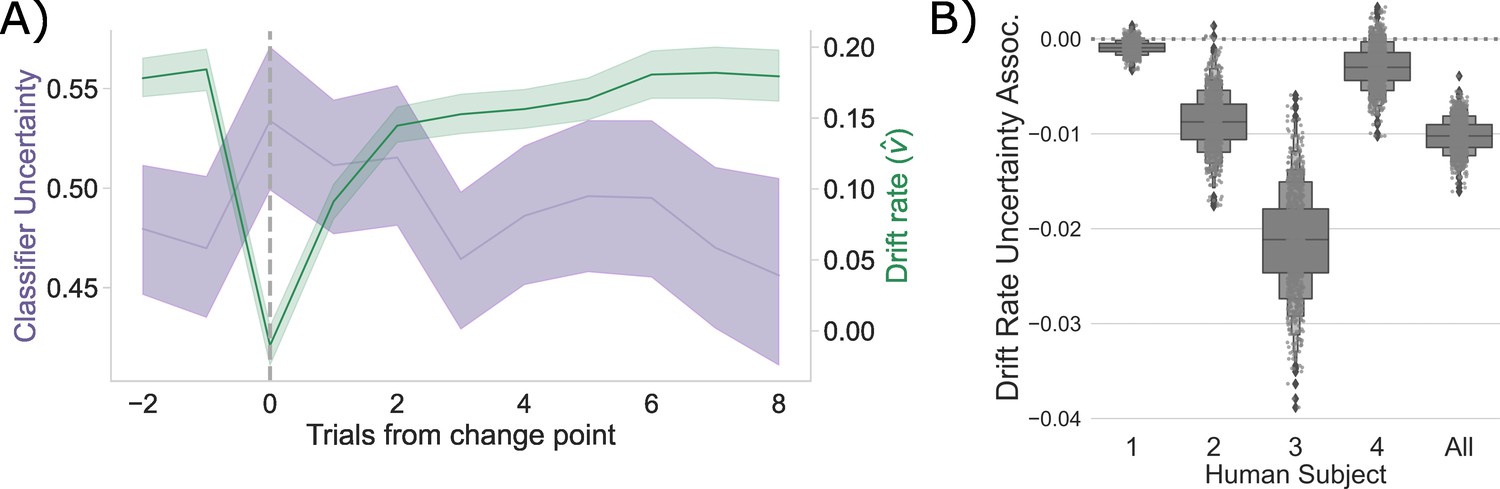
Competition between action plans drives evidence accumulation in humans.
(A) Classifier uncertainty (lavender) and estimated drift rate (; green) dynamics. (B) Bootstrapped estimate of the association between classifier uncertainty and drift rate by participant and in aggregate.
Figure 4—figure supplement 1
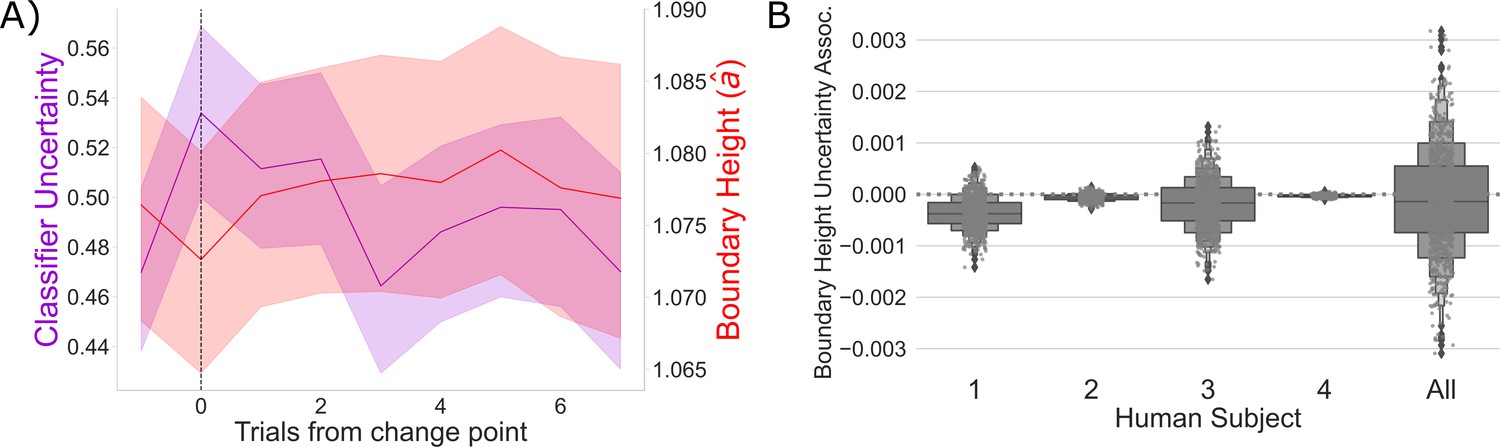
Competition between action plans and boundary height.
(A) Change point-evoked classifier uncertainty (lavender) and estimated boundary height (red). Bootstrapped 95% CIs are shown. (B) The association between classifier uncertainty and boundary height by participant and in aggregate.
Author response image 1
Additional files
-
Supplementary file 1
Model fits.
Group-level deviance information criterion (DIC) values for regression models tested.
- https://cdn.elifesciences.org/articles/85223/elife-85223-supp1-v2.pdf
-
Supplementary file 2
Individual model fits.
Participant-level deviance information criterion (DIC) values for regression models tested.
- https://cdn.elifesciences.org/articles/85223/elife-85223-supp2-v2.pdf
-
Supplementary file 3
Neuronal parameters.
Neuronal parameters for each nucleus are listed in the left column, with values shown on the right. The membrane time constant: , resting membrane potential: , threshold potential: , leak reversal: , low threshold Ca2+ maximal conductance: , threshold potential for burst activation: , reversal potential: (Ca2+), burst duration: , hyperpolarization duration: .
- https://cdn.elifesciences.org/articles/85223/elife-85223-supp3-v2.pdf
-
Supplementary file 4
External inputs to CBGT nuclei.
Each nucleus is listed on the left, with mean external input frequency, efficacy, and number of connections listed by receptor.
- https://cdn.elifesciences.org/articles/85223/elife-85223-supp4-v2.pdf
-
Supplementary file 5
Synaptic parameters.
Parameters for the simulated synapses.
- https://cdn.elifesciences.org/articles/85223/elife-85223-supp5-v2.pdf
-
Supplementary file 6
CBGT connectivity.
Connection type and probability by nucleus and receptor.
- https://cdn.elifesciences.org/articles/85223/elife-85223-supp6-v2.pdf
-
Supplementary file 7
Number of neurons in each CBGT population.
- https://cdn.elifesciences.org/articles/85223/elife-85223-supp7-v2.pdf
-
Supplementary file 8
STDP parameters.
- https://cdn.elifesciences.org/articles/85223/elife-85223-supp8-v2.pdf
-
MDAR checklist
- https://cdn.elifesciences.org/articles/85223/elife-85223-mdarchecklist1-v2.pdf
Download links
A two-part list of links to download the article, or parts of the article, in various formats.
Downloads (link to download the article as PDF)
Open citations (links to open the citations from this article in various online reference manager services)
Cite this article (links to download the citations from this article in formats compatible with various reference manager tools)
Competing neural representations of choice shape evidence accumulation in humans
eLife 12:e85223.
https://doi.org/10.7554/eLife.85223


