Characterization of caffeine response regulatory variants in vascular endothelial cells
- Center for Molecular Medicine and Genetics, Wayne State University, United States
- Department of Biostatistics, University of Michigan, United States
- Department of Obstetrics and Gynecology, Wayne State University, United States
- Department of Biology, University of Rome Tor Vergata, Italy
Figures
Figure 1 with 1 supplement
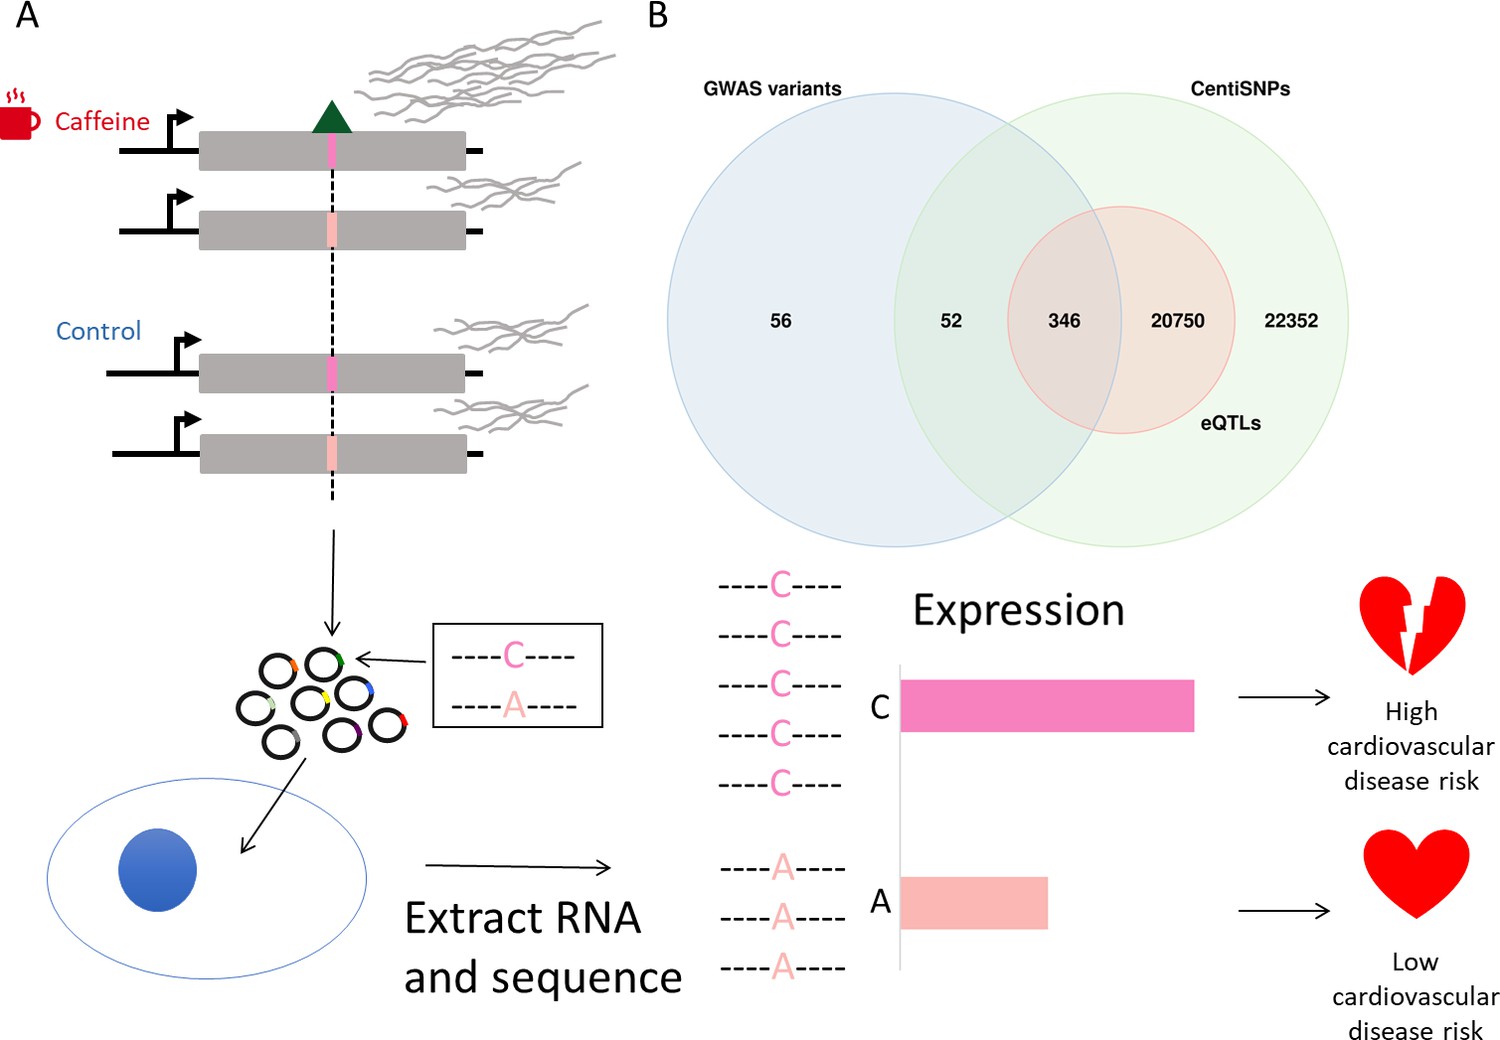
Study design.
(A) Genetic variants modulate transcriptional response dependent on environmental conditions. The pink bars represent different alleles present in our targets, and the green triangle represents a bound transcription factor. These target sequences are transfected into cells, RNA is extracted and sequenced, and then activity is measured for targets for both alleles. (B) Library composition based on annotation category: single-nucleotide polymorphisms (SNPs) predicted to alter transcription factor binding using a combination of sequence information and experimental data (centiSNPs) (Moyerbrailean et al., 2016b), SNPs associated with complex traits (genome-wide association studies [GWAS]), and expression quantitative trait loci (eQTL) in GTEx.
Figure 1—figure supplement 1

Coverage histograms for all 12 libraries used in this study.
Caffeine libraries are on the top, and water libraries are on bottom.
Figure 2 with 3 supplements
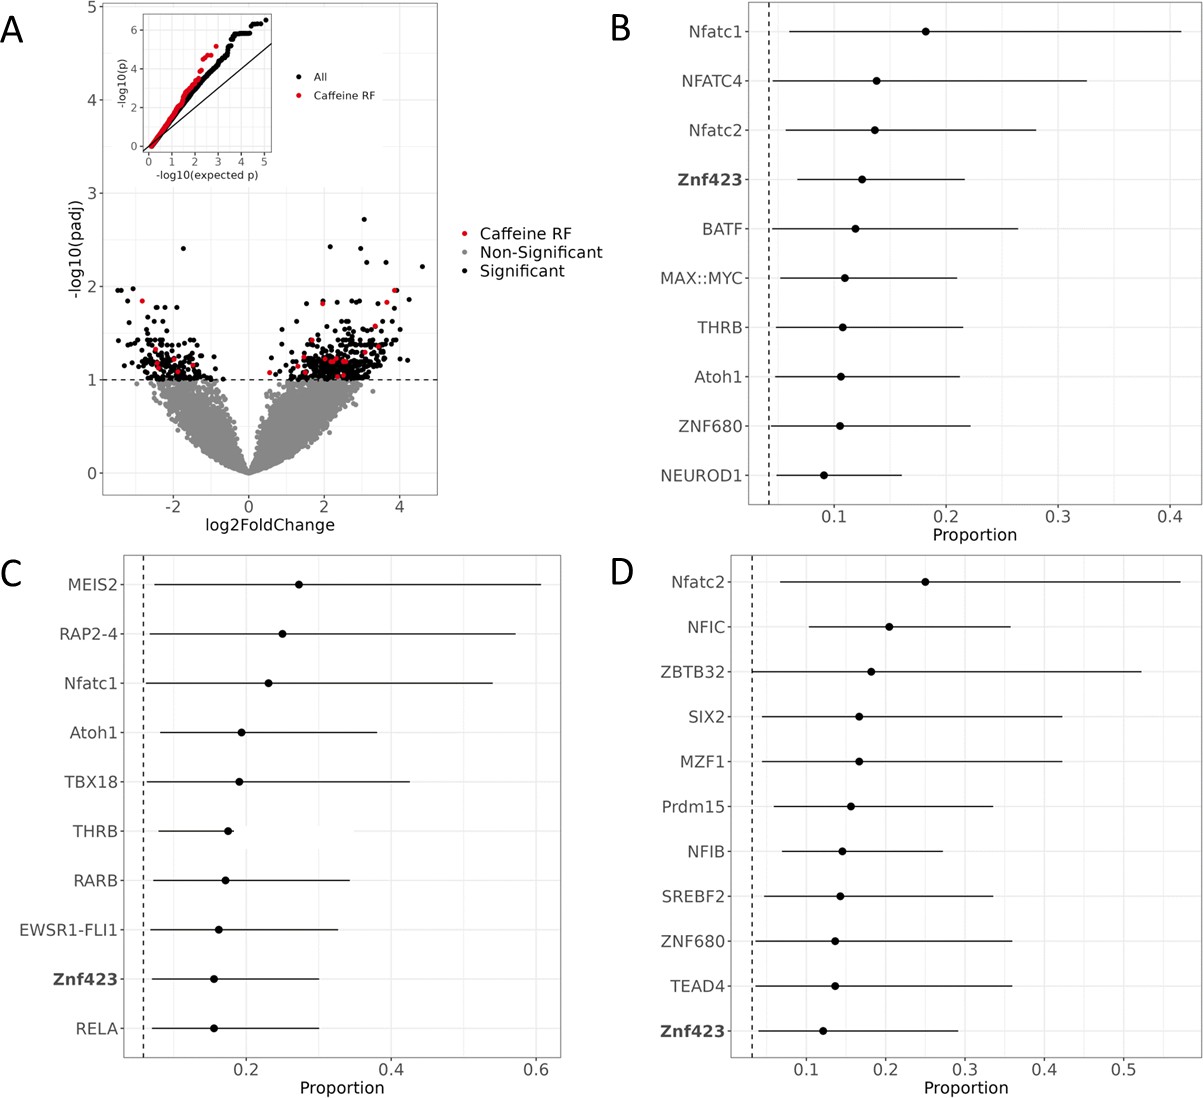
Active regulatory regions in caffeine response in vascular endothelial cells.
(A) Volcano plot for DESeq2 results showing targets differentially active in caffeine. The light red points are significant (false discovery rate [FDR] < 10%) targets containing caffeine response factor binding sites, the black points are significant targets not containing a caffeine response factor binding site, and the gray points are nonsignificant targets. The inset contains a QQ plot for targets containing a caffeine response factor binding site (red), or no caffeine response factor binding site (black). (B) Motifs enriched via test of proportions (p<0.05) within differentially active targets. Names of caffeine response factors are bolded. For B-D panels error bars represent the 95% confidence interval (motif occurrence, n >100). (C) Motifs enriched via test of proportions within upregulated targets (p<0.05). (D) Motifs enriched via test of proportions within downregulated targets (p<0.05).
Figure 2—figure supplement 1
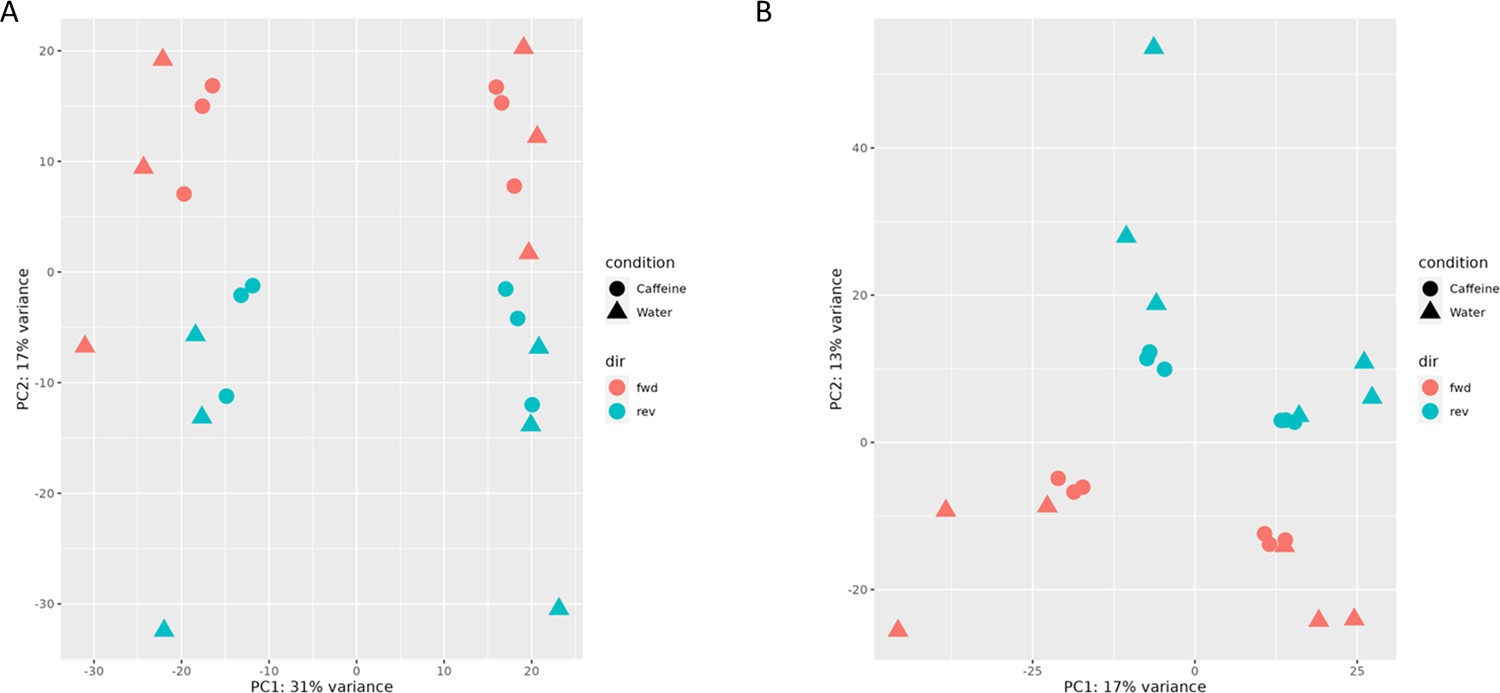
Principal component analysis (PCA) plots from read count data in the first (A) and second (B) batch (experiment), annotated by direction.
Figure 2—figure supplement 2
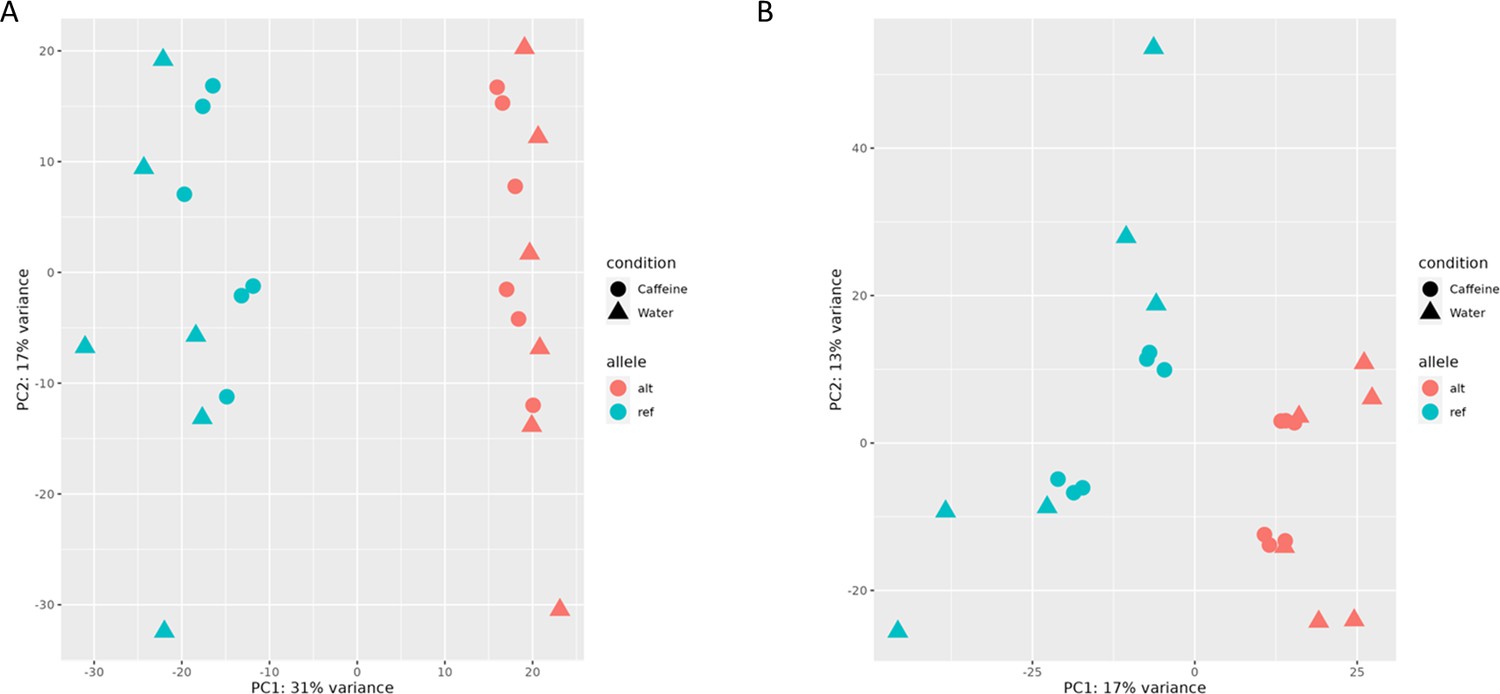
Principal component analysis (PCA) plots from read count data in the first (A) and second (B) batch (experiment), annotated by allele.
Figure 2—figure supplement 3
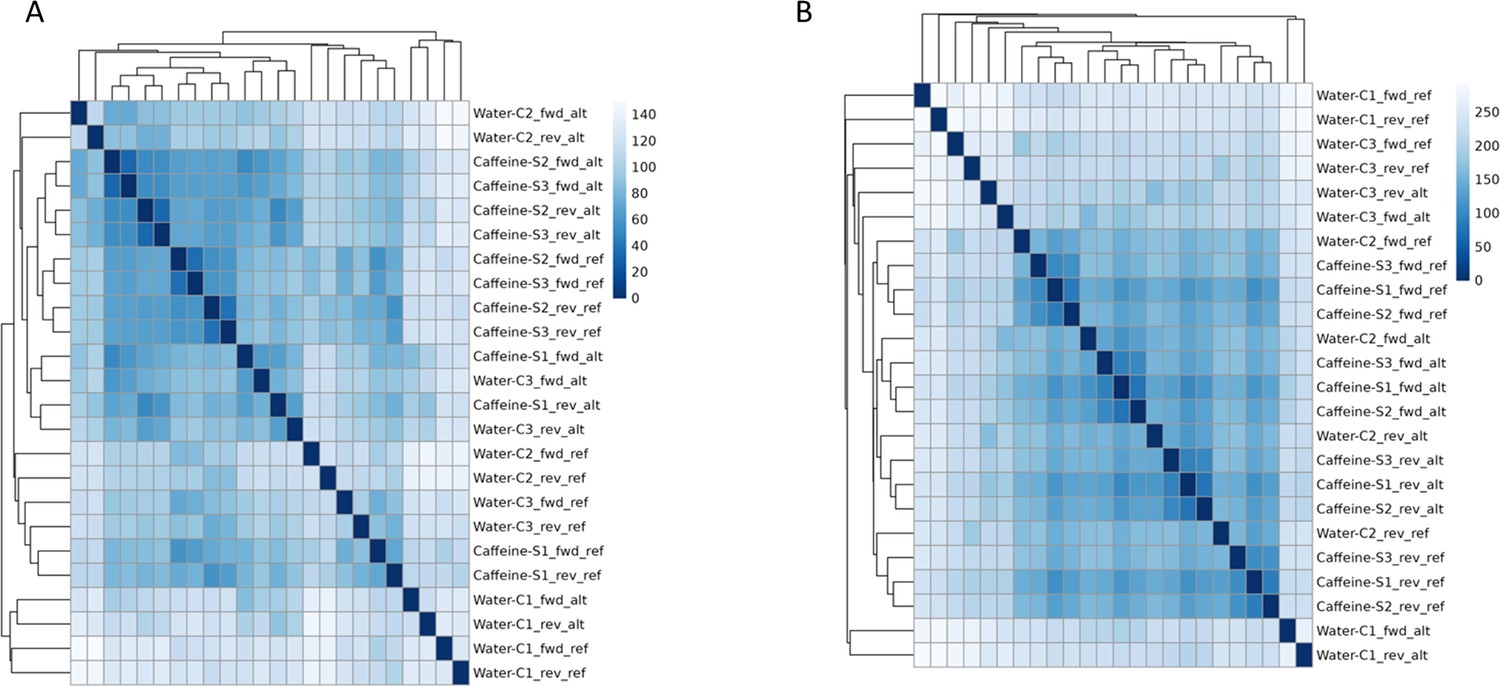
Heatmap plots from read count data in the first (A) and second (B) batch (experiment).
Figure 3 with 3 supplements
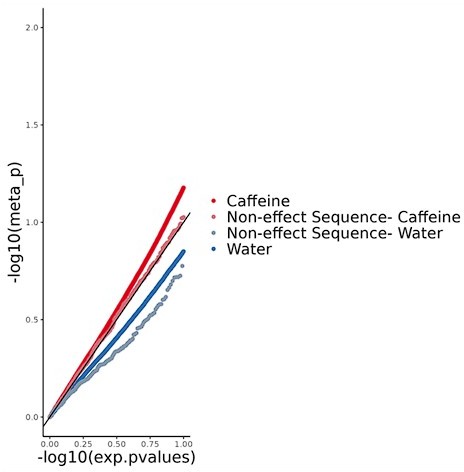
Allelic effects on gene regulation within conditions and in response to caffeine.
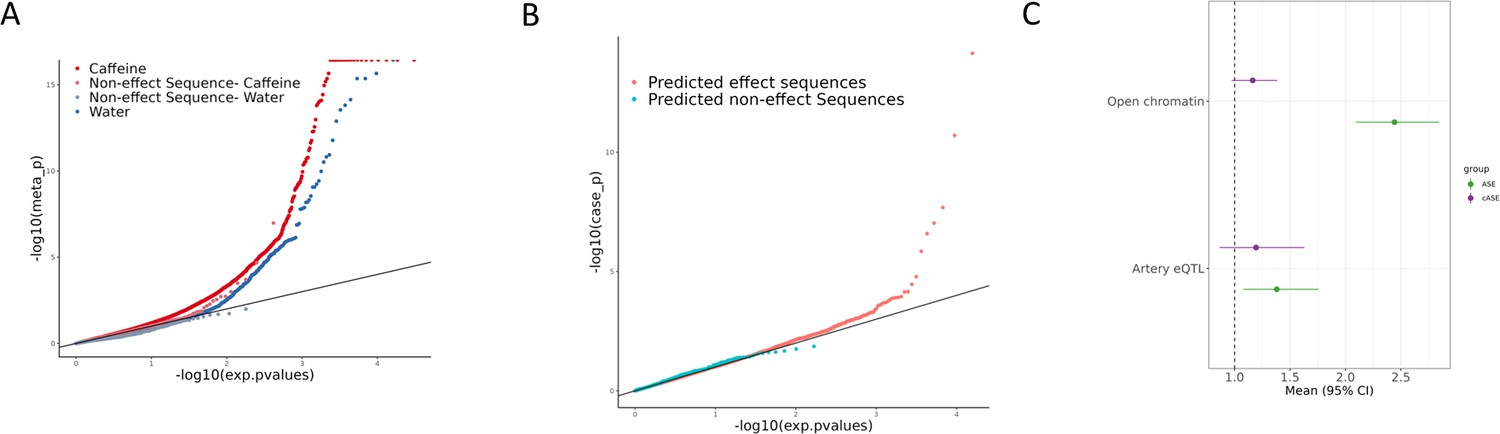
(A) QQ plot depicting the p-values for allele-specific effects (ASE), with negative control sequences labeled in lighter red (caffeine) or lighter blue (control). (B) QQ plot depicting the p-values for conditional allele-specific effects (cASE), with targets containing caffeine response factor motifs annotated in pink and all other sequences in blue. (C) Enrichment via Fisher’s exact test (p<0.05) of ASE (green) and cASE (purple) variants in open chromatin regions and targets containing artery expression quantitative trait loci (eQTL). Error bars indicate 95% confidence intervals. The sample sizes for each test are reported in Supplementary file 3.
Figure 3—figure supplement 1

Z-score scatter plot from allele-specific effect (ASE) analysis comparing caffeine and water.
Figure 3—figure supplement 2

Distribution of ZT-ZC (case_z) scores from conditional allele-specific effect (cASE) analysis.
Figure 3—figure supplement 3

Artery expression quantitative trait loci (eQTL) enrichment via Torus for footprint single-nucleotide polymorphisms (SNPs) (control, black) or caffeine response factors (caffeine, red).
‘Meta’ is the combination of all three artery tissue types in GTEx. Error bars indicate 95% confidence interval. 3,401,115 SNPs were used in this analysis.
Figure 4
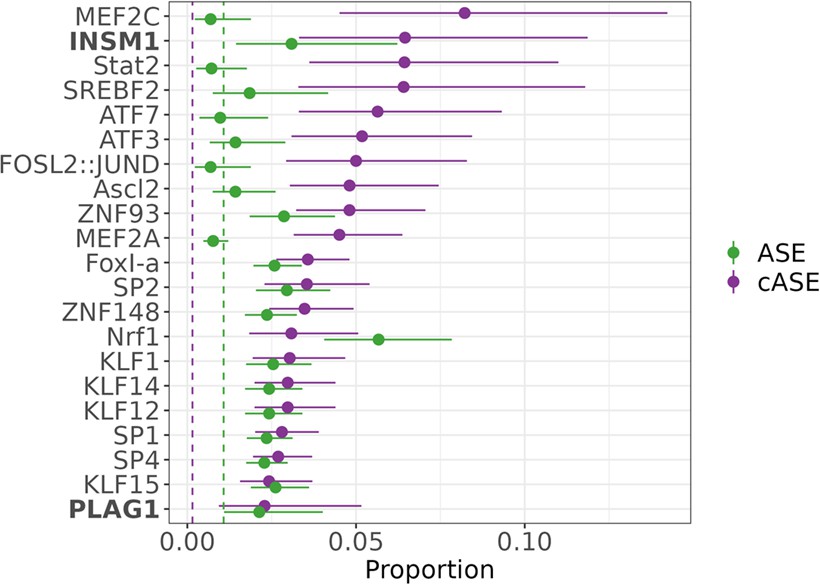
Transcription factors contributing to allele-specific effect (ASE) and conditional allele-specific effect (cASE).
Motifs enriched via test of proportions (p<0.05) for significant ASE (green) or cASE (purple). The dotted lines represent the baseline proportion (mean number of significant variants within any motif) for ASE (green) and cASE (purple). Bolded factors are caffeine response factors as defined in Findley et al., 2019. Error bars represent the 95% confidence interval, motif occurrence n>100.
Figure 5
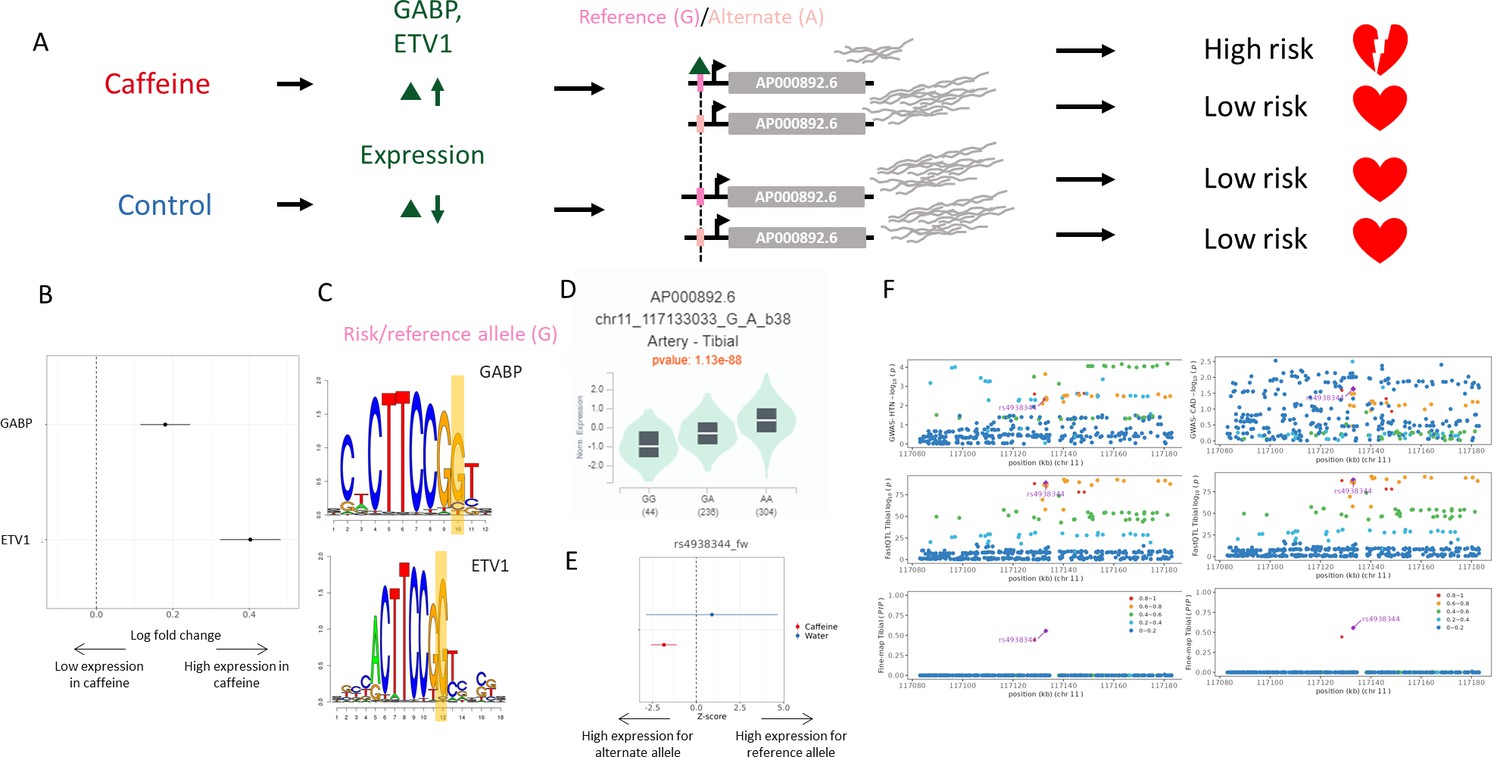
Example genetic variant with GxE with caffeine where caffeine may increase genetic risk of CAD.
(A) Potential mechanism for rs4938344. (B) Transcription factors containing rs4938344 in a binding site are upregulated (via DESeq2) upon caffeine exposure (error bars are +/- standard error, FDR<10%, n=14). (C) Logos of transcription factor motifs with rs4938344 highlighted. (D) GTEx violin plot for AP000892.6. (E) Effect size from the BiT-STARR-Seq assay for this single-nucleotide polymorphism (SNP) within each condition (error bars are +/- standard error, n=4 replicates per condition, cASE p<0.0215, see ‘cASE Analysis’ section of methods). (F) Locus zoom plots showing genome-wide association studies (GWAS) and expression quantitative trait loci (eQTL) data for hypertension (left) and coronary artery disease (CAD) (right) in tibial artery tissue.
Figure 6
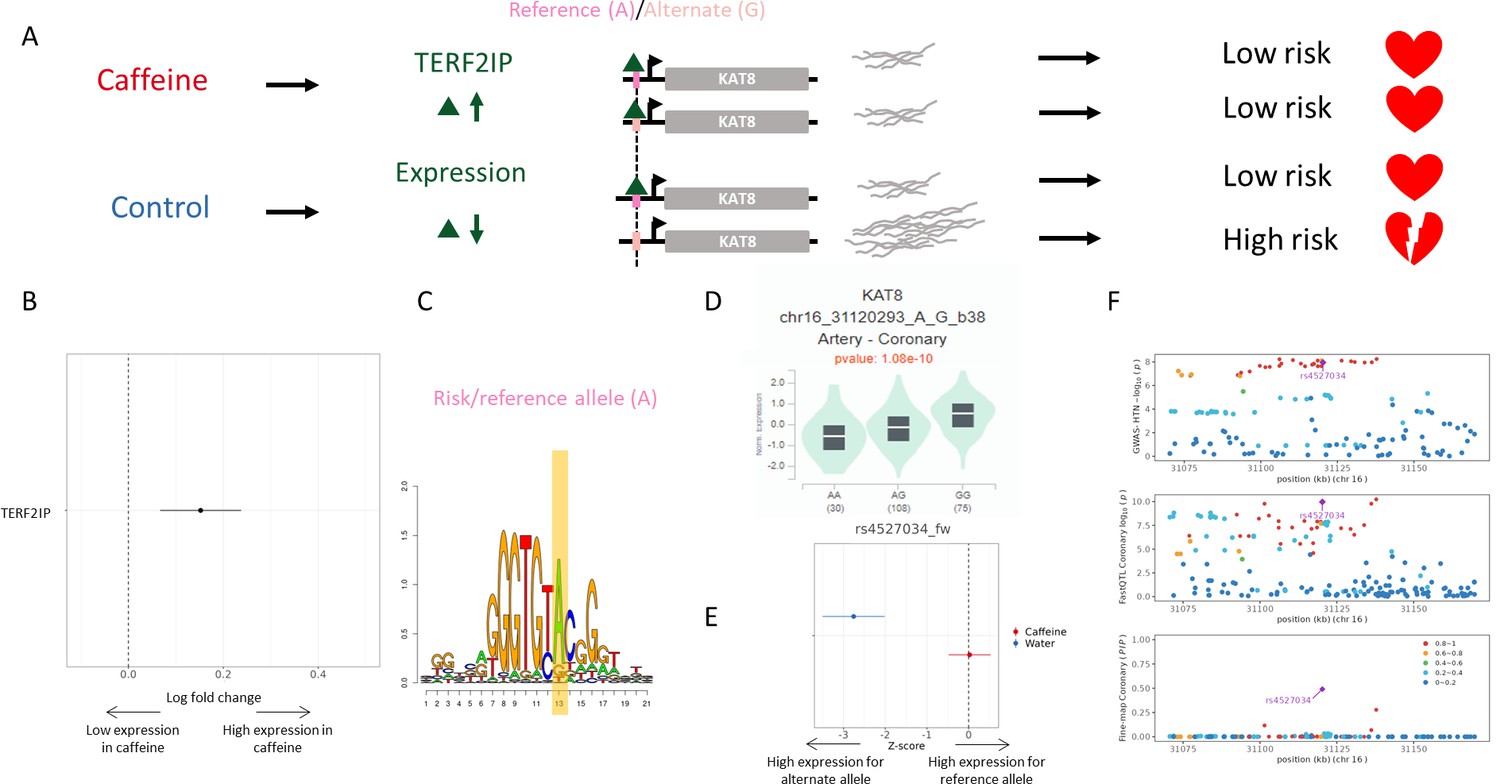
Example genetic variant with GxE with caffeine where caffeine may decrease genetic risk of CAD.
(A) Potential mechanism for rs4527034. (B) TERF2IP is upregulated (via DESeq2) upon caffeine exposure (error bars are +/- standard error, FDR<10%, n = 14). (C) Logos of TERF2IP motif with rs4527034 highlighted. (D) GTEx violin plot for KAT8. (E) Effect size from the BiT-STARR-Seq assay for this single-nucleotide polymorphism (SNP) within each condition (error bars are +/- standard error, n=4 replicates per condition, cASE p<0.0215, see ‘cASE Analysis’ section of methods). (F) Locus zoom plots showing genome-wide association studies (GWAS) and expression quantitative trait loci (eQTL) data for hypertension in coronary artery tissue.
Author response image 1

Author response image 2
Additional files
-
Supplementary file 1
Differential activity results.
Output from DESeq2. Column ‘V1’ is the genomic position (hg19) of the SNP within the construct being tested, ‘baseMean’ refers to normalized expression, ‘log2FoldChange’ refers to the effect size, ‘lfcSE’ is the standard error of the effect size, ‘stat’ is the log2FoldChange divided by lfcSE, ‘pvalue’ is the nominal p-value, and ‘padj’ is the adjusted p-value. Please refer to DESeq2 documentation for additional details.
- https://cdn.elifesciences.org/articles/85235/elife-85235-supp1-v2.txt
-
Supplementary file 2
PWMScan results.
Includes all variants in the designed library that are within a motif from the JASPAR 2022 CORE Vertebrates database determined by PWMScan. Columns 1–3 are the genomic position of the test SNP, column 4 is the rsID for the test SNP, and column 5 is the ID of the motif in JASPAR.
- https://cdn.elifesciences.org/articles/85235/elife-85235-supp2-v2.txt
-
Supplementary file 3
Characterization of regulatory regions and variants.
Includes contingency tables for all Fisher’s exact tests reported in this study. Please see the legend provided within the file. Briefly, A1–C5 is the contingency table and summary of results for ASE variants within open chromatin regions, A6–C10 for ASE variants overlapping with artery eQTLs, A11–C15 for cASE variants within open chromatin, and A16–C20 for cASE variants overlapping with artery eQTLs.
- https://cdn.elifesciences.org/articles/85235/elife-85235-supp3-v2.xlsx
-
Supplementary file 4
Allele-specific effects and conditional allele-specific effects results.
Output from ASE/cASE analysis. The ‘identifier’ column is the SNP/direction pair, ‘meta_estimate’ is the effect size (of the ASE), ‘meta_se’ is the standard error of the effect size, ‘n’ is the number of replicates containing nonzero read counts, ‘DNA_prop’ is the proportion of reads (reference/alternate) present in the DNA library, ‘meta_z’ is the z-score, ‘meta_p’ is the nominal ASE p-value, ‘meta_padj’ is the adjusted ASE p-value before filtering for SNP/direction pairs where n > 3, ‘new_padj’ is the adjusted ASE p-value after filtering for SNP/direction pairs where n > 3, ‘group’ refers to the applicable condition for the statistic (.x suffix for caffeine, .y suffix for control), ‘case_z’ is ZT-ZC, ‘case_p’ is the nominal p-value for cASE, and ‘case_padj’ is the adjusted p-value for cASE.
- https://cdn.elifesciences.org/articles/85235/elife-85235-supp4-v2.txt
-
Supplementary file 5
Fine-mapped artery eQTLs with significant ASE or cASE.
The ‘chr’ column contains the chromosome information, ‘pos’ is the genomic position (0-based, hg19), ‘pos1’ is the genomic position (1-based, hg19), ‘identifier’ is the SNP/direction pair, ‘rsID’ refers to rsID, ‘padj_min’ refers to the minimum p-adjusted value for ASE (across conditions), ‘ID’ is an ID to identify the genomic position in the format of chr_pos1, ‘PIP’ is the posterior inclusion probability as calculated by DAP-G, ‘gene’ refers to the Ensembl gene ID, ‘tissue’ refers to the GTEx artery tissues (tibial, aorta, or coronary), ‘group’ identifies if the variant has significant ASE or significant cASE, ‘case_p’ refers to the cASE nominal p-value, and ‘case_padj’ refers to the cASE adjusted p-value.
- https://cdn.elifesciences.org/articles/85235/elife-85235-supp5-v2.txt
-
Supplementary file 6
Variants that regulate putatively casual genes as identified via INTACT.
The ‘Identifier’ column is the SNP/direction pair, ‘ID’ is an ID to identify the genomic position in the format of chr_pos1 (see above), ‘Gene ID’ refers to the Ensembl gene ID, ‘Gene symbol’ refers to the gene symbol, ‘Trait’ is CAD or hypertension (HTN), ‘Tissue’ refers to the GTEx artery tissues (tibial, aorta, or coronary), ‘DAP-G PIP’ is the posterior inclusion probability as calculated by DAP-G, ‘GWAS z-score’ is the z-score for the GWAS of the corresponding trait, ‘GWAS pvalue’ is the nominal p-value for the GWAS of the corresponding trait, ‘PTWAS-INTACT PCG’ is the probability of being a putative causal gene as calculated by INTACT, ‘PTWAS-INTACT FDR’ is the FDR statistic as calculated by INTACT, ‘INTACT z-score’ is the z-score statistic as calculated by INTACT, ‘cASE_p’ is the cASE nominal p-value, ‘cASE_padj_(original)’ is the cASE adjusted p-value, ‘cASE_z’ is ZT-ZC, ‘DE_construct?’ indicates if the construct is significantly differentially active as defined by our assay, ‘Caffeine_ASE_z’ is the z-score for ASE (caffeine condition), ‘Water_ASE_z’ is the z-score for ASE (control condition), ‘centiSNP motifs’ refers to motifs the SNP is within as identified by centiSNP, and ‘centiSNP category’ refers to if the motif is a footprintSNP, effectSNP, or switchSNP as identified by centiSNP.
- https://cdn.elifesciences.org/articles/85235/elife-85235-supp6-v2.xlsx
-
Supplementary file 7
Read counts.
Read counts for all libraries at different steps of the data processing pipeline. ‘Library Name’ is an identifier used for the sample, ‘Treatment’ is the condition (caffeine or control), ‘Dedup’ refers to the number of reads after deduplication, and ‘>1 read either direction’ describes the number of reads that have >1 read for each allele in either direction.
- https://cdn.elifesciences.org/articles/85235/elife-85235-supp7-v2.xlsx
-
MDAR checklist
- https://cdn.elifesciences.org/articles/85235/elife-85235-mdarchecklist1-v2.docx
Download links
A two-part list of links to download the article, or parts of the article, in various formats.
Downloads (link to download the article as PDF)
Open citations (links to open the citations from this article in various online reference manager services)
Cite this article (links to download the citations from this article in formats compatible with various reference manager tools)
Characterization of caffeine response regulatory variants in vascular endothelial cells
eLife 13:e85235.
https://doi.org/10.7554/eLife.85235


