Integrating contact tracing and whole-genome sequencing to track the elimination of dog-mediated rabies: An observational and genomic study
- Environmental Health and Ecological Sciences Department, Ifakara Health Institute, United Republic of Tanzania
- Boyd Orr Centre for Population and Ecosystem Health, School of Biodiversity, One Health & Veterinary Medicine, University of Glasgow, United Kingdom
- Department of Global Health and Biomedical Sciences, School of Life Sciences and Bioengineering, Nelson Mandela African Institution of Science and Technology, United Republic of Tanzania
- Department of Ecology and Evolutionary Biology, Princeton University, United States
- The University of Nairobi, Kenya
- College of the Atlantic, United States
- Animal & Plant Health Agency, United Kingdom
- Department of Veterinary Medicine and Public Health, Sokoine University of Agriculture, United Republic of Tanzania
- Department of Comparative Biomedical Sciences, School of Veterinary Medicine, University of Surrey, United Kingdom
- Ministry for Health and Social Welfare, United Republic of Tanzania
- Ministry of Livestock Development and Fisheries, United Republic of Tanzania
- Department of Epidemiology, Ministry of Health, Community Development, Gender, Elderly and Children (MoHCDGEC), United Republic of Tanzania
- Department of Livestock Development, Pemba, Ministry of Livestock Development and Fisheries, United Republic of Tanzania
- Tanzania Veterinary Laboratory Agency, United Republic of Tanzania
- Mbeya college of Health and Allied Sciences, University of Dar es Salaam, United Republic of Tanzania
- University of Warwick, United Kingdom
Figures
Figure 1
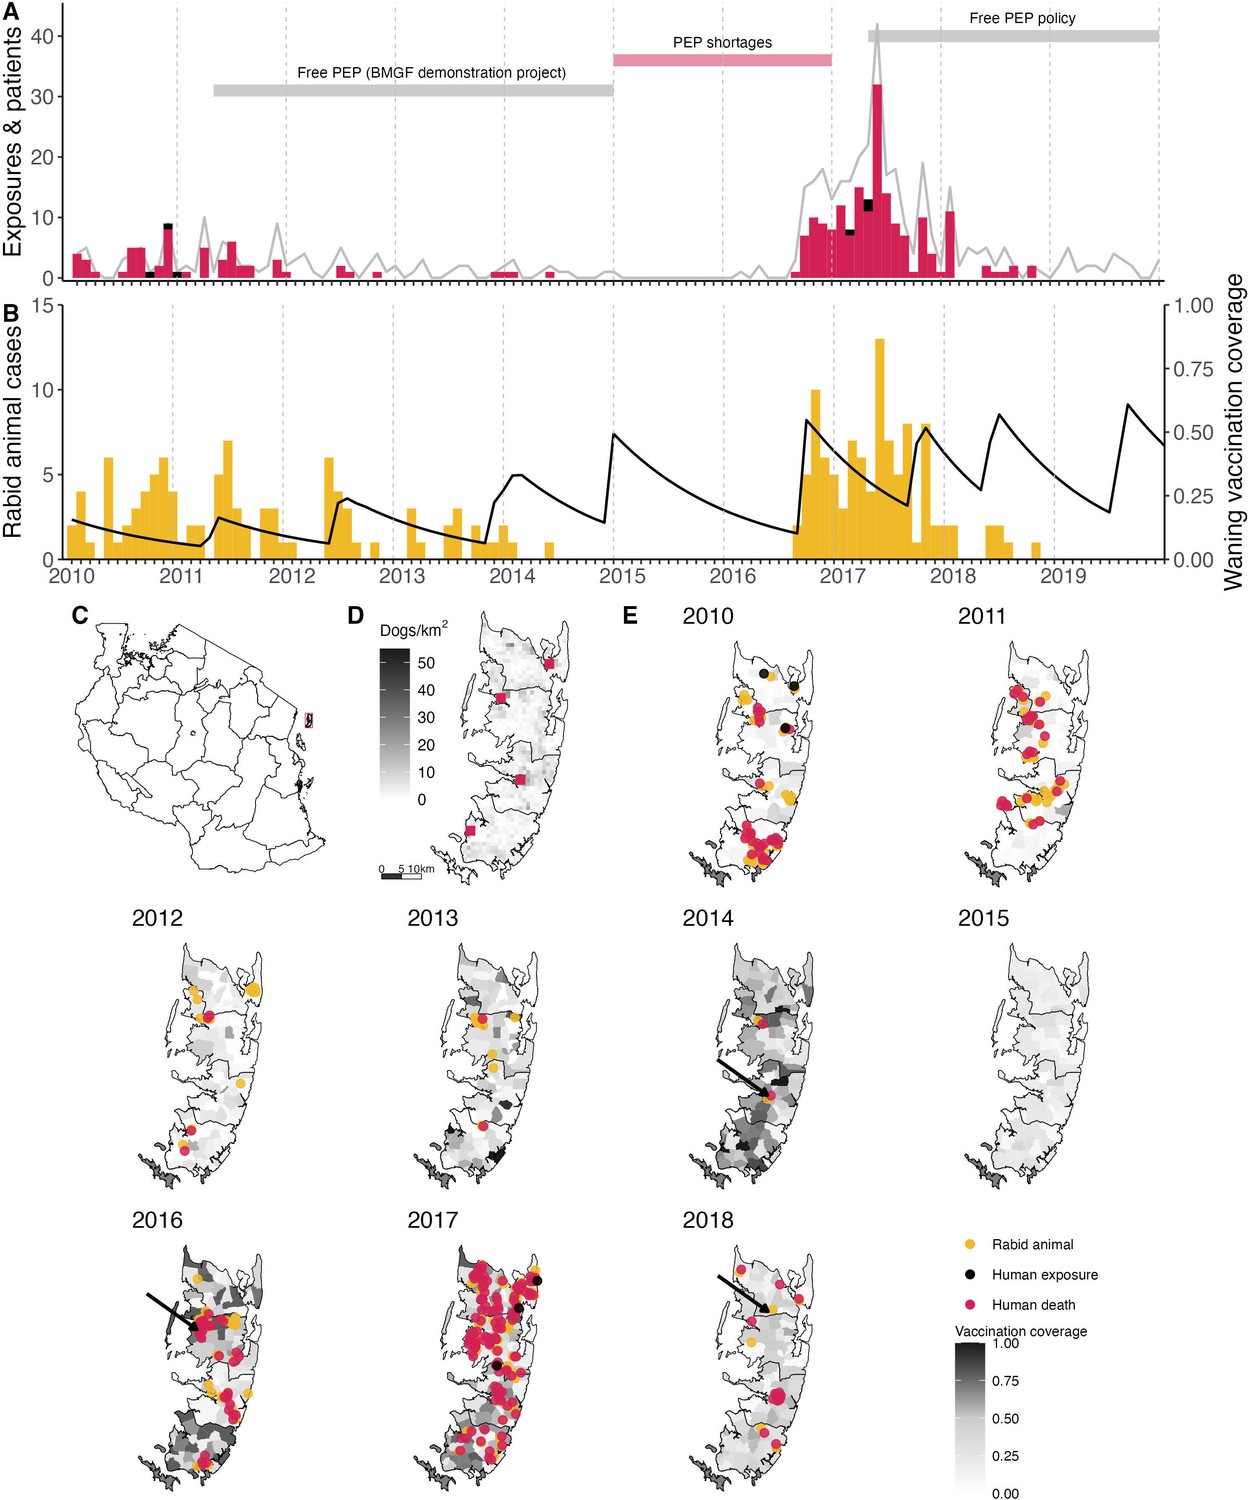
Timeline of rabies on Pemba Island in relation to control and prevention measures.
(A) Monthly time series of traced human rabies exposures (red) and deaths (black), and patients presenting to clinics from bites by both healthy and rabid dogs (grey line). Periods when PEP was provided free of charge are indicated by the grey horizontal bars, as well as periods of shortages (red horizontal bar). (B) Dog rabies cases (orange) in relation to average dog vaccination coverage across the island (black line). (C) Location of Pemba (red) off the coast of mainland Tanzania. (D) Density of Pemba’s dog population and location of the four government hospitals that provide PEP (red squares), one in each district. (E) Dog rabies cases (orange circles) and human rabies exposures (red circles) and deaths (black circles) each year. Shading indicates dog vaccination coverage in December of each year, projected from the timing of shehia-level campaigns, dog turnover and a mean vaccine-induced immunity duration of three years. The arrows point to the last detected animal case in 2014, first detection in the 2016 outbreak and the final case found in 2018.
Figure 2 with 1 supplement
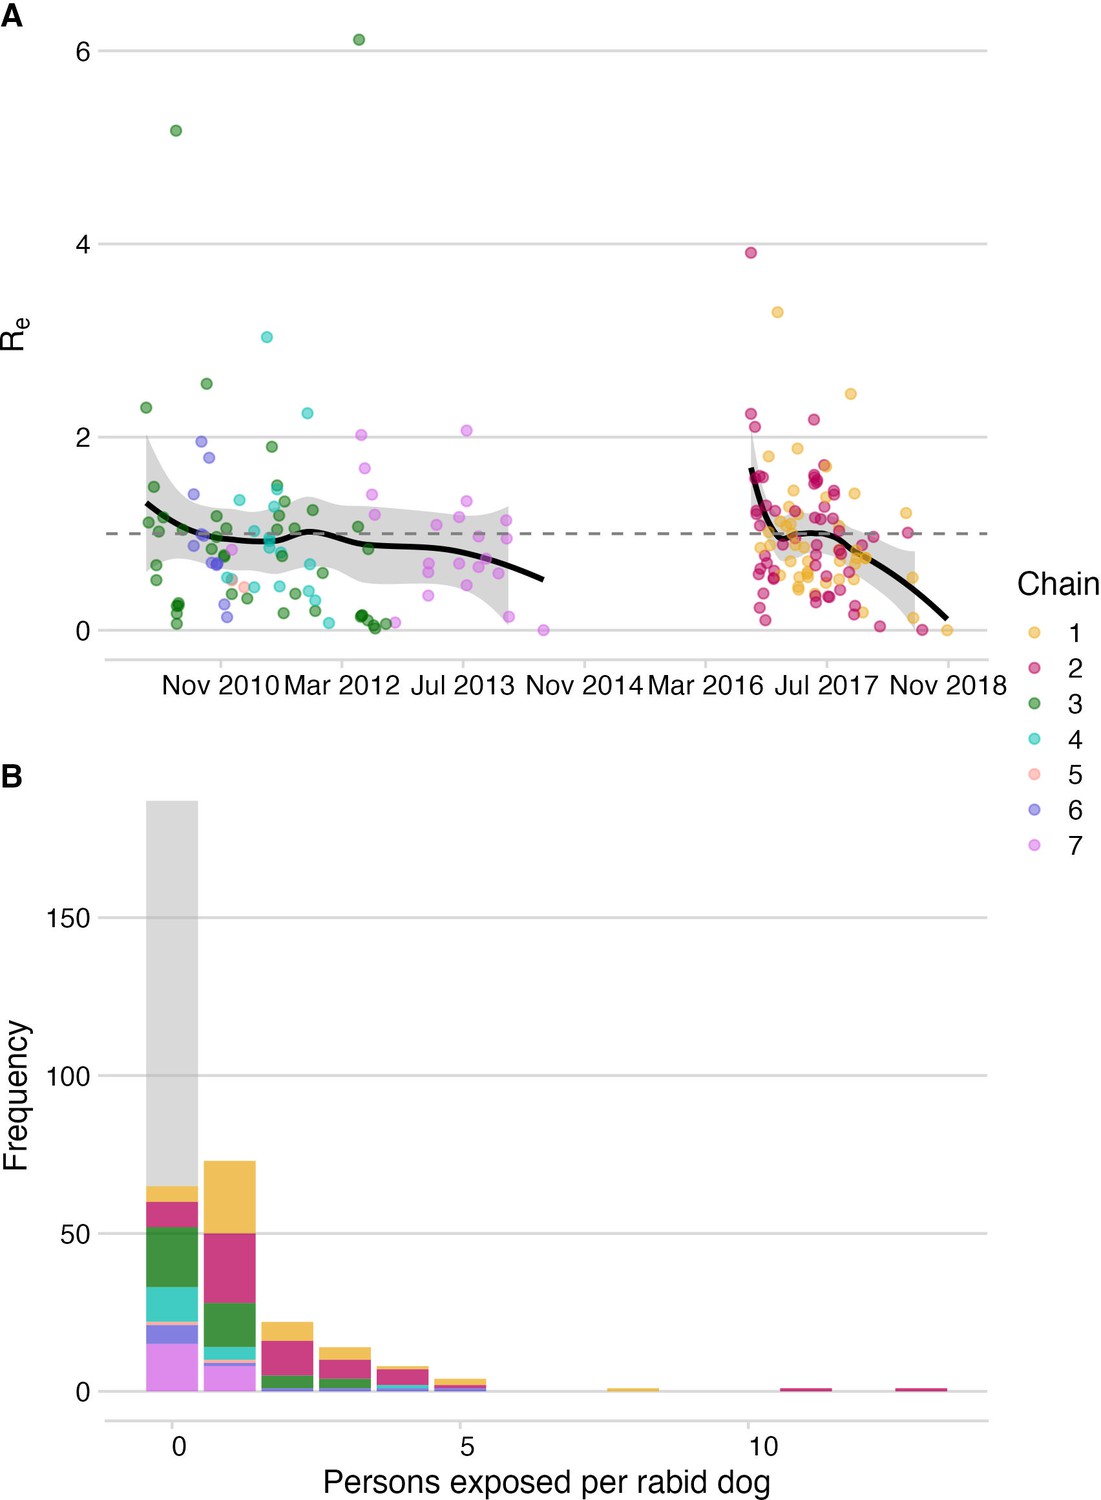
Dog-to-dog rabies transmission and dog-to-human rabies exposures on Pemba.
(A) The effective reproductive number, Re (black line shows smoothed estimate from a LOESS regression against date of case) with 95% confidence interval (grey envelope) and mean secondary cases from each traced rabid dog inferred from the bootstrapped transmission trees (points). The grey dashed line indicates an Re equal to 1. (B) Inferred offspring distribution of bite victims from rabid dogs. Points/ bars are coloured by transmission chain (see methods and Figure 4) with unobserved rabid dogs that did not bite (122 inferred from our estimates of case detection) in grey. A negative binomial distribution fit to the offspring distribution had μ=0.75 and k=0.54 (fitting to 2010–2014: μ=0.37, k=0.42 and for 2016–2018: μ=1.28, k=1.07).
Figure 2—figure supplement 1
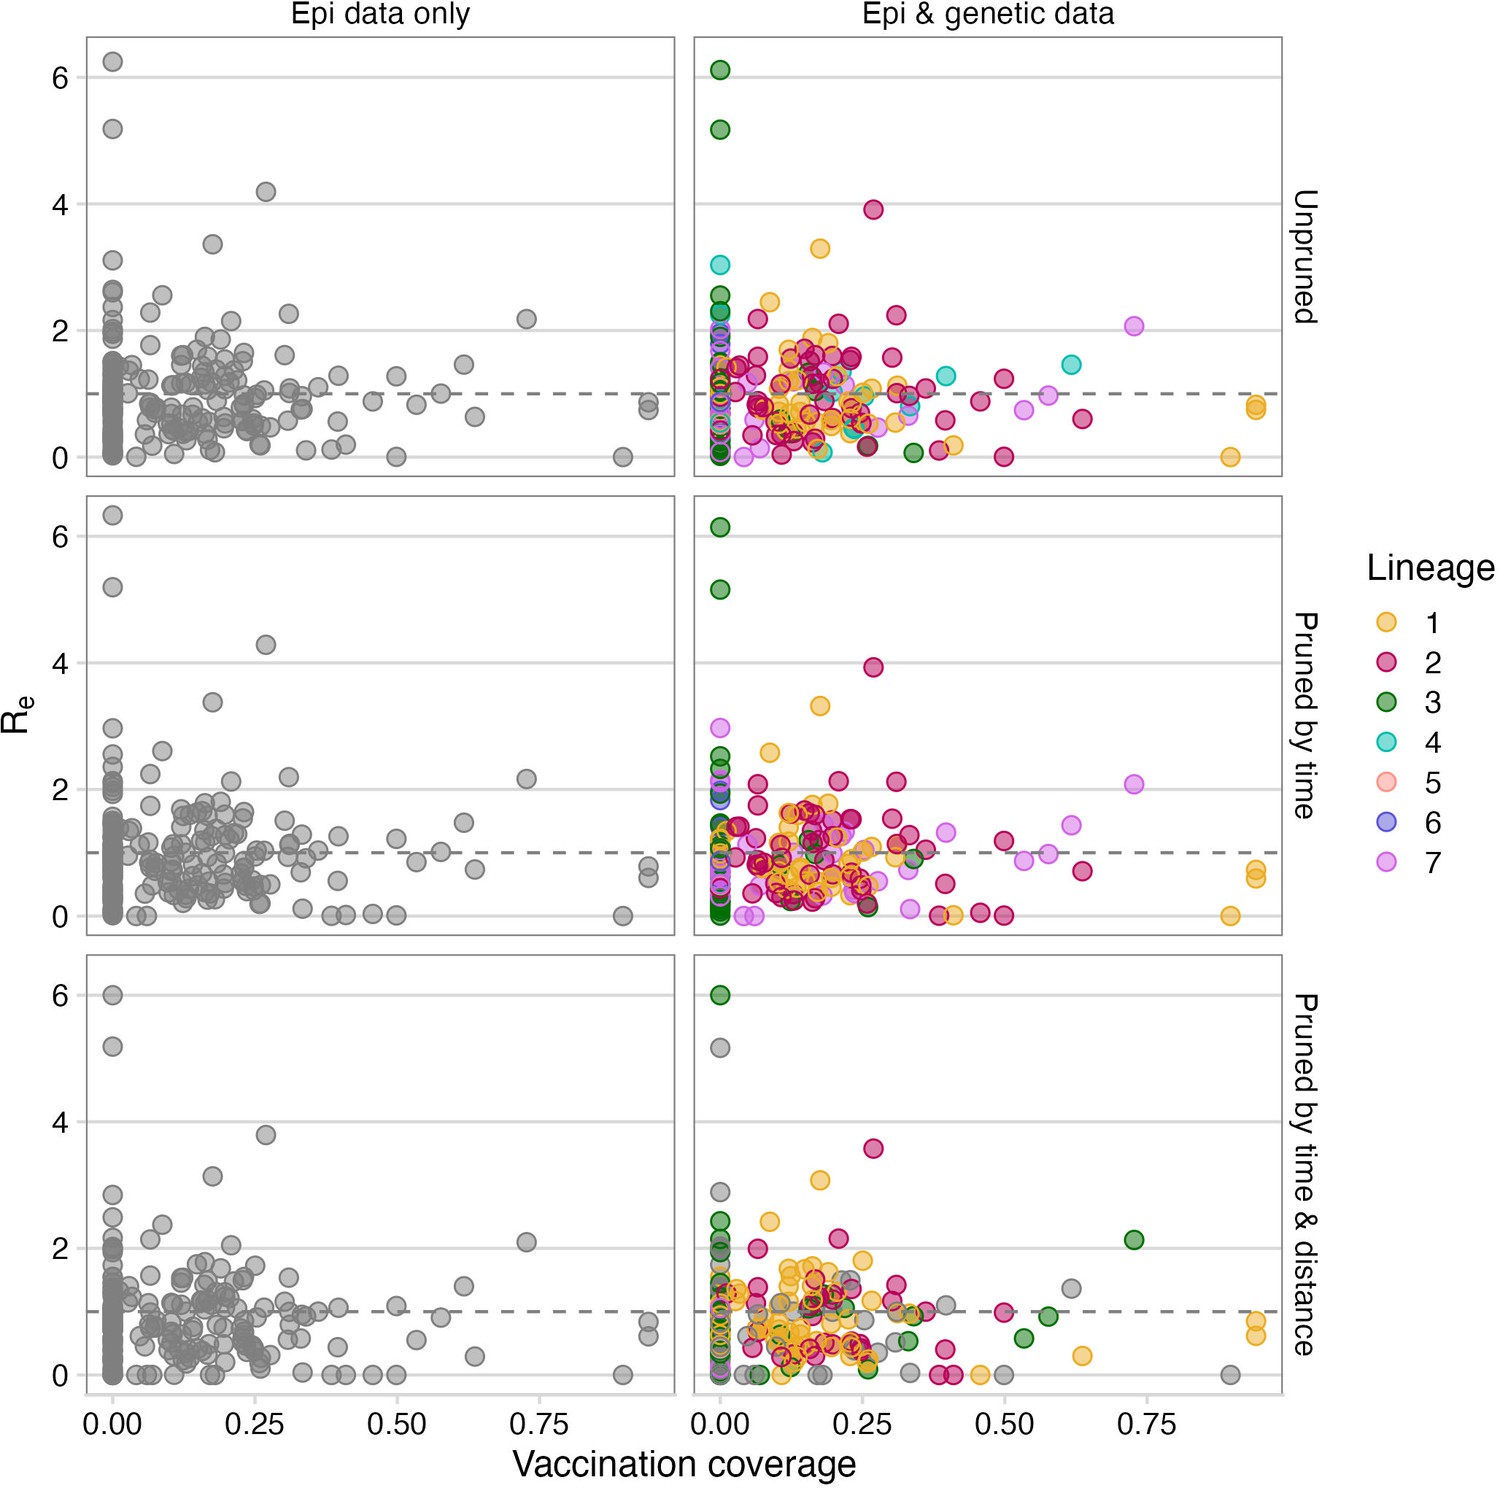
Vaccination coverage versus inferred Re for each case across pruning algorithms.
Number of secondary cases resulting from each case was averaged across the bootstrapped set of transmission trees generated by pruning to be consistent to the phylogeny. The points are the mean values for each case coloured by their consensus lineage assignment. For algorithms not using genetic data, the points are not coloured as they are not assigned to a lineage. Vaccination coverage is estimated at the time of symptoms in the shehia where the case occurred. The grey dashed line indicates an R of 1.
Figure 3 with 2 supplements
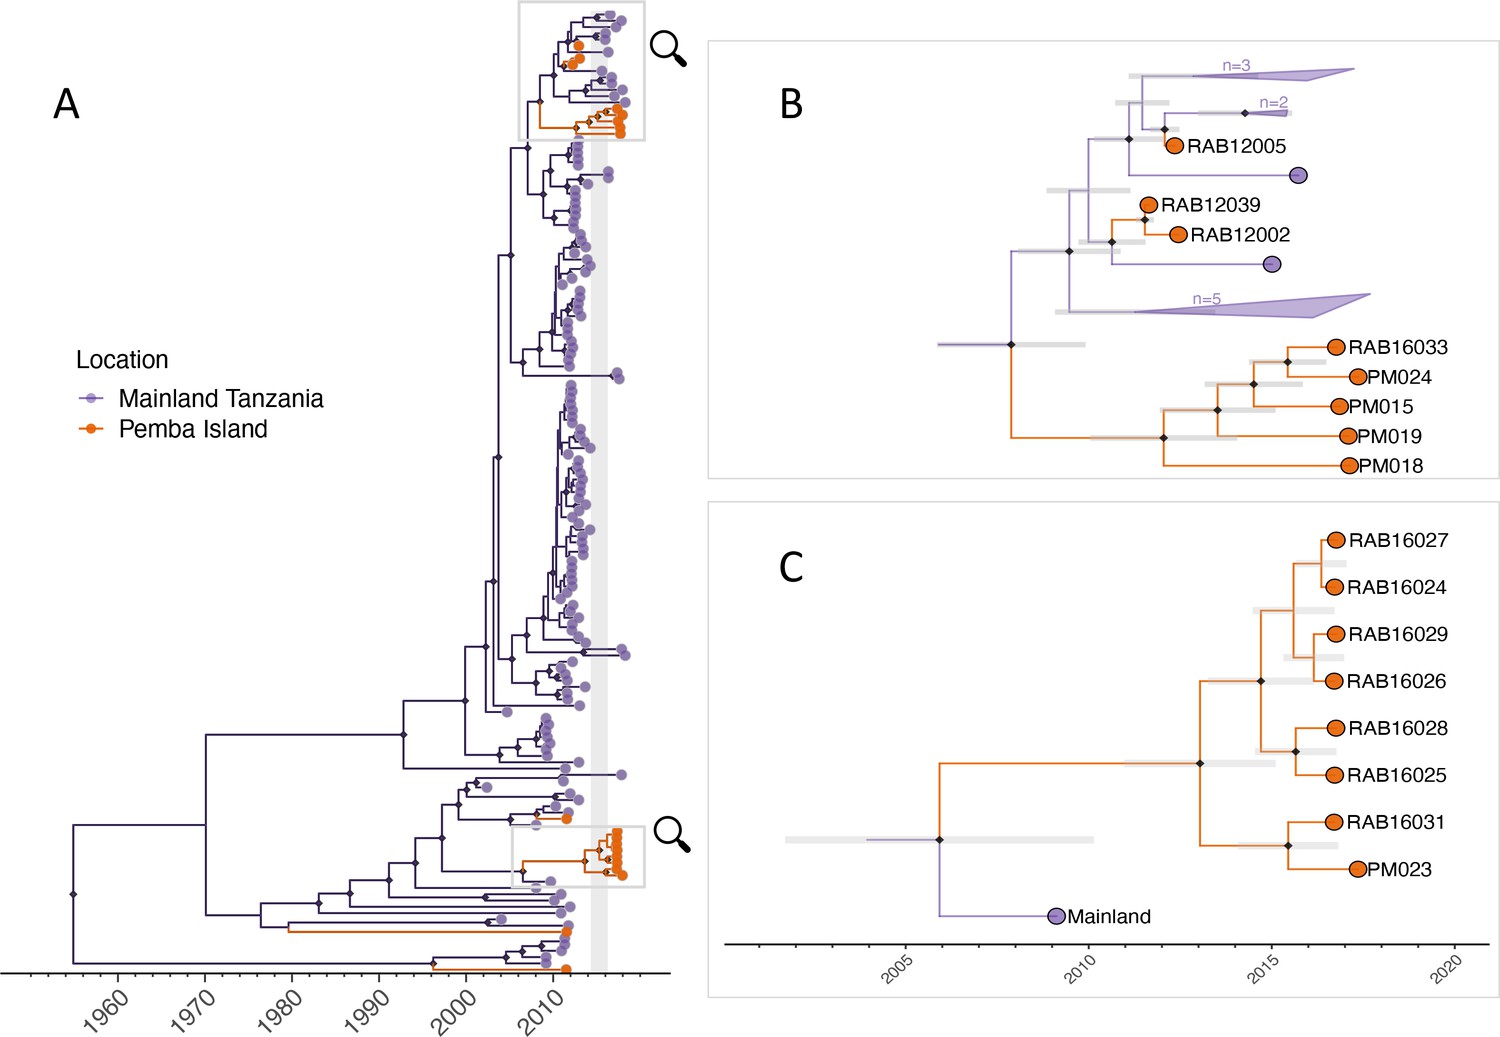
Maximum clade credibility tree (MCC) from discrete phylogeographic analysis to identify rabies virus introductions to Pemba.
(A) Time-calibrated MCC tree of 153 whole-genome sequences from Tanzania, including 13 from the 2016–2018 Pemba outbreak and 6 historical Pemba sequences (2010–2012). Grey vertical bar highlights the window of emergence for the most recent common ancestors of the two introductions that led to the 2016 outbreak (2014.33–2016.29). The expanded subtrees (B and C) show the Pemba cases one node back from the most recent common ancestor of the 2016 introductions, with branches coloured according to the inferred ancestral location. Black diamonds indicate nodes with >90% posterior support (clade credibilities). Mainland clusters of more than one identical sequence are collapsed. Grey bars represent the 95% highest posterior density interval of node heights, that is estimated age of ancestral nodes. Names of sequences are shown so they can be related to metadata (Supplementary file 1).
Figure 3—figure supplement 1
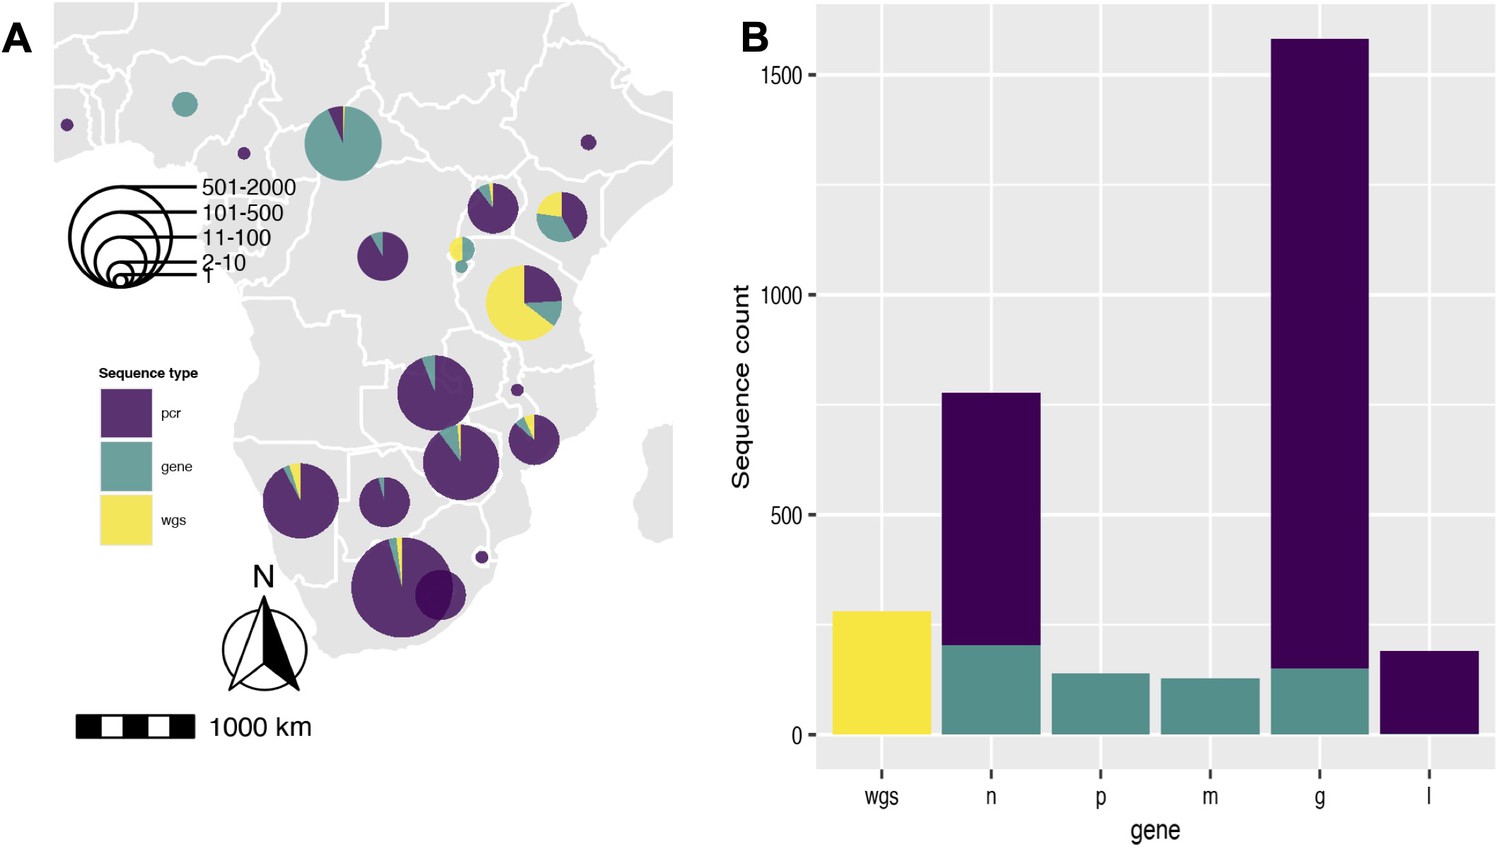
Rabies virus sequences within the Cosmopolitan-AF1b minor clade.
Sequences obtained from RABV-GLUE (n=2557) (A) Spatial distribution of sequences across Africa categorised by type: partial gene length sequences typically from polymerase chain reaction diagnostics, full length (>90% coverage) gene sequences (gene) and whole (>90% coverage) genome sequences (wgs). (B) Number of sequences per gene (pcr or whole gene) or whole genome. Nucleoprotein (n), phosphoprotein (p), matrix protein (m), glycoprotein (g), RNA polymerase (l).
Figure 3—figure supplement 2
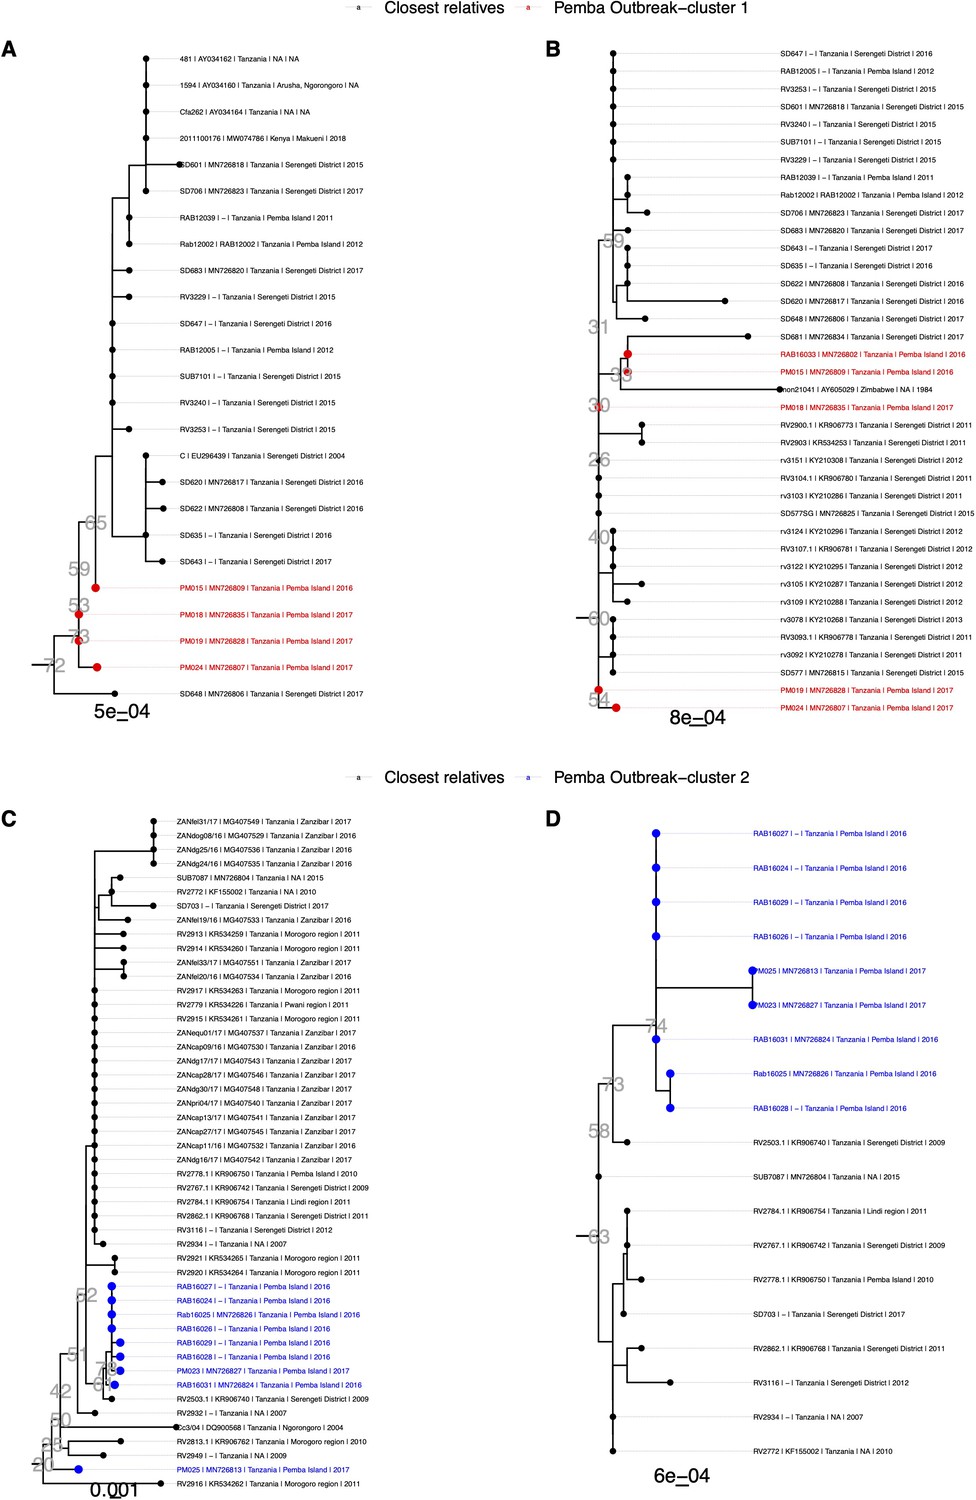
Phylogenetic clusters of RABV sequences from nucleoprotein (N) and glycoprotein (G) datasets showing the closest relatives to Pemba outbreak cases.
Subtrees extracted from background phylogenies constructed from datasets of N (n=1042) or G sequences (n=1876). (A & B) Pemba cases from cluster 1 (red), shown in main text Figure 2b, in relation to N and G gene sequences respectively; (C & D) Pemba cases from cluster 2 (blue), shown in main text Figure 2c, in relation to N and G gene sequences. Tip labels indicate metadata in the format <isolate id | GenBank accession | country | location | year>. Bootstrap values are shown next to nodes of interest in grey text and scale bars represent the number of substitutions per site.
Figure 4 with 6 supplements
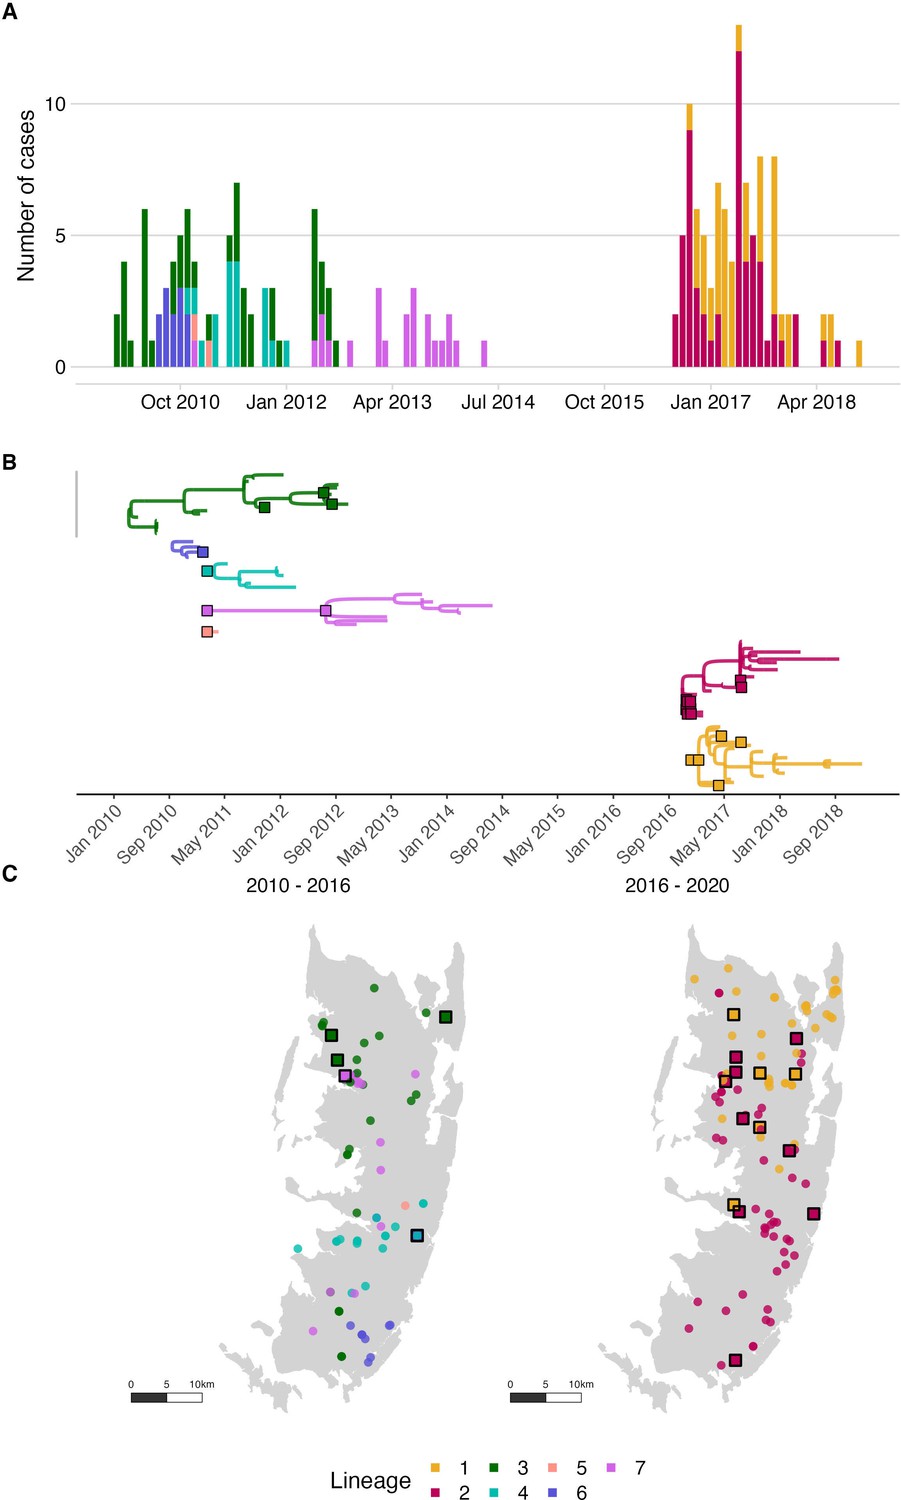
Rabies virus transmission chains inferred from epidemiological and phylogenetic data.
(A) Time series of cases coloured by their transmission chain. (B) Consensus transmission tree (the highest probability transmission links that generate a tree consistent with the phylogeny) with chains pruned such that all unsampled cases are assigned to a sequenced chain of transmission. (C) Spatial distribution of these cases over the two periods. In (B), sequenced viruses from sampled cases are indicated by squares with a black outline, while only the tips are shown for unsampled cases. In (C), unsampled cases are shown by a filled circle. In all panels, the data are coloured by the transmission chain they were assigned to.
Figure 4—figure supplement 1
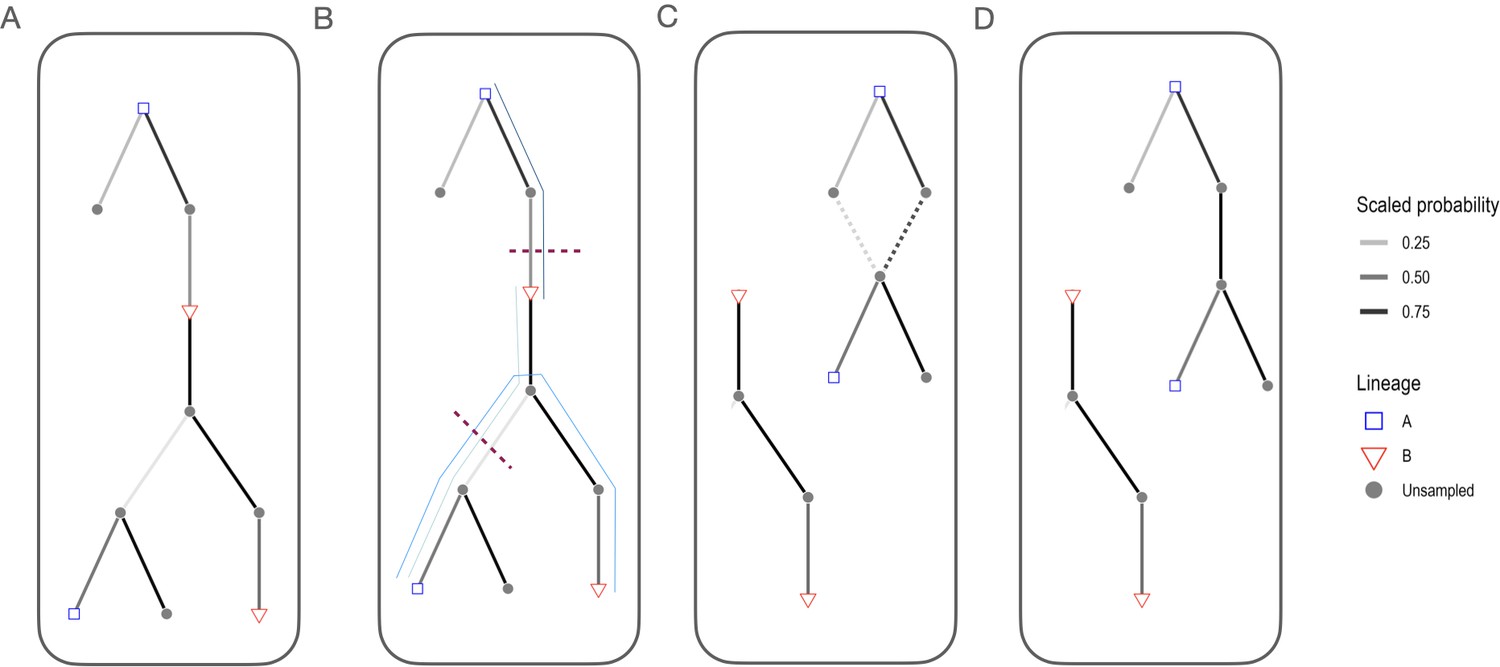
Steps for building transmission trees consistent with phylogenies.
(A) We first assigned progenitors probabilistically based on the serial interval distribution and dispersal kernel, as previously described (Mancy et al., 2022) and built a directed graph based on this tree. (B) We then identify the paths between mismatched edges that are inconsistent with phylogenetic assignments (thin blue lines) and select the links to break first by filtering to the most frequently occurring edges before selecting one edge per path by the scaled probability of the link (selected links to remove are indicated by the red dashed lines, note that the same edge can be removed to resolve multiple phylogenetic mismatches). (C) For cases where links were removed, we reassign progenitors sequentially (in a random order), rescaling the probability to only those progenitors that can generate phylogenetically consistent trees (dashed lines). If no phylogenetically consistent progenitor is identified the case becomes the index case of the transmission chain. Panel (D) shows the final tree with phylogenetically consistent links between cases.
Figure 4—figure supplement 2
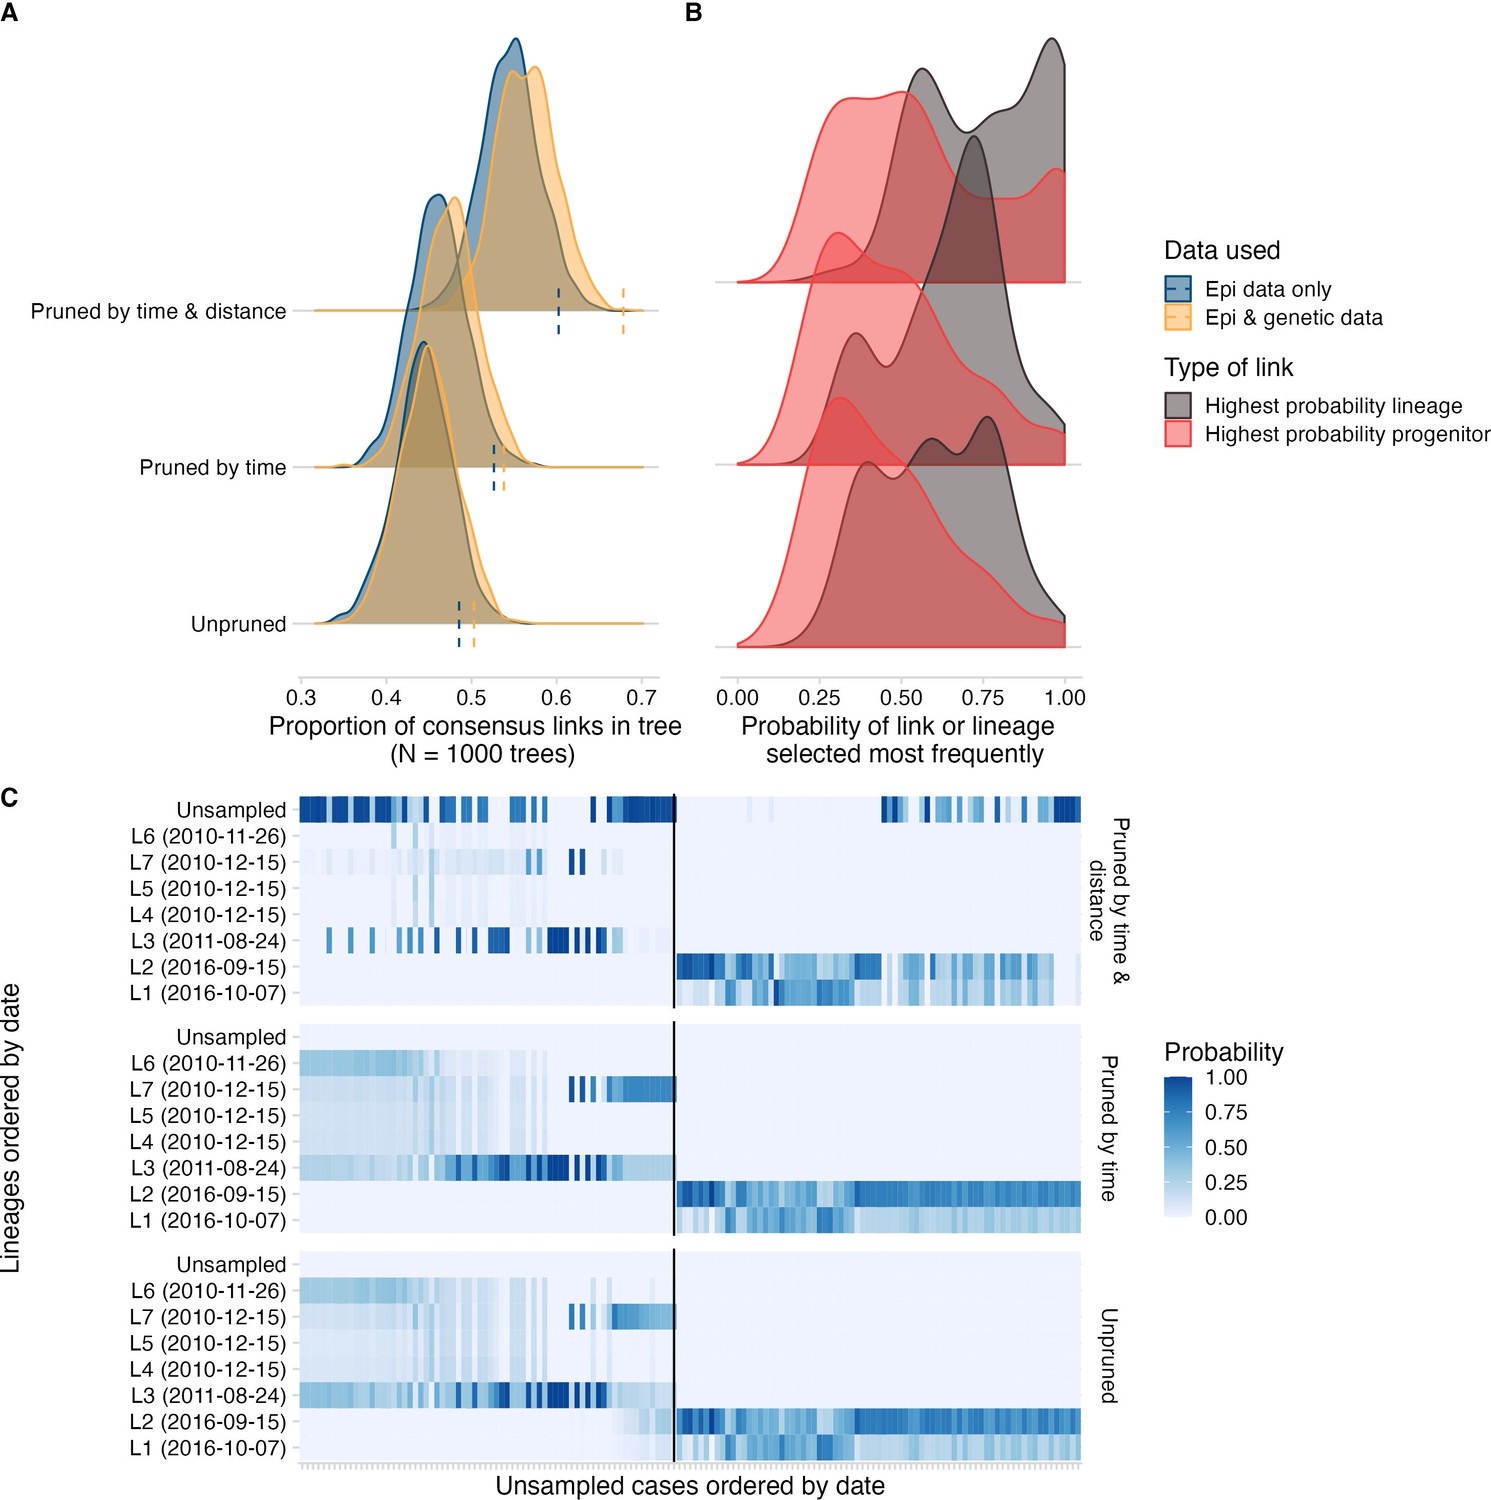
Comparing approaches for transmission tree reconstruction.
(A) The distribution of topological uncertainty (that is what proportion of links in each bootstrapped tree were in the consensus tree) for approaches pruning by time and/or distance thresholds (y-axis) and using epidemiological data only vs. integrating phylogenetic data. (B) For approaches integrating genetic data, the comparison of the consensus progenitor probabilities (i.e. the proportion of times the most frequent progenitor is selected for each) vs. transmission chain probabilities (the proportion of times a case is assigned to the most frequent lineage). (C) For approaches integrating genetic data, the probability at which each unsampled case (x-axis, ordered by the date of symptoms) is assigned to a sampled lineage (y-axis ordered by date of symptoms; chains that were entirely unsampled are at the top). The black line separates pre-2015 cases from those that occurred after i.e. from the outbreak that began in 2016. These plots show how once trees are pruned by the distance kernel cutoff, more cases have a high probability of not being assigned to a genetic lineage.
Figure 4—figure supplement 3
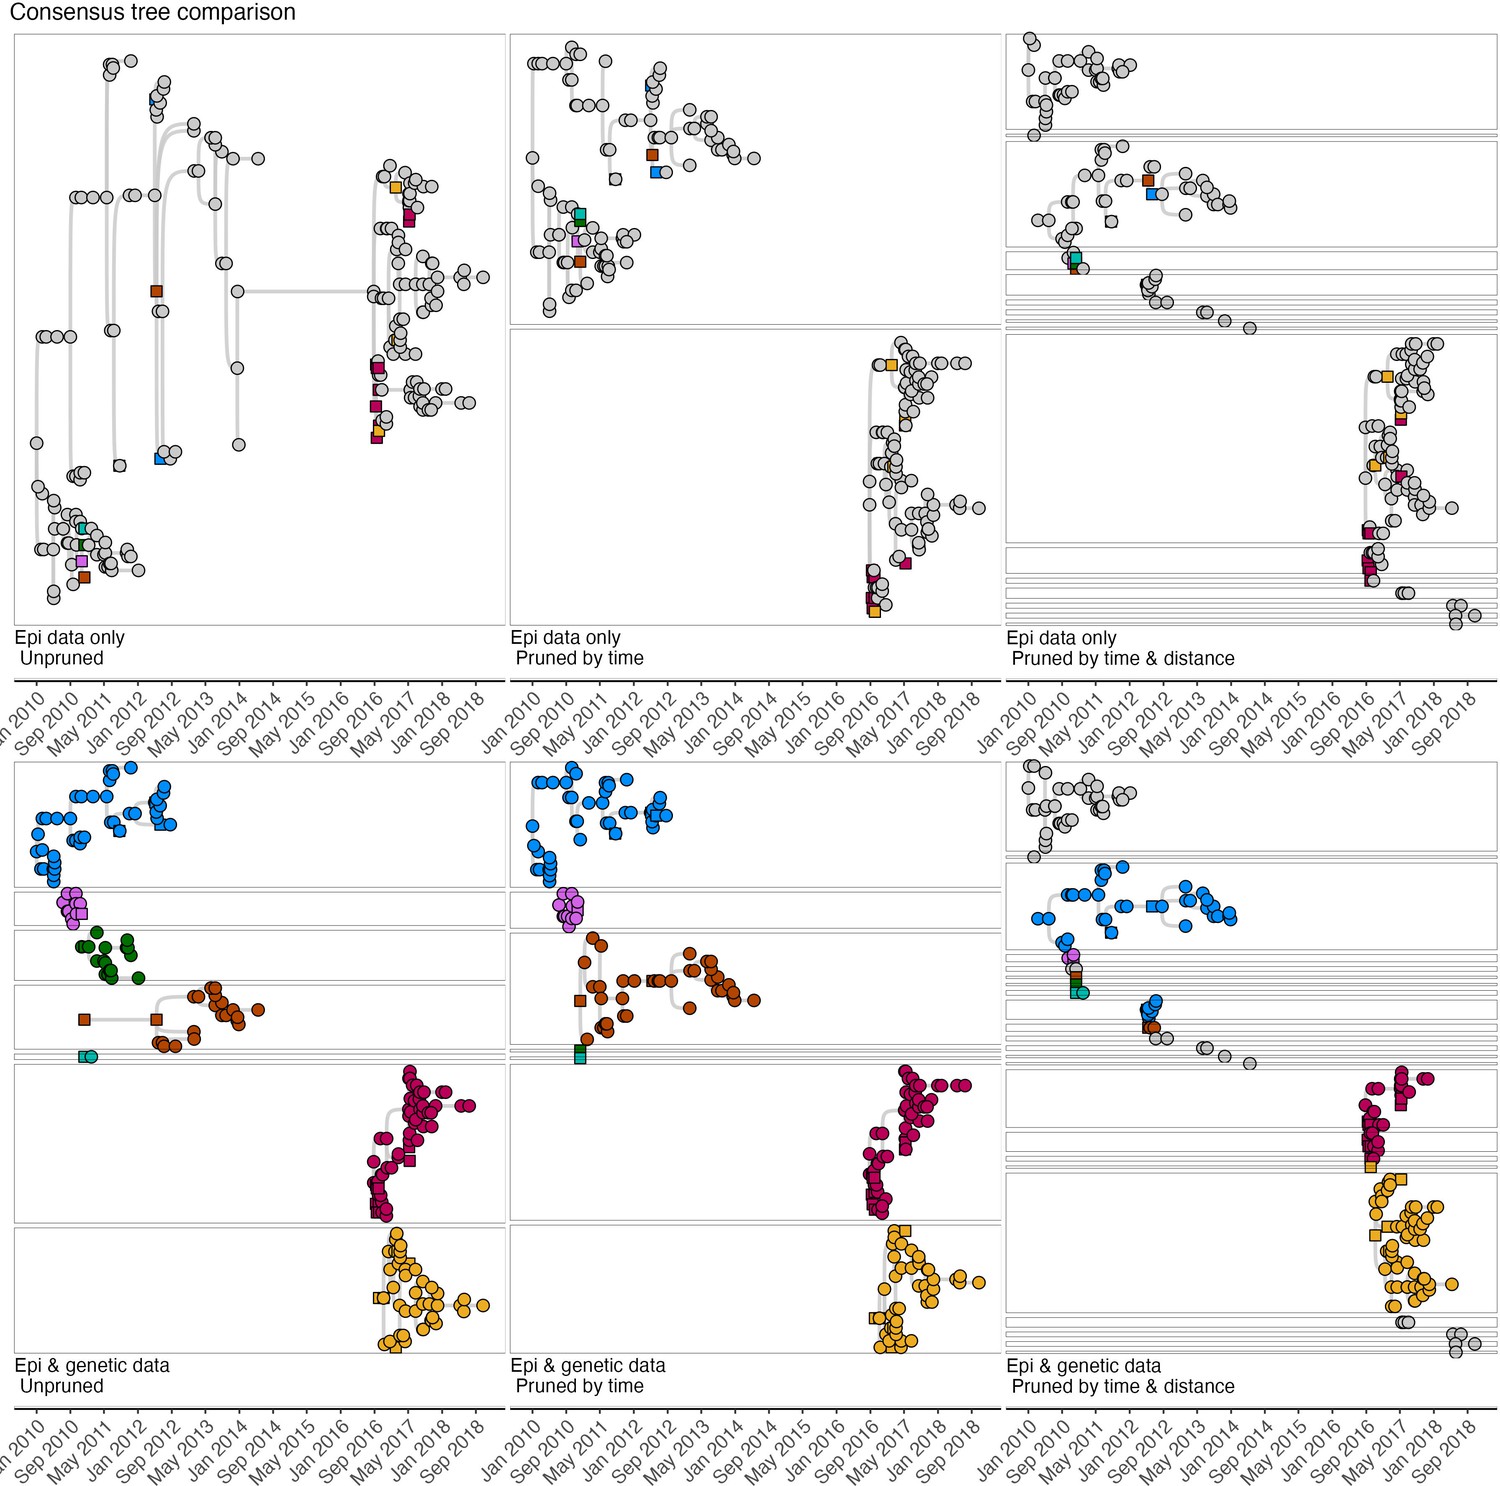
Comparison of the consensus transmission trees (i.e.the most frequently assigned progenitors for each case) across pruning algorithms.
Squares indicate cases that were sampled, and their viruses sequenced, and circles indicate cases without sequence data. The top row therefore illustrates progenitor assignments (and resulting trees) without lineage assignments from sequence data although sequenced cases coloured by lineage are shown. Without pruning all cases are assigned to a single consensus tree (top left), which is split into two trees, and then multiple lineages when pruned by time (centre) and distance (right) cutoffs, respectively. Horizontal lines delineate lineages, which increase with use of sequence data and pruning. Grey cases apparent in trees when sequence data is included, represent orphaned singletons or relatively short-transmission chains for which immediate progenitors are not assigned when pruning is applied.
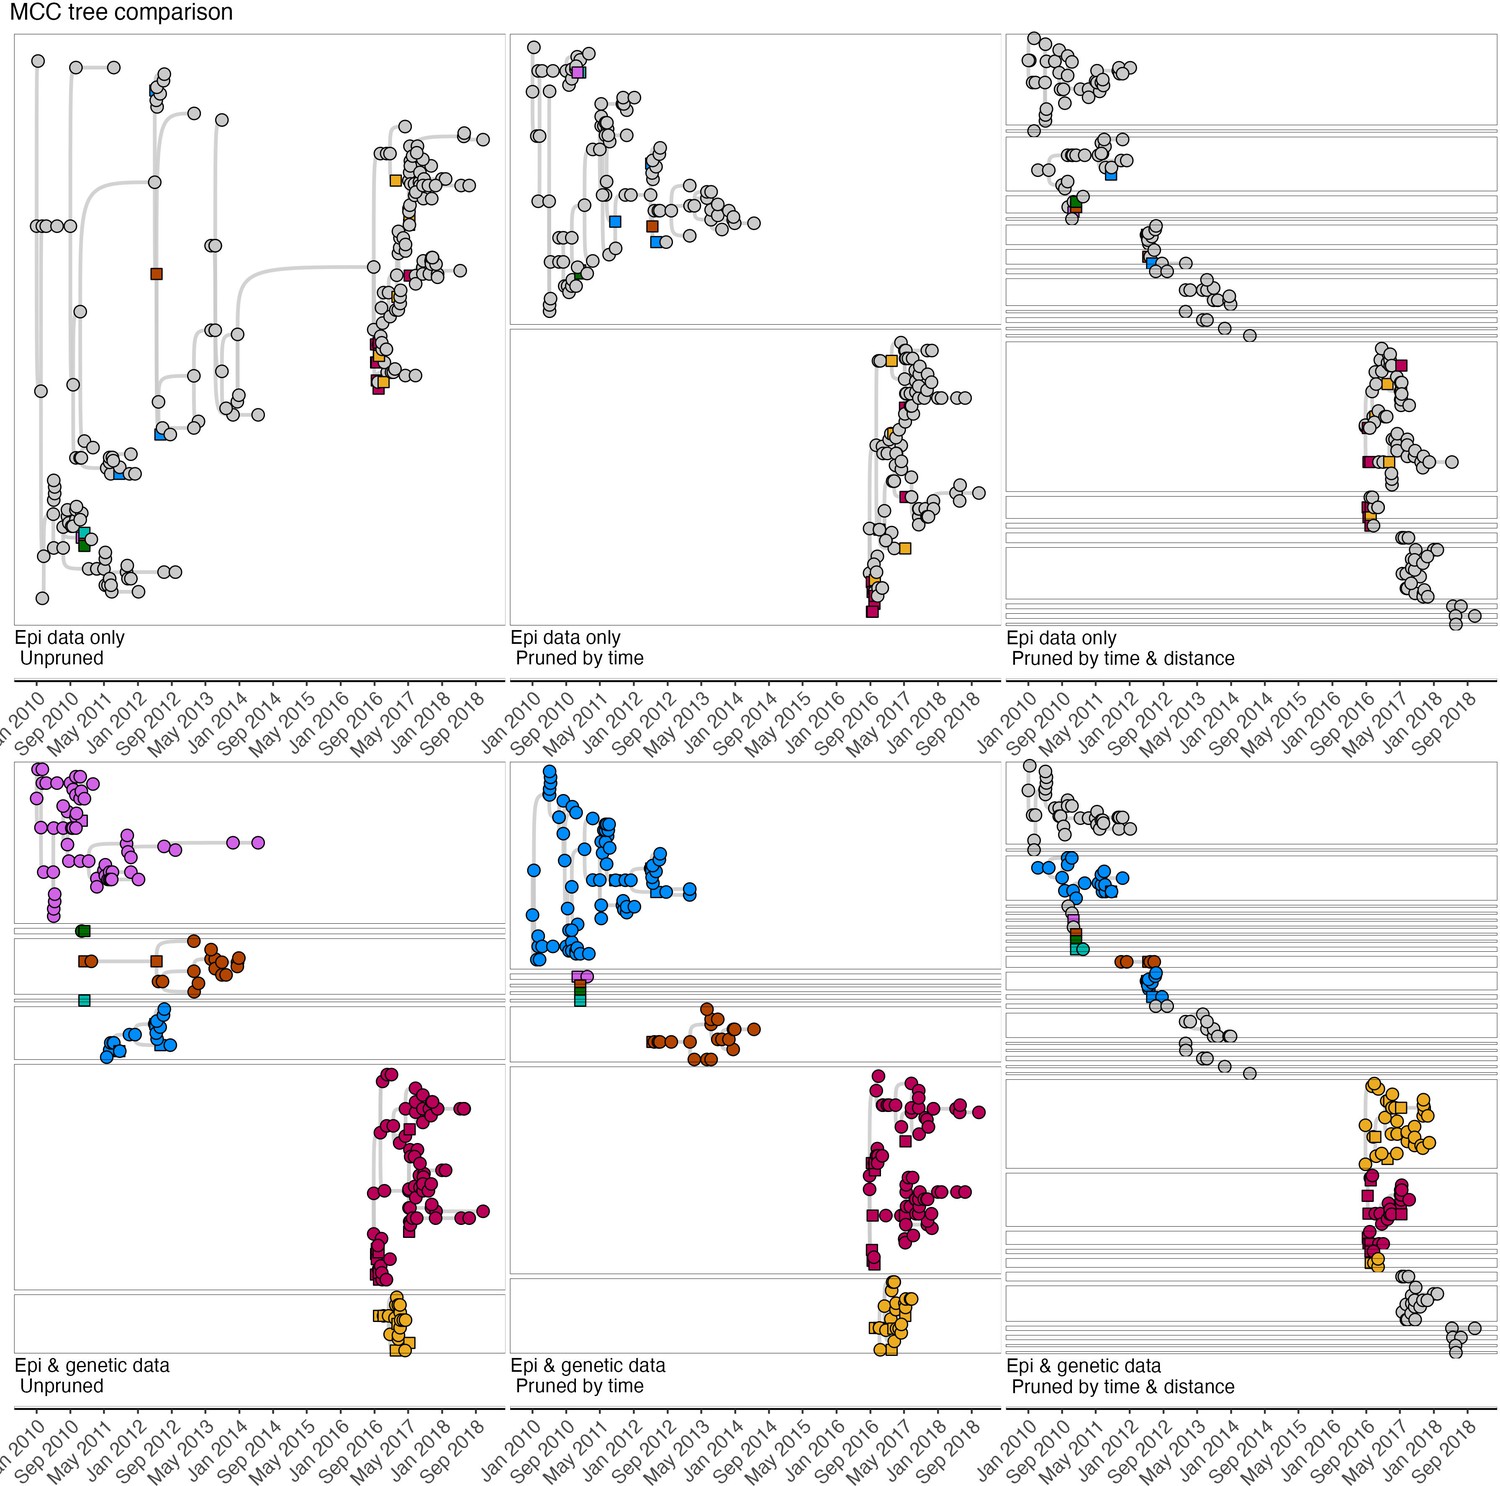
Figure 4—figure supplement 4
Comparison of maximum-clade credibility (MCC) trees (the tree within the bootstrap that had the highest product of progenitor probabilities) across pruning algorithms.
Squares indicate cases that were sampled, and their viruses sequenced, and circles indicate cases without sequence data. Tree interpretation follows the guidance detailed for (Figure 4—figure supplement 3) and visual differences between trees illustrated in Figure 4—figure supplements 3–5 indicate different progenitor assignments under the alternate tree summaries.
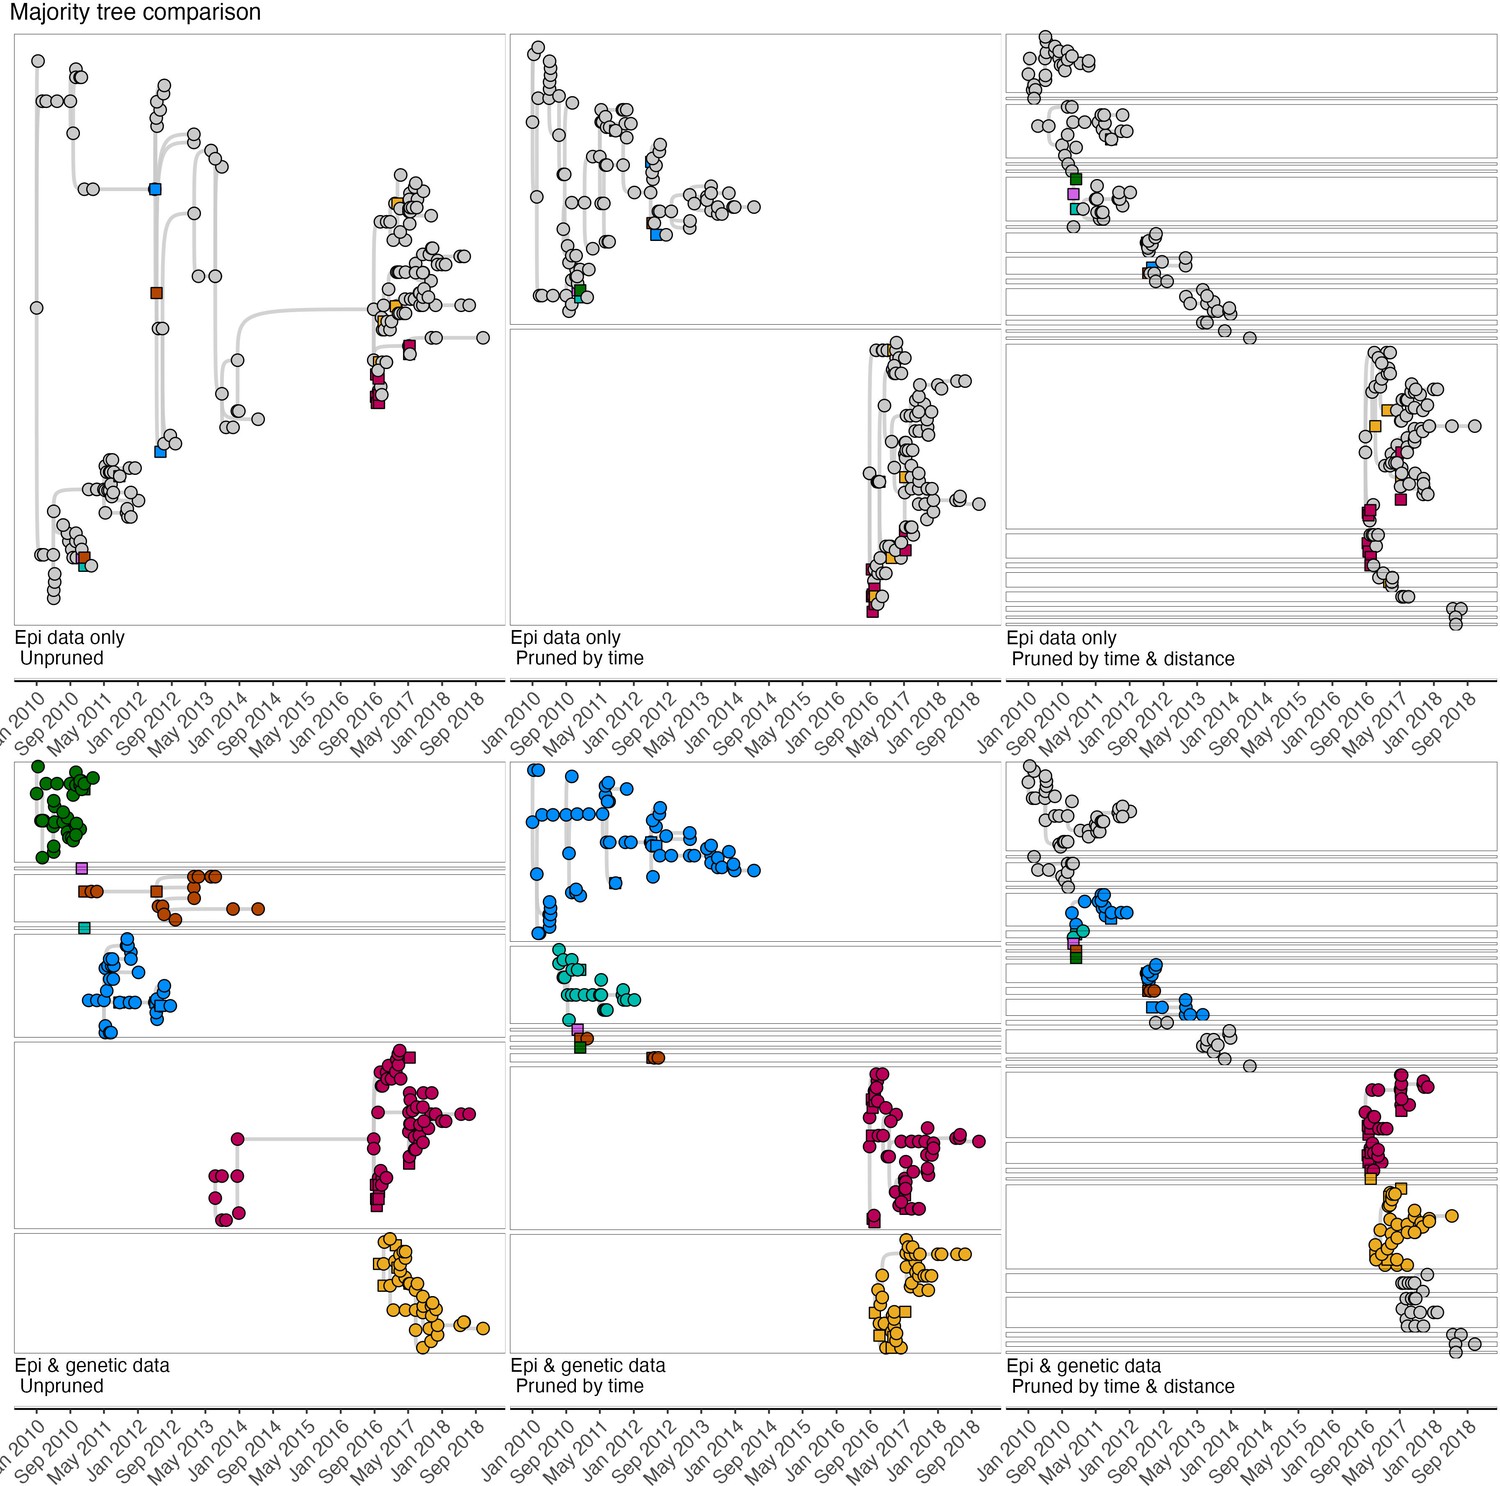
Figure 4—figure supplement 5
Comparison of the majority tree (the tree within the bootstrap that had the highest number of consensus progenitors) across pruning algorithms.
Squares indicate cases that were sampled, and their viruses sequenced, and circles indicate cases without sequence data. Tree interpretation follows the guidance detailed for Figure 4—figure supplement 3 and visual differences between trees illustrated in Figure 4—figure supplements 3–5 indicate different progenitor assignments under the alternate tree summaries.
Figure 4—figure supplement 6
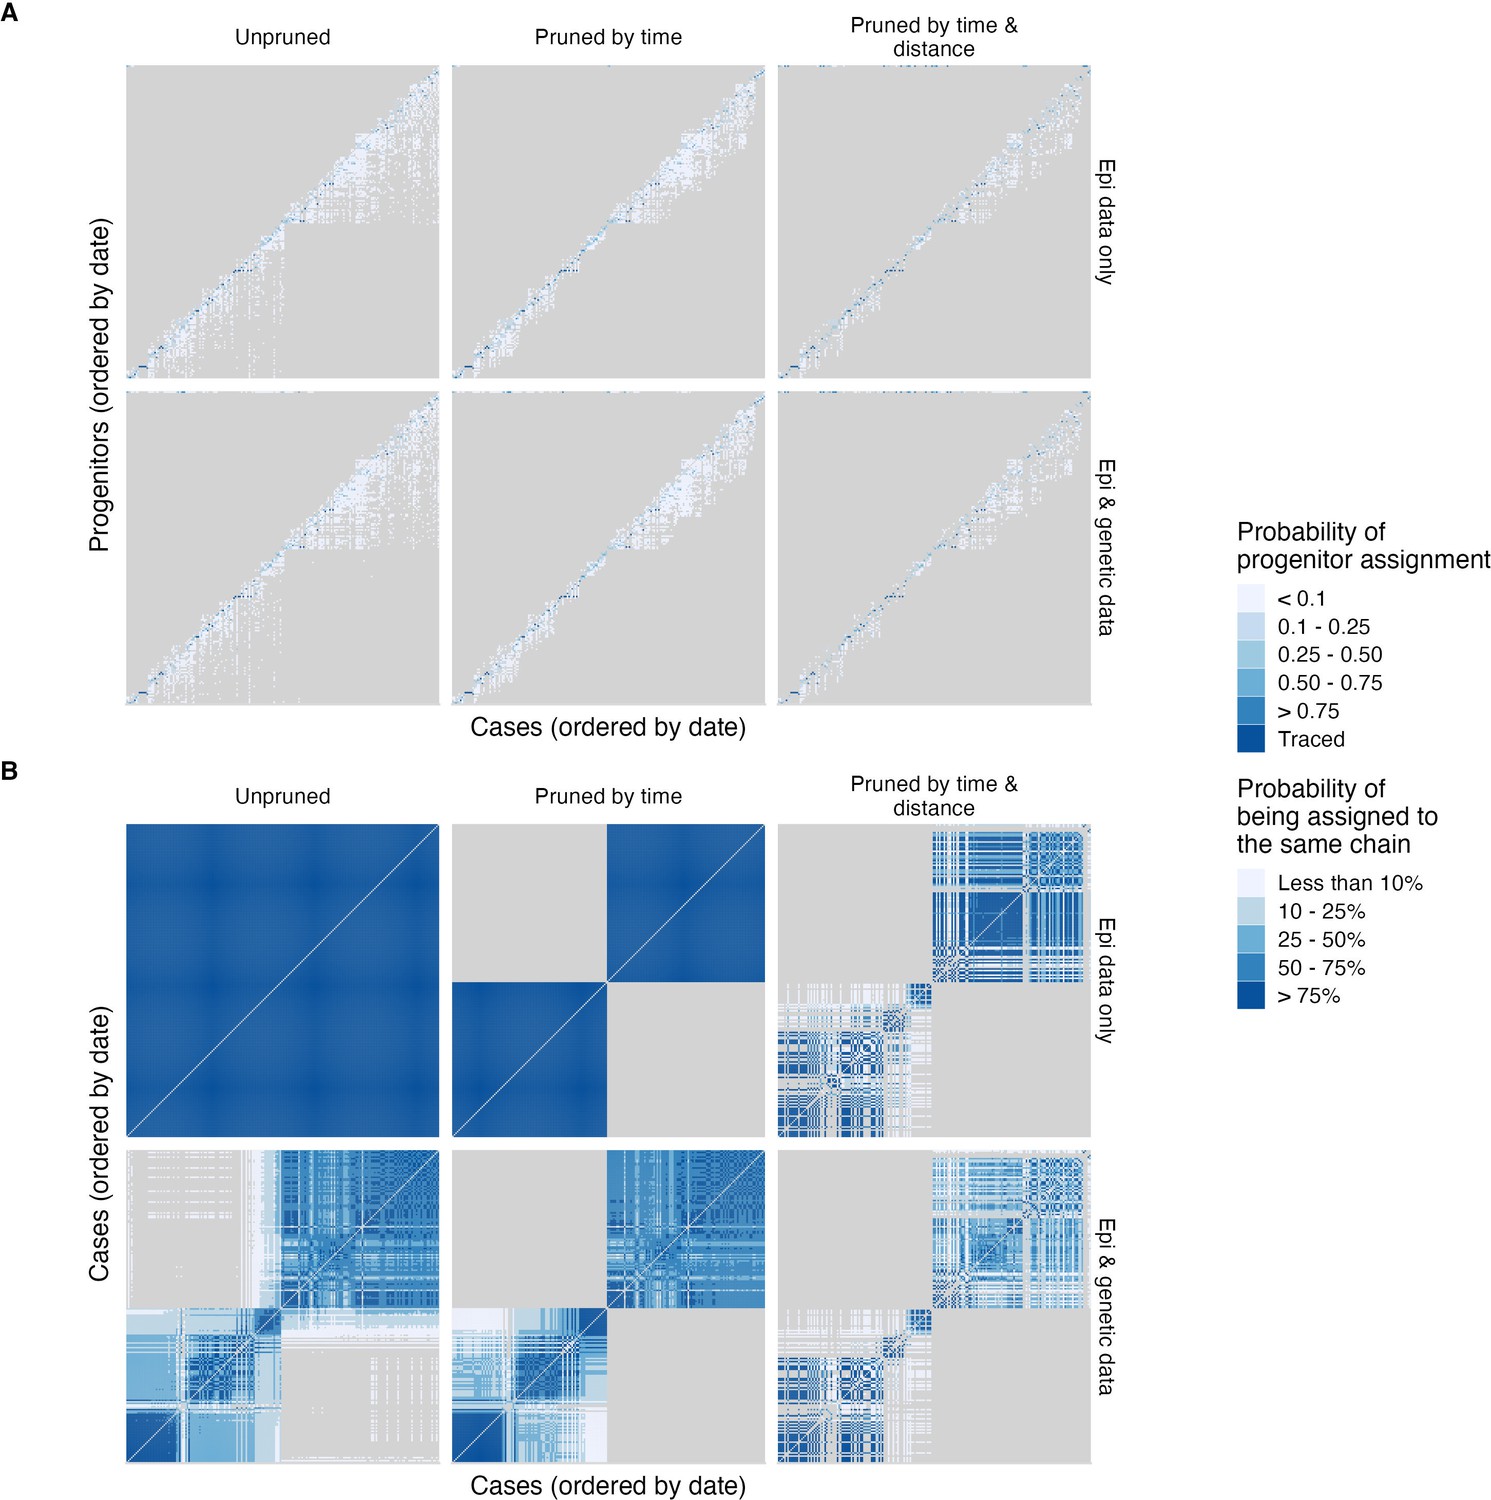
Comparison of tree topologies across transmission tree reconstruction algorithms.
(A) Probability of progenitor assignments for each case (across 1000 trees) and (B) pairwise probability of each case pair belonging to the same transmission chain (i.e. of being assigned to the same chain for each case pair across all 1000 trees). Progenitor assignments get increasingly constrained with increased stringency of pruning criteria (left to right). Without pruning or inclusion of sequence data, all cases are assigned to a single tree (B, top left). Sequence data and time interval cutoffs lead to differentiation of lineages, whereas distance cutoffs increase orphaned cases, likely due to increased separation from unsampled intermediates or human-mediated movement of incubating animals.
Figure 5 with 1 supplement
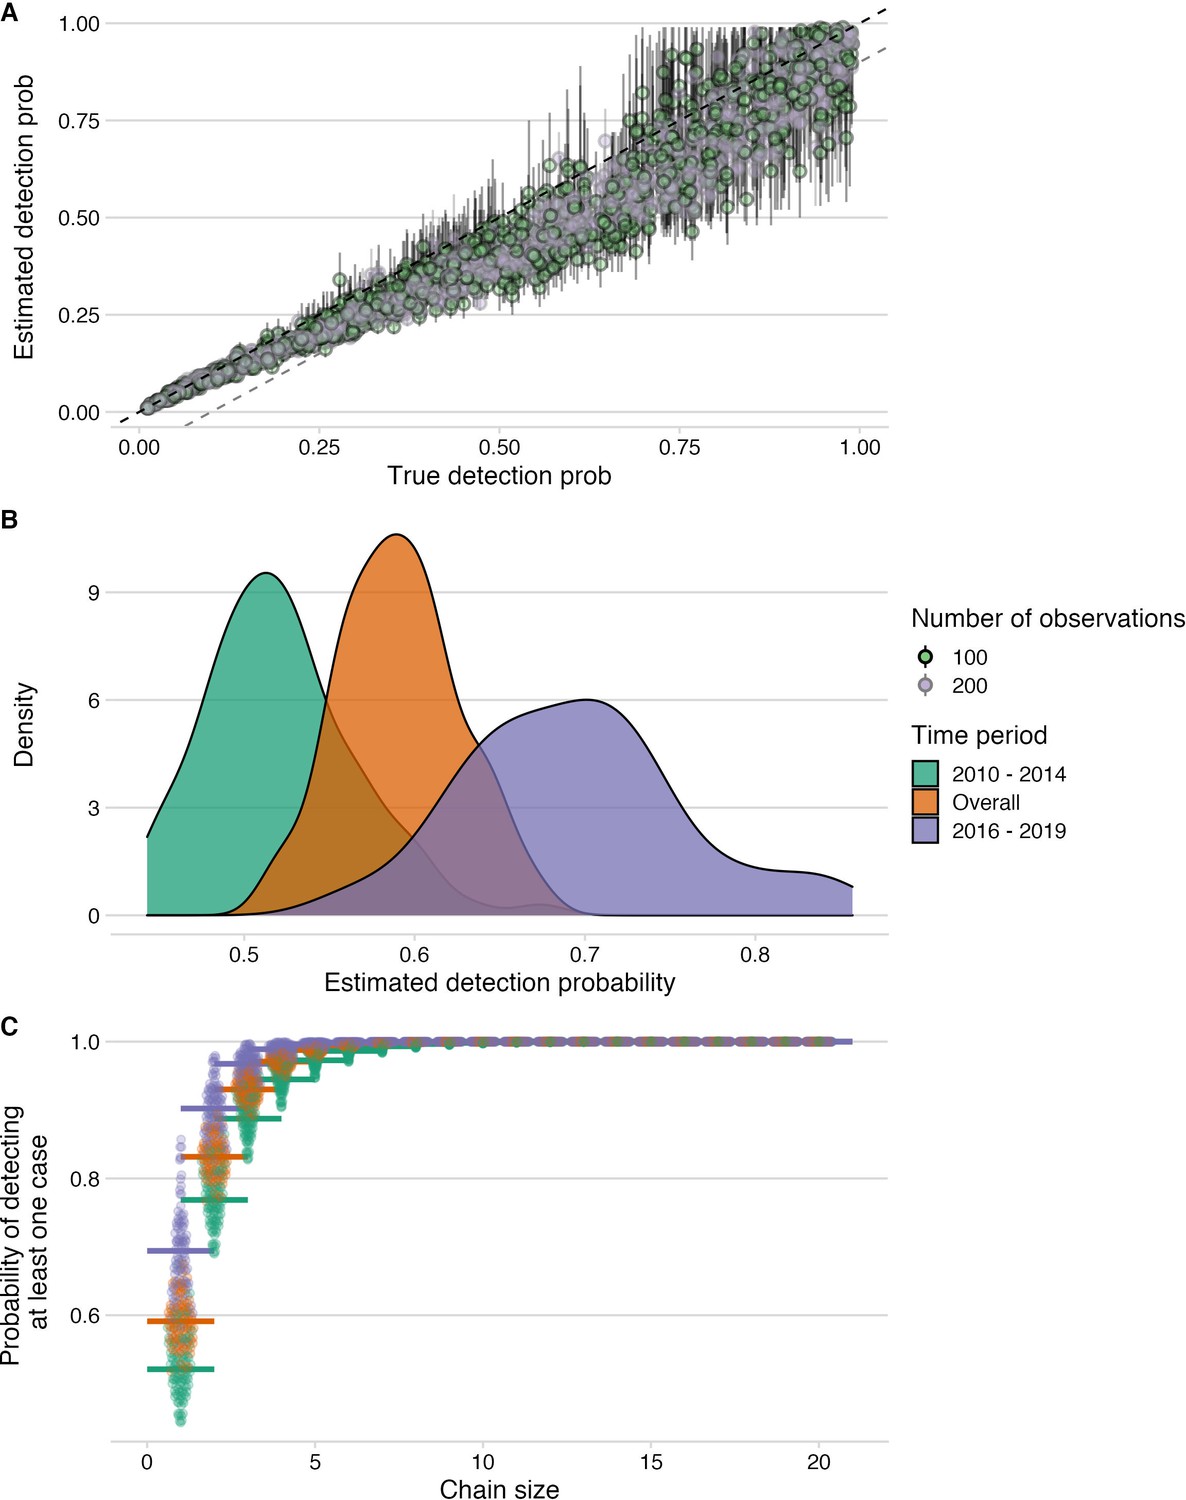
Estimation of detection probabilities.
(A) Estimated detection probabilities from simulated times between linked cases given a known detection probability (x-axis). Colours indicate the number of detected cases used in the simulations. The points show the mean and the lines the range of 10 estimates per simulation. The black dashed line shows the 1:1 line and the grey dashed line the 1.1:1 line. Estimates of detection from these simulations are generally recoverable, although with smaller sample sizes, the estimates are more dispersed. (B) Detection probabilities estimated from times between linked cases using the tree algorithm with pruning by the phylogenetic data only. For the estimation, the times between linked cases for a subsample of bootstrapped trees (N=100), as well as the MCC and the majority tree were used. The colours indicate the period for which estimates were generated, 2010–2014 (pre-elimination), 2016–2018 (reemergence) and overall combining cases. (C) Probability of detecting at least one case given estimated detection probabilities and chain sizes (x-axis) with colours corresponding to the period for which estimates were generated.
Figure 5—figure supplement 1
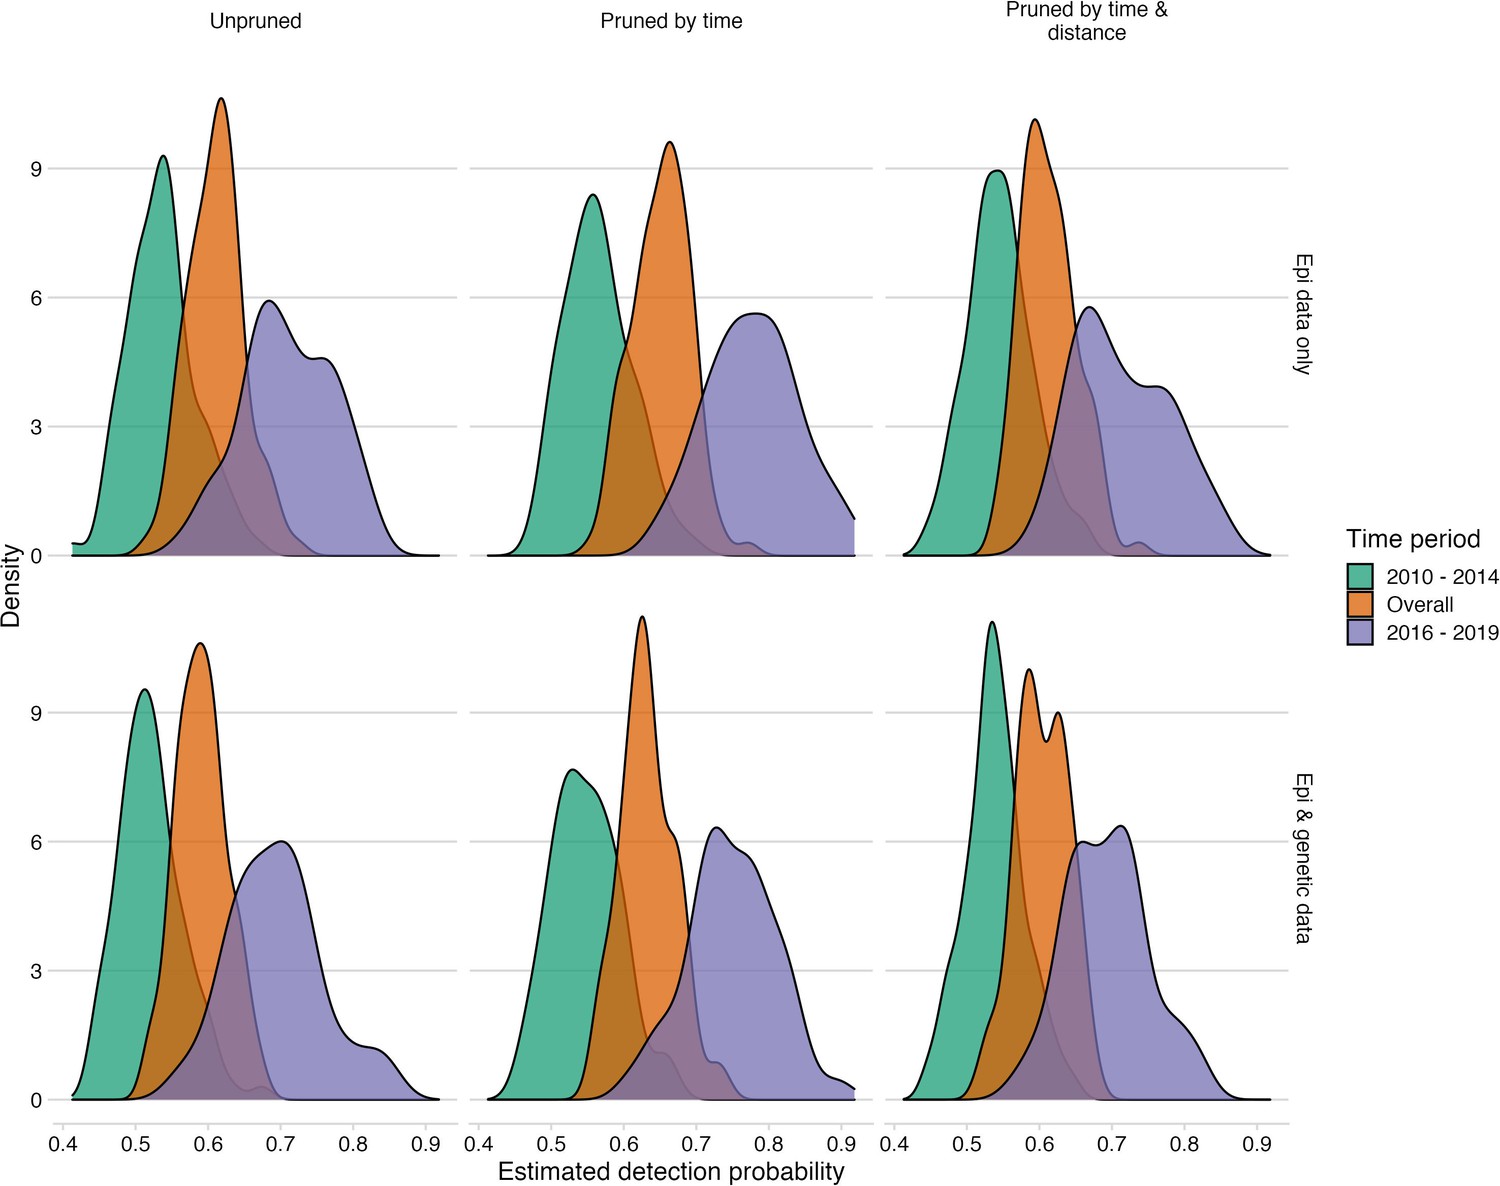
Comparison of detection estimates across pruning algorithms and with the inclusion of phylogenetic information.
For the estimation of case detection, the times between linked cases for a subsample of bootstrapped trees (N=100), as well as the MCC and the majority tree were used. The colours indicate the period for which estimates were generated, 2010–2014 (the pre-elimination period), 2016–2019 (the reemergence period) and overall combining cases. We found estimates to be robust to the alternative tree pruning algorithms, and with and without phylogenetic information.
Figure 6
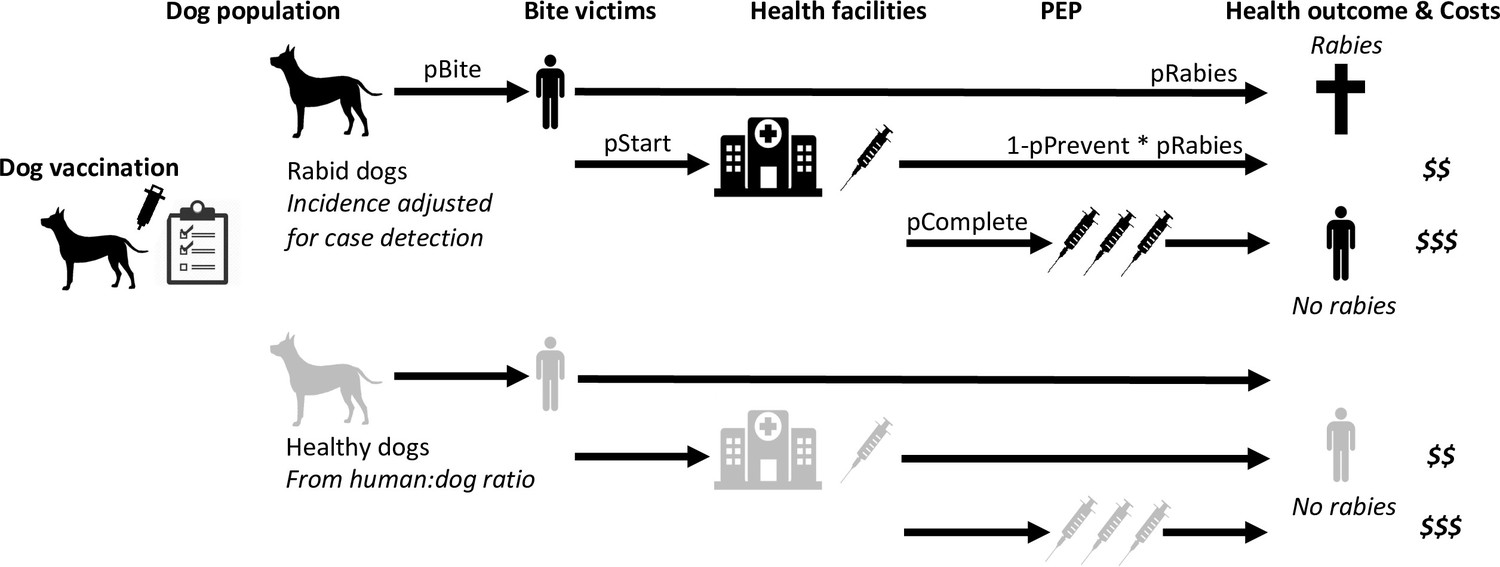
Probabilistic decision tree model highlighting mechanisms underpinning health and economic outcomes.
Bites per rabid dog (pBite) were drawn from a negative binomial distribution (μ=0.75, k=0.54, fitted to data in Figure 2B), while health seeking behaviour of bite victims was modelled to depend on PEP policies. Under free PEP the probability of rabid bite victims presenting and starting PEP (pStart) was 0.783, reducing to 0.667 when PEP was charged for. Healthy bite patients were approximated by 1% of dogs biting per year with the same distribution of bites per dog (pBite) as for rabid dogs when PEP was free, but reduced fourfold (to 0.25%) when patients were charged for PEP. Rabid bite victims developed rabies with probability 0.165 (pRabies) in the absence of PEP and complete PEP was considered 100% effective in preventing rabies, whereas incomplete PEP prevented rabies (pPrevent) with probability 0.986 (Changalucha et al., 2019). Dog vaccination determined the trajectory of rabies incidence drawing from case-detection adjusted time series (see modelled time series of rabies exposures, Figure 7).
Figure 7
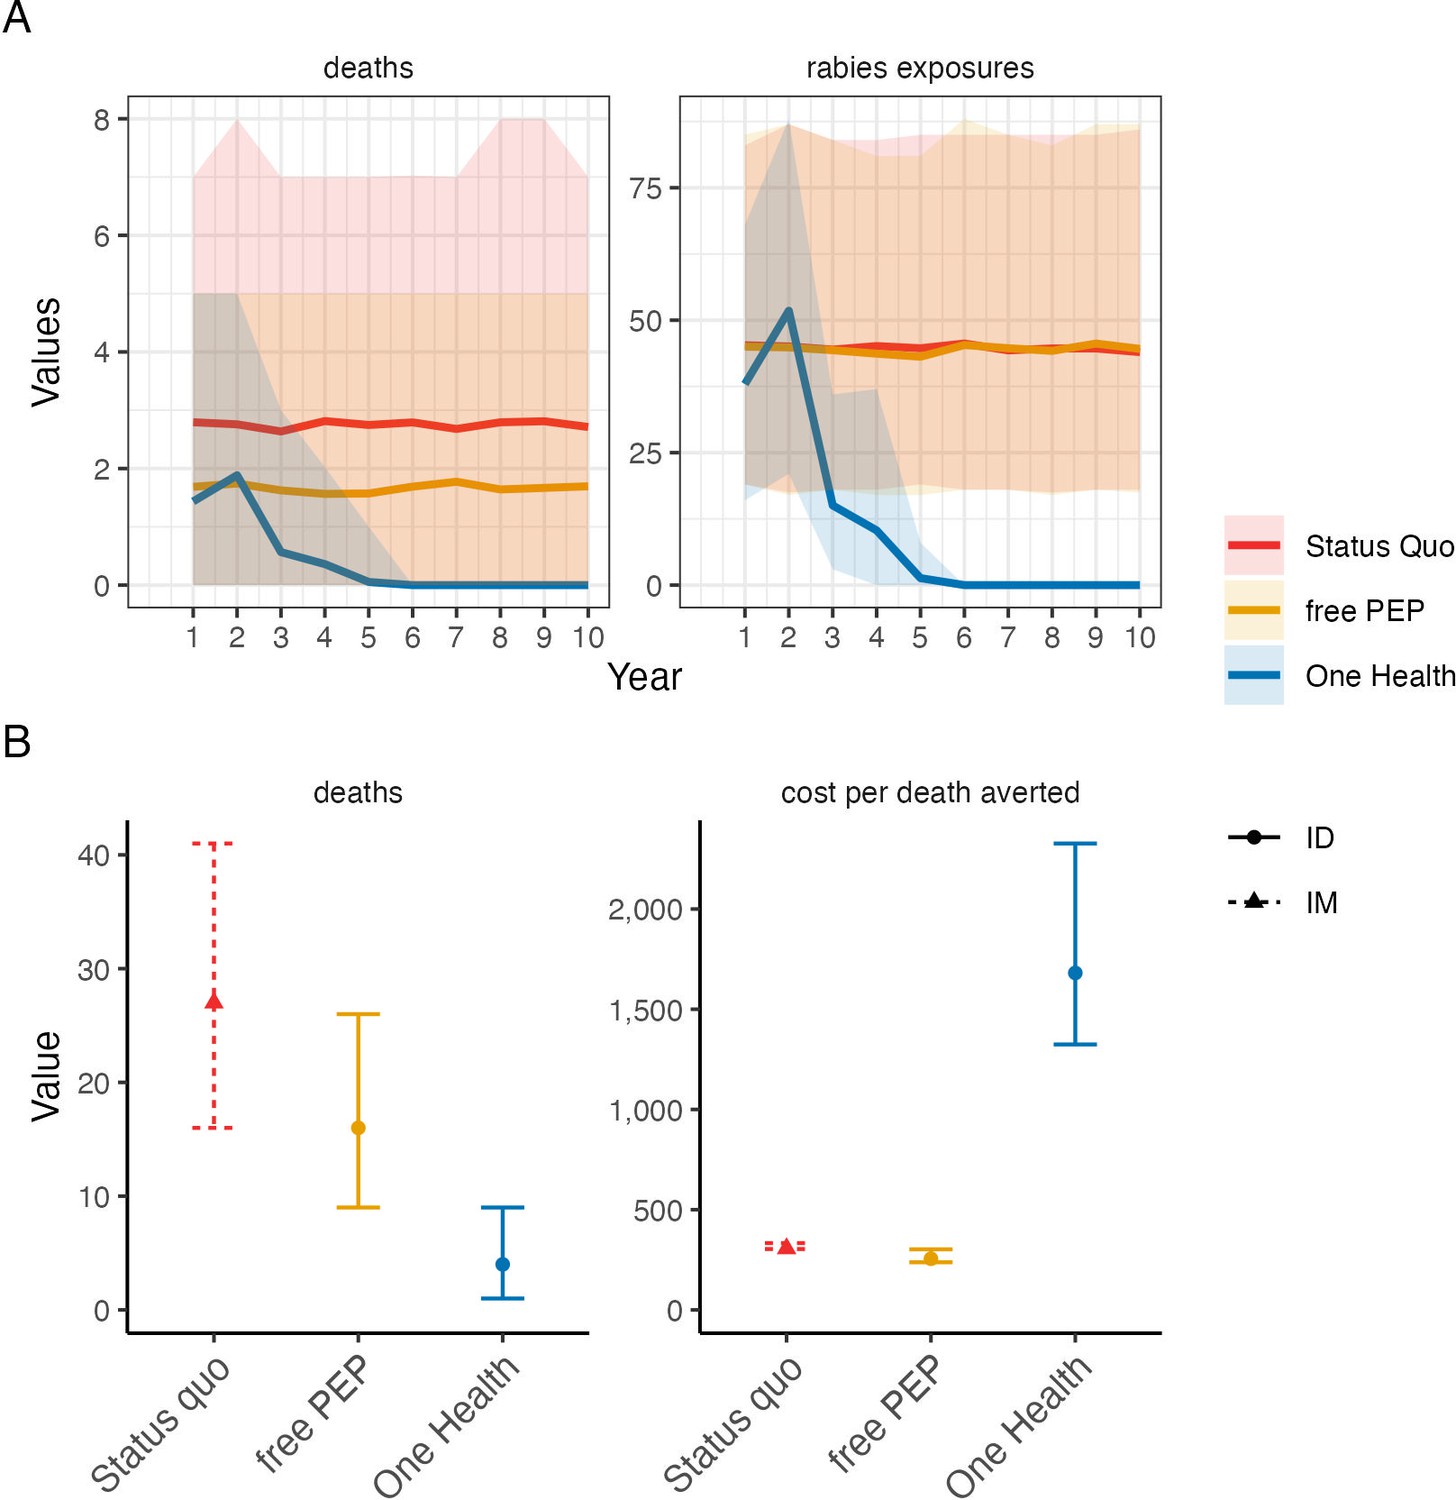
Comparison of cost-effectiveness of rabies control and prevention scenarios.
(A) Projected human rabies deaths (left) and rabies exposures (right) over ten-year time horizon under (i) status quo without dog vaccination and with PEP charged to patient; (ii) free intradermal (ID) post-exposure vaccines, and (iii) a One Health approach with free PEP and routine dog vaccination. Solid lines indicate mean values and shaded envelopes show 95% prediction intervals (PIs). (B) Resulting deaths and cost per death averted with 95% PIs. Costs were modelled from estimates of annual island-wide dog vaccination campaigns and of intramuscular (IM) PEP regimens (4-dose Essen, used under status quo) and ID PEP (updated Thai Red Cross, introduced with rabies demonstration project) using data compiled in Supplementary file 2.
Videos
Video 1
Rabies cases and inferred transmission chains on Pemba Island.
Transmission reconstruction using the consensus links consistent with the phylogenetic assignments. Cases are animated each month, with animals that are incubating infections shown as empty circles until infectious when they transition to filled circles (note that many cases become infectious within the same month of exposure). Inferred transmission links are shown by curved lines and at the approximate time of the exposure event, coloured by transmission chain. Cases identified as introductions are designated by a filled square. The top panel shows the monthly time series of cases by transmission chain.
Tables
Table 1
Characteristics of probable human rabies deaths and reported reasons for inadequate Post-Exposure Prophylaxis (PEP).
| Year | Age | Bite site(s) | Type of wound | Reasons for not seeking PEP |
|---|---|---|---|---|
| 2010 | 11–15 years | Both hands and the left palm | Severe wounds with broken bones | After the first hospital visit, the child’s family was not advised by health workers to return for subsequent PEP doses and family members were not aware of PEP requirements. |
| 2010 | >50 years | Lower left leg and upper thigh | Deep wounds with multiple tooth penetrations | Victim sought care at a facility (dispensary) that did not provide PEP. Received only first aid without referral to hospital for PEP. |
| 2010 | >50 years | Head (nose) and right arm | Lacerations to nose, large bite to arm, deep tooth penetration | After the wounds healed the victim did not seek their second or subsequent doses of PEP. |
| 2017 | 6–10 years | Neck | Large wound | PEP shortages in Pemba hospitals and prohibitive costs of seeking PEP elsewhere. |
| 2017 | 11–15 years | Face/head and shoulders | Severe wounds that led to hospitalisation | PEP shortages at the hospital where the victim was admitted. Health workers did not advise immediate PEP be sought from elsewhere. |
| 2017 | >50 years | Shoulders, legs, and chest | Large wounds with deep tooth penetrations | Victim thought a single dose of PEP was sufficient for protection and ignored health worker advice to seek subsequent doses. |
Additional files
-
Supplementary file 1
Epidemiological and next generation sequencing (NGS) metadata.
Data detailed for the 22 rabies virus isolates newly sequenced for this study.
- https://cdn.elifesciences.org/articles/85262/elife-85262-supp1-v2.xlsx
-
Supplementary file 2
Costs of rabies control and prevention activities.
Exchange rate: 1 USD: 2296 Tsh (bank of Tanzania, 05/05/2022 https://www.bot.go.tz/). MoLDF = Ministry of Livestock Development and Fisheries, Tanzania; LTRA = Land transport regulatory authority; DoLD = Department of Livestock Development, Pemba. MSD = Medical Stores Department. LFO = Livestock Field Officer. *We do not include costs of vaccine collection from the airport. **each injection requires 5 minutes of health worker time and up to 8 injections per PEP course.
- https://cdn.elifesciences.org/articles/85262/elife-85262-supp2-v2.docx
-
MDAR checklist
- https://cdn.elifesciences.org/articles/85262/elife-85262-mdarchecklist1-v2.pdf
Download links
A two-part list of links to download the article, or parts of the article, in various formats.
Downloads (link to download the article as PDF)
Open citations (links to open the citations from this article in various online reference manager services)
Cite this article (links to download the citations from this article in formats compatible with various reference manager tools)
Integrating contact tracing and whole-genome sequencing to track the elimination of dog-mediated rabies: An observational and genomic study
eLife 12:e85262.
https://doi.org/10.7554/eLife.85262


