Lipid hydroperoxides promote sarcopenia through carbonyl stress
- Diabetes and Metabolism Research Center, University of Utah, United States
- Molecular Medicine Program, University of Utah, United States
- Department of International Tourism, Nagasaki International University, Japan
- Department of Physical Therapy & Athletic Training, University of Utah, United States
- Sciex, United States
- Department of Nutrition & Integrative Physiology, University of Utah, United States
- Metabolomics Core Research Facility, University of Utah, United States
- Fraternal Order of Eagles Diabetes Research Center, University of Iowa, United States
- Department of Cell Systems and Anatomy, The University of Texas Health Science Center at San Antonio, United States
- Department of Biochemistry, University of Utah, United States
Figures
Figure 1 with 1 supplement
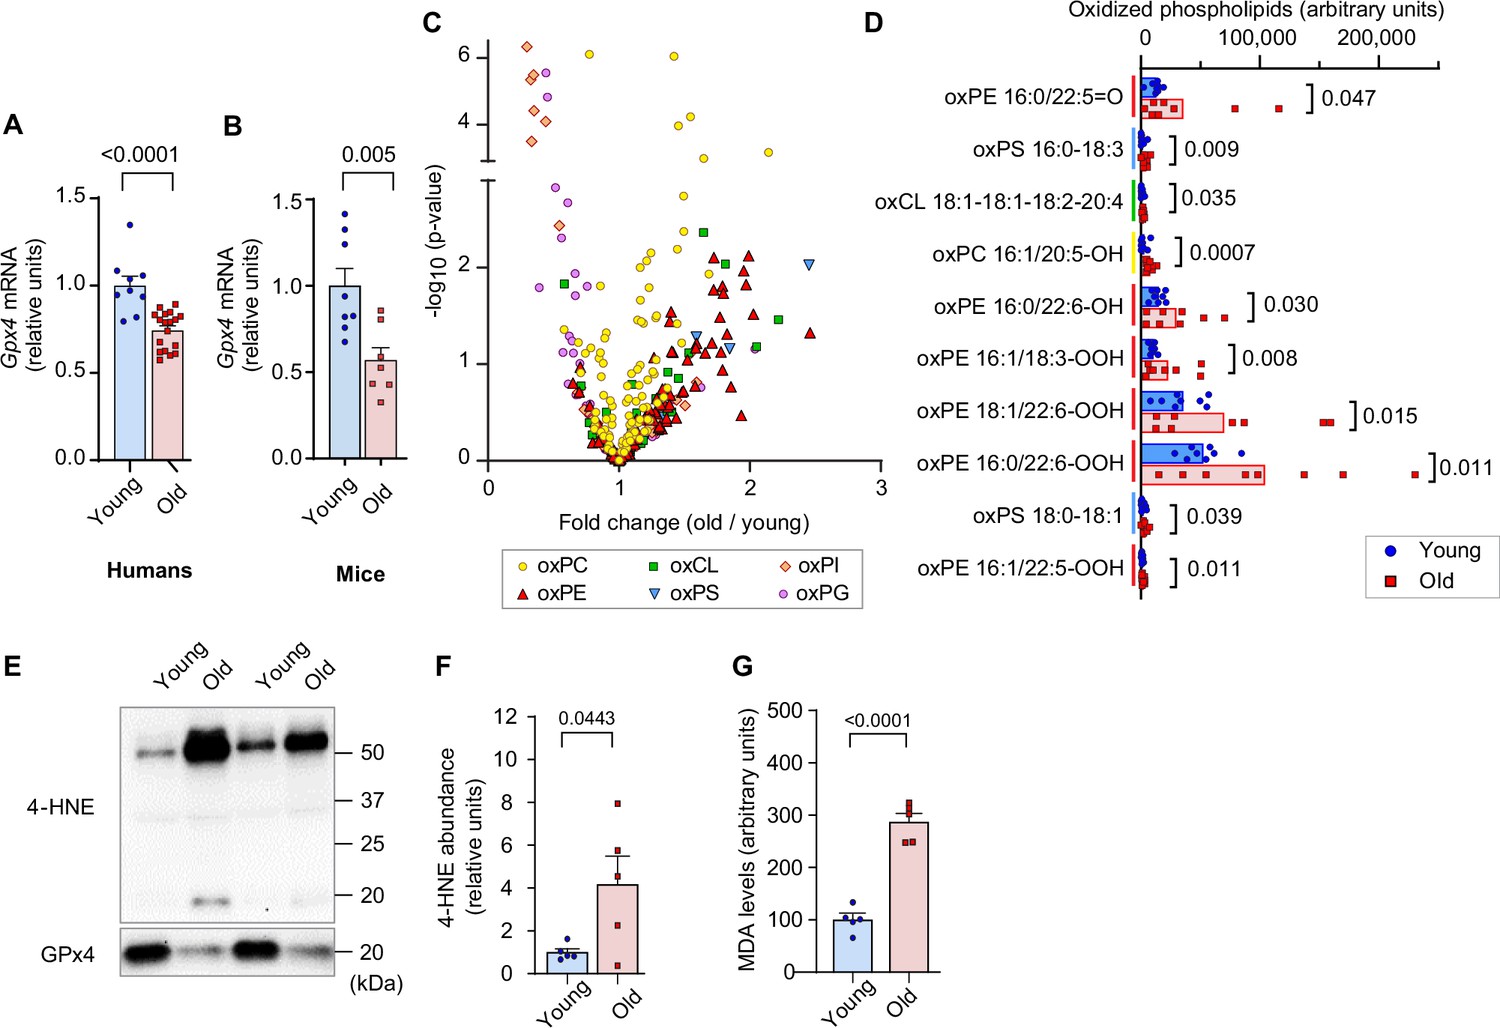
Lipid hydroperoxides (LOOH) increases with age in skeletal muscle.
(A, B) Glutathione peroxidase 4 (Gpx4) mRNA levels in skeletal muscle biopsy samples from young and old humans (n=9 young [2 men and 7 women], n=18 for old [11 men and 7 women]) (A) or gastrocnemius muscles from young and old mice [n=8 for young, n=7 for old] (B). (C, D) Oxidized phospholipid content in gastrocnemius muscles from young and old male mice (n=8 per group). (E, F, G) Immunoblotting (E) and quantification (F) of 4-hydroxynonenal (4-HNE) proteins (n=5 per group) and malondialdehyde (MDA) levels (G) (n=3 per group) in gastrocnemius muscles. Male mice were used. Data are shown as the mean ± SEM. Statistical analyses in (A, B, C, D, F) and (G) were performed with an unpaired two-tailed t-test.
-
Figure 1—source data 1
Original western blots.
- https://cdn.elifesciences.org/articles/85289/elife-85289-fig1-data1-v2.zip
Figure 1—figure supplement 1
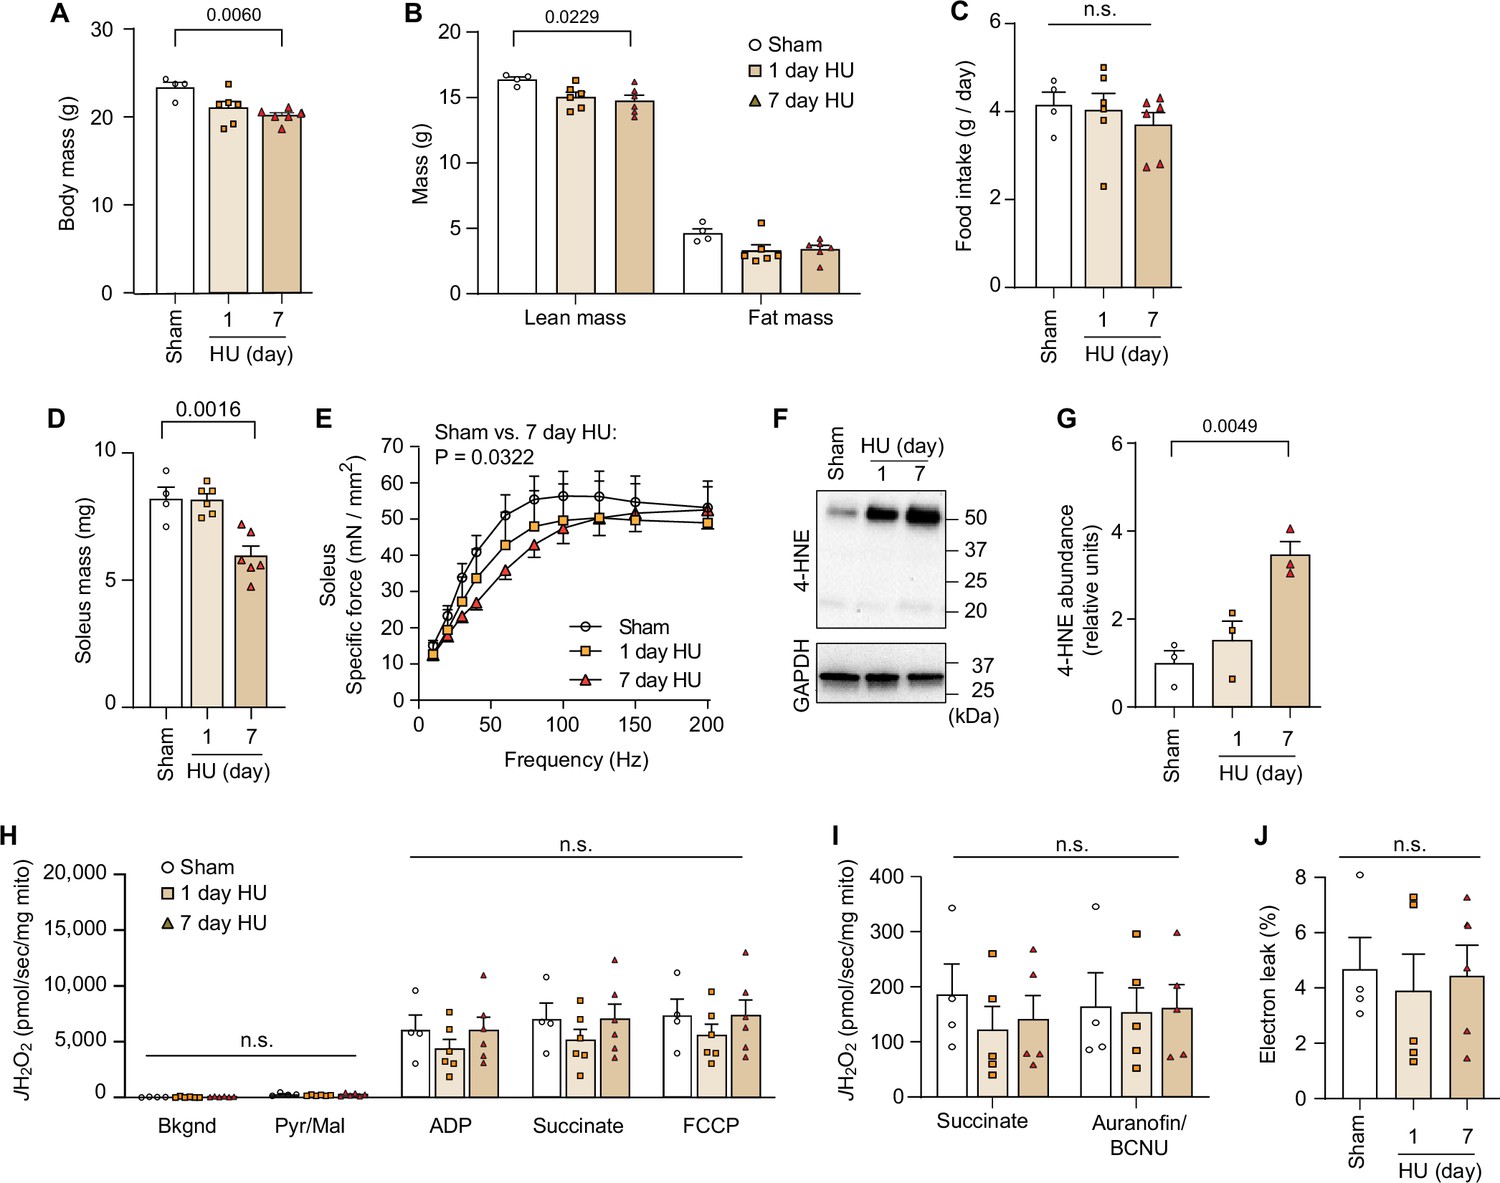
Disuse promotes lipid hydroperoxides (LOOH) in skeletal muscle.
(A, B, C) Body mass (A), body composition (B), food intake (C), following 1 and 7 days of hindlimb unloading (HU) from young wildtype (WT) C57BL/6J mice (n=4 for sham, n=6 for 1-day HU, n=6 for 7-day HU). (D, E) Soleus muscle mass (D), force-frequency curve (E) in soleus muscle following 1 and 7 days of HU from young WT C57BL/6J mice (n=4 for sham, n=6 for 1-day HU, n=6 for 7-day HU). (F, G) Immunoblotting (F) and quantification (G) of 4-hydroxynonenal (4-HNE) in gastrocnemius muscles following 1 and 7 days of HU (n=3 per group). (H) Rates of oxygen consumption measured in mitochondria (gastrocnemius muscle) with Krebs cycle substrates (n=4 for sham, n=6 for 1-day HU, n=6 for 7-day HU). ADP, adenosine diphosphate; FCCP, carbonyl cyanide-p-trifluoromethoxyphenylhydrazone; Mal, malate; Pyr, pyruvate. (I) Rate of mitochondrial H2O2 production in response to succinate or Aurorafin/BCNU (n=4 for sham, n=5 for 1day HU, n=5 for 7-day HU). BCNU, 1,3-bis[2-chloroethyl]-1-nitrosourea. (J) Percentage of electron leak in muscle mitochondria (n=4 for sham, n=5 for 1-day HU, n=5 for 7-day HU). Data from HU experiments are from female mice. Data are shown as the mean ± SEM. Statistical analyses in (A, B, C, D, G) and (J) were performed with a one-way analysis of variance (ANOVA) and Dunnett’s multiple comparisons tests. Statistical analyses in (E, H) and (I) were performed with a two-way ANOVA and Tukey’s multiple comparison test.
-
Figure 1—figure supplement 1—source data 1
Original western blots.
- https://cdn.elifesciences.org/articles/85289/elife-85289-fig1-figsupp1-data1-v2.zip
Figure 2 with 1 supplement
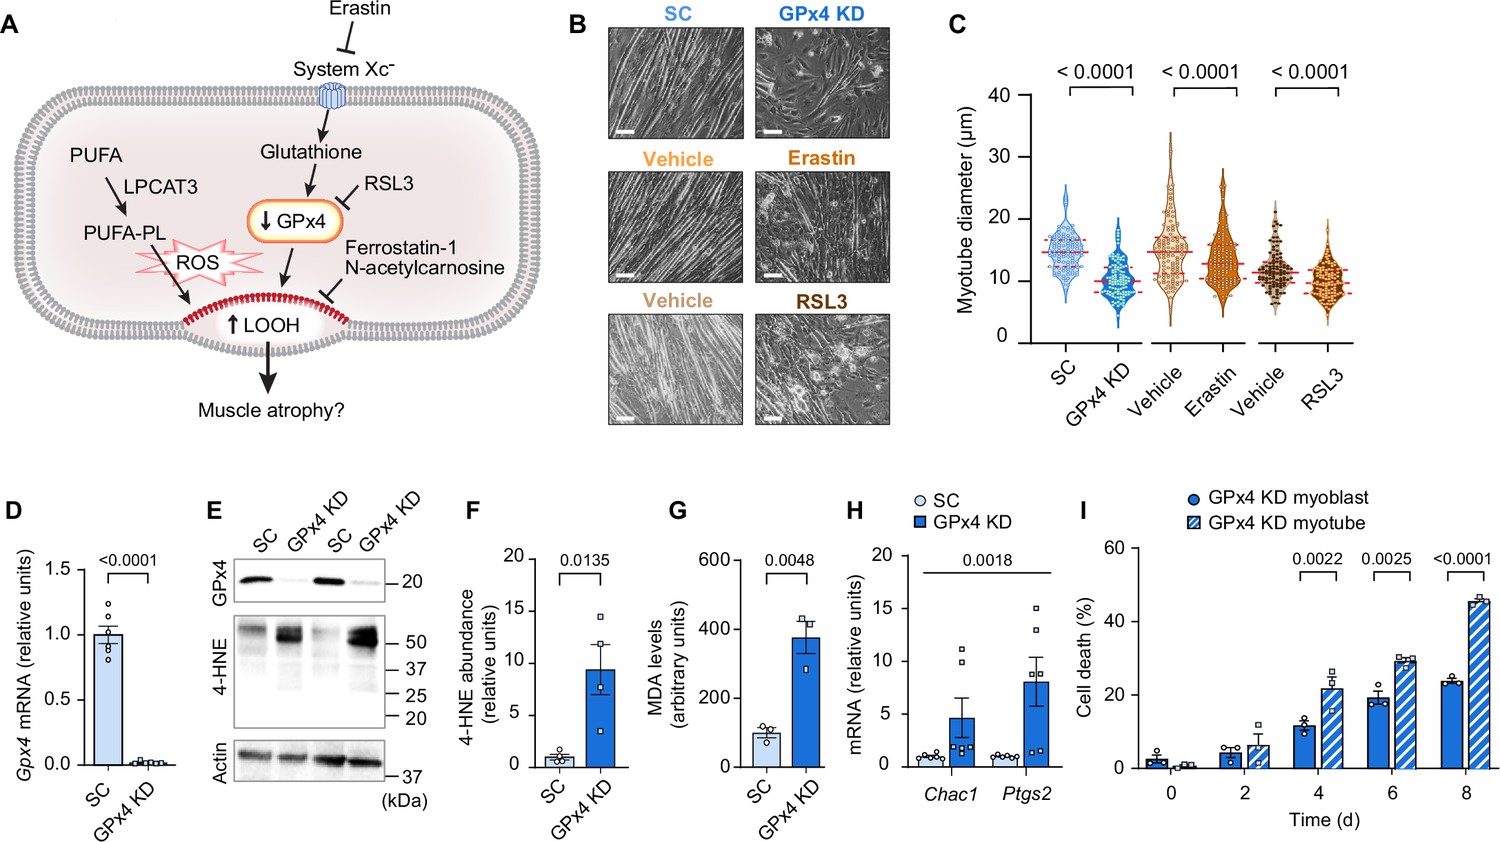
Elevated lipid hydroperoxides (LOOH) is sufficient to promote atrophy in cultured myotubes.
(A) A schematic of how pathways that regulate LOOH may promote muscle atrophy. PUFA: phospholipids containing polyunsaturated fatty acids. (B, C) Representative images (B) and quantification (C) of myotube diameter (n=104 for scrambled: SC, n=107 for glutathione peroxidase 4 [GPx4] knockdown [KD], n=117 for vehicle, n=120 for erastin, n=104 for vehicle, n=110 for RSL3). Scale bar, 100 μm. (D) Gpx4 mRNA levels in C2C12 myotubes with or without GPx4 knockdown (GPx4 KD) (n=6 per group). (E, F, G) Immunoblotting of 4-hydroxynonenal (4-HNE), GPx4, and actin (E), quantification of 4-HNE (F) proteins and malondialdehyde (MDA) levels (G) (n=3 per group). (H) mRNA levels for Chac1 and Ptgs2, markers of ferroptosis (n=6 per group). (I) Cell death levels in GPx4 KD myoblast or myotubes (n=3 independent repeats). Data are shown as the mean ± SEM. Statistical analyses in (C, D, F, G) and (I) were performed with an unpaired two-tailed t-test. Statistical analyses in (H) were performed with a two-way analysis of variance (ANOVA) and Tukey’s multiple comparison test.
-
Figure 2—source data 1
Original western blots.
- https://cdn.elifesciences.org/articles/85289/elife-85289-fig2-data1-v2.zip
Figure 2—figure supplement 1
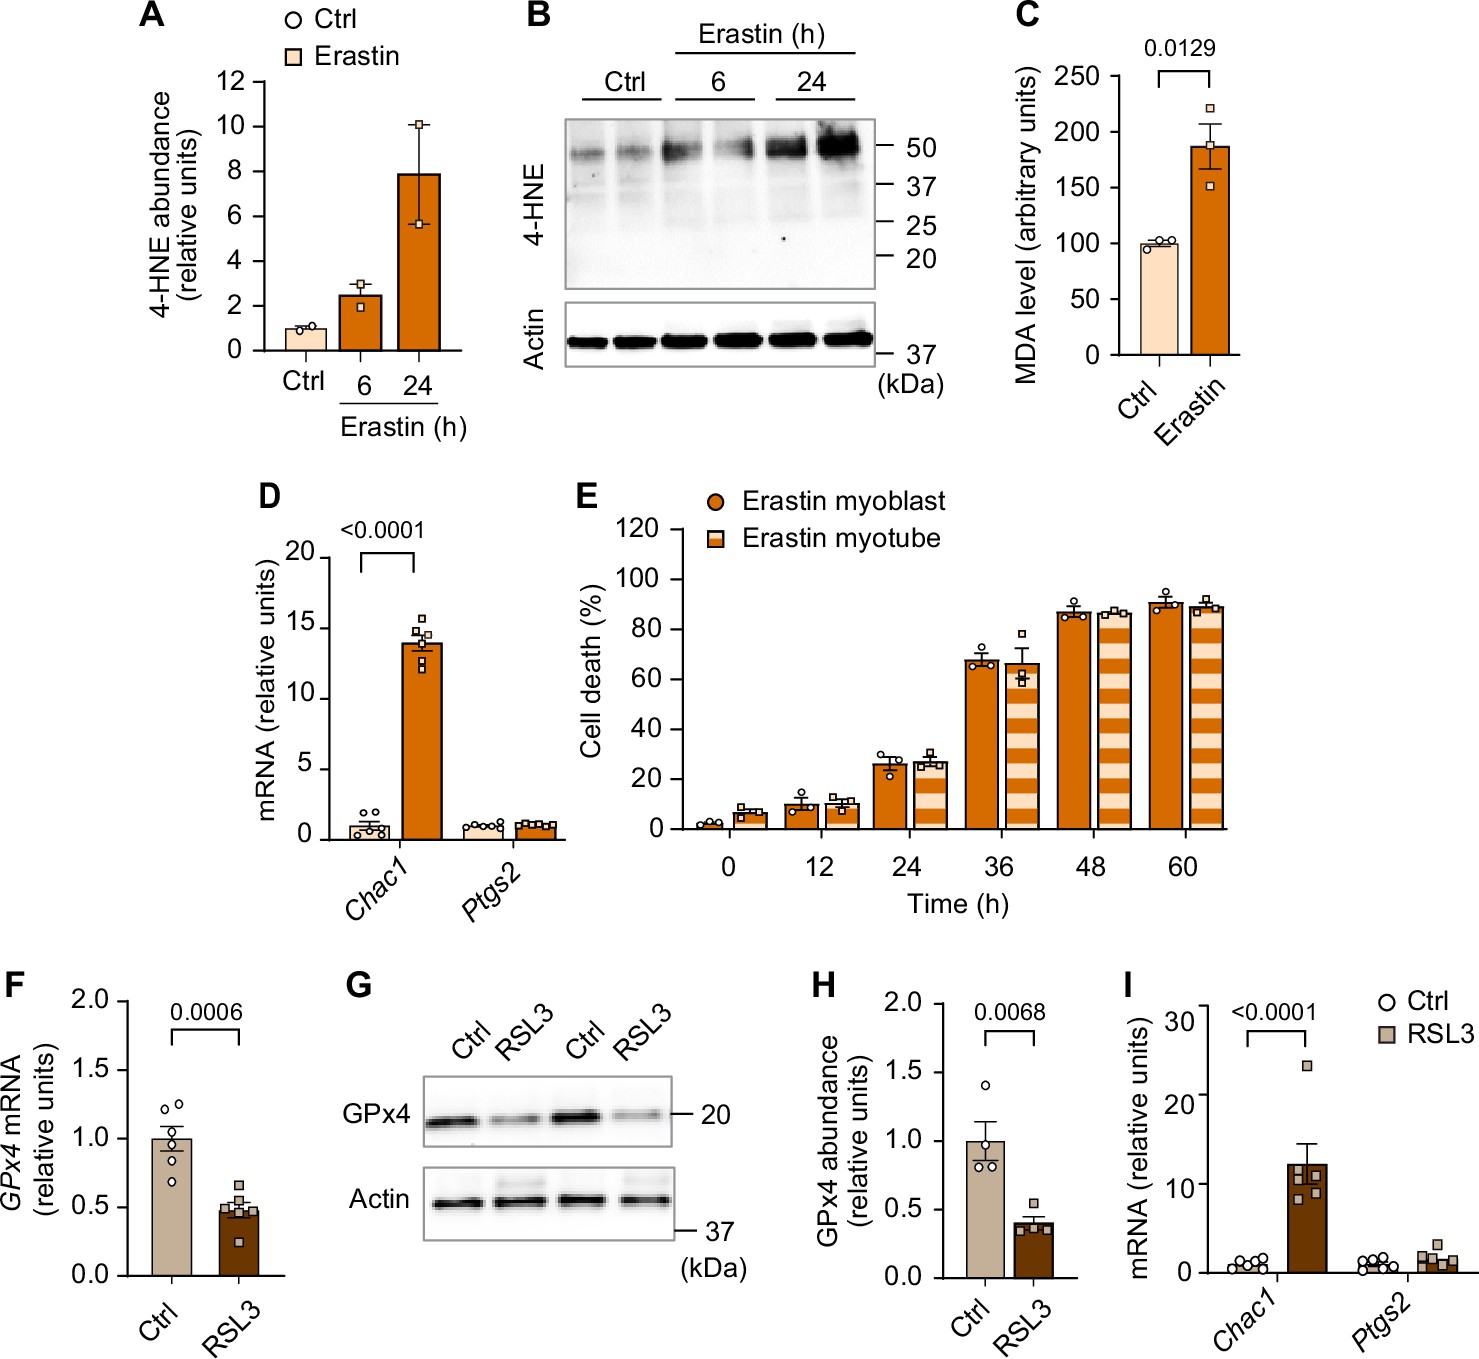
Elevated lipid hydroperoxides (LOOH) is sufficient to promote atrophy in cultured myotubes.
(A, B, C, D, E) Quantification of 4-hydroxynonenal (4-HNE) (n=2 per group) (A), immunoblotting of 4-HNE (B) proteins, malondialdehyde (MDA) levels (C), mRNA levels for Chac1 and Ptgs2, markers of ferroptosis (D), and cell death levels (E) in erastin-stimulated C2C12 myotubes (n=3 independent repeats). (F, G, H, I) mRNA levels of glutathione peroxidase 4 (Gpx4) (F), immunoblotting of GPx4 and actin (G), quantification of GPx4 (n=4 per group) (H), Chac1 and Ptgs2, markers of ferroptosis (I) in RSL3-stimulated C2C12 myotubes (n=6 per group). Data are shown as the mean ± SEM. Statistical analyses in (C, D, E, F, H, I) and were performed with an unpaired two-tailed t-test. Statistical analyses in (A) were performed with a one-way analysis of variance (ANOVA) and Dunnett’s multiple comparisons tests.
-
Figure 2—figure supplement 1—source data 1
Original western blots.
- https://cdn.elifesciences.org/articles/85289/elife-85289-fig2-figsupp1-data1-v2.zip
Figure 3 with 2 supplements
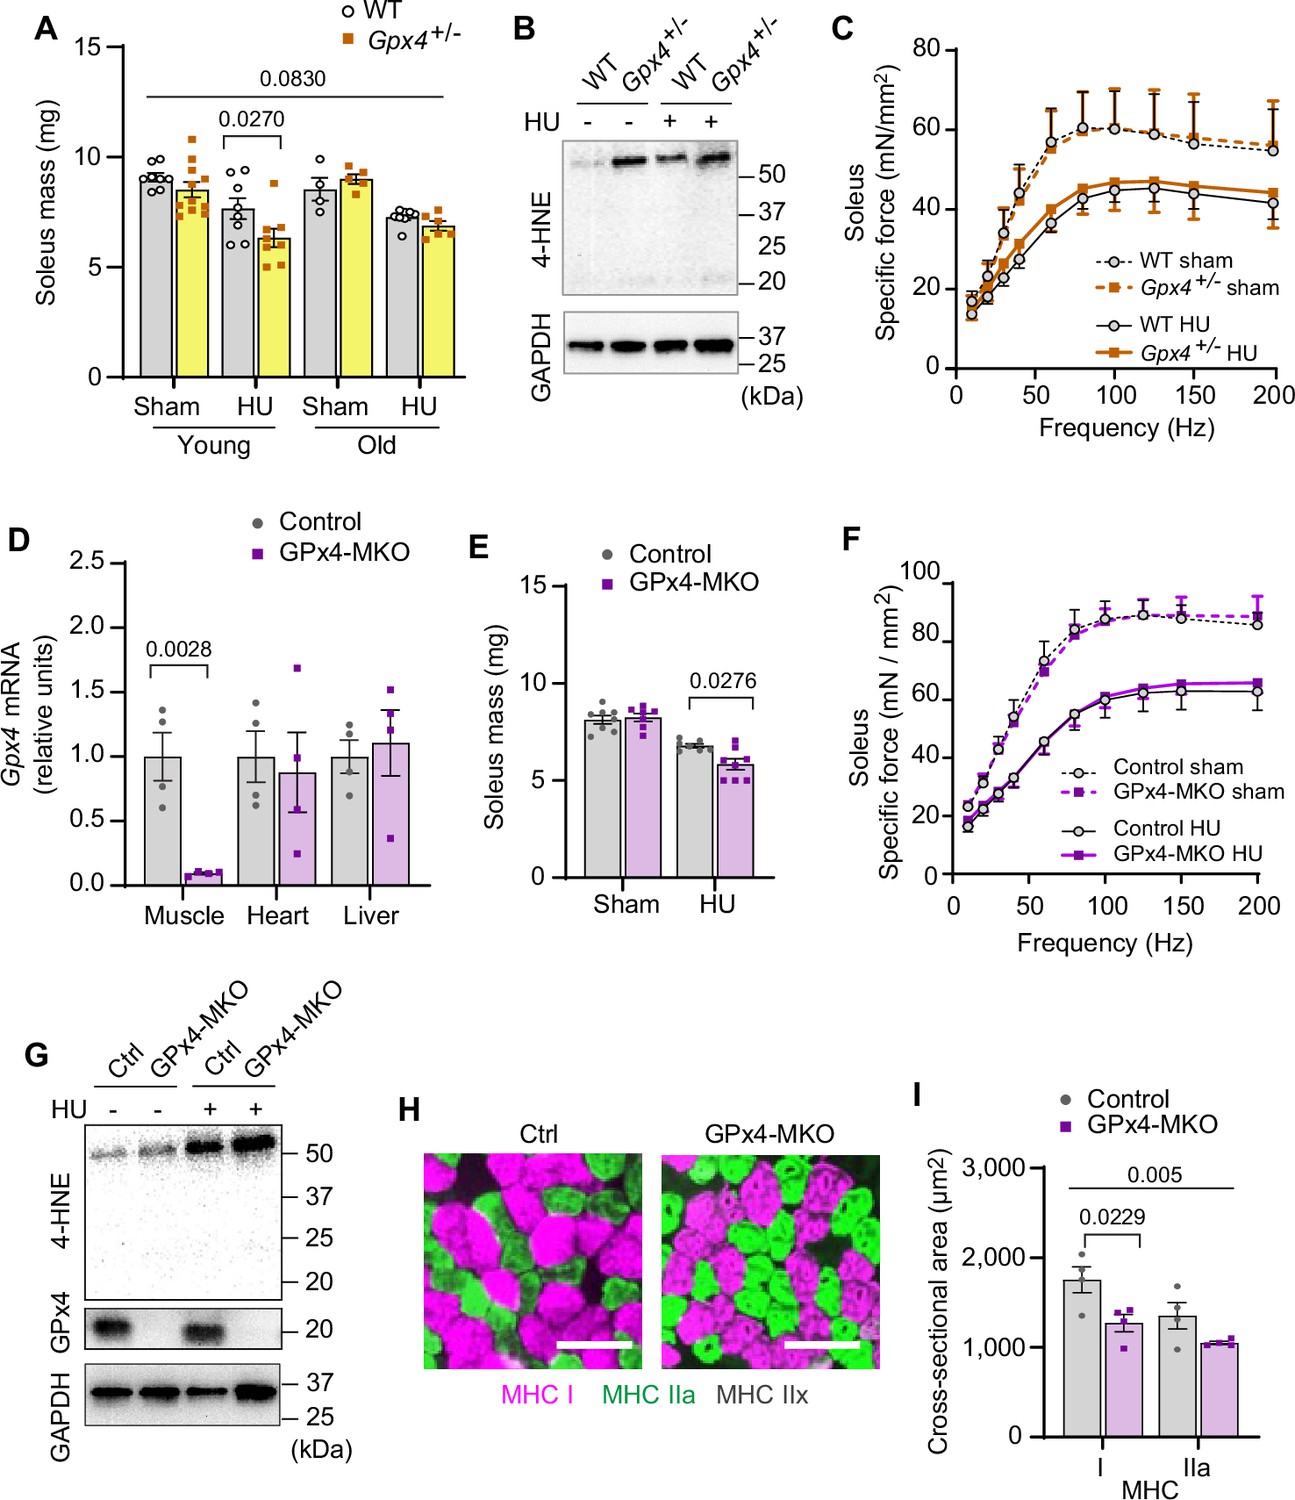
Elevated lipid hydroperoxides (LOOH) is sufficient to augment disuse-induced muscle atrophy in young and old mice.
(A) Soleus muscle mass from young or old wildtype (WT) or Gpx4+/- mice with or without hindlimb unloading (HU) (n=8–11 per young group, n=4–8 per old mice group). (B) Immunoblotting of 4-hydroxynonenal (4-HNE) from gastrocnemius muscles in old WT or Gpx4+/- mice. (C) Force-frequency curve from old WT or Gpx4+/- mice (n=4–7 per group). (D) mRNA levels of Gpx4 from young control or GPx4-MKO mice (n=4 per group). (E, F) Soleus muscle mass (E) (n=7–8 per group) or force-frequency curve (F) from young control or GPx4-MKO mice (n=4–7 per group). (G) Immunoblotting of 4-HNE and GPx4 from gastrocnemius muscles in young GPx4-MKO. (H, I) Representative images of MHC immunofluorescence (H) and muscle fiber cross-sectional area (CSA) by fiber type (I) for soleus muscles in young control or GPx4-MKO mice with HU (n=4 per group). Scale bar, 100 µm. Data from Gpx4+/- and GPx4-MKO experiments are from male and female mice. Data are shown as the mean ± SEM. Statistical analyses in (D) were performed with an unpaired two-tailed t-test. Statistical analyses in (A, C, E, F) and (I) were performed with a two-way analysis of variance (ANOVA) and multiple comparisons were performed using Tukey’s (C, E, F, I) or Sidak’s (A) multiple comparisons tests. GPx4, glutathione peroxidase 4.
-
Figure 3—source data 1
Original western blots.
- https://cdn.elifesciences.org/articles/85289/elife-85289-fig3-data1-v2.zip
Figure 3—figure supplement 1
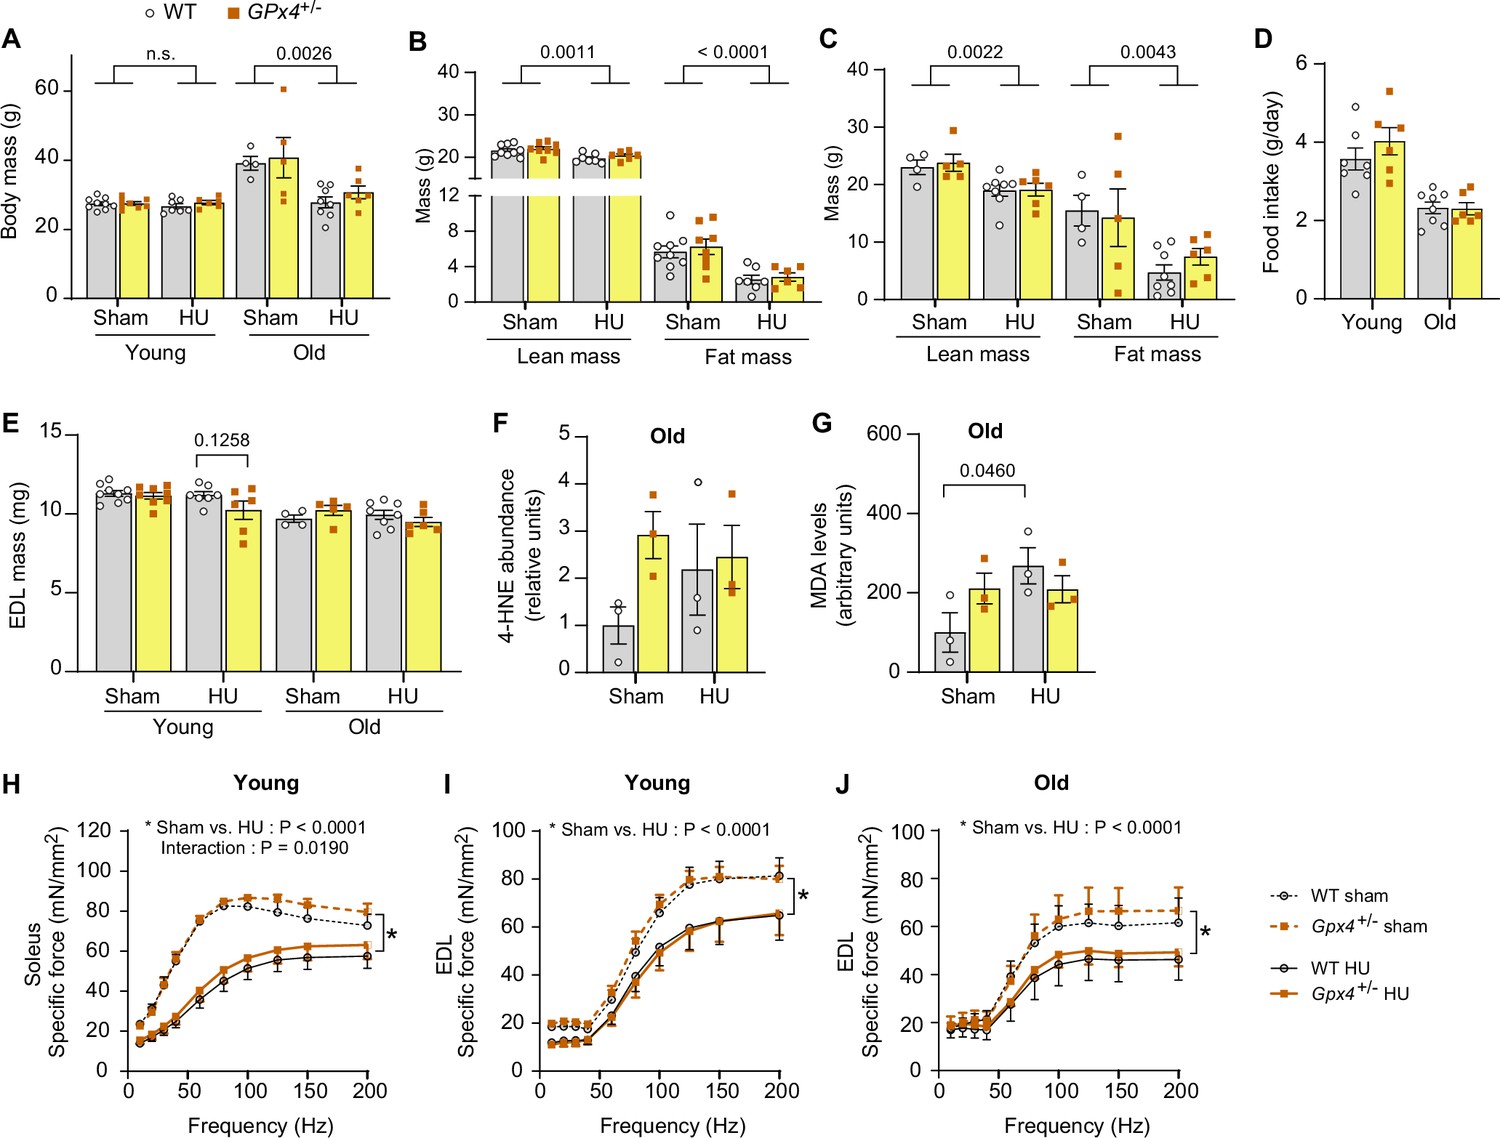
Additional data from Gpx4+/- mice.
(A) Body mass from young and old wildtype (WT) or Gpx4+/- mice. (B, C) Body composition from young (n=9 for WT sham, n=8 for Gpx4+/- sham, n=7 for WT hindlimb unloading (HU), n=6 for Gpx4+/- HU) (B) and old (n=4 for WT sham, n=5 for Gpx4+/- sham, n=8 for WT HU, n=6 for Gpx4+/- HU) (C) WT or Gpx4+/- mice. (D) Food intake during HU in young (n=7 for WT, n=6 for Gpx4+/-) and old (n=8 for WT, n=6 for Gpx4+/-) WT or Gpx4+/- mice. (E) Extensor digitorum long (EDL) muscle mass from young (n=9 for WT sham, n=8 for Gpx4+/- sham, n=7 for WT HU, n=6 for Gpx4+/- HU) and old (n=9 for WT sham, n=8 for Gpx4+/- sham, n=7 for WT HU, n=6 for Gpx4+/- HU) WT or Gpx4+/- mice. (F) Quantification of 4-hydroxynonenal (4-HNE) from gastrocnemius muscles in old mice (n=3 per group). (G) Malondialdehyde (MDA) levels from gastrocnemius muscles in old mice (n=3 per group). (H) Force-frequency curve from soleus muscle from young WT or Gpx4+/- mice (n=5 for WT sham, n=5 for Gpx4+/- sham, n=7 for WT HU, n=5 for Gpx4+/- HU). (I,J) Force-frequency curve in EDL muscle from young (n=5 for WT sham, n=5 for Gpx4+/- sham, n=7 for WT HU, n=5 for Gpx4+/- HU) (I) and old (n=3 for WT sham, n=4 for Gpx4+/- sham, n=6 for WT HU, n=6 for Gpx4+/- HU) (J) WT or Gpx4+/- mice. Data from Gpx4+/- experiments are from male and female mice. Data are shown as the mean ± SEM. Statistical analyses in (A, B, C, D, E, F, G, H, I, J) were performed with a two-way analysis of variance (ANOVA) and using Tukey’s multiple comparisons tests. GPx4, glutathione peroxidase 4.
Figure 3—figure supplement 2
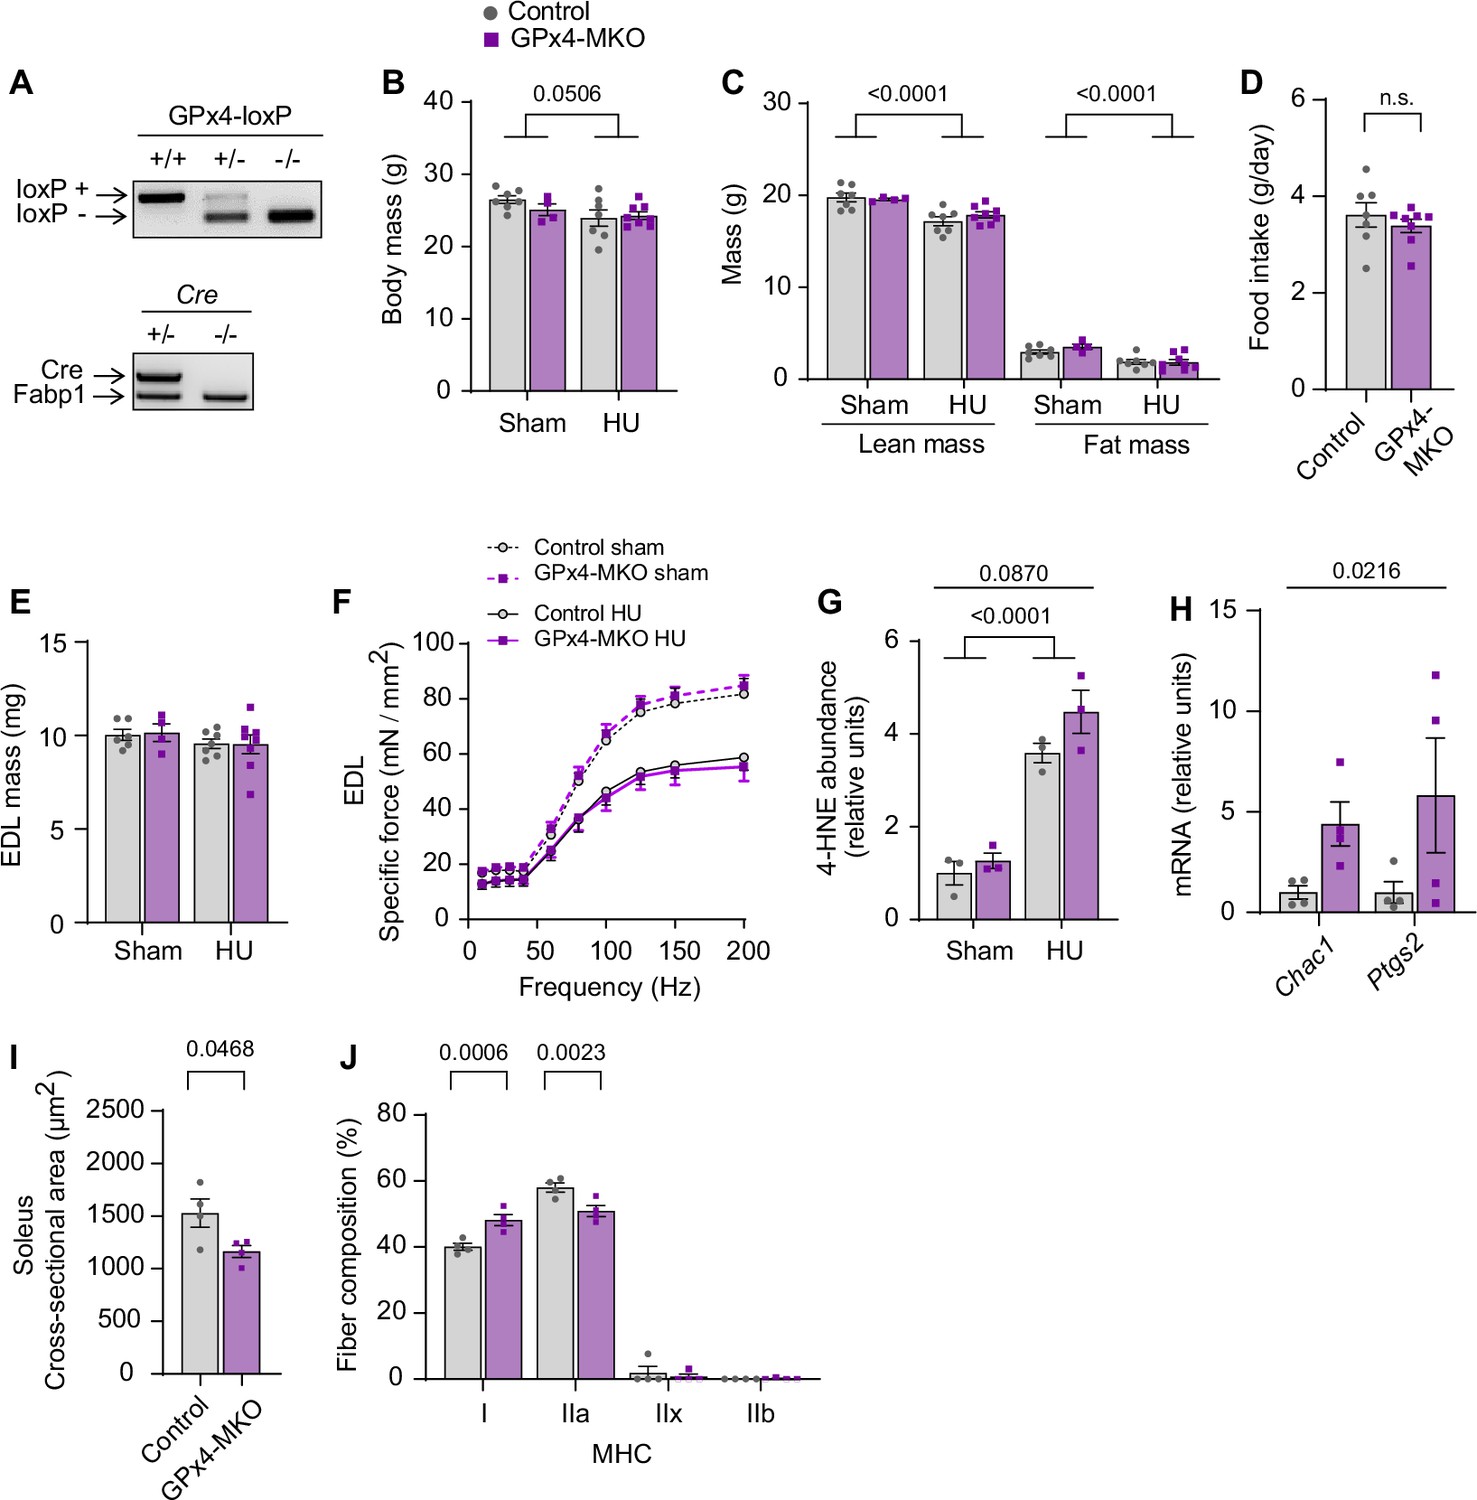
Additional data from GPx4-MKO mice.
(A) Genotyping gel for GPx4cKOlox/lox mice crossed with HSA-MerCreMer+/- mice to yield GPx4cKOlox/lox; HSA-MerCreMer+/- (GPx4-MKO) mice. Control littermates (GPx4cKOlox/lox; HSA-MerCreMer-/-) were used for experiments. (B, C) Body mass (B) and body composition (C) (n=7 for Ctrl sham, n=4 for GPx4-MKO sham, n=7 for Ctrl hindlimb unloading (HU), n=8 for GPx4-MKO HU). (D) Food intake during HU (n=7 for Ctrl, n=8 for GPx4-MKO). (E, F) Extensor digitorum long (EDL) muscle mass (n=6 for Ctrl sham, n=4 for GPx4-MKO sham, n=7 for Ctrl HU, n=8 for GPx4-MKO HU) (E) and force-frequency curve from young mice (n=6 for Ctrl sham, n=4 for GPx4-MKO sham, n=6 for Ctrl HU, n=7 for GPx4-MKO HU) (F). (G) Quantification of western blotting for 4-hydroxynonenal (4-HNE) from gastrocnemius muscles in young mice (n=3 per group). (H) mRNA levels of Chac1 and Ptgs2 in gastrocnemius muscles (n=4 per group). (I, J) Mean muscle fiber cross-sectional area (CSA) (I) and fiber-type composition (J) for soleus muscles following HU (n=4 per group). Data from GPx4-MKO experiments are from male and female mice. Data are shown as the mean ± SEM. Statistical analyses in (D) and (I) were performed with an unpaired two-tailed t-test. Statistical analyses in (B, C, E, F, G, H) and (J) were performed with a two-way analysis of variance (ANOVA) and Tukey’s multiple comparison test.
-
Figure 3—figure supplement 2—source data 1
Original genotyping gels.
- https://cdn.elifesciences.org/articles/85289/elife-85289-fig3-figsupp2-data1-v2.zip
Figure 4 with 1 supplement
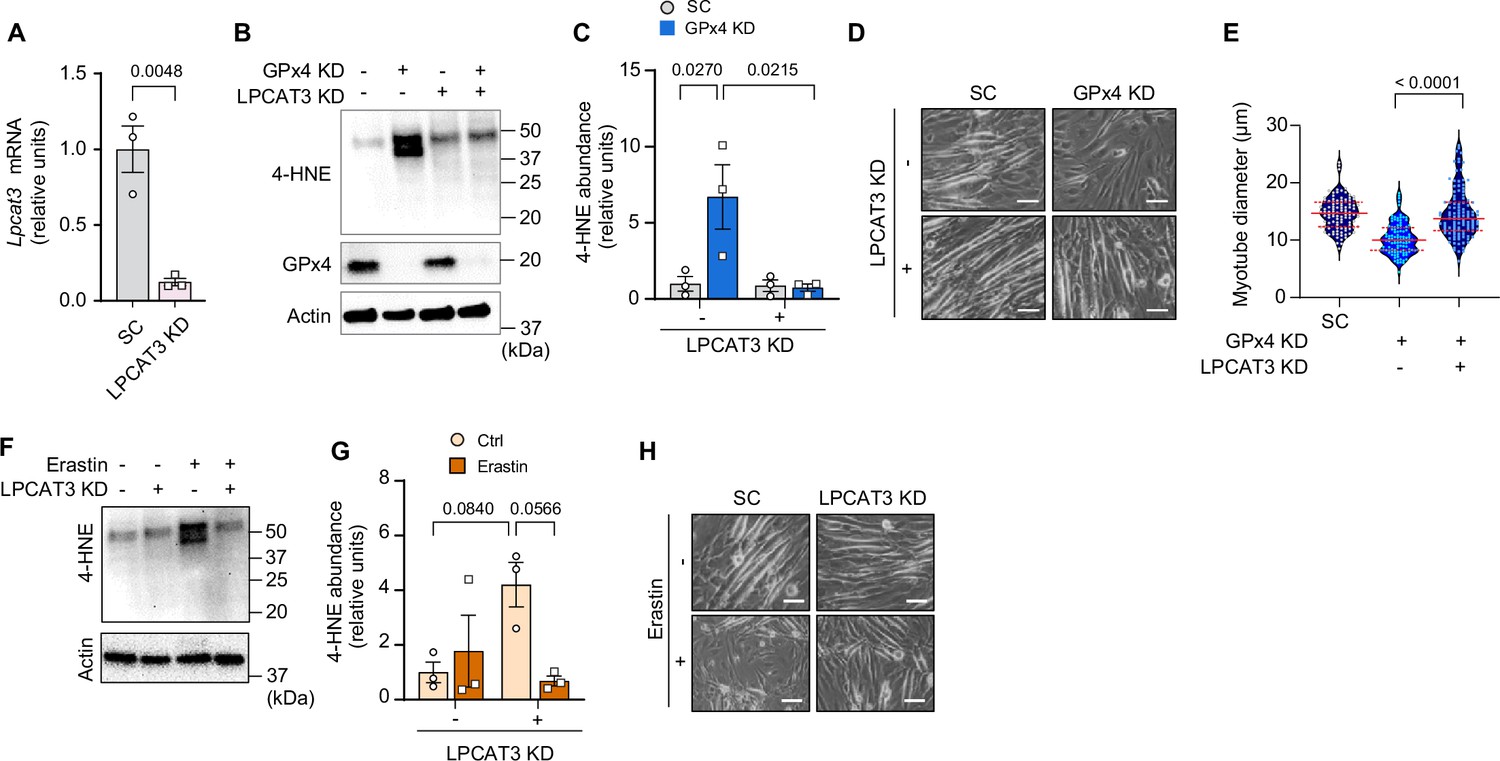
Suppression of polyunsaturated fatty acid (PUFA) incorporation prevents lipid hydroperoxides (LOOH)-induced myotube atrophy.
(A) mRNA levels of lysophosphatidylcholine acyltransferase 3 (Lpcat3) in C2C12 myotubes with or without LPCAT3 knockdown (KD) (n=3 per group). (B) Immunoblotting of 4-hydroxynonenal (4-HNE), glutathione peroxidase 4 (GPx4), and actin protein in C2C12 myotubes with or without GPx4 KD and/or LPCAT3 KD. (C) Quantification of 4-HNE proteins in C2C12 myotubes with or without LPCAT3 KD and/or GPx4 KD (n=3 per group). (D, E) Representative images (D), and quantification of myotube diameter (E) from C2C12 myotubes with or without GPx4 KD and/or without LPCAT3 KD (n=104–114 per group). Scale bar, 100 μm. (F, G) Immunoblotting (F) and quantification (G) of 4-HNE from C2C12 myotubes with or without LPCAT 3 KD and/or erastin (n=3 per group). (H) Representative images from C2C12 myotubes with or without LPCAT3 KD and/or erastin (n=3 independent repeats). Scale bar, 100 μm. Data are shown as the mean ± SEM. Statistical analyses in (A) were performed with an unpaired two-tailed t-test. Statistical analysis in (C) and (G) were performed with a two-way analysis of variance (ANOVA) and multiple comparisons were performed using Tukey’s multiple comparisons tests. Statistical analyses in (E) was performed with a one-way ANOVA with Dunnett’s multiple comparisons test.
-
Figure 4—source data 1
Original western blots.
- https://cdn.elifesciences.org/articles/85289/elife-85289-fig4-data1-v2.zip
Figure 4—figure supplement 1
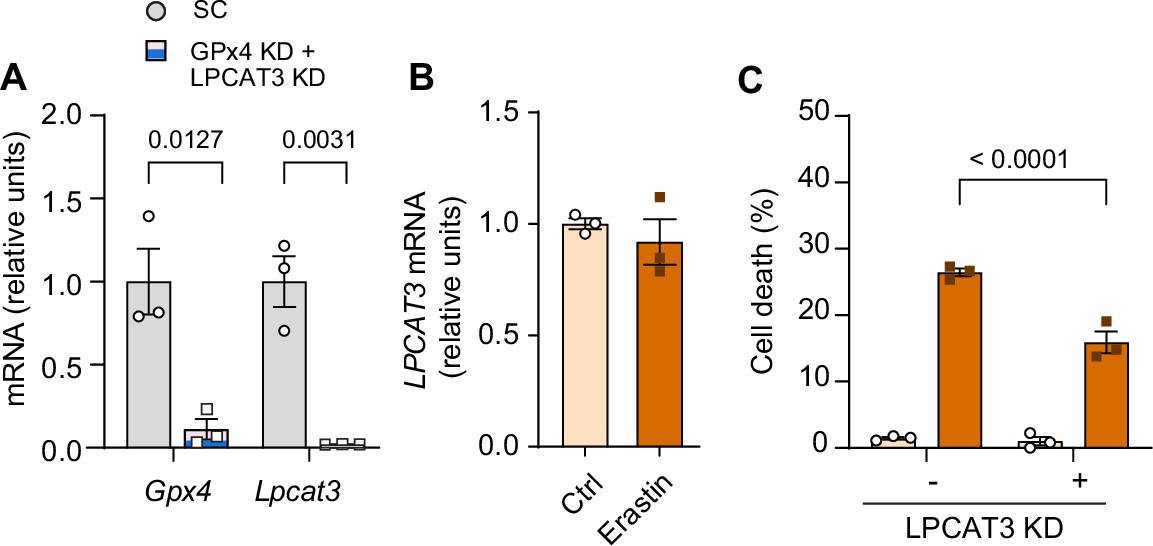
Additional data from lysophosphatidylcholine acyltransferase 3 (LPCAT3) knockdown (KD).
(A) mRNA levels of glutathione peroxidase 4 (Gpx4) and Lpcat3 in C2C12 myotubes with or without GPx4 and LPCAT3 double KD (n=3 per group). (B) mRNA levels of Lpcat3 from erastin-stimulated myotubes (n=3 per group). (C) Cell death levels from C2C12 myotubes with or without LPCAT3 KD and/or erastin (n=3 independent repeats). Data are shown as the mean ± SEM. Statistical analyses in (A) and (B) were performed with an unpaired two-tailed t-test. Statistical analyses in (C) were performed with a two-way analysis of variance (ANOVA) and Tukey’s multiple comparison test.
Figure 5 with 1 supplement
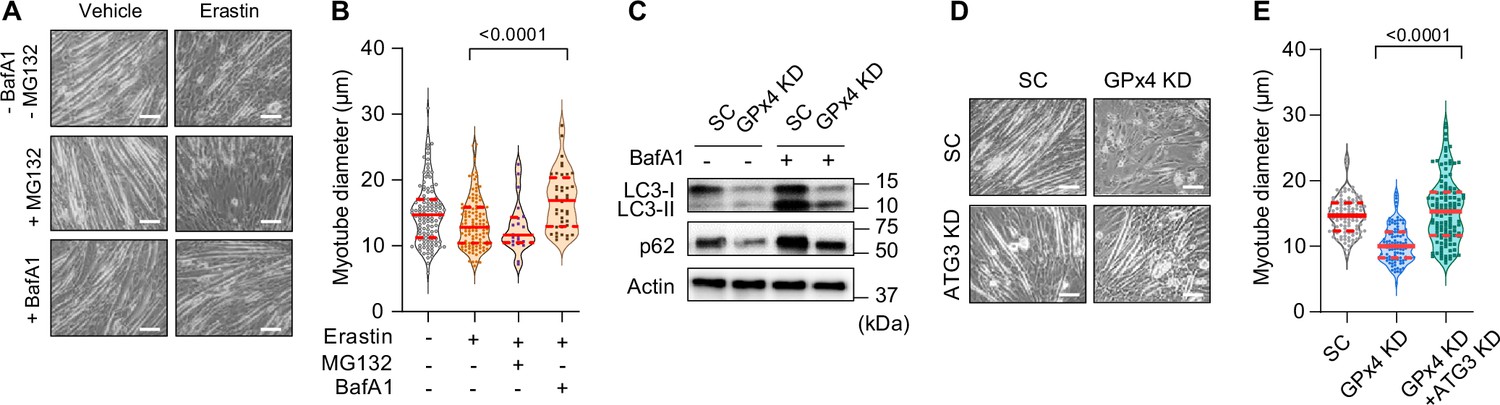
Suppression of the autophagy-lysosome axis prevents lipid hydroperoxides (LOOH)-induced myotube atrophy.
(A, B) Representative images (A), and quantification of myotube diameter (B) from erastin-stimulated C2C12 myotubes with proteasomal inhibitor MG132 or lysosomal inhibitor bafilomycin A1 (BaFA1) (n=21–120 per group). Scale bar, 100 µm. (C) Autophagic flux analyses immunoblotting for LC3-I, LC3-II, p62, and actin in SC or glutathione peroxidase 4 (GPx4) knockdown (KD) C2C12 myotubes with or without BafA1. (D, E) Representative images (D) and quantification of myotube diameter (E) from C2C12 myotubes with or without GPx4 KD and/or ATG3 KD (n=104–121 per group). Data are shown as the mean ± SEM. Statistical analyses in (B, E) were performed with a one-way analysis of variance (ANOVA) with Dunnett’s multiple comparisons test.
-
Figure 5—source data 1
Original western blots.
- https://cdn.elifesciences.org/articles/85289/elife-85289-fig5-data1-v2.zip
Figure 5—figure supplement 1
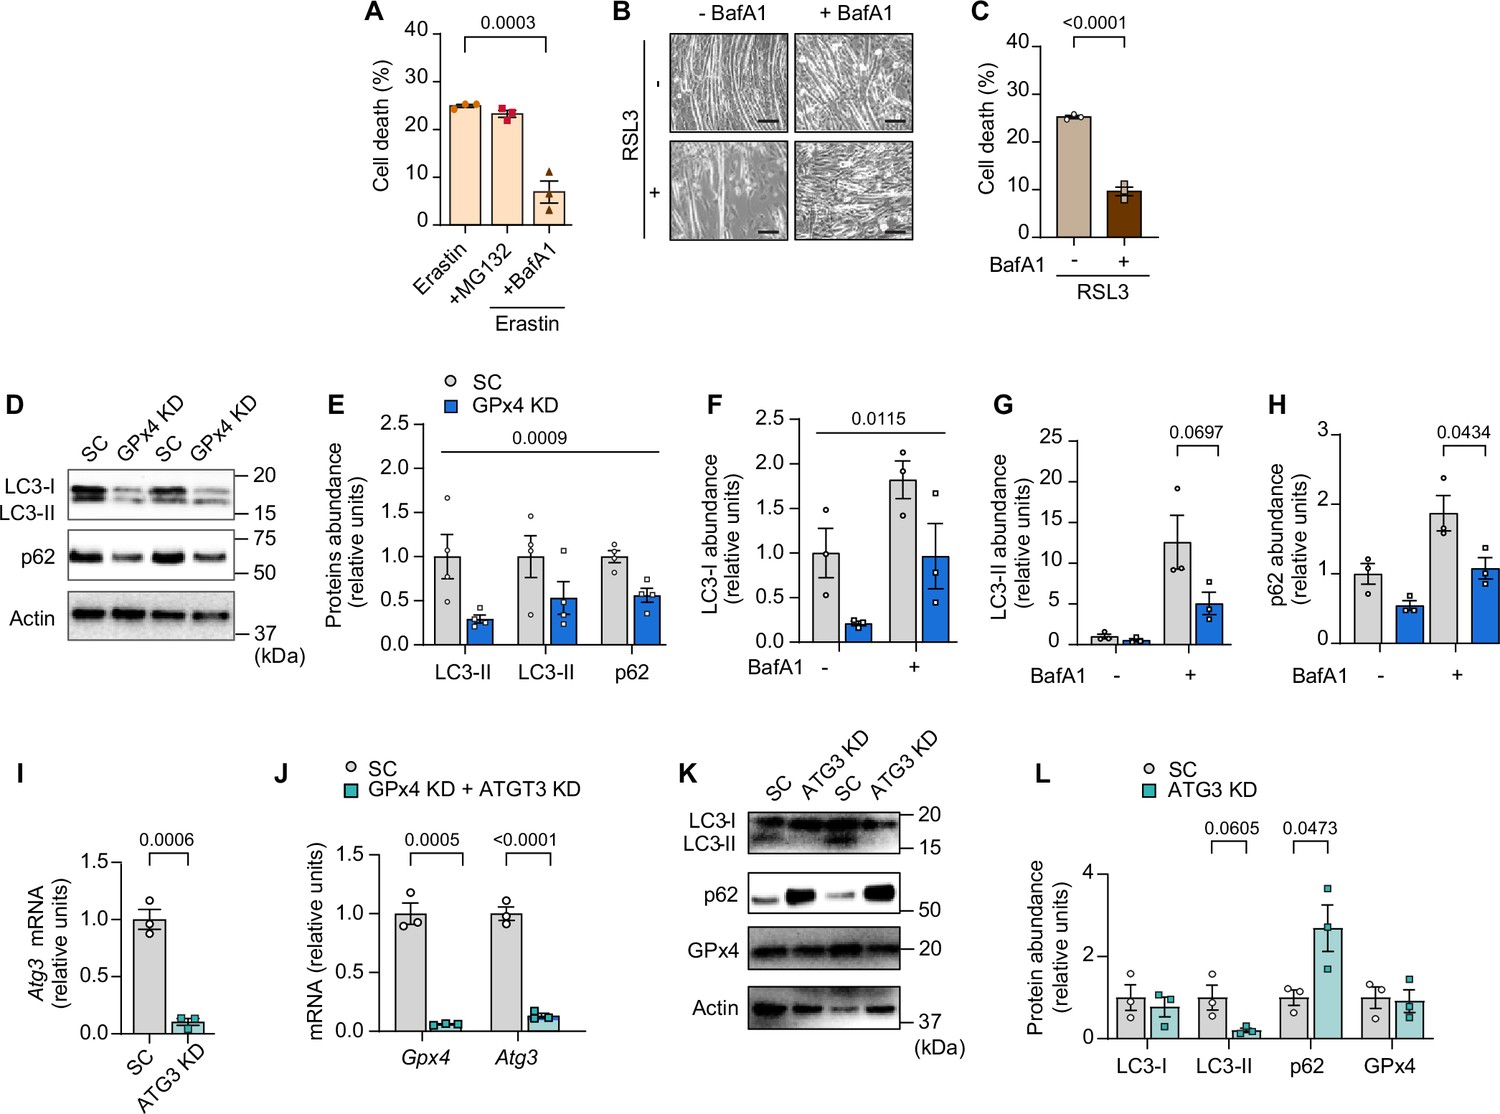
The autophagy-lysosome axis in lipid hydroperoxides (LOOH)-induced myotube atrophy.
(A) Cell death levels in erastin-stimulated myotubes with MG132 or bafilomycin A1 (BaFA1) (n=3 independent repeats). (B, C) Representative images (B) and cell death level (C) in RSL3-stimulated myotubes with BaFA1 (n=3 independent repeats). (D,E) Immunoblotting (D) and quantification (E) of LC3-I, LC3-II, p62 (all static measurements without BafA1), and actin protein from C2C12 myotubes with or without GPX4 knockdown (KD) (n=4 per group). (F, G, H) Quantification of western blotting for LC3-I (F), LC3-II (G), and p62 (H) protein from GPx4 KD myotubes with or without BaFA1 (n=3 per group). (I) mRNA levels of Atg3 in C2C12 myotubes with or without (n=3 per group). (J) mRNA levels of Gpx4 and ATG3 from C2C12 myotubes with double KD for ATG3 and GPx4 (n=3 per group). (K, L) Immunoblotting (K) and quantification (L) of LC3, p62, and GPx4 protein from C2C12 myotubes with or without ATG3 KD (n=3 per group). Data are shown as the mean ± SEM. Statistical analyses in (C, I) and (L) were performed with an unpaired two-tailed t-test. Statistical analyses in (A) were performed with a one-way analysis of variance (ANOVA) and Tukey’s multiple comparison test. Statistical analyses in (E, F, G, H, I) and (J) were performed with a two-way ANOVA and Tukey’s multiple comparison test.
-
Figure 5—figure supplement 1—source data 1
Original western blots.
- https://cdn.elifesciences.org/articles/85289/elife-85289-fig5-figsupp1-data1-v2.zip
Figure 6 with 1 supplement
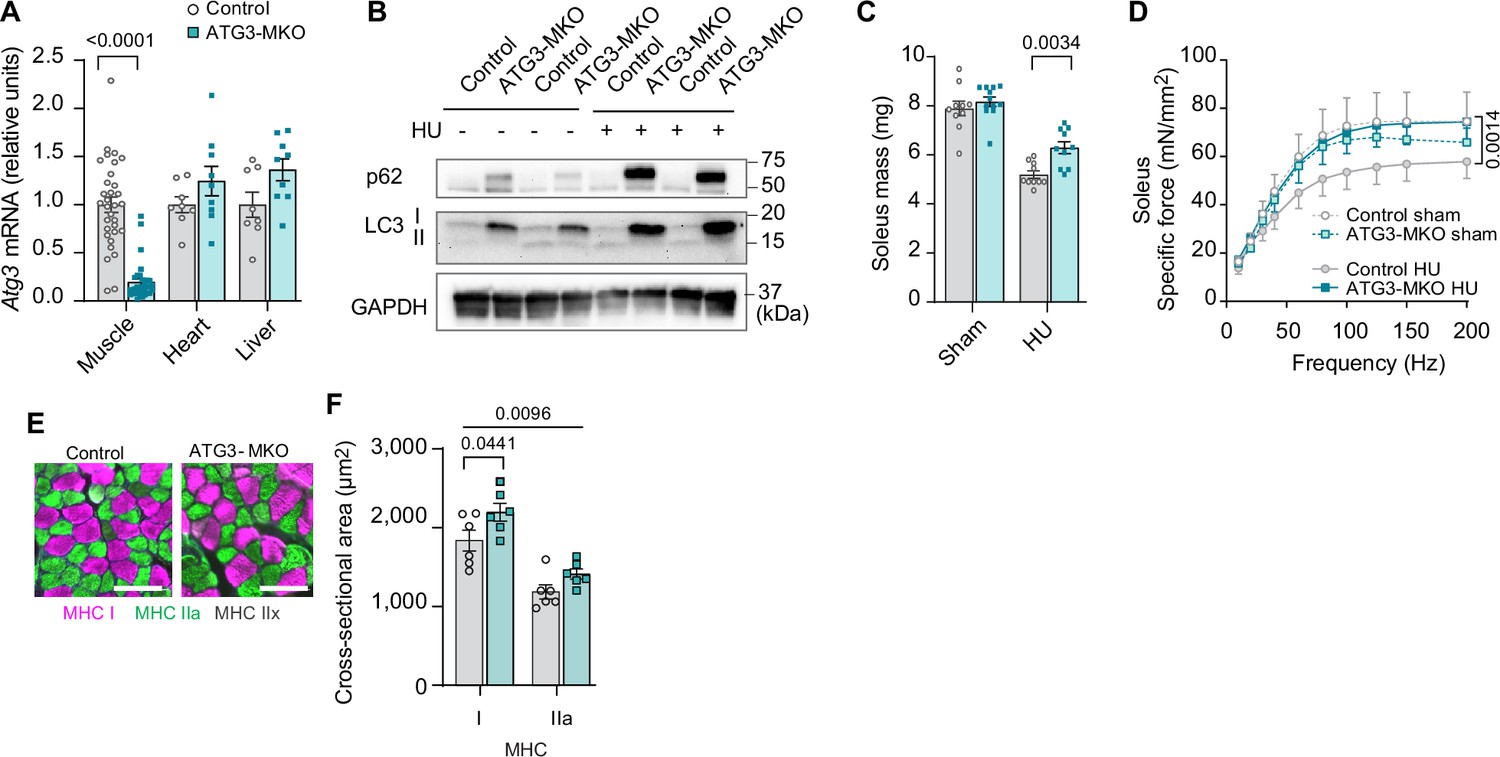
Muscle-specific ATG3 deletion attenuates disuse-induced atrophy and weakness.
(A) mRNA levels of Atg3 (n=8–32 per group) from young control or ATG3-MKO mice. (B) Immunoblotting of p62, LC3, and GAPDH proteins from gastrocnemius muscles from control and ATG3-MKO mice. (C) Soleus muscle mass from control or ATG3-MKO mice (n=10–12 per group). (D) Force-frequency curve from young control or ATG3-MKO mice (n=9–12 per group). (E, F) Representative images of MHC immunofluorescence (E) and muscle fiber cross-sectional area (CSA) by fiber type (F) of soleus muscles in young control or ATG3-MKO mice with hindlimb unloading (HU) (n=6 per group). Data from ATG3-MKO experiments are from female mice. Data are shown as the mean ± SEM. Statistical analyses in (A) were performed with an unpaired two-tailed t-test. Statistical analyses in (C, D) and (F) were performed with a two-way analysis of variance (ANOVA) and multiple comparisons were performed using Tukey’s multiple comparisons tests.
-
Figure 6—source data 1
Original western blots.
- https://cdn.elifesciences.org/articles/85289/elife-85289-fig6-data1-v2.zip
Figure 6—figure supplement 1
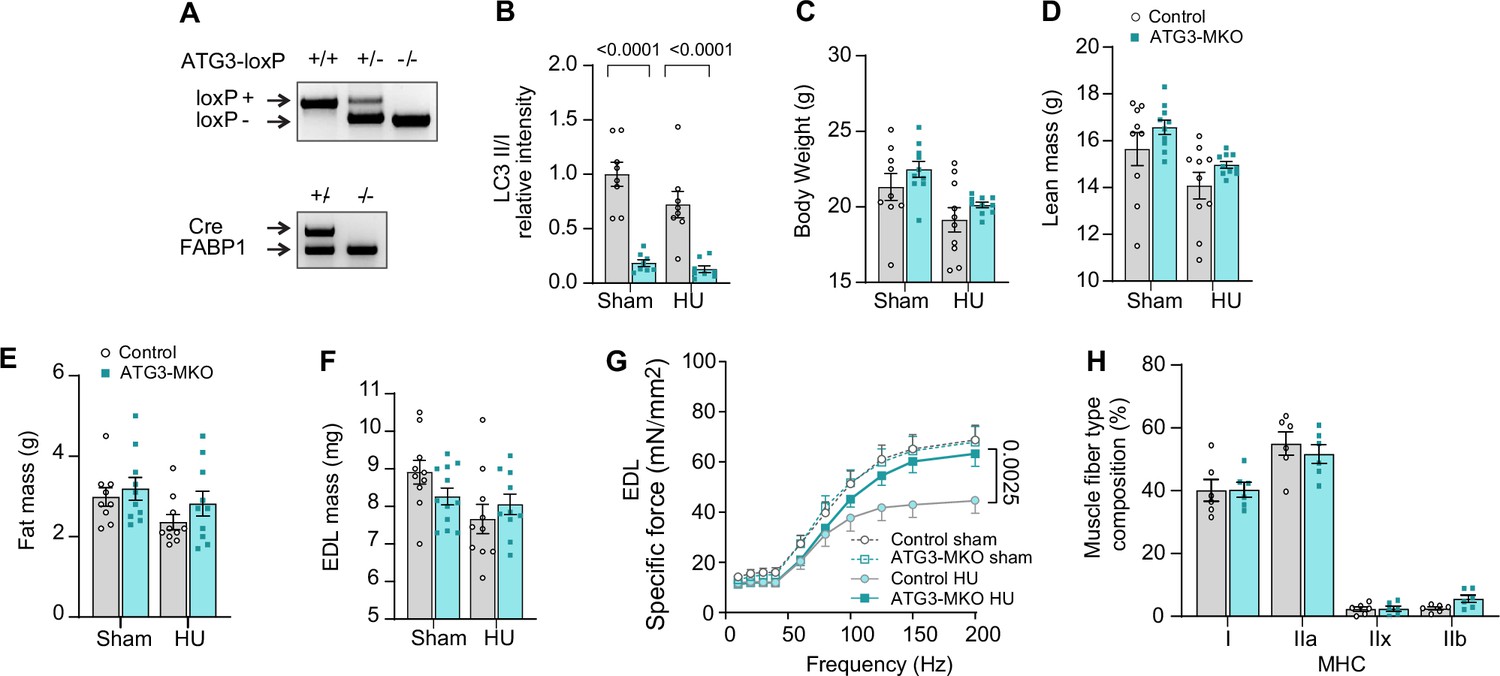
Additional data from ATG3-MKO mice.
(A) Genotyping of ATG3cKOlox/lox mice crossed with HSA-MerCreMer+/- mice to yield ATG3cKOlox/lox; HSA-MerCreMer+/- (ATG3-MKO) mice. Control littermates (ATG3cKOlox/lox; HSA-MerCreMer-/-) were used for experiments. (B) Quantification of LC3-II/I ratio in muscles from control and ATG3-MKO mice (n=8 per group). (B, C, D) Body weight (B), lean mass (C), and fat mass (D) from control and ATG3-MKO mice (control sham n=9, ATG3-MKO sham n=10, control hindlimb unloading [HU] n=10, ATG3-MKO HU n=10). (E) Extensor digitorum long (EDL) muscle mass (control sham n=10, ATG3-MKO sham n=12, control HU n=10, ATG3-MKO HU n=10). (F) Force-frequency curve for EDL muscle (control sham n=9, ATG3-MKO sham n=8, control HU n=10, ATG3-MKO HU n=9). (G) Fiber-type composition for soleus (SOL) muscle (control HU n=6, ATG3MKO HU n=6). Data from ATG3-MKO experiments are from female mice. Data are shown as the mean ± SEM. Statistical analyses in (B, C, D, E, F, G) were performed with a two-way analysis of variance (ANOVA) and Tukey’s multiple comparison test.
-
Figure 6—figure supplement 1—source data 1
Original genotyping gels and western blots.
- https://cdn.elifesciences.org/articles/85289/elife-85289-fig6-figsupp1-data1-v2.zip
Figure 7 with 1 supplement
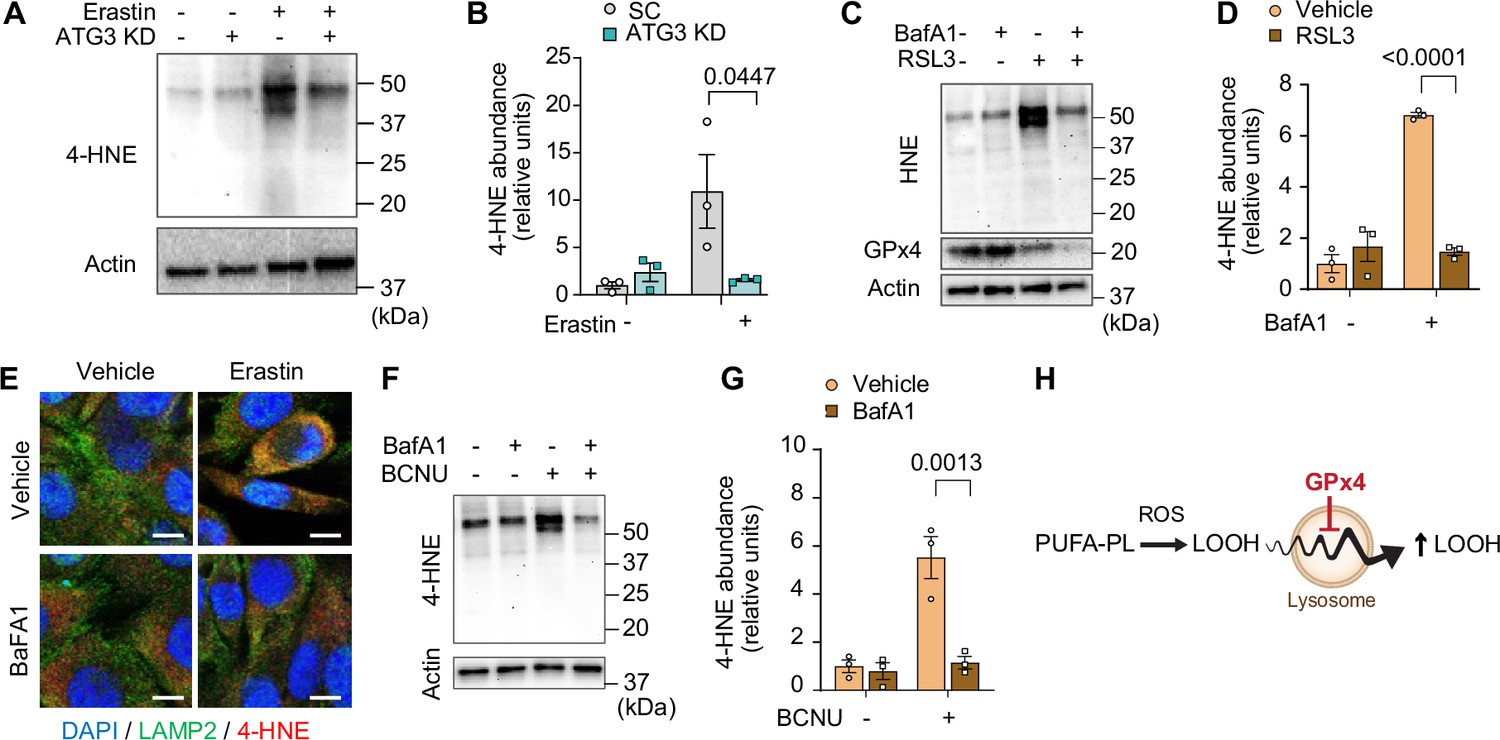
Inhibition of the autophagy-lysosome axis prevents accumulation of lipid hydroperoxides (LOOH).
(A, B) Immunoblotting (A) and quantification (B) of 4-hydroxynonenal (4-HNE), glutathione peroxidase 4 (GPx4), and actin in C2C12 myotubes with or without GPx4 knockdown (KD) and/or ATG3 KD (n=3 per group). (C, D) Immunoblotting (C) and quantification (D) of 4-HNE protein from C2C12 myotubes with or without erastin and/or bafilomycin A1 (BaFA1) (n=3 per group). (E) Confocal fluorescence microscope images of erastin-stimulated myotubes with or without BaFA1. Scale bar, 10 µm. Boxed regions are shown enlarged at far right. Scale bar, 2.5 µm. (F, G, H) Representative images (F), immunoblotting of 4-HNE and actin (G), and quantification (H) of H2O2 or BCNU-stimulated C2C12 myotubes with or without BaFA1 (n=3 per group). Scale bar, 100 µm. Data are shown as the mean ± SEM. Statistical analyses in (B, D) and (H) were performed with a two-way analysis of variance (ANOVA) and Tukey’s multiple comparison test.
-
Figure 7—source data 1
Original western blots.
- https://cdn.elifesciences.org/articles/85289/elife-85289-fig7-data1-v2.zip
Figure 7—figure supplement 1
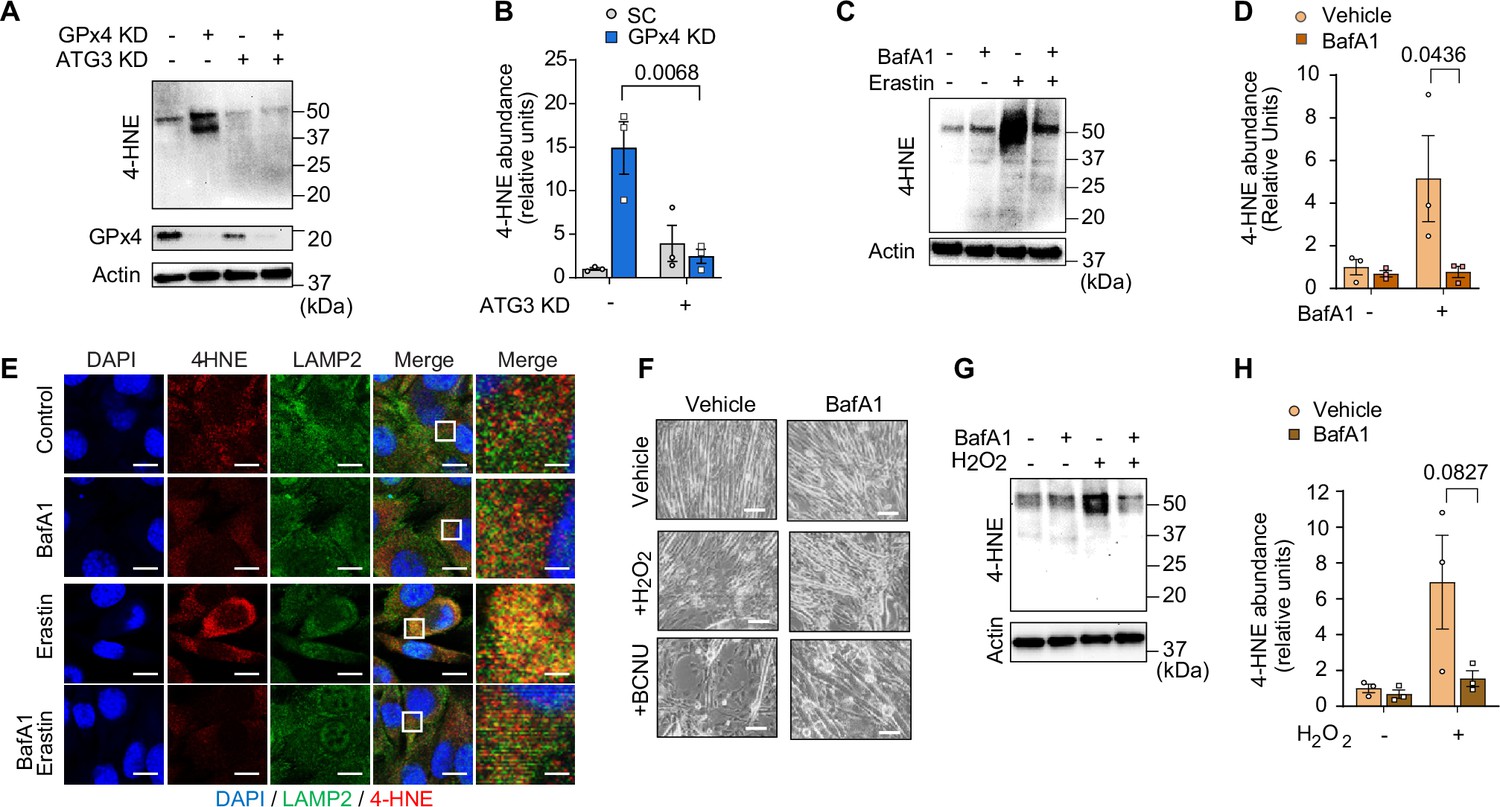
Inhibition of the autophagy-lysosome axis prevents accumulation of lipid hydroperoxides (LOOH).
(A, B) Immunoblotting (A) and quantification (B) of 4-hydroxynonenal (4-HNE) protein from C2C12 myotubes with or without erastin and/or ATG3 knockdown (KD) (n=3 per group). (C, D) Immunoblotting (C) and quantification (D) of 4-HNE protein from C2C12 myotubes with or without erastin and/or bafilomycin A1 (BaFA1) (n=3 per group). (E) Confocal immunofluorescence of LAMP2 (lysosome) and 4-HNE in erastin-stimulated C2C12 myotubes with or without BaFA1. Scale bar, 10 µm. (F, G) Immunoblotting (F) and quantification (G) of 4-HNE protein from BCNU-stimulated C2C12 myotubes with or without BafA1 (n=3 per group). (H) A novel role of the lysosome in amplifying LOOH. Data are shown as the mean ± SEM. Statistical analyses in (B, D) and (G) were performed with a two-way analysis of variance (ANOVA) and Tukey’s multiple comparison test.
-
Figure 7—figure supplement 1—source data 1
Original western blots.
- https://cdn.elifesciences.org/articles/85289/elife-85289-fig7-figsupp1-data1-v2.zip
Figure 8 with 3 supplements
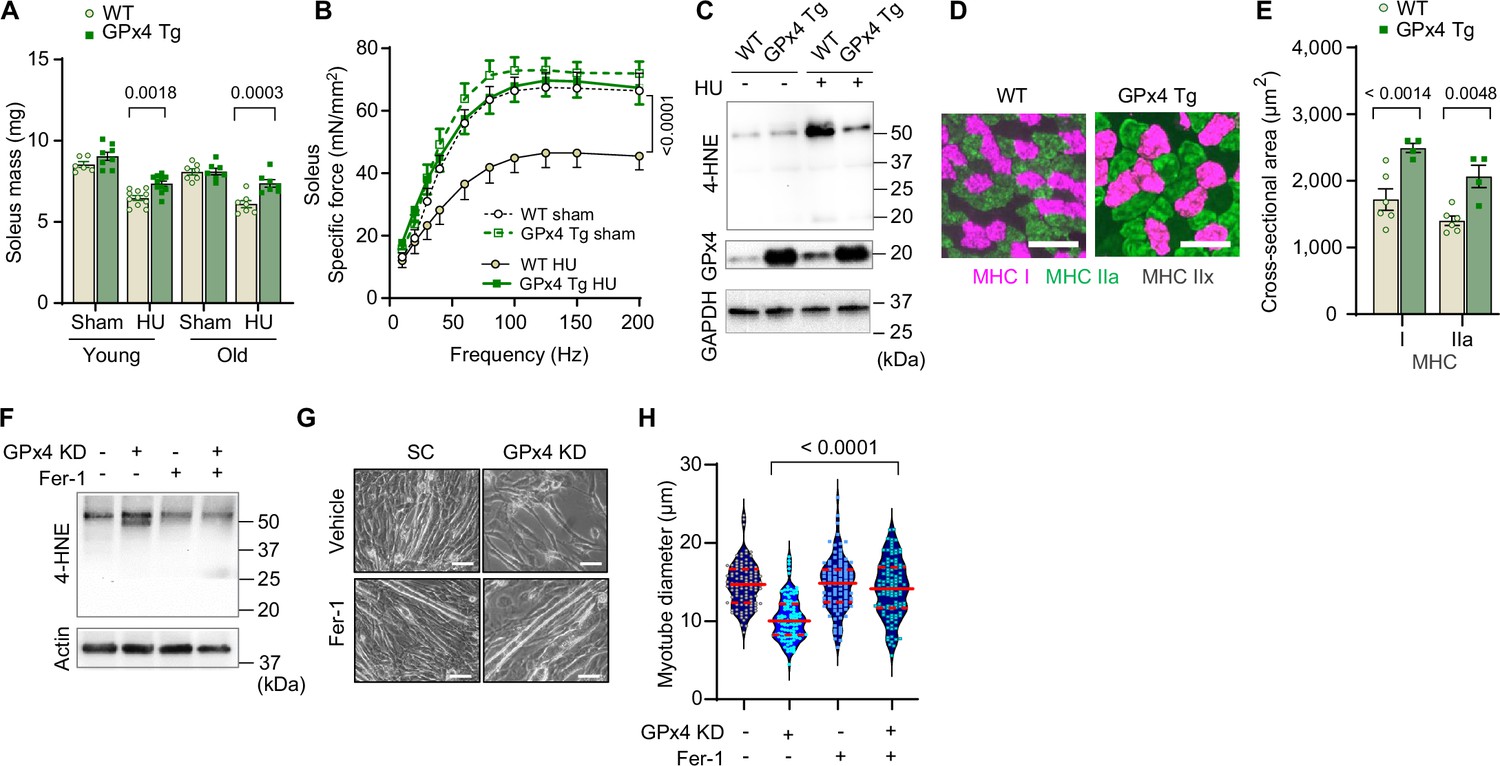
Overexpression of glutathione peroxidase 4 (GPx4) ameliorates disuse-induced muscle atrophy and weakness in young and old mice.
(A) Soleus muscle mass from young or old wildtype (WT) or GPx4Tg mice with or without hindlimb unloading (HU) (n=6–11 per young group, n=7 per old group). (B) Force-frequency curve from old WT or GPx4Tg mice (n=5–7 per group). (C) Immunoblotting of 4-hydroxynonenal (4-HNE) in gastrocnemius muscles from old WT or GPx4Tg mice. (D, E) Representative images of MHC immunofluorescence (D) and muscle fiber cross-sectional area (CSA) by fiber type (E) for soleus muscles in old WT or GPx4Tg mice with HU (n=4–6 per group). (F) Immunoblotting of 4-HNE, and actin in C2C12 myotubes with or without GPx4 KD and/or ferrostatin-1. (G, H) Representative images (G), and quantification of myotube diameter (H) from C2C12 myotubes with GPx4 KD and/or ferrostatin-1 treatments (n=102–110 per group). Scale bar, 100 μm. Data from GPx4Tg experiments are from male and female mice. Data are shown as the mean ± SEM. Statistical analyses in (H) was performed with a one-way analysis of variance (ANOVA) with Dunnett’s multiple comparisons test, and statistical analyses in (A, B) and (E) were performed with a two-way ANOVA and were performed using Tukey’s (B, E) or Sidak’s (A) multiple comparisons tests.
-
Figure 8—source data 1
Original western blots.
- https://cdn.elifesciences.org/articles/85289/elife-85289-fig8-data1-v2.zip
Figure 8—figure supplement 1
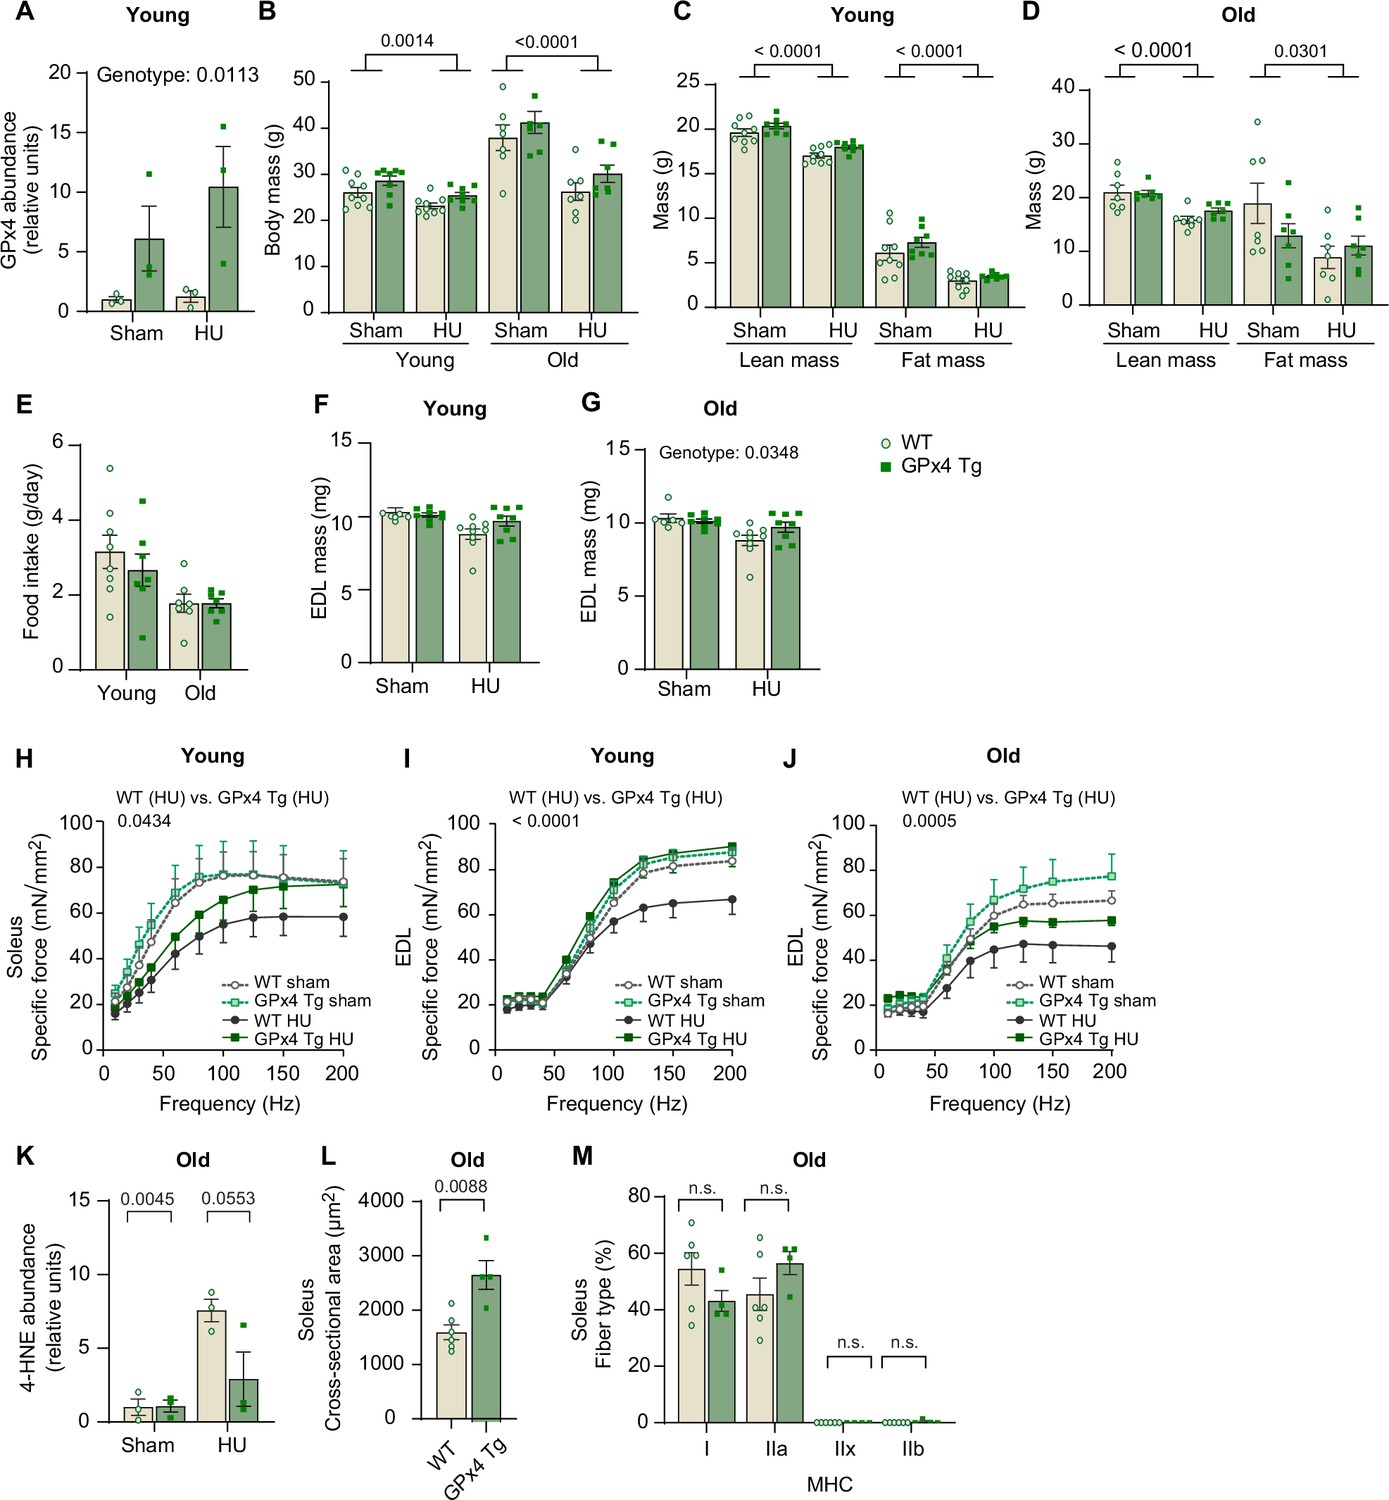
Additional data from GPx4Tg mice.
(A) Quantification of GPx4 proteins from wildtype (WT) or GPx4Tg with or without hindlimb unloading (HU) (n=3 per group). (B) Body mass from young (n=9 for WT, n=8 for GPx4Tg) and old (n=7 for WT, n=7 for GPx4Tg) mice. (C, D) Body composition from young mice (C) and old mice (D). (E) Food intake during HU from young and old mice. (F, G) Extensor digitorum long (EDL) muscle mass from young (n=6 for WT sham, n=8 for GPx4Tg sham, n=9 for WT HU, n=8 for GPx4Tg HU) (F) and old (n=7 per group) (G) mice. (H) Force-frequency curve in soleus muscle from young mice (n=5 for WT sham, n=6 for GPx4Tg sham, n=9 for WT HU, n=8 for GPx4Tg HU). (I, J) Force-frequency curve in EDL muscle from young mice (n=5 for WT sham, n=7 for GPx4Tg sham, n=9 for WT HU, n=8 for GPx4Tg HU) (I) and old (n=5 for WT sham, n=5 for GPx4Tg sham, n=5 for WT HU, n=6 for GPx4Tg HU) (J) mice. (K) Quantification of 4-hydroxynonenal (4-HNE) proteins from gastrocnemius muscles in old mice (n=3 per group). (L, M) Mean muscle fiber cross-sectional area (CSA) (L) and fiber-type composition (M) for soleus muscles from old mice following HU (n=6 for WT, n=4 for GPx4Tg). Data from GPx4Tg experiments are from male and female mice. Data are shown as the mean ± SEM. Statistical analyses in (L) were performed with an unpaired two-tailed t-test. Statistical analyses in (A–M) were performed with a two-way analysis of variance (ANOVA) and Tukey’s multiple comparison test. GPx4, glutathione peroxidase 4.
Figure 8—figure supplement 2
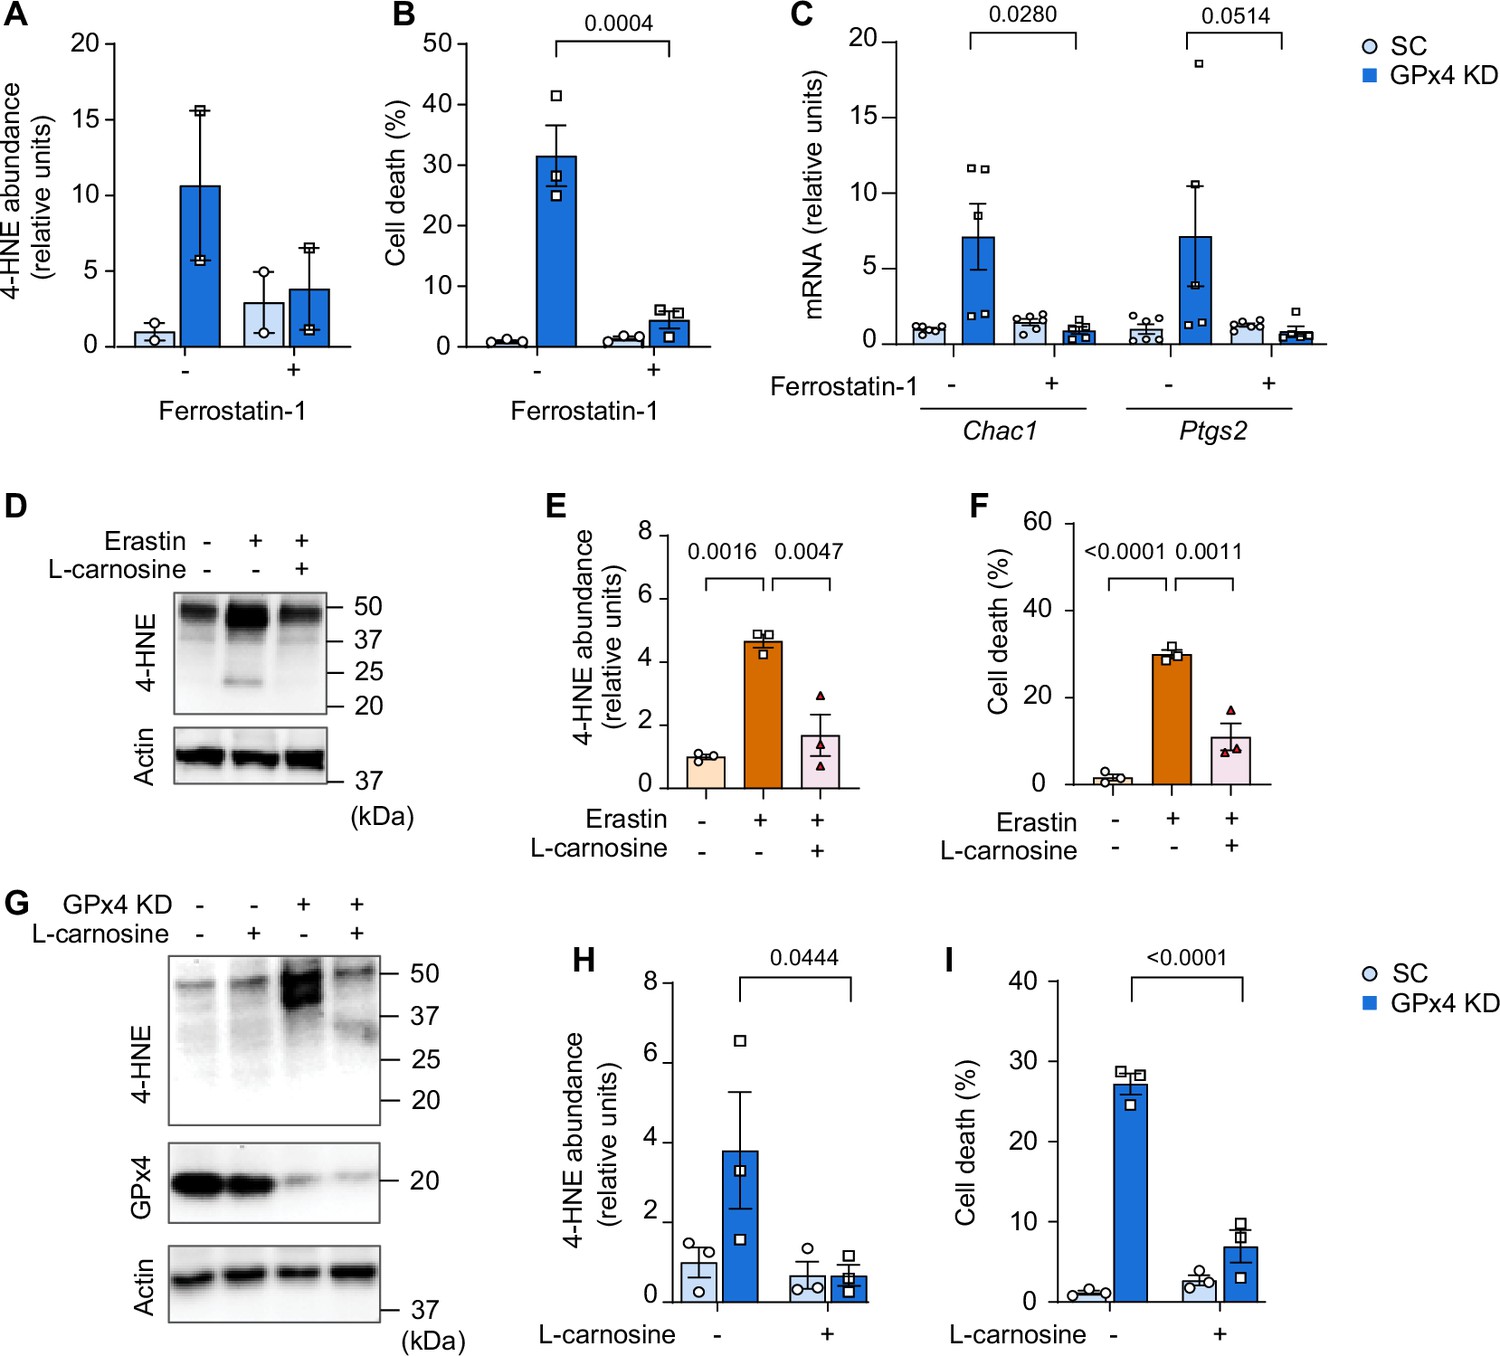
Effects of ferrostatin-1 or L-carnosine treatment in vitro.
(A, B, C) Quantification of 4-hydroxynonenal (4-HNE) proteins (n=2 per group) (A), cell death level (n=3 independent repeats) (B), and mRNA levels of Chac1 and Ptgs2 with or without glutathione peroxidase 4 (GPx4) KD and/or ferrostatin-1 (n=6 for SC, n=5 for GPx4 KD) (C) in C2C12 myotubes. (D, E, F) Immunoblotting (D) and quantification (E) of 4-HNE, and actin (n=3 per group) and cell death level (n=3 independent repeats) (F) with or without erastin and/or L-carnosine in C2C12 myotubes. (G, H, I) Immunoblotting (G) and quantification (H) of 4-HNE and actin (n=3 per group), and (I) cell death level (n=3 independent repeats) in C2C12 myotubes with or without GPx4 KD and/or L-carnosine. Data are shown as the mean ± SEM. Statistical analyses in (E) and (F) were performed with a one-way analysis of variance (ANOVA) and Tukey’s multiple comparison test. Statistical analyses in (A, B, C, H) and (I) were performed with a two-way ANOVA and Tukey’s multiple comparison test.
-
Figure 8—figure supplement 2—source data 1
Original western blots.
- https://cdn.elifesciences.org/articles/85289/elife-85289-fig8-figsupp2-data1-v2.zip
Figure 8—figure supplement 3

L-carnosine treatment partly ameliorates disuse-induced muscle atrophy.
(A, B, C, D, E, F, G) Body mass (A), body composition (n=6 for vehicle sham, n=7 for L-carnosine sham, n=12 for vehicle hindlimb unloading [HU], n=13 for L-carnosine HU) (B), food intake (C), water intake (n=6 for vehicle sham, n=6 for L-carnosine sham, n=6 for vehicle HU, n=7 for L-carnosine HU) (D), immunoblotting (E), and quantification (F) of 4-hydroxynonenal (4-HNE) in gastrocnemius muscles (n=3 per group), and soleus muscle mass (n=6 for vehicle sham, n=7 for L-carnosine sham, n=12 for vehicle HU, n=13 for L-carnosine HU) (G). Data from L-carnosine experiments are from male mice. Data are shown as the mean ± SEM. Statistical analyses in (A, B, C, D, F) and (G) were performed with a two-way analysis of variance (ANOVA) and Tukey’s multiple comparison test.
-
Figure 8—figure supplement 3—source data 1
Original blots.
- https://cdn.elifesciences.org/articles/85289/elife-85289-fig8-figsupp3-data1-v2.zip
Figure 9 with 2 supplements
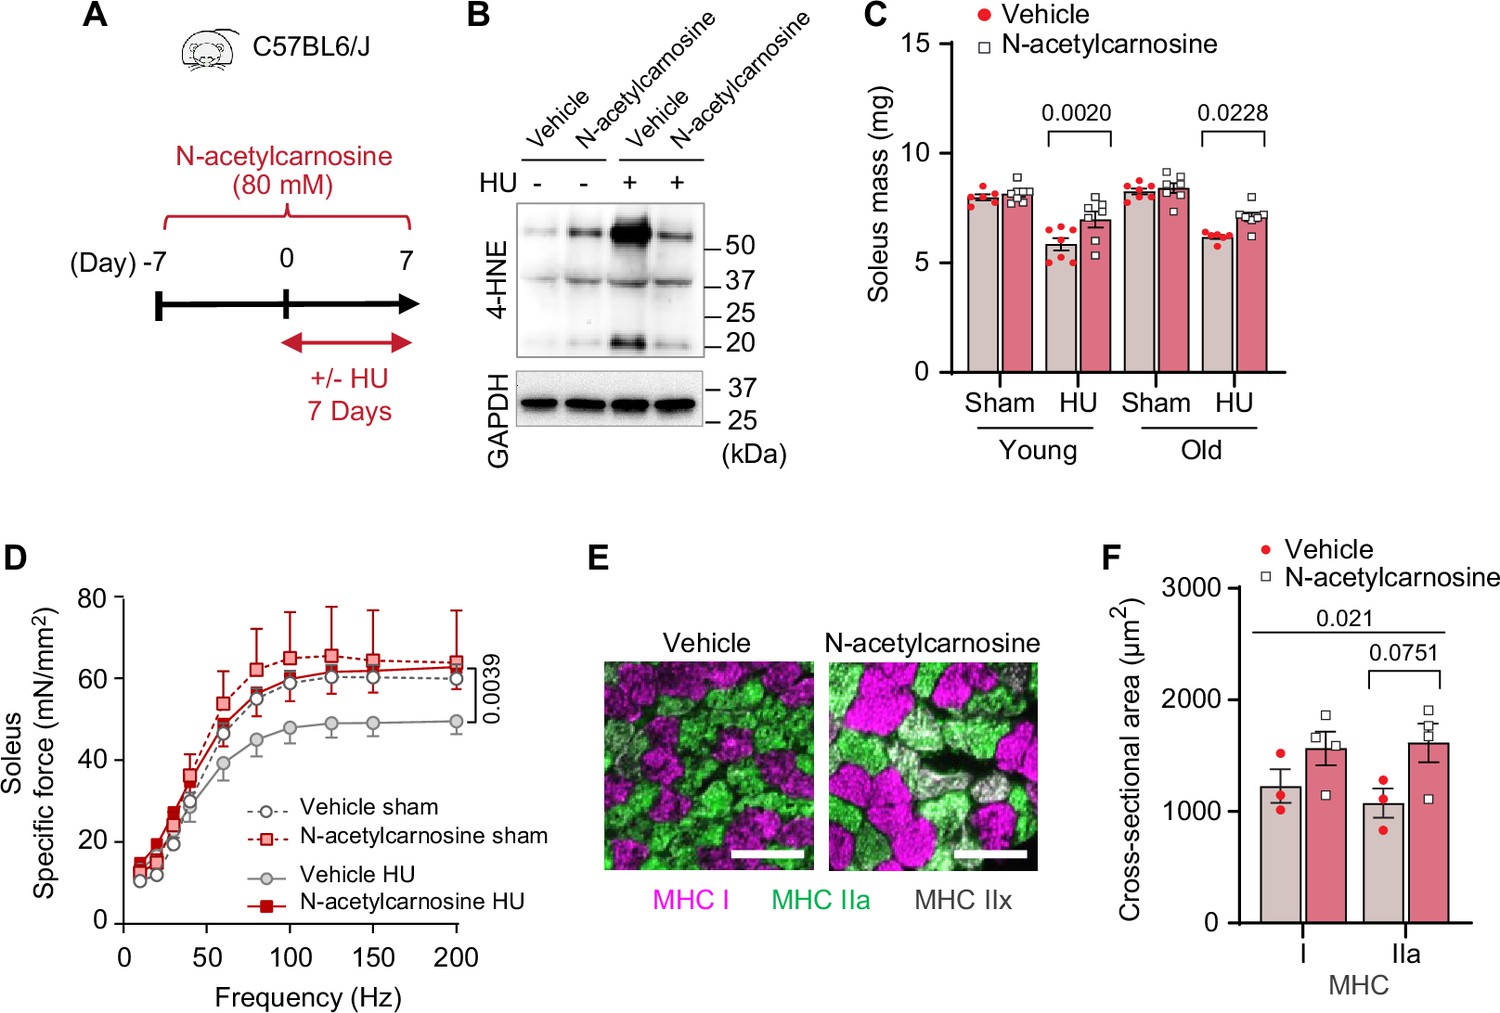
Pharmacological suppression of carbonyl stress ameliorates muscle atrophy and weakness in young and old mice.
(A) Schematic illustration of the protocol for administration of N-acetylcarnosine in vivo. (B) Immunoblotting of 4-hydroxynonenal (4-HNE) in gastrocnemius muscles from N-acetylcarnosine treatment in old mice. (C) Soleus muscle mass from young or old mice with or without N-acetylcarnosine treatment (n=6–8 per young group, n=7 per old group). (D) Force-frequency curve from N-acetylcarnosine study in old mice (n=4–5 per group). (E, F) Representative images of MHC immunofluorescence (E) and muscle fiber cross-sectional area (CSA) by fiber type (F) for soleus muscles (n=3–4 per group) in old mice from the N-acetylcarnosine study. Data from N-acetylcarnosine experiments are from male and female mice. Data are shown as the mean ± SEM. Statistical analyses in (C, D) and (F) were performed with a two-way analysis of variance (ANOVA) and were performed using Tukey’s (C, F) or Sidak’s (D) multiple comparisons tests.
-
Figure 9—source data 1
Original western blots.
- https://cdn.elifesciences.org/articles/85289/elife-85289-fig9-data1-v2.zip
Figure 9—figure supplement 1
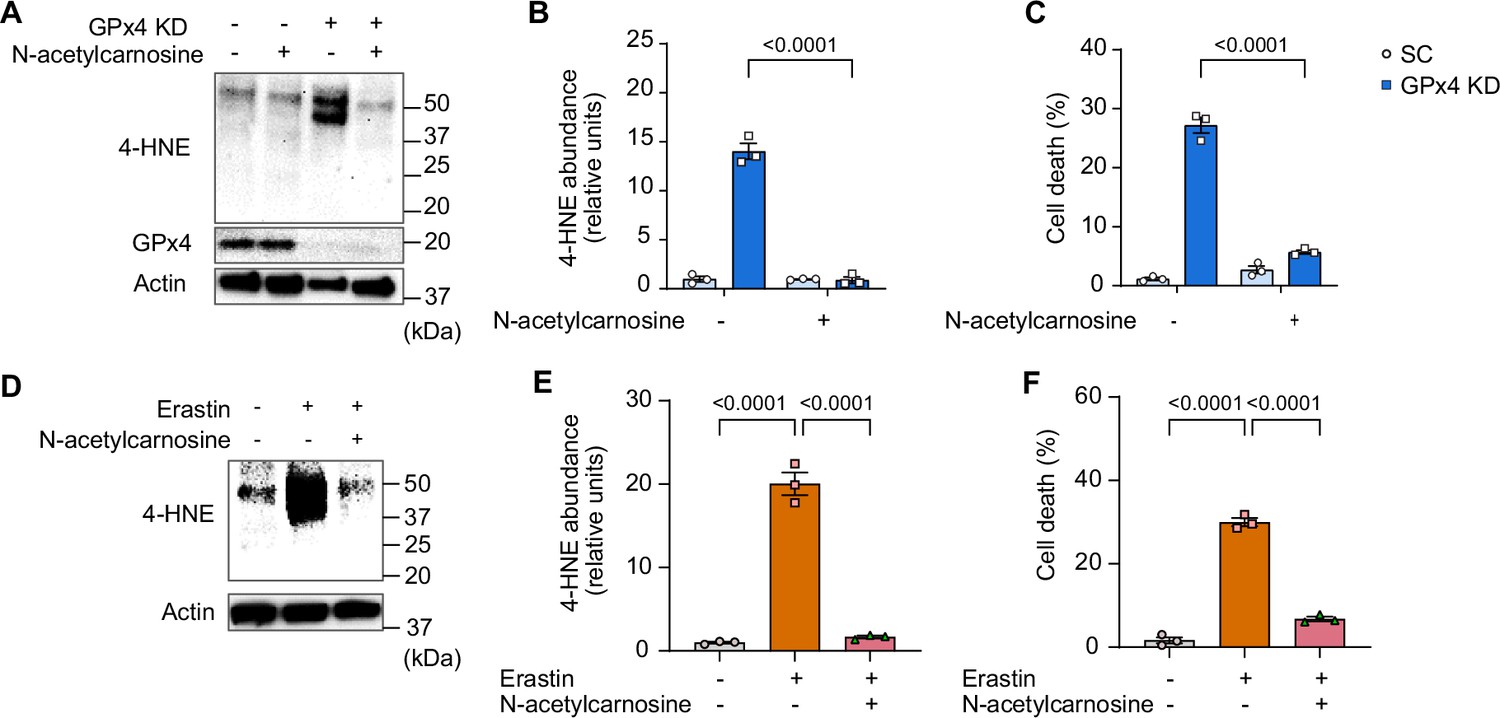
Effects of N-acetylcarnosine treatment in vitro.
(A, B, C) Immunoblotting (A) and quantification (B) for 4-hydroxynonenal (4-HNE), glutathione peroxidase 4 (GPx4), and actin (n=3 per group) and cell death level (n=3 independent repeats) (C) from C2C12 myotubes with or without GPx4 KD and/or N-acetylcarnosine. (D, E, F) Immunoblotting (D) and quantification (E) of 4-HNE and actin (n=3 per group) and cell death level (n=3 independent repeats) (F) in C2C12 myotubes with or without erastin and/or N-acetylcarnosine. Data are shown as the mean ± SEM. Statistical analyses in (B) and (C) were performed with a two-way analysis of variance (ANOVA) and Tukey’s multiple comparison test. Statistical analyses in (E) and (F) were performed with a one-way ANOVA and Tukey’s multiple comparison test.
-
Figure 9—figure supplement 1—source data 1
Original western blots.
- https://cdn.elifesciences.org/articles/85289/elife-85289-fig9-figsupp1-data1-v2.zip
Figure 9—figure supplement 2

Additional data from N-acetylcarnosine treatment in vivo.
(A, B, C) Body mass (A), body composition from young mice (B) and old mice (C). (D, E, F, G) Food intake (D), water intake (E) (young: n=6 for vehicle sham, n=8 for N-acetylcarnosine sham, n=6 for vehicle hindlimb unloading (HU), n=7 for N-acetylcarnosine HU. Old: n=7 for vehicle sham, n=7 for N-acetylcarnosine sham, n=6 for vehicle HU, n=7 for N-acetylcarnosine HU). Immunoblotting (F) and quantification (G) of 4-hydroxynonenal (4-HNE) in gastrocnemius muscles (n=3 per group). (H) Extensor digitorum long (EDL) muscle mass from young mice and old mice. (I) Force-frequency curve in soleus muscle from young mice (n=5 for vehicle sham, n=6 for N-acetylcarnosine sham, n=5 for vehicle HU, n=5 for N-acetylcarnosine HU). (J, K) Force-frequency curve in EDL muscle from young mice (n=7 for vehicle sham, n=7 for N-acetylcarnosine sham, n=6 for vehicle HU, n=7 for N-acetylcarnosine HU) (J) and old mice (n=6 for vehicle sham, n=7 for N-acetylcarnosine sham, n=6 for vehicle HU, n=6 for N-acetylcarnosine HU) (K). (L, M) Average of muscle fiber cross-sectional area (CSA) (l) and fiber-type composition (M) for soleus muscles from old mice following HU (n=3 for vehicle, n=4 for N-acetylcarnosine). Data from N-acetylcarnosine experiments are from male and female mice. Data are shown as the mean ± SEM. Statistical analyses in (L) were performed with an unpaired two-tailed t-test. Statistical analyses in (A, B, C, D, E, G, H, I, J, K) and (M) were performed with a two-way analysis of variance (ANOVA) and Tukey’s multiple comparison test.
-
Figure 9—figure supplement 2—source data 1
Original blots.
- https://cdn.elifesciences.org/articles/85289/elife-85289-fig9-figsupp2-data1-v2.zip
Tables
Key resources table
| Reagent type (species) or resource | Designation | Source or reference | Identifiers | Additional information |
|---|---|---|---|---|
| Antibody | 4-Hydroxynonenal (4-HNE) (Mouse monoclonal) | Abcam | Ab48506 | WB (1:1000) |
| Antibody | Actin (Rabbit Polyclonal) | MilliporeSigma | A2066 | WB (1:1000) |
| Antibody | Alexa Fluor 647-conjugated secondary (Goat Anti-Mouse Polyclonal) | Invitrogen | A21242 | IF (1:250) |
| Antibody | Alexa Fluor 568-conjugated secondary (Donkey Anti-Mouse Polyclonal) | Abcam | Ab175472 | IF (1:500) |
| Antibody | Alexa Fluor 555-conjugated secondary (Goat Anti-Mouse Polyclonal) | Invitrogen | A21426 | IF (1:500) |
| Antibody | Alexa Fluor 488-conjugated secondary (Donkey Anti-Rabbit Polyclonal) | Abcam | Ab150073 | IF (1:500) |
| Antibody | Alexa Fluor 488-conjugated secondary (Goat Anti-Mouse Polyclonal) | Invitrogen | A21121 | IF (1:500) |
| Antibody | GAPDH (Rabbit Monoclonal) | Cell Signaling Technology | 14C10 | WB (1:1000) |
| Antibody | GPx4 (Rabbit Monoclonal) | Abcam | Ab125066 | WB (1:1000) |
| Antibody | LAMP-2 (Rabbit Polyclonal) | Novus | NB300-591 | IF (1:200) |
| Antibody | LC3B (Mouse Monoclonal) | Cell Signaling Technology | 83506 | WB (1:1000) |
| Antibody | Myosin Heavy Chain Type I (Mouse Monoclonal) | DSHB | BA.D5 | IF (1:100) |
| Antibody | Myosin Heavy Chain Type IIA (Mouse Monoclonal) | DSHB | SC.71 | IF (1:100) |
| Antibody | Myosin Heavy Chain Type IIB (Mouse Monoclonal) | DSHB | BF.F3 | IF (1:100) |
| Antibody | P62 (Mouse Monoclonal) | Abcam | Ab56416 | WB (1:1000) |
| Biological Sample (Human) | Human Muscle Biopsy Samples | Tanner et al., 2015 Reidy et al., 2017 | N/A | |
| Cell Line, (Mus musculus) | C2C12 Myoblasts | ATCC | CRL-1772 | |
| Cell Line, (Human) | HEK293T | ATCC | CTRL-3216 | |
| Strain, strain background (Mus musculus) | C57BL/6J; Wild Type (WT) | The Jackson Laboratory | 000664 | Male and Female |
| Strain, strain background (Mus musculus) | GPx4 heterogeneous KO (Gpx4+/-) | Yant et al., 2003. | N/A | |
| Strain, strain background (Mus musculus) | GPx4 overexpression (GPx4Tg) | Ran et al., 2004. | N/A | |
| Strain, strain background (Mus musculus) | GPx4 conditional KO (GPx4 cKO lox/lox) | The Jackson Laboratory | 027964 | |
| Strain, strain background (Mus musculus) | ATG3 conditional KO (ATG3 cKO lox/lox) | Cai et al., 2018. | N/A | |
| Strain, strain background (Mus musculus) | HSA-MerCreMer+/- | McCarthy et al., 2012. | N/A | |
| Strain, strain background (Mus musculus) | Gpx4 shRNA | MilliporeSigma | TRCN0000076552 | |
| Strain, strain background (Mus musculus) | Lpcat3 shRNA | MilliporeSigma | TRCN0000121437 | |
| Strain, strain background (Mus musculus) | Atg3 shRNA | MilliporeSigma | TRCN0000247442 | |
| Recombinant DNA Reagent | Packaging Vector psPAX2 | Addgene | 12260 | |
| Recombinant DNA Reagent | Envelope Vector pMD2.G | Addgene | 12259 | |
| Sequence-based reagent | Scrambled shRNA plasmid | Addgene | 1864 | |
| Sequence-based reagent | Mouse Gpx4 Fwd Primer | U of U Genomics Core | GCTGAGAATTCGTGCATGG | |
| Sequence-based reagent | Mouse Gpx4 Rev Primer | U of U Genomics Core | CCGTCTGAGCCGCTTACTTA | |
| Sequence-based reagent | Mouse Atg3 Fwd Primer | U of U Genomics Core | ACACGGTGAAGGGAAAGGC | |
| Sequence-based reagent | Mouse Atg3 Rev Primer | U of U Genomics Core | TGGTGGACTAAGTGATCTCCAG | |
| Sequence-based reagent | Mouse Chac1 Fwd Primer | U of U Genomics Core | CTGTGGATTTTCGGGTACGG | |
| Sequence-based reagent | Mouse Chac1 Rev Primer | U of U Genomics Core | CCCCTATGGAAGGTGTCTCC | |
| Sequence-based reagent | Mouse Ptgs2 Fwd Primer | U of U Genomics Core | TGAGCAACTATTCCAAACCAGC | |
| Sequence-based reagent | Mouse Ptgs2 Rev Primer | U of U Genomics Core | GCACGTAGTCTTCGATCACTATC | |
| Sequence-based reagent | Mouse Lpcat3 Fwd Primer | U of U Genomics Core | GGCCTCTCAATTGCTTATTTCA | |
| Sequence-based reagent | Mouse Lpcat3 Rev Primer | U of U Genomics Core | AGCACGACACATAGCAAGGA | |
| Chemical compound, drug | Auranofin | Sigma-Aldrich | A6733 | |
| Chemical compound, drug | BaFA1 | MilliporeSigma | SML1661 | |
| Chemical compound, drug | Erastin | MilliporeSigma | E7781 | |
| Chemical compound, drug | Ferrostatin-1 | MilliporeSigma | SML0583 | |
| Chemical compound, drug | L-carnosine | MilliporeSigma | C9625 | |
| Chemical compound, drug | N-acetylcarnosine | Cayman Chemical | 18817 | |
| Chemical compound, drug | RSL3 | MilliporeSigma | SLM2234 | |
| Commercial assay or kit | MDA Lipid Peroxidation Assay | Abcam | Ab118970 | |
| Software, algorithm | GraphPad Prism 9.3 | GraphPad | N/A | |
| Software, algorithm | ImageJ | NIH | N/A |
Additional files
-
MDAR checklist
- https://cdn.elifesciences.org/articles/85289/elife-85289-mdarchecklist1-v2.docx
-
Source data 1
A compulation of all uncropped western blots and genotyping gels with labels.
- https://cdn.elifesciences.org/articles/85289/elife-85289-data1-v2.pdf
Download links
A two-part list of links to download the article, or parts of the article, in various formats.
Downloads (link to download the article as PDF)
Open citations (links to open the citations from this article in various online reference manager services)
Cite this article (links to download the citations from this article in formats compatible with various reference manager tools)
Lipid hydroperoxides promote sarcopenia through carbonyl stress
eLife 12:e85289.
https://doi.org/10.7554/eLife.85289


