Fat body-specific reduction of CTPS alleviates HFD-induced obesity
- School of Life Science and Technology, ShanghaiTech University, China
- College of Life Sciences, Shanghai Normal University, China
- Institute of Biochemistry and Cell Biology, Shanghai Institutes for Biological Sciences, Chinese Academy of Sciences, China
- University of Chinese Academy of Sciences, China
- Department of Physiology, Anatomy and Genetics, University of Oxford, United Kingdom
Figures
Figure 1 with 3 supplements
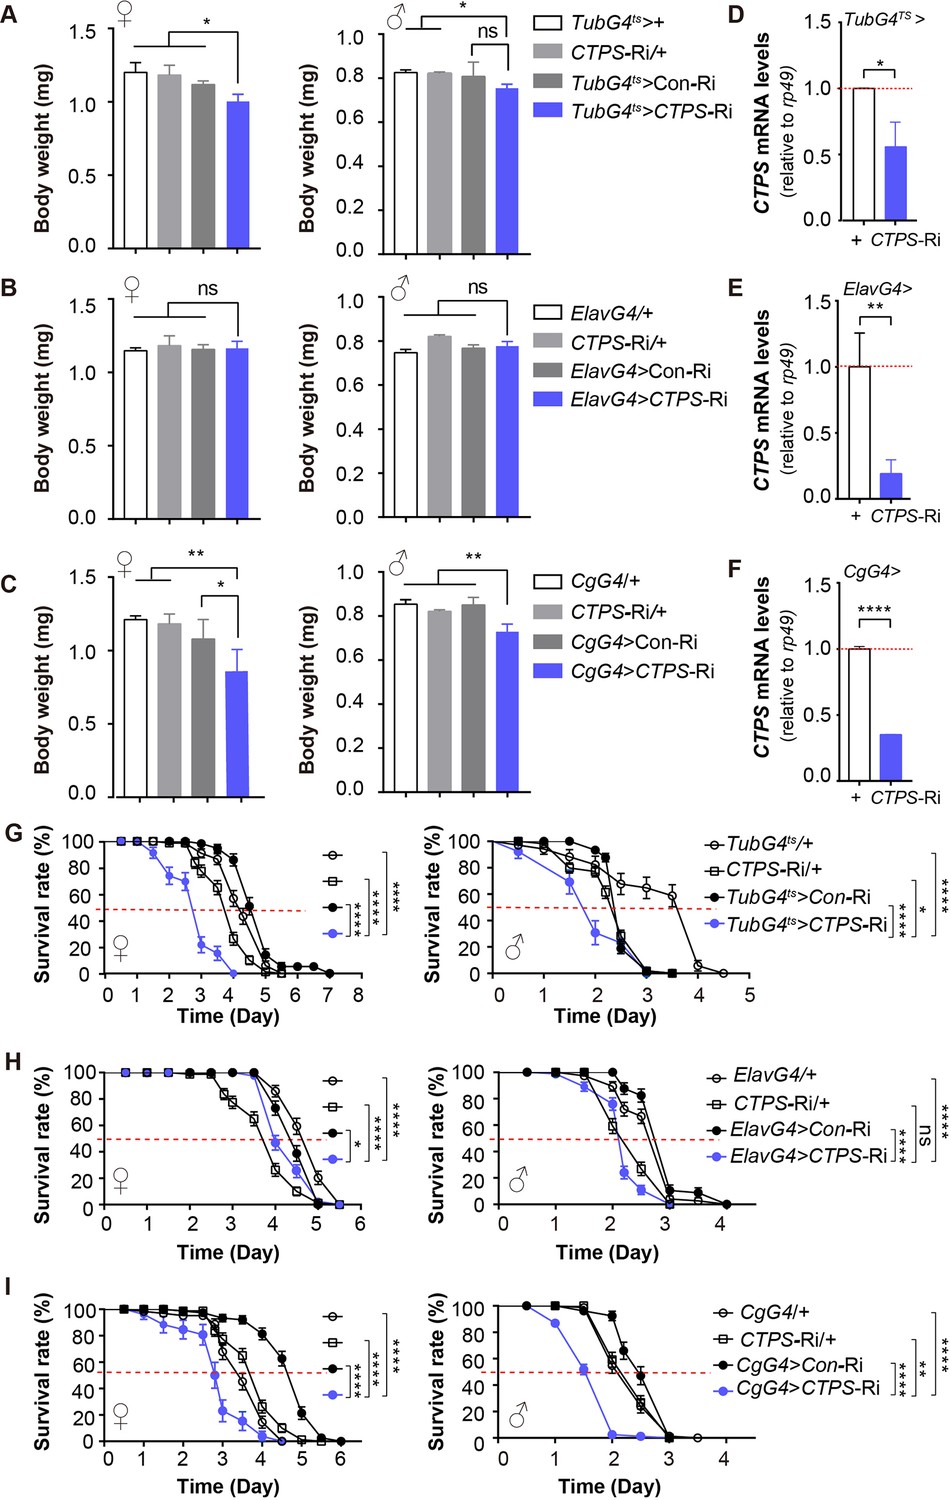
CTPS knockdown in the Drosophila fat body leads to body weight loss.
(A–C) Body weights of 5-day-old adult flies from the indicated genotypes (30 flies/group, 5–6 groups/genotype, 2–3 biological replicates). TubG4ts>CTPS-Ri versus TubG4ts>+, CTPS-Ri/+ or TubG4ts>Con-Ri (A), ElavG4 >CTPS-Ri versus ElavG4>+, CTPS-Ri/+ or ElavG4>CoRi (B), and CgG4>CTPS-Ri versus CgG4>+, CTPS-Ri/+ or CgG4>Con-Ri (C). All values are the means ± standard error of the mean (S.E.M.). ns, not significant, * P<0.05, ** P<0.01, and *** P<0.001 in one-way ANOVA with a Tukey post hoc test. (D–F) Quantitative RT-PCR analysis of the mRNA abundance of CTPS from whole-body (D, F) or head (E) lysates of adult flies in indicative lines (10 flies/group, 3 groups/genotype, 3 biological replicates). TubG4ts>CTPS Ri versus TubG4ts>+ (D); ElavG4>CTPS-Ri versus ElavG4>+ (E); CgG4>CTPS-Ri versus CgG4>+ (F). Relative value are normalized with the control line. All values are the means ± S.E.M. * P<0.05, ** P<0.01, and **** P<0.0001 by Student’s t test. (G–I) Survival curves for starved female and male adult flies from the indicated genotypes (5 days of age; 30 flies/group, 5 groups/genotype, 3 biological replicates). Graphs represent percent survival as the calculated mean survival rate of each group. ns, no significance, *P<0.05, **P<0.01, and ****P<0.0001 by log-rank test.
Figure 1—figure supplement 1
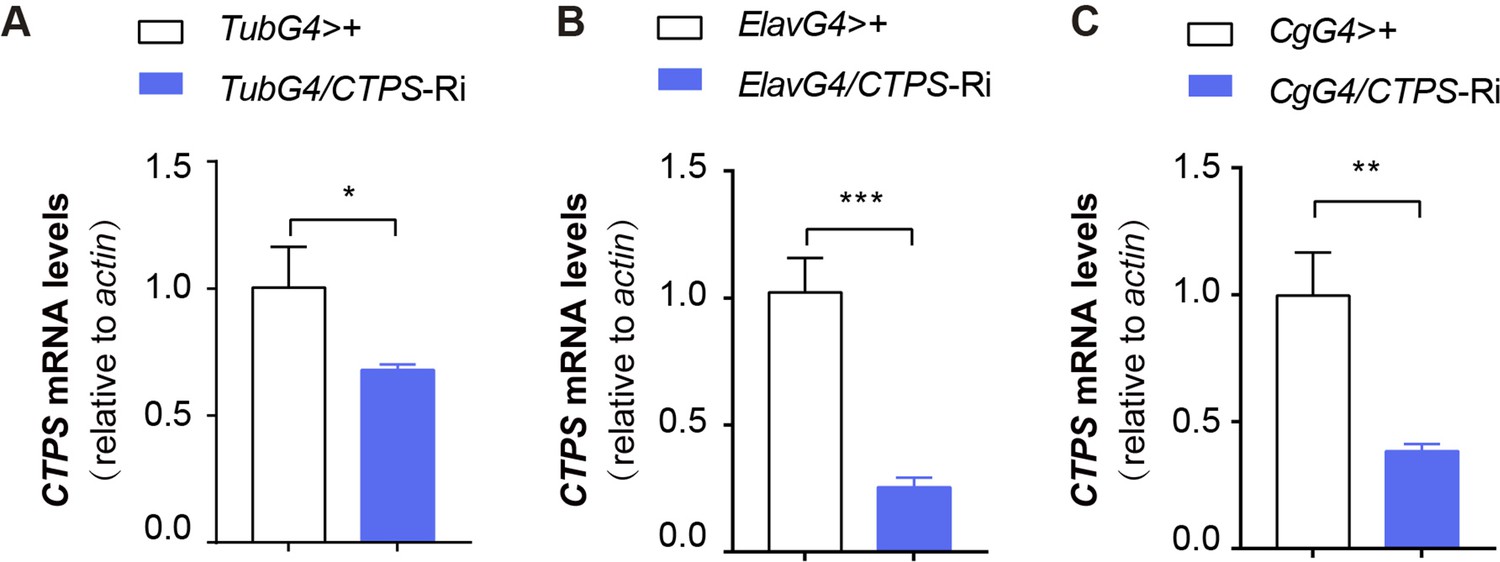
Quantitative RT-PCR analysis.
(A–C) Quantitative RT-PCR analysis of the mRNA abundance of CTPS from whole-body (A, C) or head (B) lysates of adult flies in indicative lines (10 flies/group, 3 groups/genotype, 3 biological replicates). TubG4ts>CTPS Ri versus TubG4ts>+ (A); ElavG4>CTPS-Ri versus ElavG4>+ (B); CgG4>CTPS-Ri versus CgG4>+ (C). The relative values are normalized with the control line. All values are the means ± S.E.M. * P<0.05, ** P<0.01, and *** P<0.001 by Student’s t test.
Figure 1—figure supplement 2
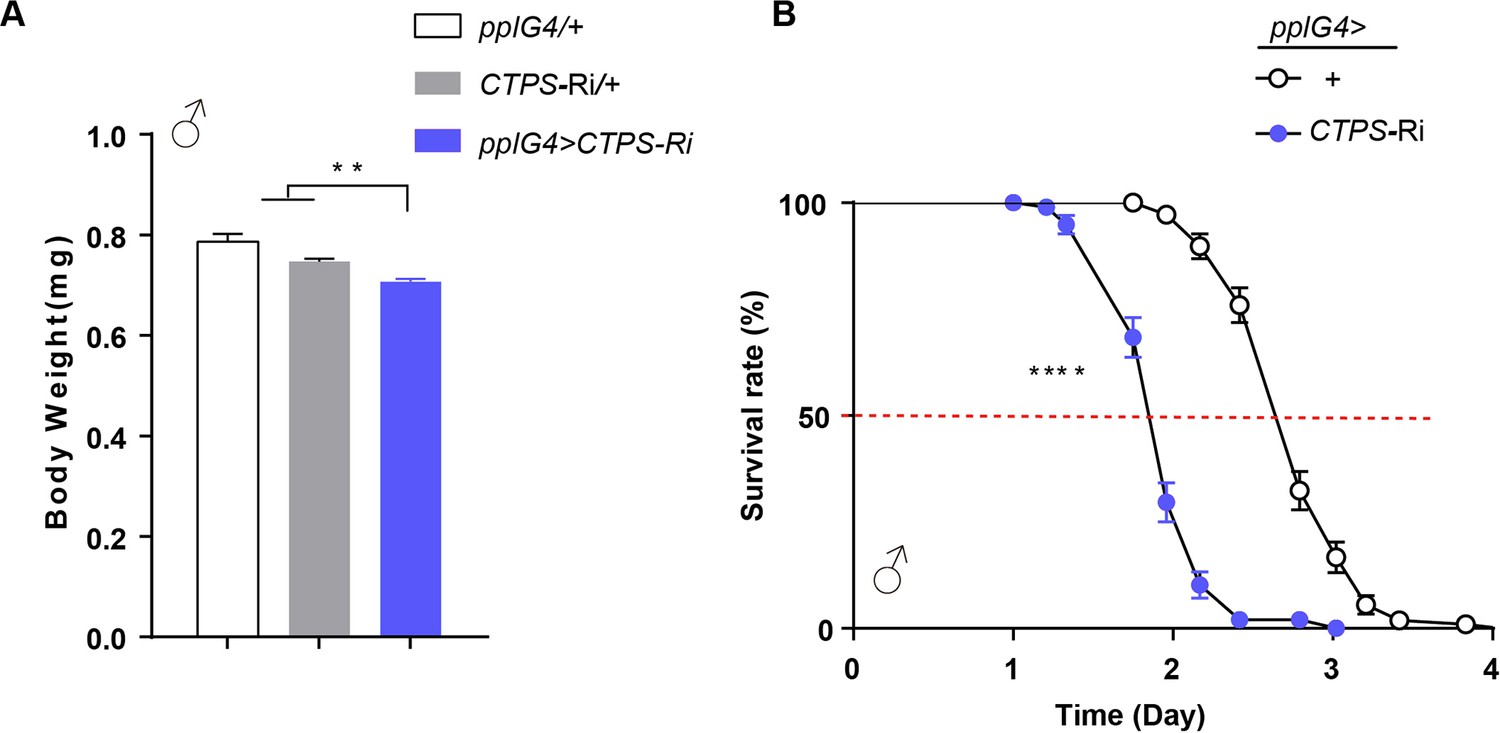
Inhibition of CTPS in adipocytes reduced body weight and resistance to starvation.
(A) Body weight of 5-day-old male adults of the indicated genotypes (30 flies/group, 3 groups/genotype, 2 biological replicates). pplG4>CTPS-Ri versus pplG4>+ or CTPS-Ri/+. All values are means ± S.E.M. ** P<0.01, by Student’s t-test. (B) Survival rates for male adults of the indicated genotypes (5 days of age; 30 flies/group, 5 groups/genotype, 2 biological replicates). χ2=162 for male, pplG4, GFP>+ versus pplG4, GFP >CTPS Ri, **** P<0.001 by log-rank test.
Figure 1—figure supplement 3
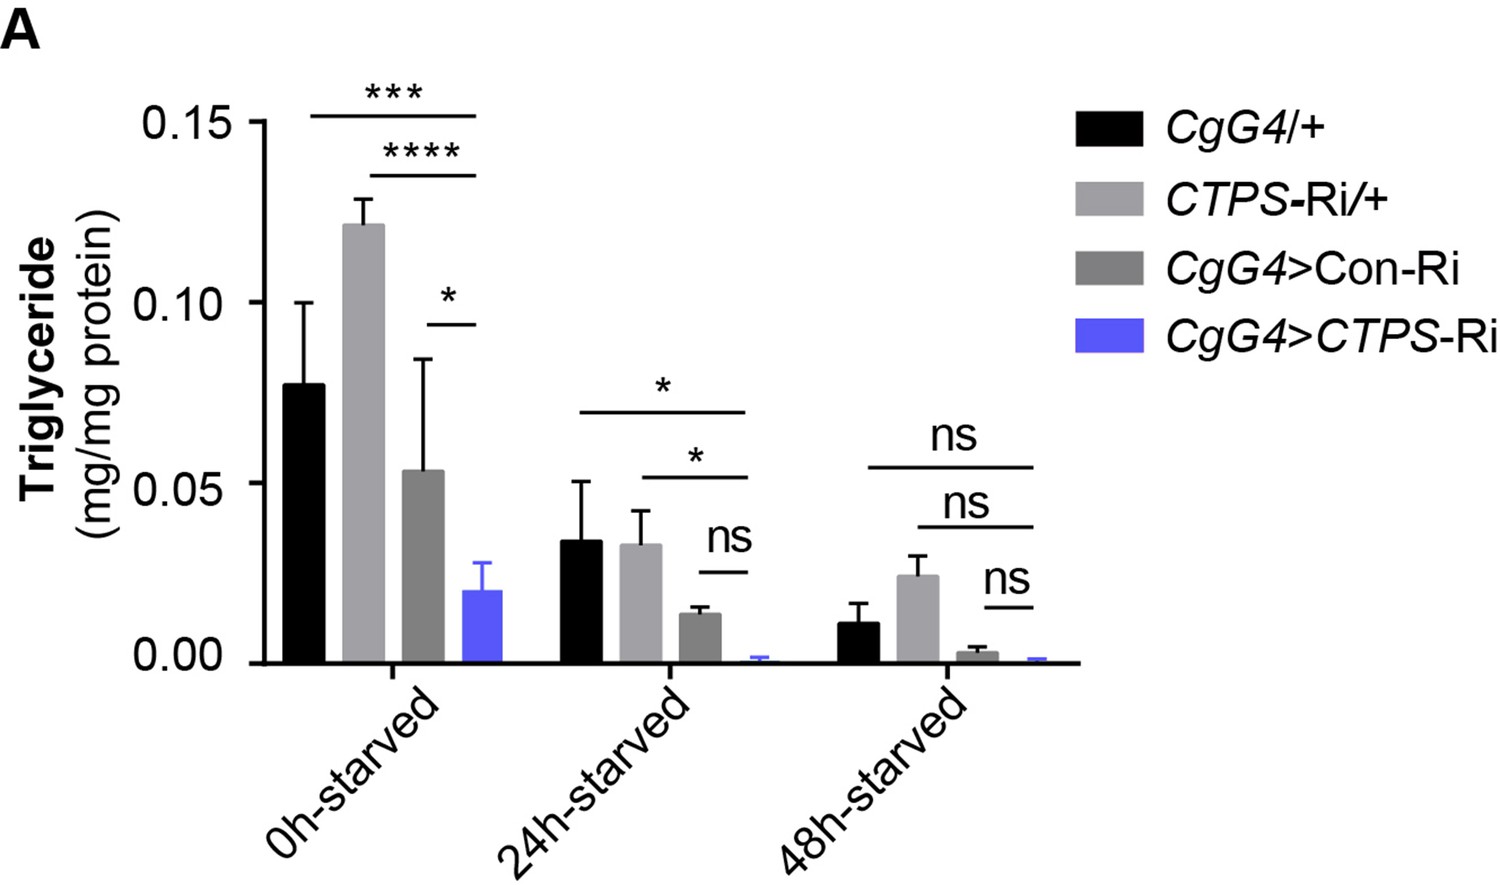
TAG level of male adults upon food deprivation.
(A) The TAG levels of male adults from indicative lines. CgG4>CTPS-Ri versus CgG4>+, CTPS-Ri/+, and CgG4>Con-Ri line. TAG levels are normalized to protein level (10 flies/group; 5–6 groups/genotype, 2 biological replicates). All data are shown as mean ± S.E.M. ns, no significance, * P<0.05, *** P<0.001, and **** P<0.0001 by two-way ANOVA with a Tukey post hoc test.
Figure 2 with 2 supplements
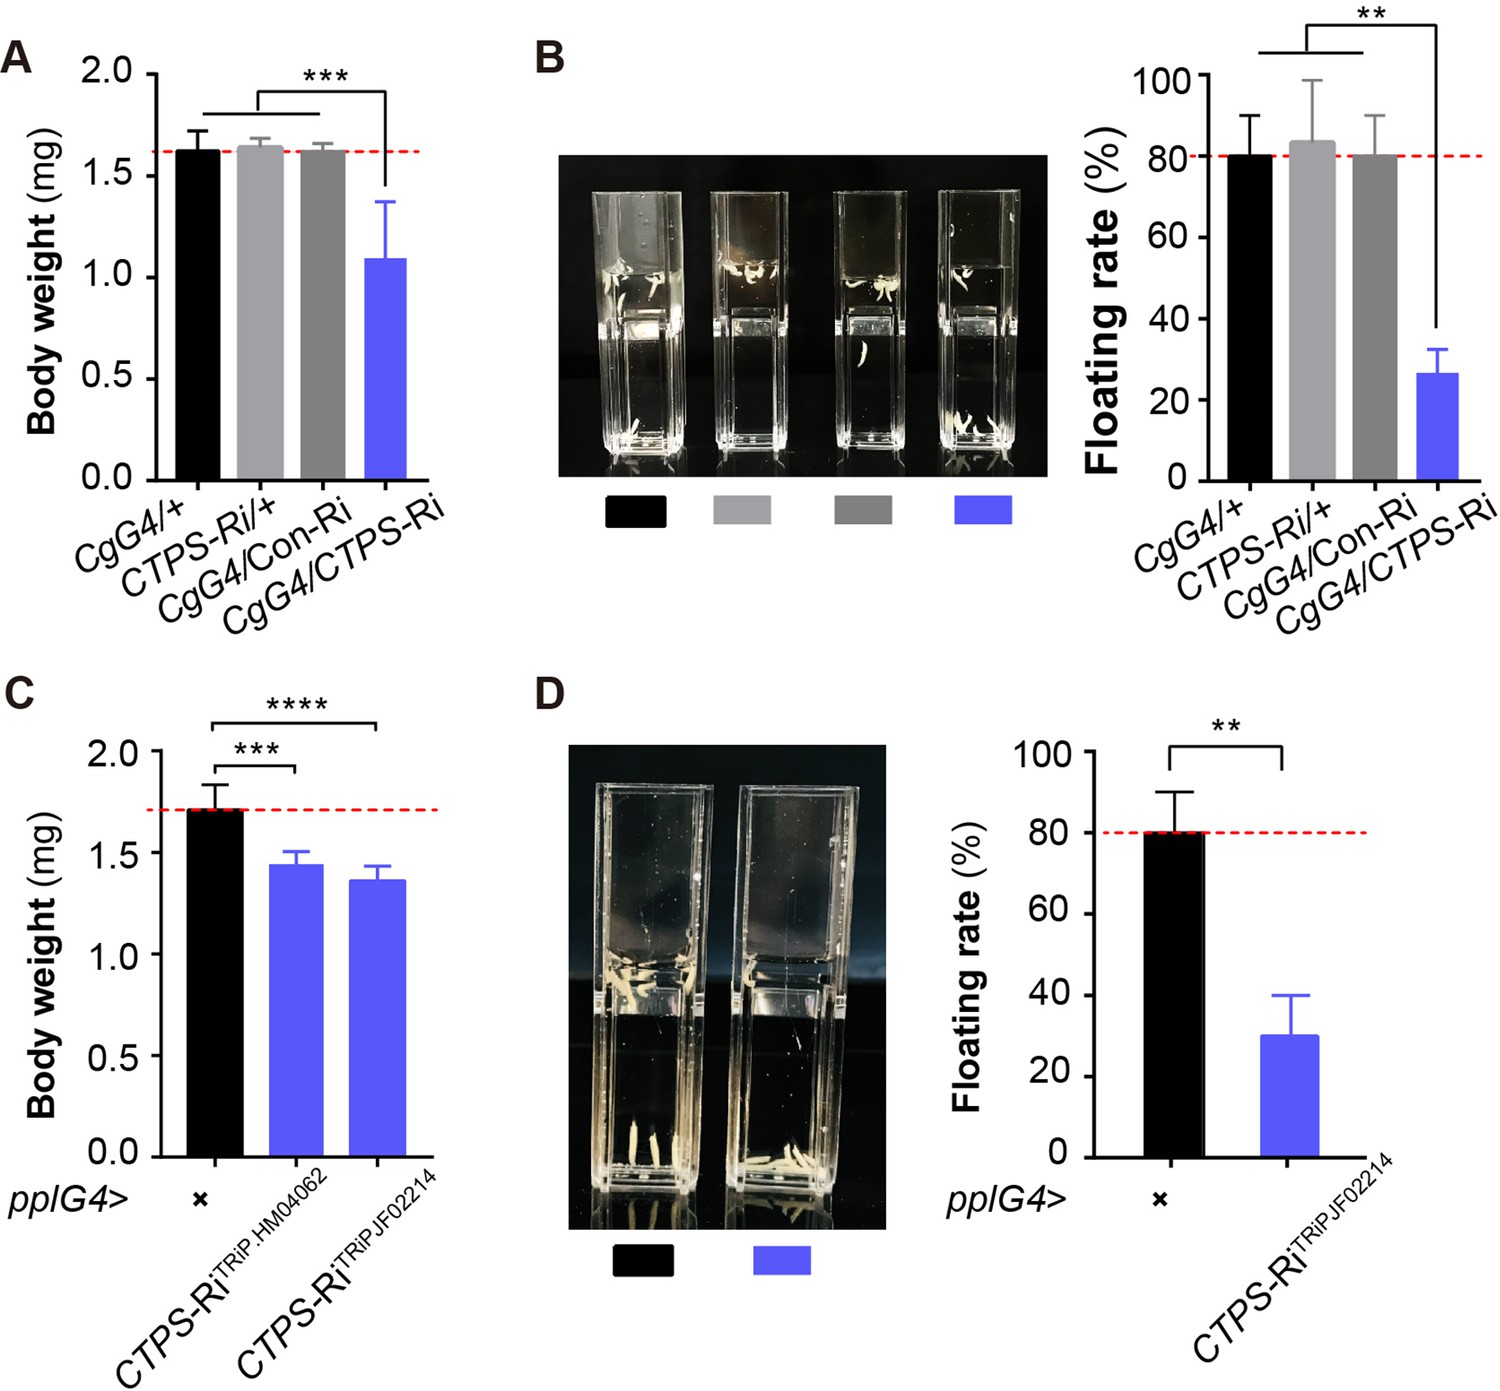
Adipocyte-specific knockdown of CTPS decreases larval body weight.
(A) The 3rd instar wandering larval body weight of the indicated lines (10 larvae/group, 5–6 groups/genotypes, 3 biological replicates). CgG4>CTPS-Ri is compared with CgG4>+, CTPS-Ri/+ or CgG4>Con-Ri controls. (B) Representative photograph of the floating assay (10 larvae/group, 3 groups/genotype, 3 biological replicates) and quantification of floatation scores (% floating larvae, right panel). CgG4>CTPS-Ri is compared with CgG4>+, CTPS-Ri/+ or CgG4>Con-Ri control lines. (C) 3rd instar wandering larval body weight of pplG4>CTPS-Ri and pplG4>+ lines (10 larvae/group, 3 groups/genotype, 3 biological replicates). (D) Representative photograph of the floating assay (10 larvae/group, 3 groups/genotype, 3 biological replicates), and the quantification of floatation scores (% floating larvae, right panel). pplG4>CTPS-Ri and pplG4>+ lines are compared. Data are shown as means ± S.E.M. ** P<0.01, *** P<0.001, and **** P<0.001 by Student’s t test.
Figure 2—figure supplement 1
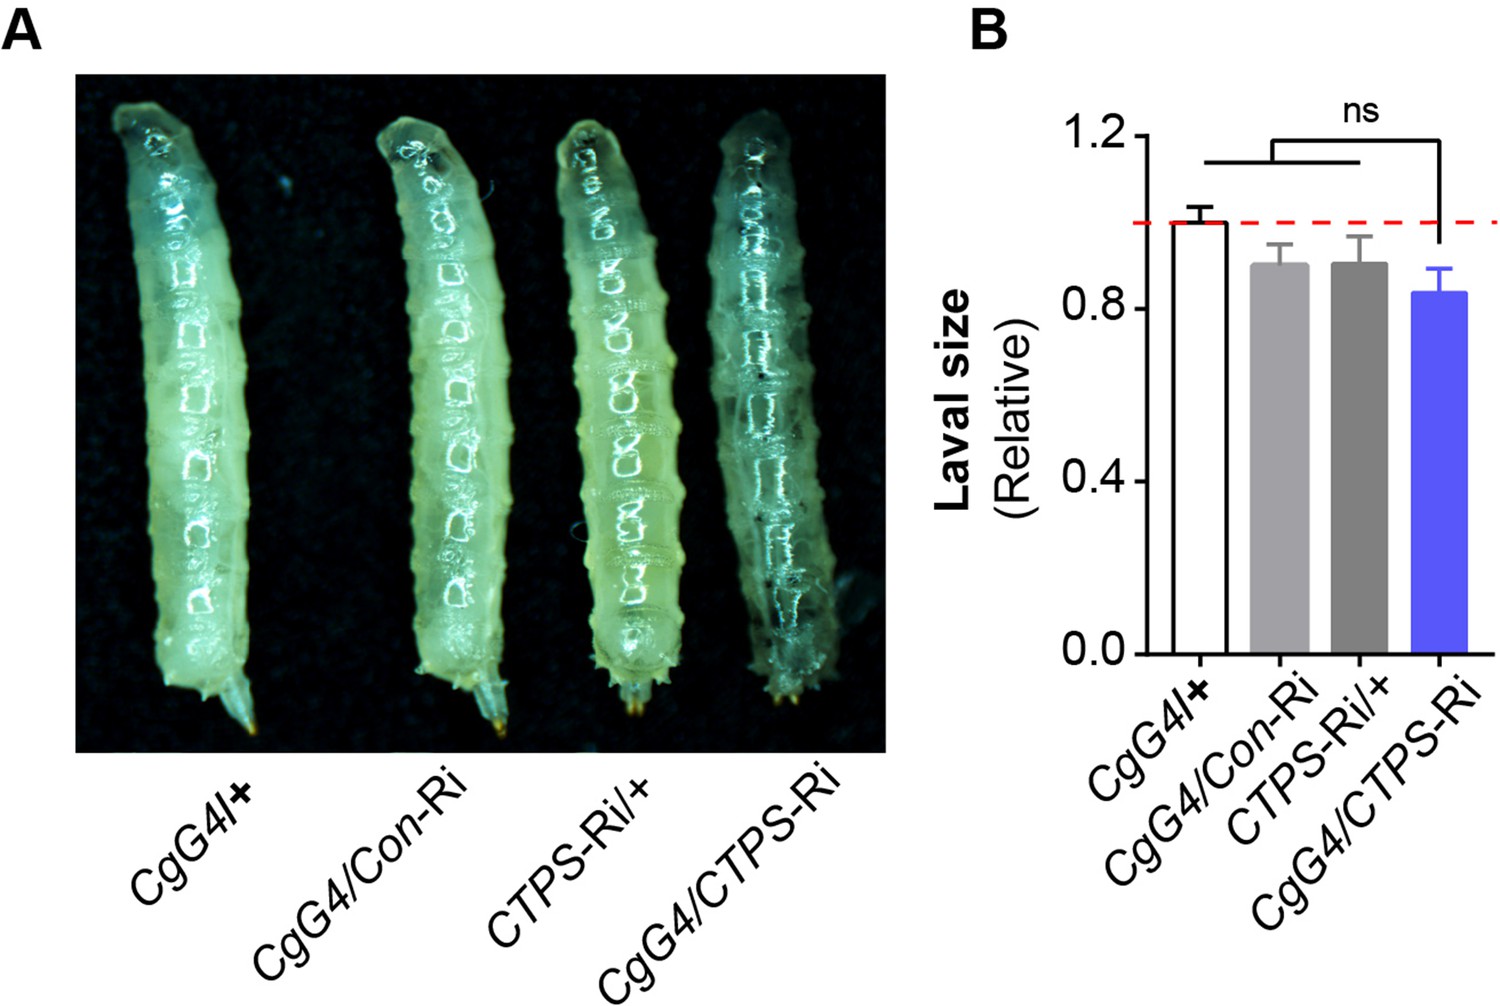
Larval size comparison.
(A) 3rd instar wandering larvae from the indicated lines. (B) Quantification of larval size from (A) (10 larvae/group; 3 groups/genotype, 3 biological replicates). The value is normalized to the CgG4>+ control line. All data are shown as mean ± S.E.M. ns, no significance by one-way ANOVA with a Tukey post hoc test.
Figure 2—figure supplement 2

Quantitative RT-PCR analysis.
(A) Quantitative RT-PCR analysis of CTPS mRNA abundance in the fat body lysate of 3rd instar wandering larvae from the indicated lines (30 larvae/group; 4 groups/genotype; 2 biological replicates). All data are shown as mean ± S.E.M. **** P<0.0001 by one-way ANOVA with a Tukey post hoc test.
Figure 3
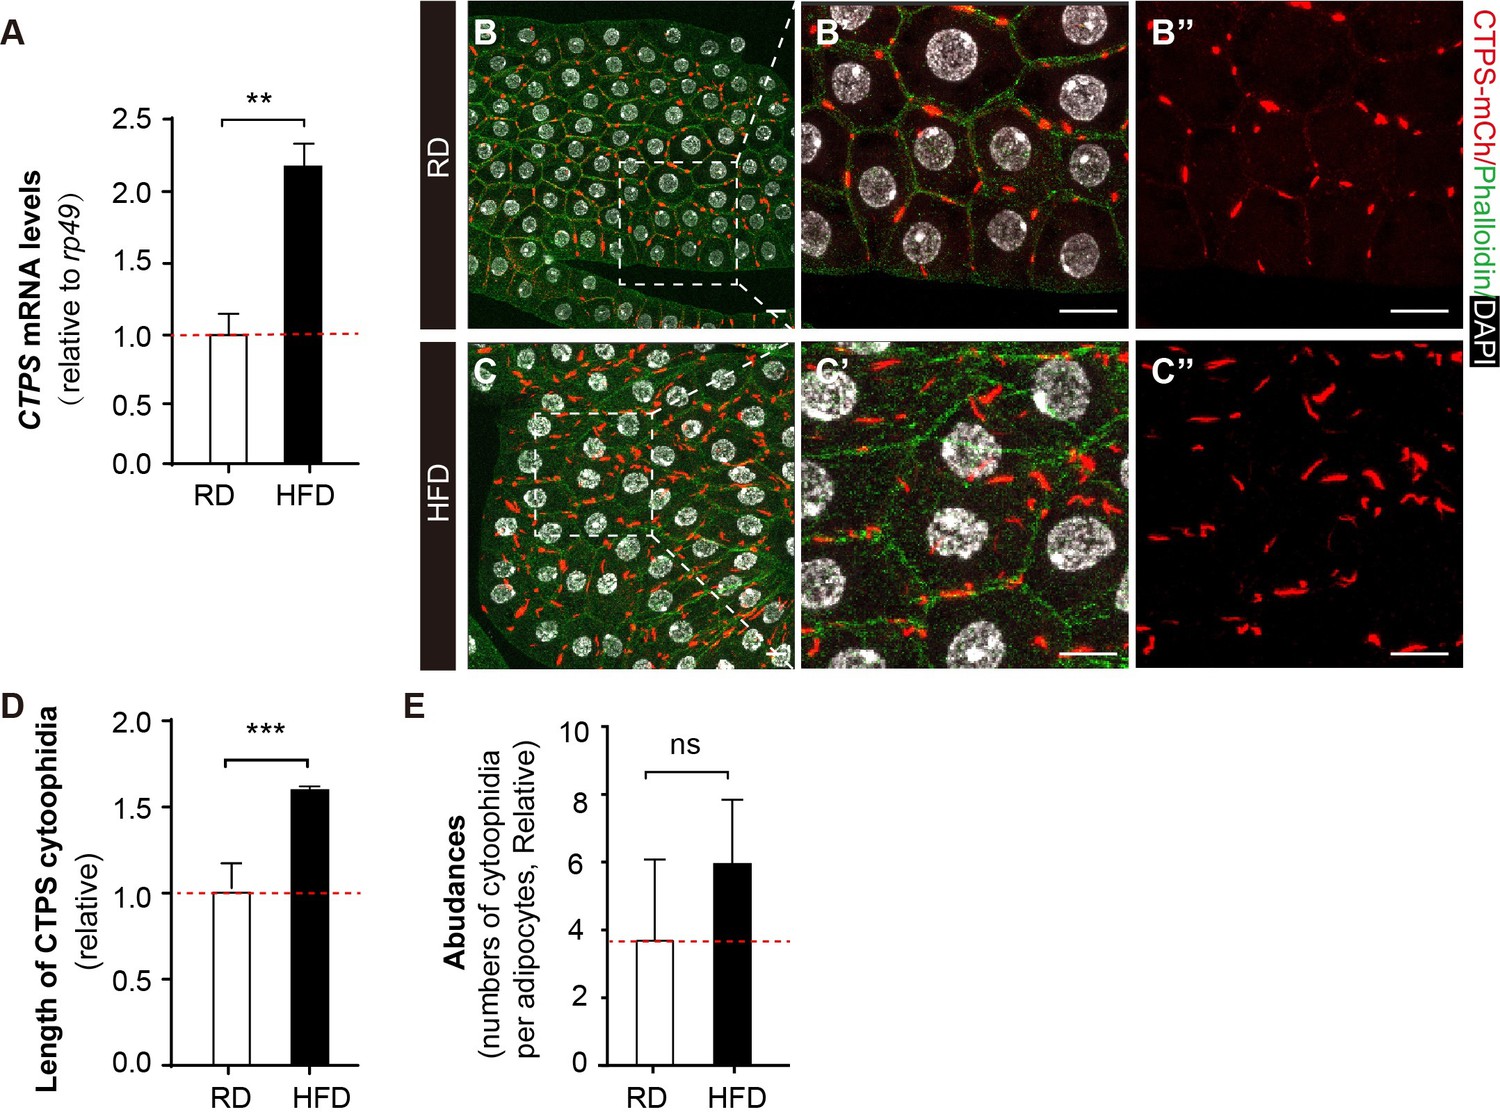
HFD promotes CTPS expression in the fat body.
(A) Quantitative RT-PCR analysis of the abundance of CTPS mRNA in fat body lysates of 76~80 hour after egg laying (AEL) larvae under RD and HFD conditions. The relative value is normalized with larvae under RD feeding (30 larvae/group; 3 groups/genotype; 3 biological replicates). (B–C) Representative confocal images of fat bodies from the 80 hour AEL larvae show that CTPS cytoophidia showed increased elongation upon HFD feeding (C, C’, and C’’) when compared to those in RD-fed larvae (B, B’, and B’’) (20 images/genotype; 3 biological replicates). The area within the white square is magnified in the right panel (B’, B’’, C’, and C’’). Cell plasma membranes are stained with phalloidin (green). Nuclei are stained with DAPI (white). Scale bar, 20 µm. (D) Quantification of the length of the cytoophidia shown in (B, C). The relative value is normalized with larvae under RD feeding (20 images/genotype; 3 biological replicates). (E) Quantification of the numbers of cytoophidia per adipocyte shown in (B, C). The relative value is normalized with larvae under RD feeding (20 images/genotype; 3 biological replicates). All values are the means ± S.E.M. ns, no significance, ** p<0.01, and *** P<0.001 by Student’s t-test.
Figure 4 with 3 supplements
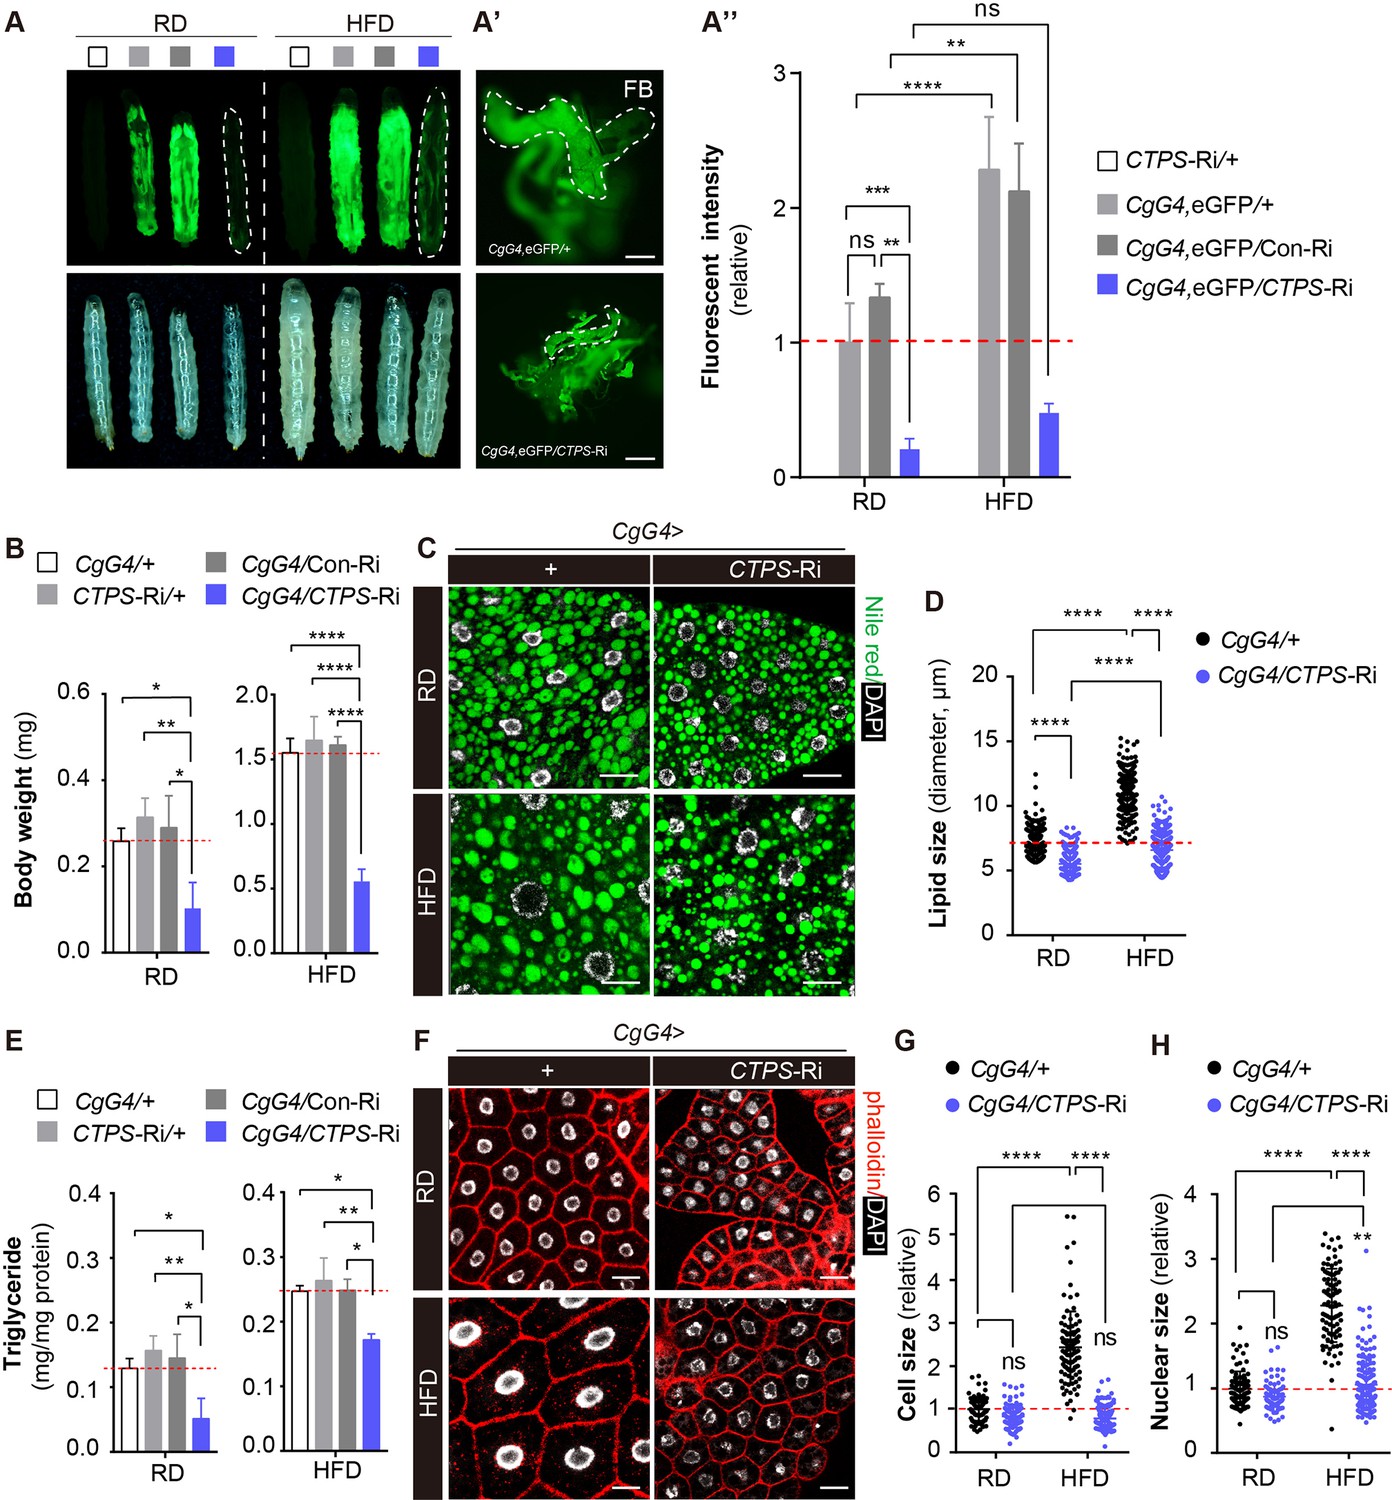
Knockdown of CTPS in adipocytes alleviates HFD-induced obesity.
(A) 76~80 hour AEL larvae expressing eGFP (green) with CgG4 driving CTPS knockdown in the fat body and the wild-type control were fed with RD or HFD (eGFP fluorescent image top, bright-field image bottom). Dashed lines denote the extent of the larval bodies. (A’) Photographs of newly dissected larval fat bodies (FB) (green, eGFP-labelling). Scale bars, 500 μm. (A’’) Quantification of eGFP intensity from (A). The values are normalized to the control line CgG4, eGFP>+ (5 images/genotype; 3 biological replicates). (B) The body weight of the 76~80 hour AEL larvae under RD and HFD conditions: CgG4>CTPS-Ri larvae are compared with CgG4>+, CTPS-Ri/+, and CgG4>Con-Ri larvae (10–30 larvae/group; 5–6 groups/genotype; 3 biological replicates). (C) Lipid droplets from 76~80 hour AEL larvae fed RD and HFD or HFD were analyzed by confocal microscopy. Lipid droplets were stained with Nile red (green), and nuclei were stained with DAPI (white). Scale bars, 20 μm. (D) Quantitative analyses of lipid droplet size from (F) (10 images/genotype; 3 biological replicates). (E) TAG level of 80 hour AEL larvae from CgG4>CTPS-Ri and CgG4 >+ lines under RD and HFD conditions. TAG level is normalized to total protein level (10 larvae/group; 3–4 groups/genotype; 2 biological replicates). (F) Confocal images of fat bodies from 76~80 hour AEL larvae under RD and HFD conditions. Phalloidin (red) is used to reveal cell outline and DAPI (white) is used to reveal the nuclei in fat bodies. Scale bars, 20 μm. (G) Quantification of cell size from (F) (10 images/genotype; 3 biological replicates). (H) Quantification of nuclear size from (F) (10 images/genotype; 3 biological replicates). Data are shown as mean ± S.E.M. ns, no significance, * P<0.05, ** P<0.01, and **** P<0.0001 by one-way ANOVA or two-way ANOVA with a Tukey post hoc test.
Figure 4—figure supplement 1

Quantitative RT-PCR analysis.
(A) Quantitative RT-PCR analysis of eGFP mRNA abundance in the fat body or whole body of 3rd instar wandering larvae fed HFD (30 larvae/group; 3 groups/genotype; 2 biological replicates). All data are shown as mean ± S.E.M. ns, not significant and **** P<0.0001 by two-way ANOVA with a Tukey post hoc test.
Figure 4—figure supplement 2
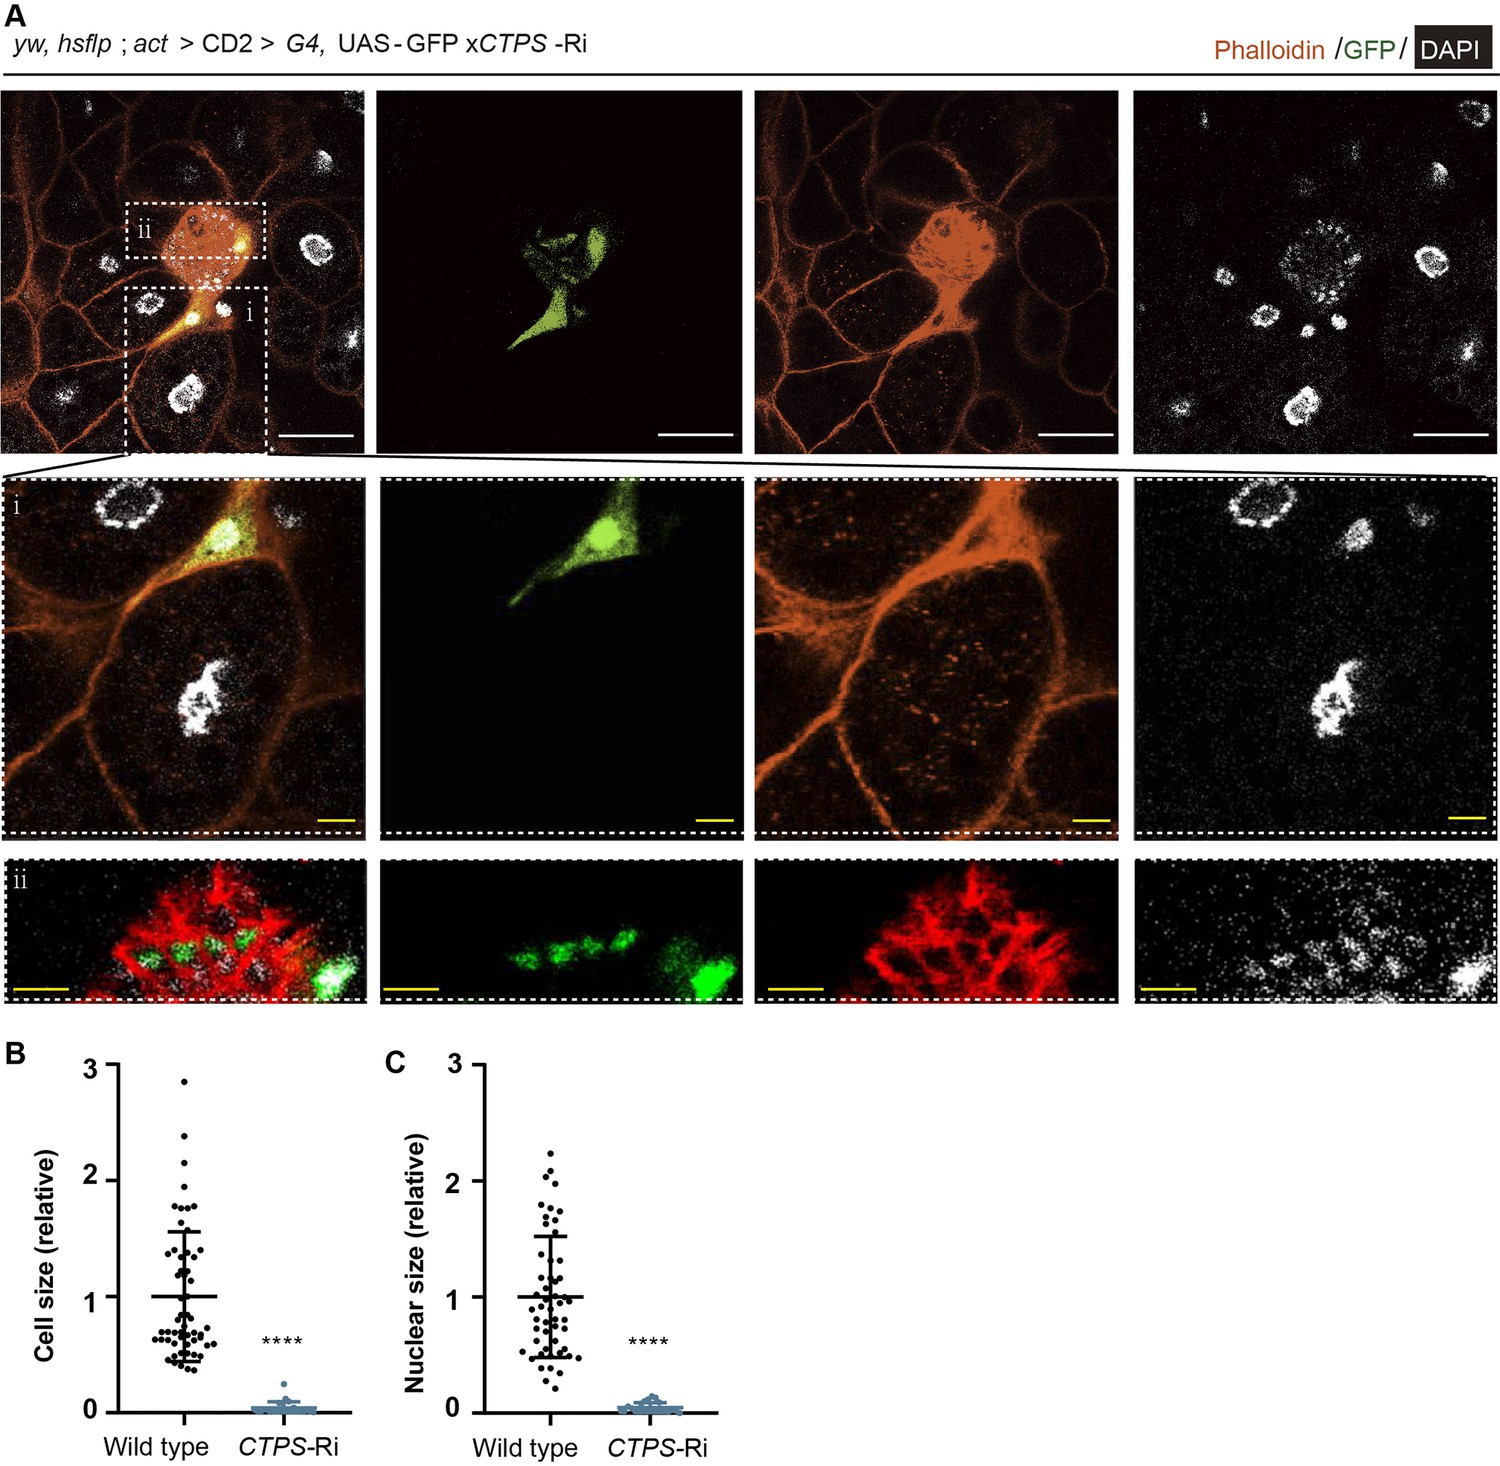
CTPS is required for adipocyte growth.
(A) Representative confocal images of fat bodies showing clones of adipocytes with CTPS knockdown (green) from a 3rd instar larva (2 biological replicates). The areas in white dotted boxes are magnified in the lower panels (i and ii). Scale bar, 30 µm (white), 10 µm (yellow). (B–C) Quantification of cell size (B) and nuclear size (C) from (A). Values are normalized to the wild-type clones (10 images/genotype; 2 biological replicates).
Figure 4—figure supplement 3
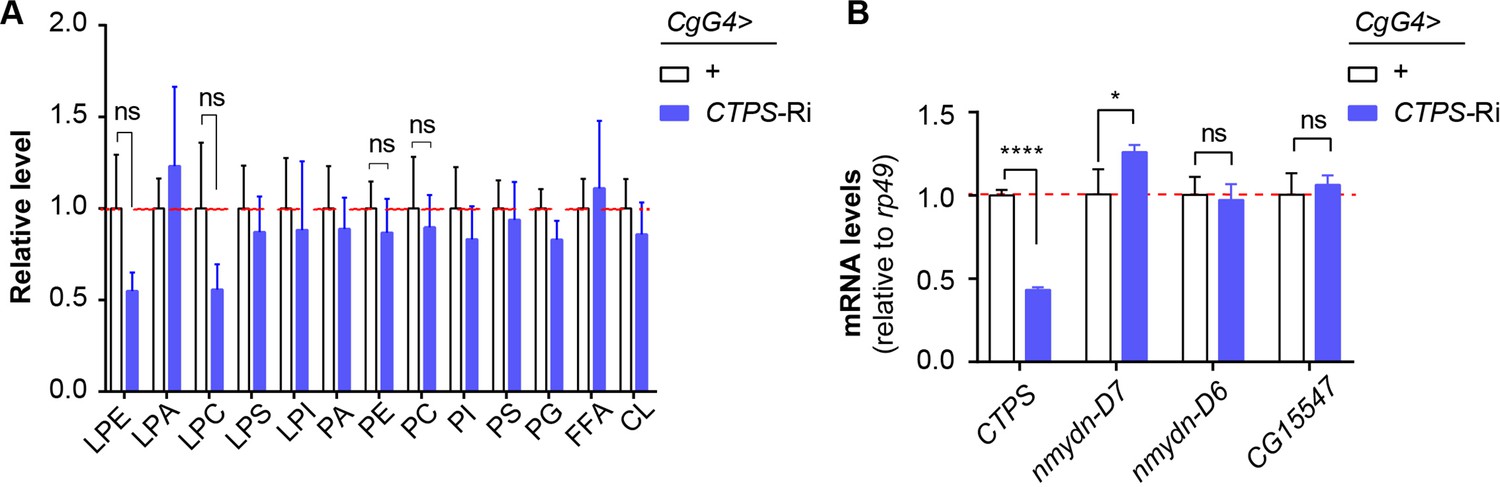
The effects of CTPS on phospholipid composition and the expression of nucleotide diphosphate kinases.
(A) Relative level of phospholipid in the fat bodies of 76~80 hour AEL larvae. LPE, lysophophatidylethanolamine; LPA, lysophophatidic acid; LPC, lysophosphatidylcholine; LPS, lysophosphatidylserine; LPI, phosphatidylinositol; PA, phosphatidic acid; PE, phophatidylethanolamine; PC, phosphatidylcholine; PI, phosphatidylinositol; PS, phosphatidylserine; PG, phosphatidylglycerol; FFA, free fatty acid; CL, cardiolipin. All values are normalized to the control. (B) Quantitative RT-PCR analysis of CTPS, nmydn-D6, nmydn-D7, and CG15547 mRNA abundance in fat body lysates of 76~80 hour AEL larvae (30 larvae/group; 4 groups/genotype; 2 biological replicates). All data are shown as mean ± S.E.M. ns, not significant, * P<0.05, and **** P<0.0001 by two-way ANOVA with a Tukey post hoc test.
Figure 5 with 3 supplements
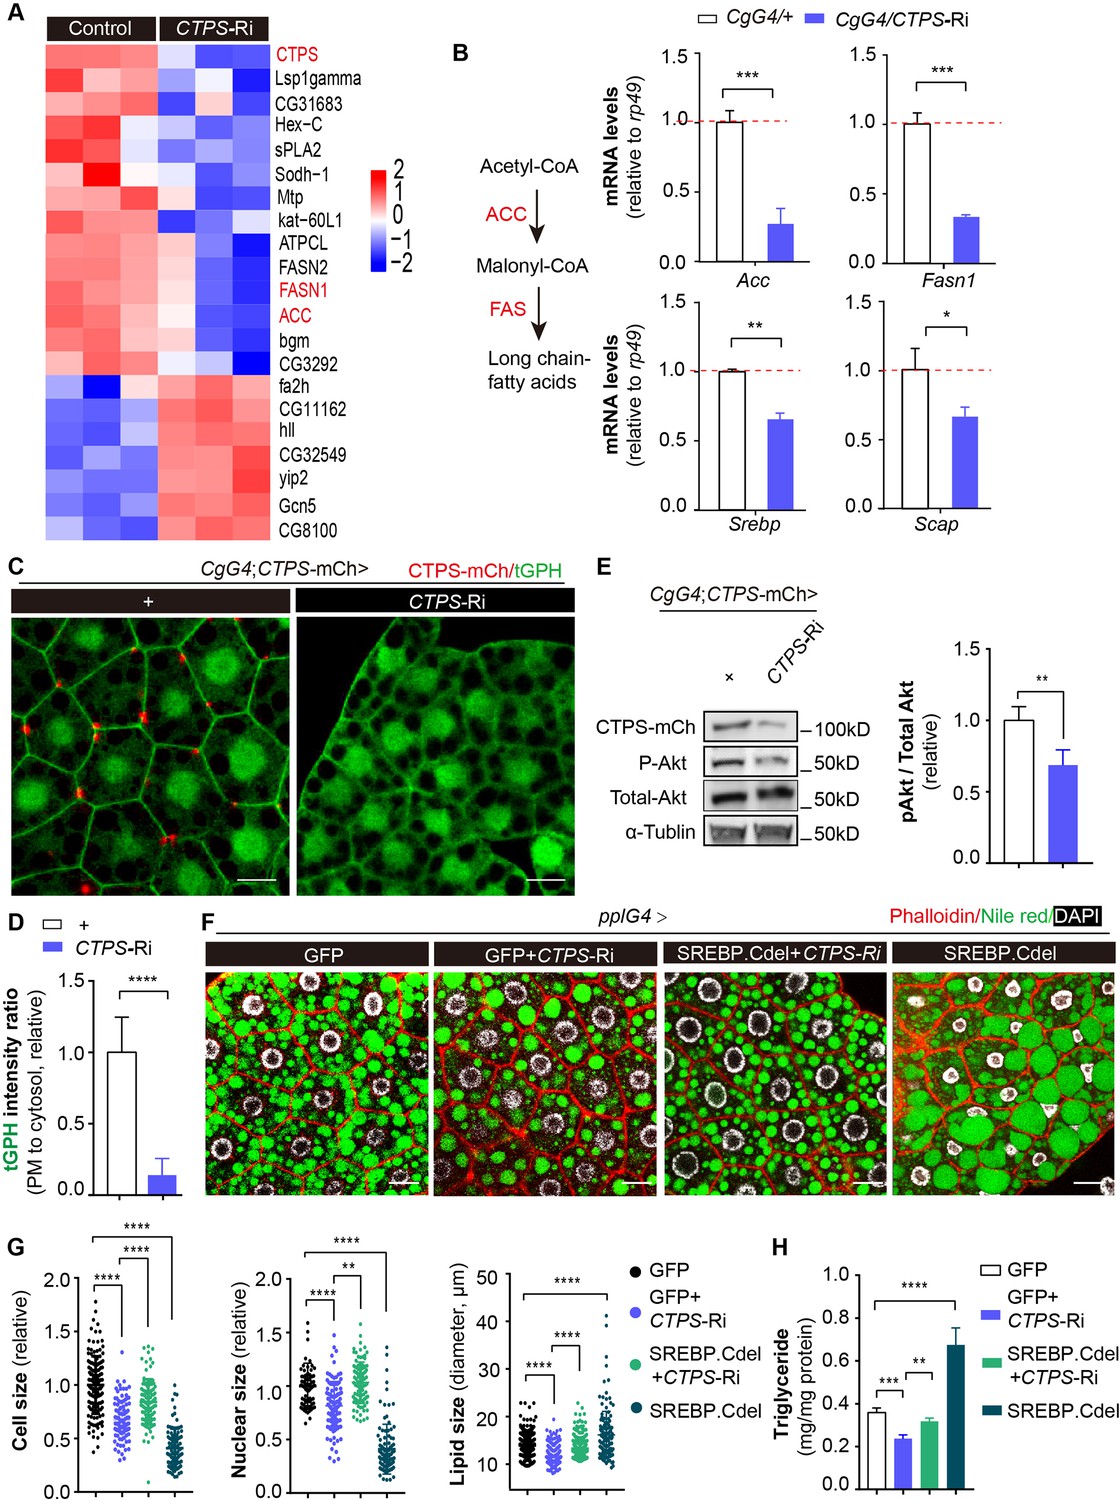
Fat-body-specific knockdown of CTPS reduces lipogenic gene expression.
(A) The fat bodies of 2nd instar larvae from CgG4>CTPS-Ri and CgG4>+ larvae were analyzed by RNA-seq analysis. A heat map of relative gene expression, obtained using RNA-seq data, is depicted for transcripts encoding central enzymes in lipid metabolism from control (left) and CTPS knockdown (right) larvae. (B) Quantitative RT-PCR analysis of the mRNA abundance of Acc, Fasn1, Srebp, and Scap in fat body lysates from 76~80 hour AEL CgG4>CTPS-Ri and CgG4>+ larvae (30 larvae/group; 5–6 groups/genotype; 3 biological replicates). The long-chain fatty acid synthesis pathway is shown in the left panel. (C) Representative confocal images of PI3K activation in the fat bodies of 76~80 hour AEL larvae. The membrane location of tGPH (green) shows the activity of PI3K. Scale bars, 10 μm. (D) tGPH intensity ratio of the cell membrane to the cytosol from (C). The value is normalized to the control (10 images/genotype; 3 biological replicates). (E) Western blot analysis of phosphorylated Akt from fat body lysates. Anti-mCh, anti-phosphorylated-Akt, and anti-total-Akt antibodies were used for the immunoblotting analysis. Alpha-tubulin was used as an internal control. The P-Akt to total-Akt ratio is shown (right panel). The value is normalized to the CgG4;CTPS-mCh>+ control line (3 biological replicates). (F) Representative confocal images of 96~100 hour AEL larval fat bodies. Fat bodies are stained with phalloidin (red) to reveal the cell outline, Nile red (green) to reveal lipid droplets, and DAPI (white) to reveal nuclei. Scale bars, 30 μm. (G) Quantification of cell size, nuclear size and lipid droplet size from (F). Cell and nuclear sizes are normalized to the pplG4>GFP control line (10 images/genotype; 3 biological replicates). (H) TAG concentration in 96~100 hour AEL larvae under HFD conditions. TAG level is normalized to total protein level (6 larvae/group; 5–6 groups/genotype; 2 biological replicates). All data are shown as mean ± S.E.M. * P<0.05, ** P<0.01, *** P<0.001, and **** P<0.0001 by Student’s t-test or one-way ANOVA with a Tukey post hoc test.
-
Figure 5—source data 1
List of the differentially expressed genes in the heatmap.
Differentially expressed genes were identified on the basis of fold change values (gene expression level in the CgG4>CTPS-Ri relative to that in the CgG4>+ control line, ≥2.0-fold change, Student’s t-test, P<0.05).
- https://cdn.elifesciences.org/articles/85293/elife-85293-fig5-data1-v1.xls
-
Figure 5—source data 2
Uncropped gel of phosphorylated Akt from fat body lysates.
Anti-mCh, anti-phosphorylated-Akt, and anti-total-Akt antibodies were used for the immunoblotting analysis. Alpha-tubulin was used as an internal control.
- https://cdn.elifesciences.org/articles/85293/elife-85293-fig5-data2-v1.zip
Figure 5—figure supplement 1
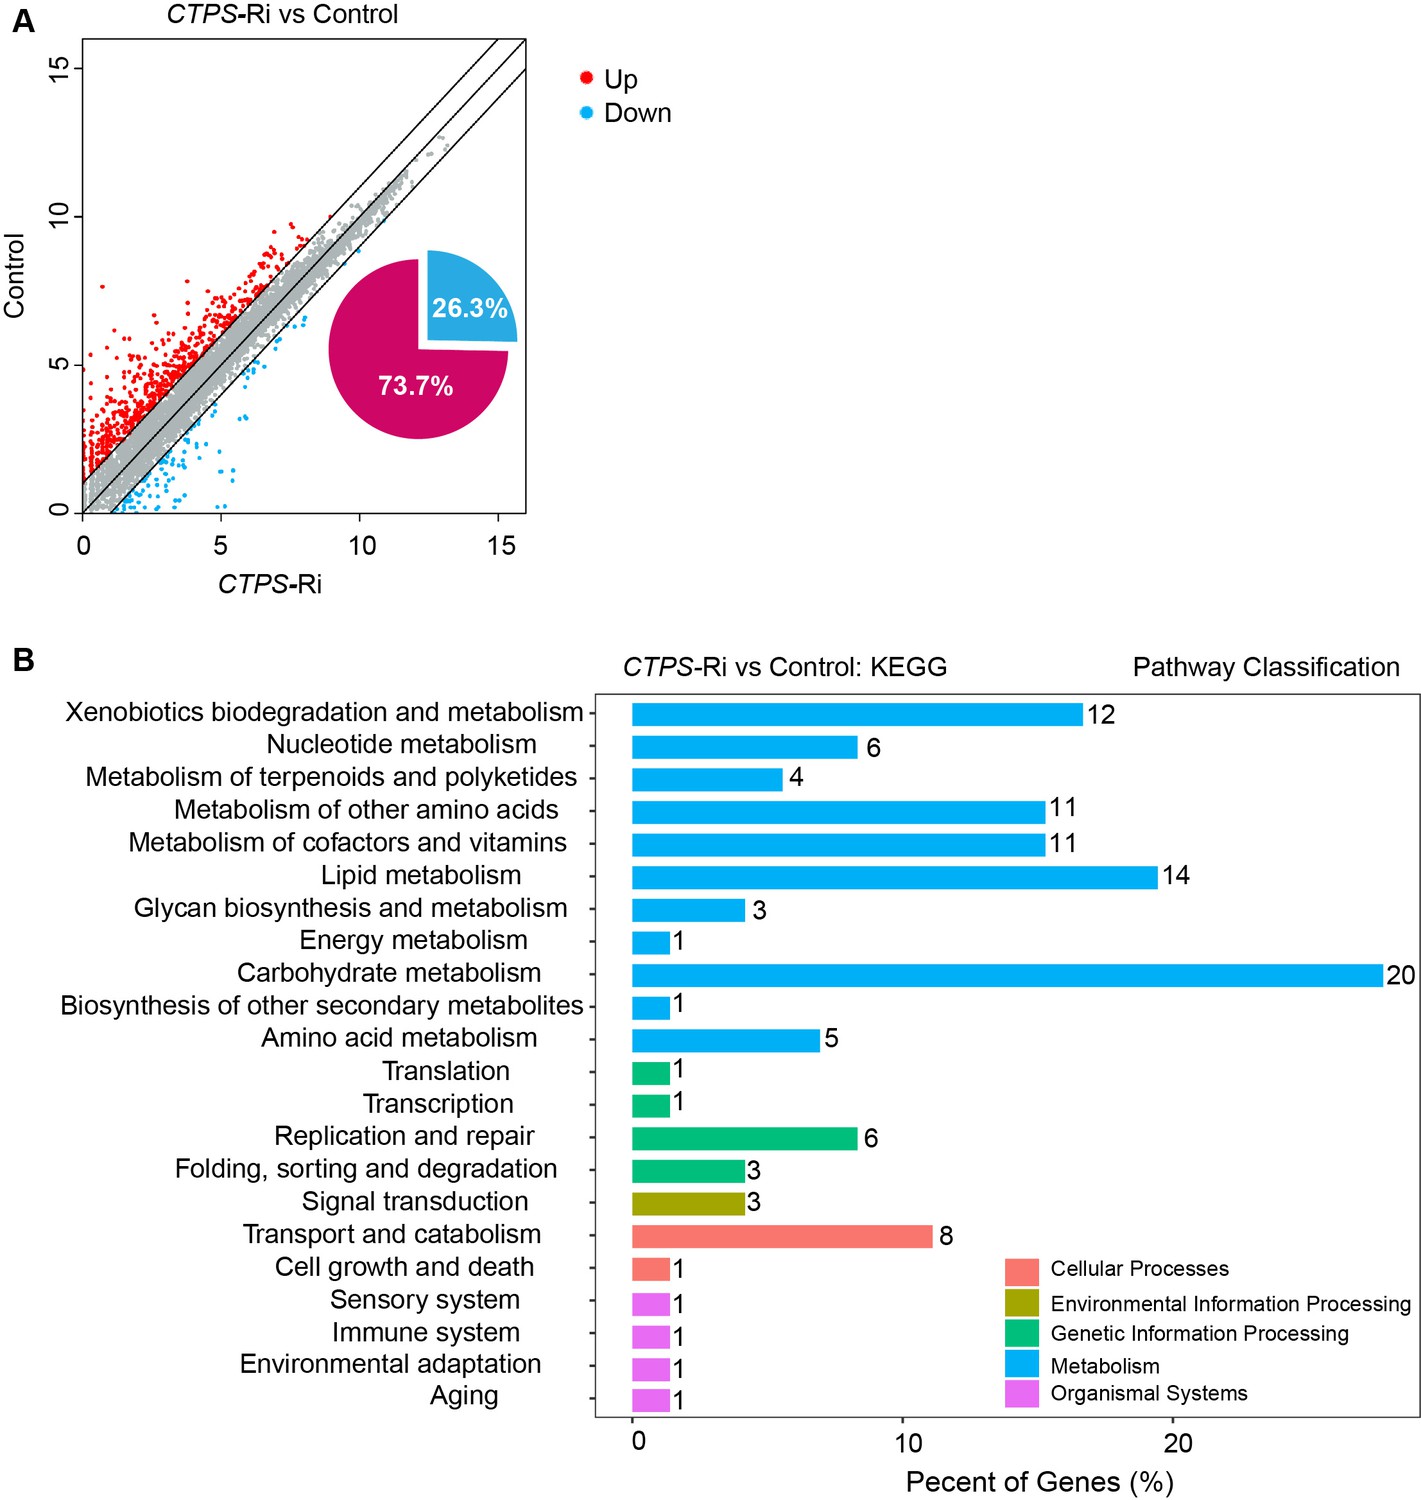
KEGG functional classification of the genes that are affected by CTPS knockdown.
(A) Scatter plot comparing transcript abundance between the CTPS knockdown larvae and the control. Differentially expressed genes were identified on the basis of the fold change values (gene expression level in CgG4>CTPS-Ri larvae relative to that in the CgG4>+ control line, ≥2.0-fold change, Student’s t-test, P<0.05). Each dot represents a protein-encoding gen. (B) Numbers of genes belonging to distinct functional groups that are up- or downregulated in the CgG4>CTPS-Ri line relative to the CgG4>+ control line. Gene functions are predicted on the basis of the KEGG database.
-
Figure 5—figure supplement 1—source data 1
List of baseMean values for the CgG4>CTPS-Ri line relative to the CgG4>+ control line.
- https://cdn.elifesciences.org/articles/85293/elife-85293-fig5-figsupp1-data1-v1.xls
-
Figure 5—figure supplement 1—source data 2
Numbers of genes belonging to distinct functional groups that are up- or downregulated in the CgG4>CTPS-Ri line relative to the CgG4>+ control line.
Gene functions are predicted on the basis of the KEGG database.
- https://cdn.elifesciences.org/articles/85293/elife-85293-fig5-figsupp1-data2-v1.xls
Figure 5—figure supplement 2
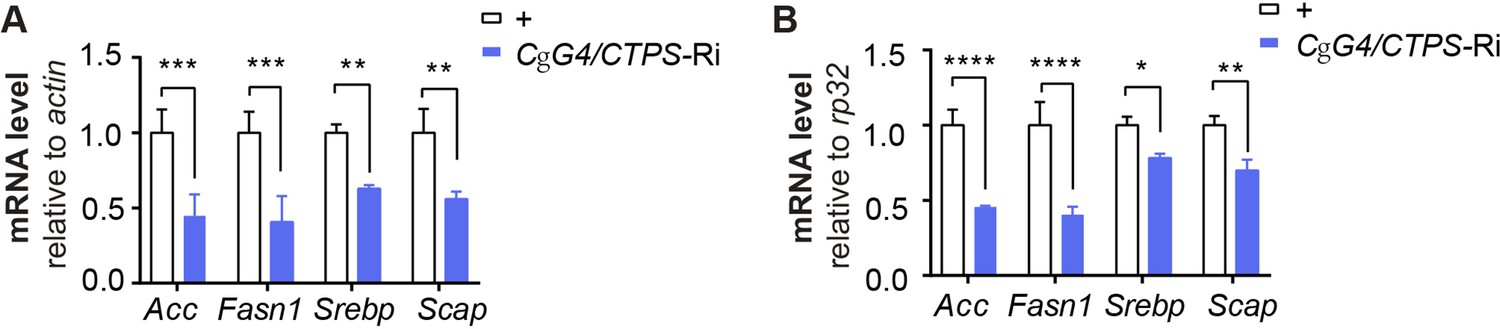
Quantitative RT-PCR analysis.
(A–B) Quantitative RT-PCR analysis of acc and fasn1 mRNA abundance in the fat body lysates of 76~80 hour AEL larvae (30 larvae/group; 4 groups/genotype; 2 biological replicates). Actin5c (A) and rp32 (B) are used as endogenous controls. All data are shown as mean ± S.E.M. * P<0.05, ** P<0.01, *** P<0.001, and **** P<0.0001 by two-way ANOVA with a Tukey post hoc test.
Figure 5—figure supplement 3

Quantitative RT-PCR analysis.
(A) Quantitative RT-PCR analysis of Pi3K mRNA abundance in the fat body lysates of 76~80 hour AEL larvae (30 larvae/group; 3 groups/genotype; 2 biological replicates). All data are shown as mean ± S.E.M. ns, not significant and * P<0.05 by two-way ANOVA with a Tukey post hoc test.
Figure 6 with 2 supplements

Disrupting the filament-forming property of CTPS alleviates HFD-induced obesity.
(A) Representative photograph of HFD-fed 76~80 hour AEL larvae showing larval morphology. The CgG4> CTPSMU OE line is compared with CgG4>+, CgG4>GFP, CgG4>CTPSWT-OE, CTPSWT-OE/+, and CTPSMU-OE/+ lines. (B) Body weights of 76~80 hour AEL larvae (30 larvae/group; 5–6 groups/genotype; 3 biological replicates). The CgG4>CTPSWT-OE line is compared with CTPSWT-OE/+, CTPSWT-OE/+, CgG4>GFP, and CgG4>+ lines. The CgG4>CTPSMU-OE line is compared with CgG4>+, CgG4>GFP, and CTPSMU-OE/+ lines. (C) TAG concentrations in 76~80 hour AEL larvae. TAG concentrations are normalized to total protein concentration (10 larvae/group; 5–6 groups/genotype; 2 biological replicates). (D) Representative confocal images of fat bodies from HFD-fed 76~80 hour AEL larvae. Fat bodies are stained with phalloidin (red) to reveal the cell outline, BODIPY493/503 (green) to reveal lipid droplets, and DAPI (white) to reveal nuclei. The fly lines are CgG4; CTPS-mCh >+CgG4;CTPS-mCh >CTPSWT-OE, and CgG4;CTPS-mCh >CTPSMU -OE. Scale bars, 30 μm. (E) Quantification of cell size, nuclear size, and lipid droplet size from (D). Values are normalized to the control line CgG4;CTPS-mCh>+ (10 images/genotype; 3 biological replicates). (F) Representative confocal images of PI3K activation in the fat bodies of 3rd instar larvae. The membrane location of tGPH (green) shows the activity of PI3K. Scale bars, 10 μm. (G) tGPH intensity ratio of the cell membrane relative to the cytosol from the images in (F). The values are normalized to the control (10–15 images/genotype; 3 biological replicates). (H) Western blot analysis of phosphorylated Akt from fat body lysates. Anti-mCh, anti-phosphorylated-Akt, and anti-total-Akt antibodies were used for the immunoblotting analysis. Alpha-tubulin was used as an internal control. The P-Akt to total-Akt ratio is shown in the right panel. The values are normalized to the control line CgG4;CTPS-mCh>GFP (3 biological replicates). (I) Quantitative RT-PCR analysis of acc and fasn1 mRNA abundances in the fat body lysates of 76~80 hour AEL larvae (30 larvae/group; 4 groups/genotype; 2 biological replicates). All data are shown as mean ± S.E.M. ns, not significant, * P<0.05, ** P<0.01, *** P<0.001, and **** P<0.0001 by Student’s t-test or one-way ANOVA with a Tukey post hoc test.
-
Figure 6—source data 1
Uncropped gel of phosphorylated Akt from fat body lysates.
Anti-mCh, anti-phosphorylated-Akt, and anti-total-Akt antibodies were used for the immunoblotting analysis. Alpha-tubulin was used as an internal control.
- https://cdn.elifesciences.org/articles/85293/elife-85293-fig6-data1-v1.zip
Figure 6—figure supplement 1

Quantitative RT-PCR analysis.
(A) Quantitative RT-PCR analysis of CTPS mRNA abundance in the fat body lysates of 76~80 hour AEL larvae (30 larvae/group; 3 groups/genotype; 2 biological replicates). All data are shown as mean ± S.E.M. ns, not significant, * P<0.05, and ** P<0.01 by one-way ANOVA with a Tukey post hoc test.
Figure 6—figure supplement 2

Quantitative RT-PCR analysis.
(A) Quantitative RT-PCR analysis of acc and Fasn1 mRNA abundance in the fat body lysates of 76~80 hour AEL larvae (30 larvae/group; 3 groups/genotype; 2 biological replicates). All data are shown as mean ± S.E.M. ns, not significant, * P<0.05, and *** P<0.001 by two-way ANOVA with a Tukey post hoc test.
Author response image 1

Quantitative RT-PCR analysis (A) Quantitative RT-PCR analysis of rp49 and GAPDH mRNA abundance in the fat body lysates of the third instar larvae from the indicated genotypes (30 larvae/genotype; 3 groups/genotype, 3 biological replicates).
All data are shown as mean ± S.E.M. ns, no significance, ** P < 0.01, by two-way ANOVA with a Tukey post hoc test.
Author response image 2

Egg hatchability.
(A-C) Egg hatching rate in the indicative lines under HFD condition (n=100 embryos/group, 3 groups/genotype, 2 biological replicates). All data are shown as mean ± S.E.M. ns, no significance by one-way ANOVA with a Tukey post hoc test.
Author response image 3

CgG4 in combination with UAS-eGFP indicates fat mass.
In comparison to the wild-type control, the third instar wandering larvae that were alive and expressed eGFP (green) exhibited either Akt or Myc knockdown in the fat body with CgG4 driving. The dashed lines represent the extent of the larval bodies. The quantification of eGFP intensity is presented on the right panel, and the value is normalized to the control line CgG4, eGFP>+ (5 images/genotype, 3 biological replicates). The data are presented as mean ± S.E.M. No significance was observed (ns), and the statistical analysis showed **** P < 0.0001 by using a two-way ANOVA with a Tukey post hoc test.
Additional files
Download links
A two-part list of links to download the article, or parts of the article, in various formats.
Downloads (link to download the article as PDF)
Open citations (links to open the citations from this article in various online reference manager services)
Cite this article (links to download the citations from this article in formats compatible with various reference manager tools)
Fat body-specific reduction of CTPS alleviates HFD-induced obesity
eLife 12:e85293.
https://doi.org/10.7554/eLife.85293


