Promoting axon regeneration by inhibiting RNA N6-methyladenosine demethylase ALKBH5
- Key Laboratory of Neuroregeneration of Jiangsu and Ministry of Education, NMPA Key Laboratory for Research and Evaluation of Tissue Engineering Technology Products, Co-innovation Center of Neuroregeneration, Nantong University, China
- Jiangsu Key Laboratory of Neuropsychiatric Diseases and Institute of Neuroscience, Soochow University; Clinical Research Center of Neurological Disease, The Second Affiliated Hospital of Soochow University, China
Figures
Figure 1 with 1 supplement
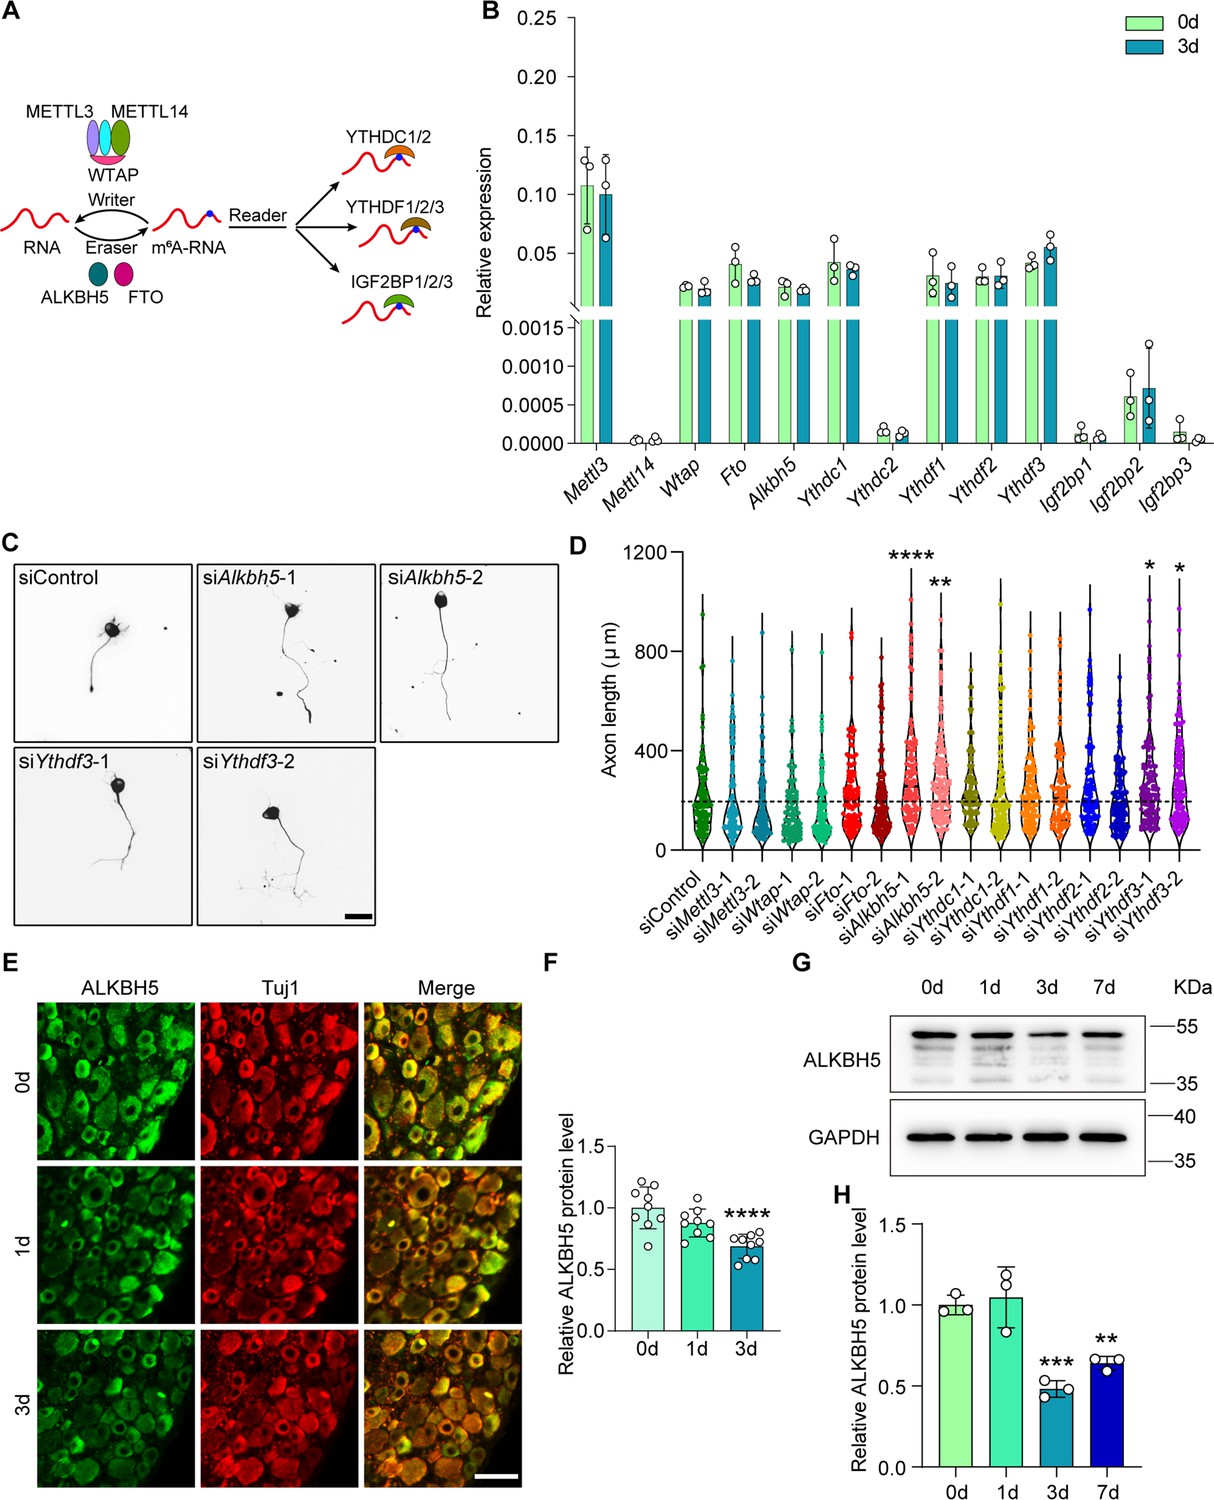
Reduced ALKBH5 in dorsal root ganglions (DRGs) enhances neurite outgrowth.
(A) Diagrammatic representation of for dynamic and reversible RNA m6A modification. The m6A modification can be added by ‘writers’ (METTL3/14, WTAP complex), demethylated by ‘erasers’ (FTO and ALKBH5), and regulated by ‘readers’ (YTHDC1, YTHDC2, YTHDF1, YTHDF2, YTHDF3, IGF2BP1, IGF2BP2, and IGF2BP3). (B) Quantification of mRNA expression by qRT-PCR screening of m6A modification-associated genes (Mettl3, Mettl14, Wtap, Fto, Alkbh5, Ythdc1, Ythdc2, Ythdf1, Ythdf2, Ythdf3, Igf2bp1, Igf2bp2, and Igf2bp3) in adult rat L4-5 DRGs at day 3 following sciatic nerve crush (SNC). Gapdh was used as the internal control; n = 3 biologically independent experiments. (C) Representative images of replated neurons from siControl, siAlkbh5-1 or 2, and siYthdf3-1 or 2 groups. DRG neurons were dissociated and transfected with the siControl, siAlkbh5-1 or 2, and siYthdf3-1 or 2 for 2 d, and were replated and fixed after 16–18 hr. DRG neurites were visualized using Tuj1 staining. Scale bar: 50 μm. (D) Quantification of the axon length by RNA interference (RNAi)-mediated functional screening of the most abundant genes in (B) in adult DRG neurons; the quantification data were from 3 biologically independent experiments for each group, approximately 100 neurons per group were quantified on average. One-way ANOVA followed by Dunnett′s test, *p<0.05, **p<0.01, ****p<0.0001. Validation of the interfering efficiency for the indicated m6A-related gene is shown in Figure 1—figure supplement 1A–D. (E) DRG sections (18 μm) from adult rat L4-5 DRGs on days 0, 1, and 3 following sciatic nerve injury with Tuj1 and ALKBH5 staining; red for Tuj1 and green for the ALKBH5; scale bar: 50 μm. (F) Quantification of relative fluorescence intensity of ALKBH5 staining in DRG sections. One-way ANOVA followed by Dunnett′s test, n = 9 (section) from three biologically independent experiments, ****p<0.0001. The distribution of the ALKBH5 in different DRG neurons is shown in Figure 1—figure supplement 1E and F. (G) ALKBH5 protein expression level by western blot. Protein extracts isolated from the adult rat L4-5 DRGs at days 0, 1, 3, and 7 following SNC were subjected to western blot for ALKBH5 expression. GAPDH was used as the loading control. (H) Quantitative data in (G). One-way ANOVA followed by Dunnett′s test, n = 3 biologically independent experiments, **p<0.01, ***p<0.001.
-
Figure 1—source data 1
The data underlying all the graphs shown in Figure 1.
- https://cdn.elifesciences.org/articles/85309/elife-85309-fig1-data1-v2.xlsx
-
Figure 1—source data 2
The data underlying all the graphs shown in Figure 1—figure supplement 1.
- https://cdn.elifesciences.org/articles/85309/elife-85309-fig1-data2-v2.xlsx
-
Figure 1—source data 3
Source files for ALKBH5 western graphs.
- https://cdn.elifesciences.org/articles/85309/elife-85309-fig1-data3-v2.zip
Figure 1—figure supplement 1
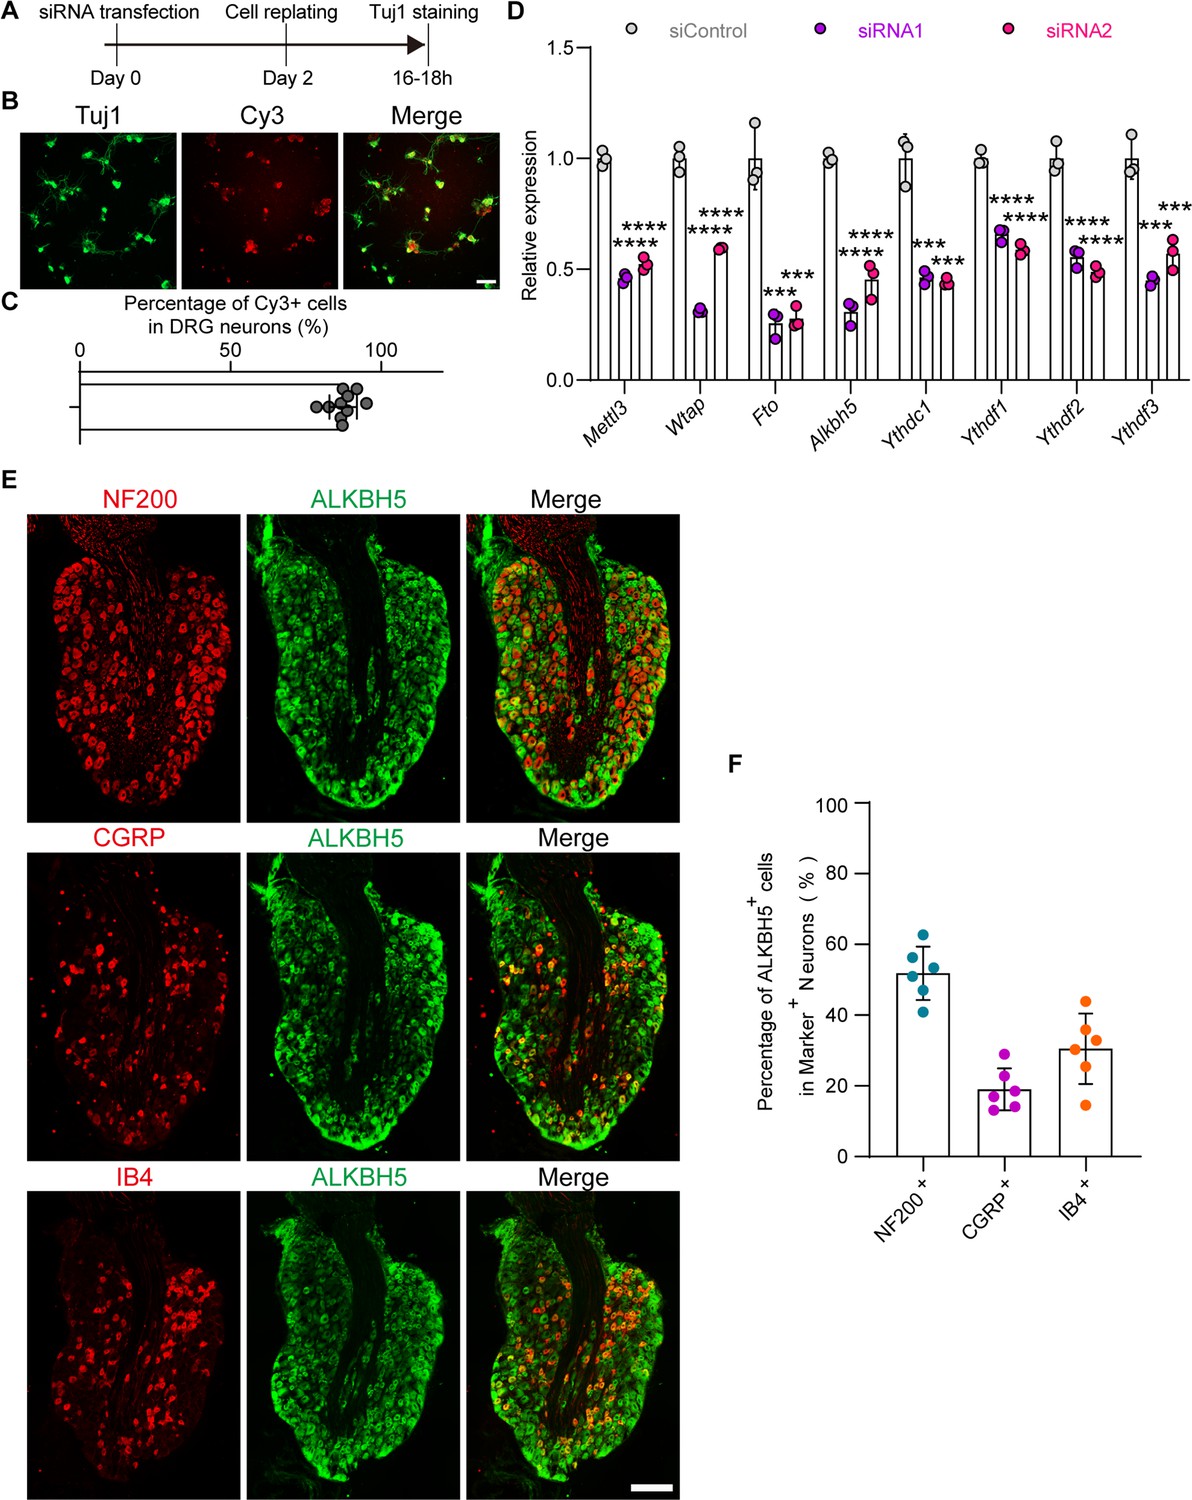
Validation of the interfering efficiency for the indicated m6A-related gene and the distribution of the ALKBH5 in different dorsal root ganglion (DRG) neurons.
(A) Experimental setup. Mature DRG neurons were transfected with the control or target siRNA for 2 d, and axon staining was conducted 16–18 hr after cell replating. (B) Examination of the siRNA transfection efficiency in DRG neurons. DRG neurons were transfected with the Cy3-labeled siRNA for 2 d, then stained with Tuj1 antibody. Scale bar: 50 μm. (C) Quantification of the percentage of Cy3-positive DRG neurons in Figure 1—figure supplement 1 (B). (D) Quantification of mRNA expression by qRT-PCR validating the knockdown efficiency of the m6A modification-associated genes (Mettl3, Wtap, Fto, Alkbh5, Ythdc1, Ythdf1, Ythdf2, Ythdf3) in DRG neurons on day 2 following transfection with control or target siRNA (two siRNA fragments for individual candidate gene). Gapdh was used as the internal control. One-way ANOVA followed by Dunnett′s test, n = 3 biologically independent experiments, ***p<0.001, ****p<0.0001. (E) DRG Sections (18 μm) from intact adult rat L4-5 DRGs with ALKBH5 and NF200, calcitonin gene-related peptide (CGRP), or IB4 staining. Red for NF200, CGRP, or IB4; and green for ALKBH5; scale bar: 200 μm. (F) Percentage of ALKBH5-positive DRG neurons with NF200, CGRP, or IB4 in intact DRG sections, n = 6 (sections) from three biologically independent experiments.
Figure 2 with 1 supplement
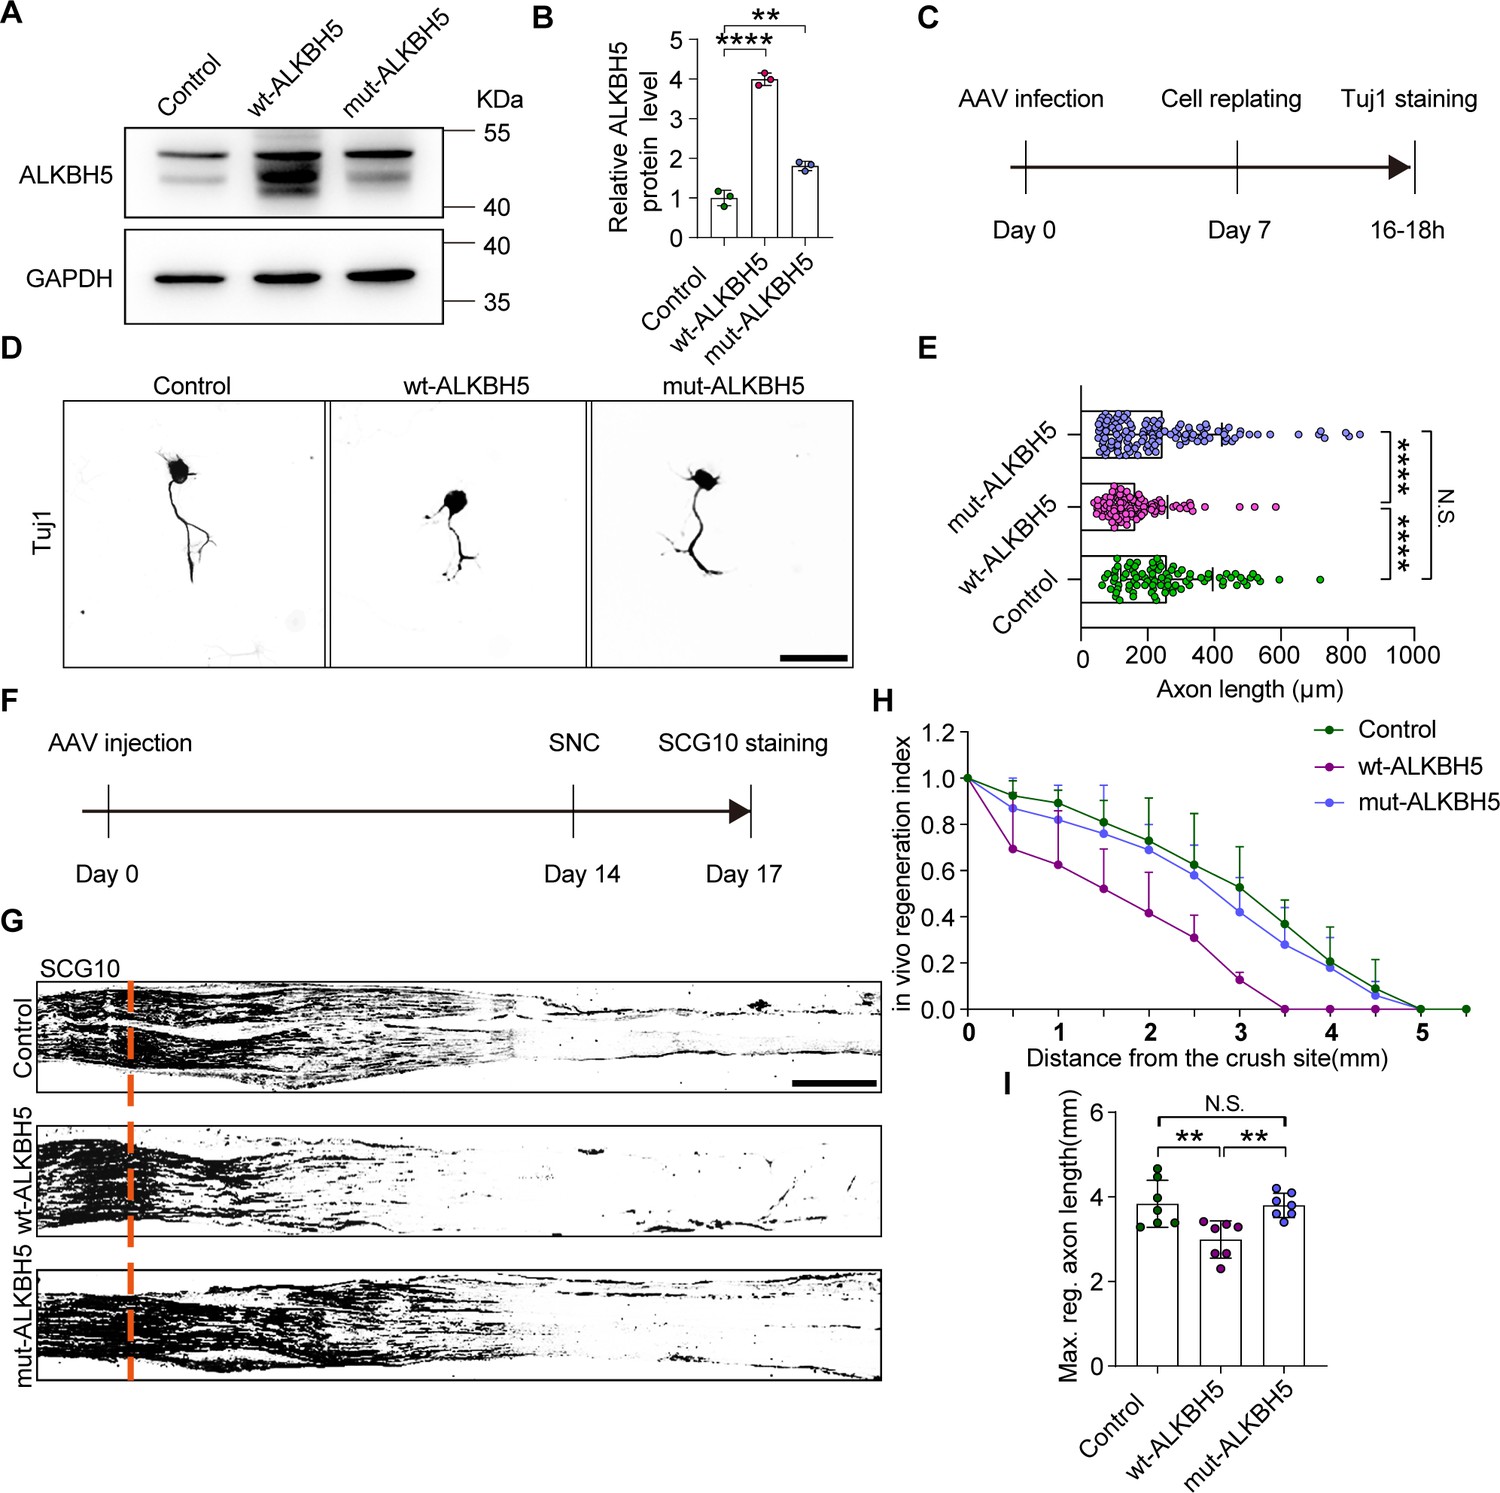
ALKBH5 inhibits axonal regeneration in an m6A-dependent manner.
(A) ALKBH5 protein expression by western blot. Protein extracts isolated from dissociated adult dorsal root ganglion (DRG) neurons infected with the EGFP (control), wild type ALKBH5 (wt-ALKBH5), and mutant ALKBH5 (mut-ALKBH5) adeno-associated viruses (AAVs) for 7 d were subjected to western blot for ALKBH5 expression. GAPDH was used as the loading control. (B) Quantitative data in (A). One-way ANOVA followed by Dunnett′s test, n = 3 biologically independent experiments, **p<0.01, ****p<0.0001. (C) Experimental setup. Mature DRG neurons were infected with the control, wt-ALKBH5, and mut-ALKBH5 AAVs for 7 d, before conducting axon staining at 16–18 hr following cell replating. (D) Representative images of replated DRG neurons from control, wt-ALKBH5, and mut-ALKBH5 groups with Tuj1 staining. Scale bar: 80 μm. (E) Quantification of the axon length in (D); the quantification data were from 3 biologically independent experiments for each group, approximately 100 neurons per group were quantified on average. One-way ANOVA followed by Tukey′s test, ****p<0.0001, N.S., not significant. (F) Timeline of the in vivo experiment. Adult rat DRGs were infected with the control, wt-ALKBH5, and mut-ALKBH5 AAVs by intrathecal injection for 14 d. The sciatic nerve was crushed and fixed 3 d after sciatic nerve crush (SNC). Regenerated axons were visualized using SCG10 staining. Infection efficiency of control, wt-ALKBH5, and mut-ALKBH5 AAV2/8 in DRG by intrathecal injection is shown in Figure 2—figure supplement 1A and B. (G) Sections of sciatic nerves from adult rats infected with the control, wt-ALKBH5, and mut-ALKBH5 AAVs at day 3 post-SNC. The regenerated axons were visualized using SCG10 staining. Scale bar: 500 μm. (H, I) Quantification of the regeneration index and the maximum length of the regenerated sciatic nerve axon in (G). One-way ANOVA followed by Tukey′s test, n = 7 rats per group, **p<0.01, N.S., not significant.
-
Figure 2—source data 1
The data underlying all the graphs shown in Figure 2.
- https://cdn.elifesciences.org/articles/85309/elife-85309-fig2-data1-v2.xlsx
-
Figure 2—source data 2
The data underlying all the graphs shown in Figure 2—figure supplement 1.
- https://cdn.elifesciences.org/articles/85309/elife-85309-fig2-data2-v2.xlsx
-
Figure 2—source data 3
Source files for ALKBH5 western graphs.
- https://cdn.elifesciences.org/articles/85309/elife-85309-fig2-data3-v2.zip
Figure 2—figure supplement 1
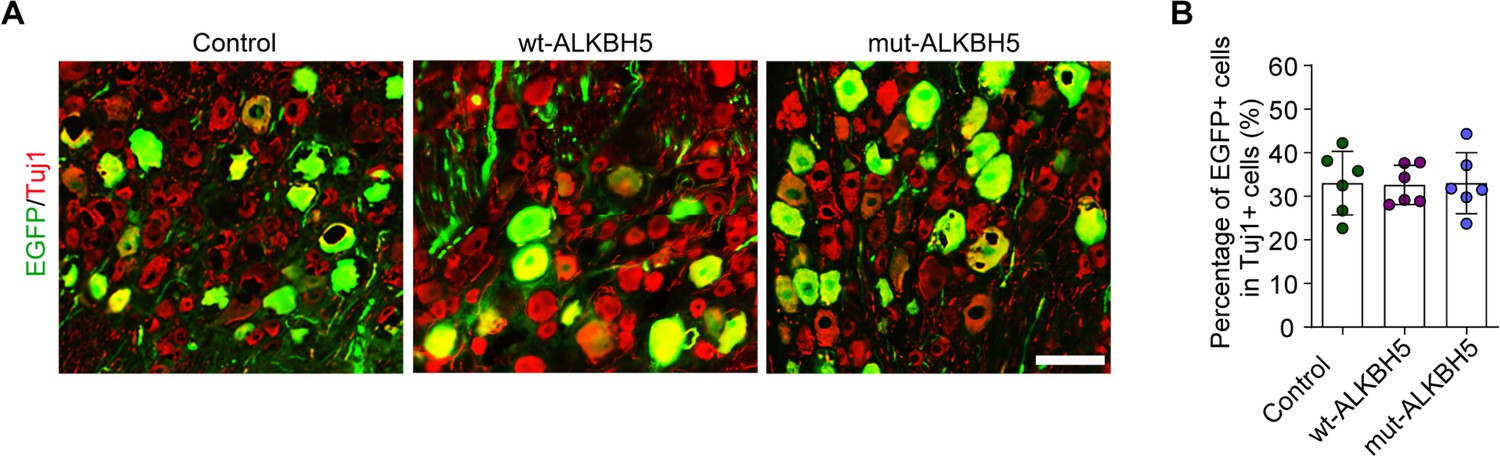
Infection efficiency of AAV2/8 in dorsal root ganglion (DRG) by intrathecal injection.
(A) DRG sections from rat after intrathecal injection of control, wt-ALKBH5, and mut-ALKBH5 adeno-associated viruses (AAVs) for 2 wk. The sections were stained for EGFP (green) and Tuj1 (red). Scale bar: 100 µm. (B) Percentage of EGFP-positive DRG neurons with Tuj1 in (A), n = 6 rats per group.
Figure 3 with 3 supplements
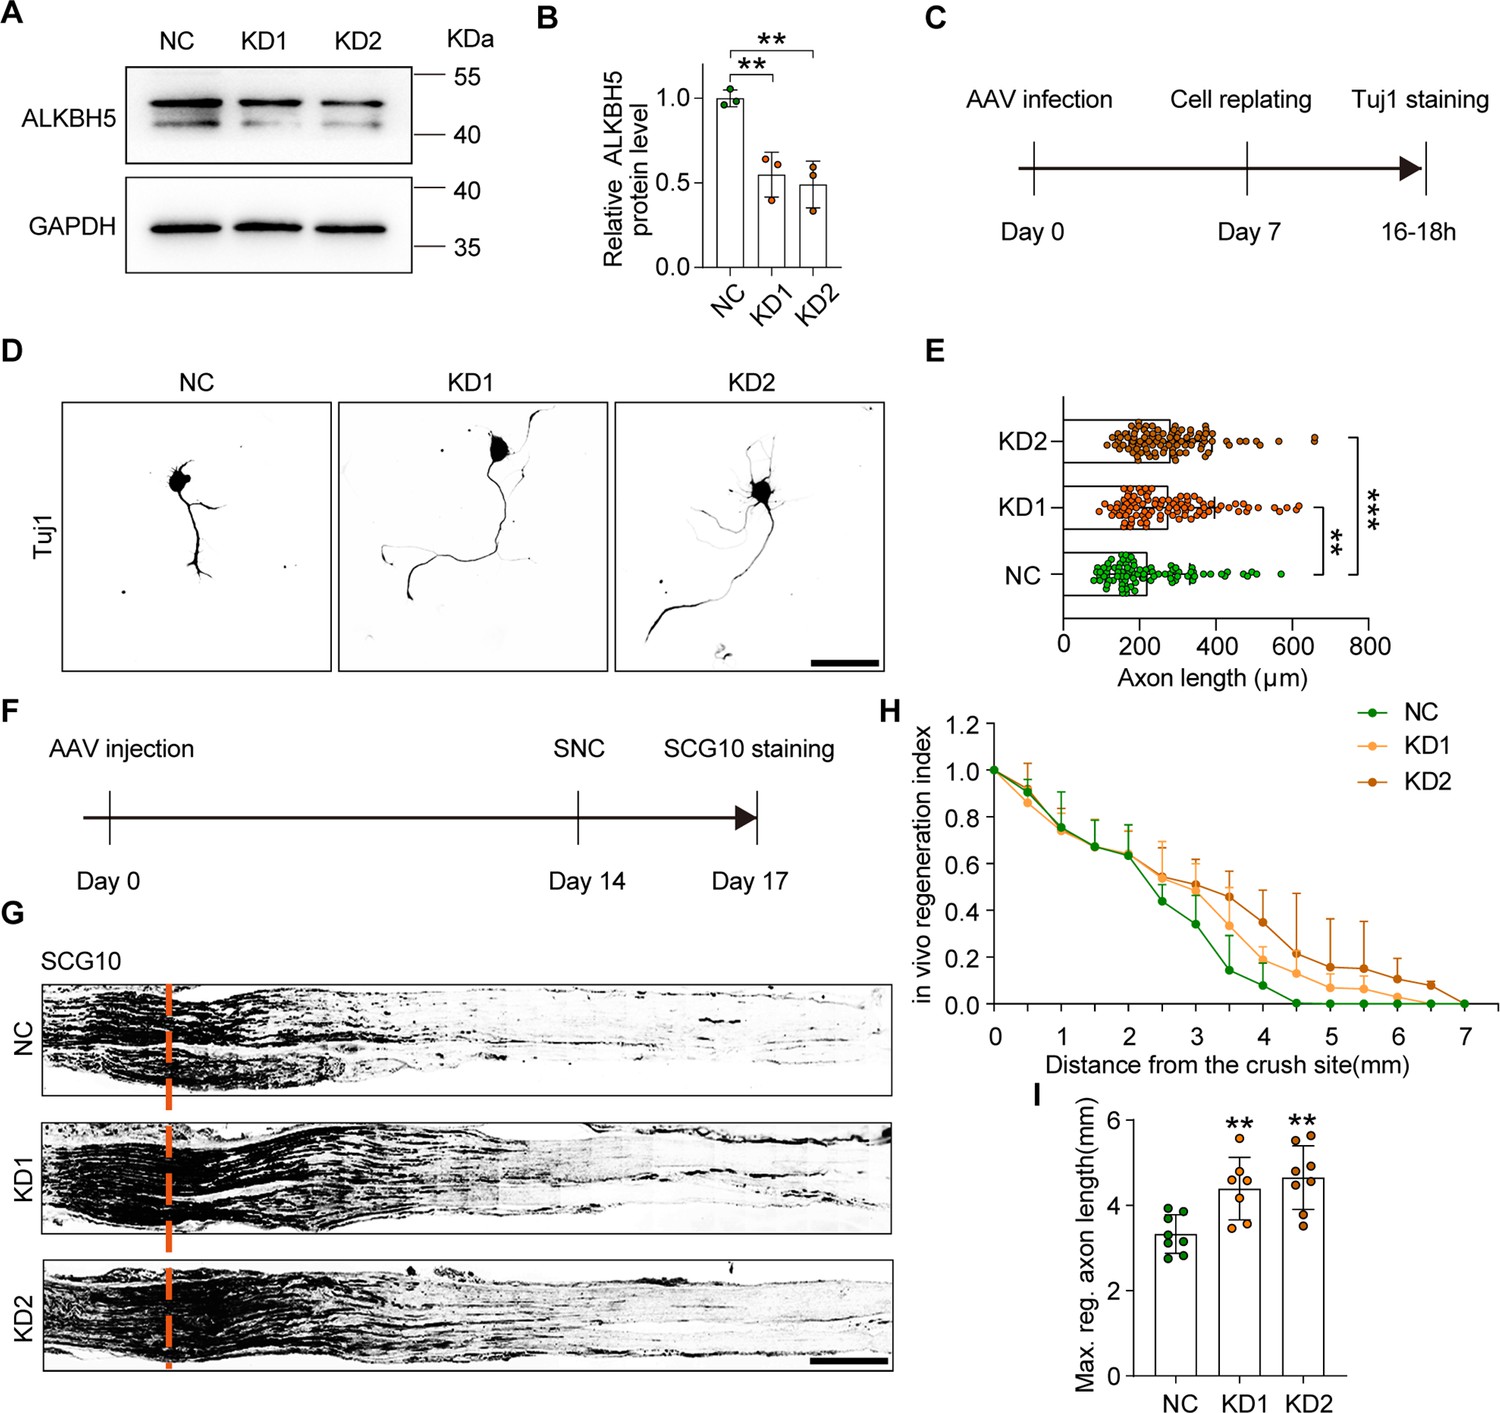
ALKBH5 deficiency promotes axon regeneration.
(A) ALKBH5 protein expression by western blot. Protein extracts isolated from dissociated adult dorsal root ganglion (DRG) neurons transfected with the shControl (NC), shAlkbh5-1 (KD1), and shAlkbh5-2 (KD2) adeno-associated viruses (AAVs) for 7 d were subjected to western blot for ALKBH5 expression. GAPDH was used as the loading control. (B) Quantitative data in (A). One-way ANOVA followed by Dunnett′s test, n = 3 biologically independent experiments, **p<0.01. (C) Experimental setup. Mature DRG neurons were infected with NC, KD1, and KD2 AAVs for 7 d. Axon staining was performed at 16–18 hr following cell replating. (D) Representative images of replated DRG neurons from NC, KD1, and KD2 groups with Tuj1 staining. Scale bar: 80 μm. (E) Quantification of the axon length in (D); the quantification data were from 3 biologically independent experiments for each group, approximately 100 neurons per group were quantified on average. One-way ANOVA followed by Dunnett′s test, **p<0.01, ***p<0.001. (F) Timeline of the in vivo experiment. Adult rat DRGs were infected with NC, KD1, and KD2 AAVs through intrathecal injection for 14 days. The sciatic nerve was crushed and fixed 3 days after sciatic nerve crush (SNC). Regenerated axons were visualized using SCG10 staining. Infection efficiency of NC, KD1, and KD2 AAV2/8 in DRG by intrathecal injection is shown in Figure 3—figure supplement 2A and B. (G) Sections of sciatic nerves from adult rats infected with NC, KD1, and KD2 AAVs at day 3 post SNC. Regenerated axons were visualized using SCG10 staining. Scale bar: 500 μm. (H, I) Quantification of the regeneration index and the maximum length of the regenerated sciatic nerve axon in (G). One-way ANOVA followed by Dunnett′s test, n = 7–8 rats per group, **p<0.01.
-
Figure 3—source data 1
The data underlying all the graphs shown in Figure 3.
- https://cdn.elifesciences.org/articles/85309/elife-85309-fig3-data1-v2.xlsx
-
Figure 3—source data 2
The data underlying all the graphs shown in Figure 3—figure supplements 1–3.
- https://cdn.elifesciences.org/articles/85309/elife-85309-fig3-data2-v2.xlsx
-
Figure 3—source data 3
Source files for ALKBH5 western graphs.
- https://cdn.elifesciences.org/articles/85309/elife-85309-fig3-data3-v2.zip
Figure 3—figure supplement 1
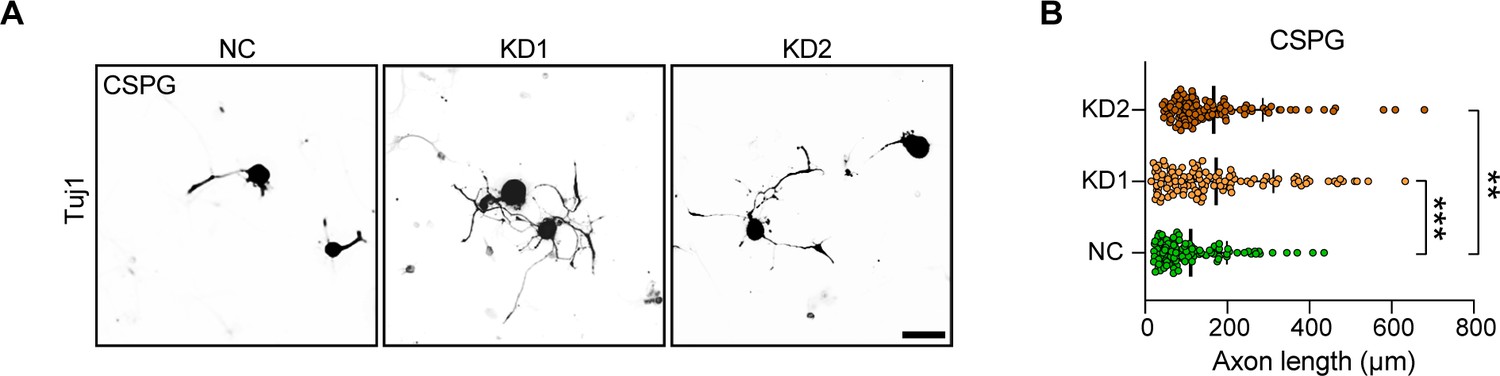
ALKBH5 knockdown promotes dorsal root ganglion (DRG) neurite outgrowth in the present of chondroitin sulfate proteoglycan (CSPG).
(A) Representative images of replated DRG neurons from NC, KD1, and KD2 groups incubated with CSPG substrates with Tuj1 staining. DRG neurons were dissociated and infected with the NC, KD1, and KD2 adeno-associated viruses (AAVs) for 7 d, before replating in CSPG substrates and fixed after 16–18 hr. DRG neurites were visualized using Tuj1 staining. Scale bar: 50 μm. (B) Quantification of the axon length in (A); the quantification data were from 3 biologically independent experiments for each group, approximately 110 neurons per group were quantified on average. One-way ANOVA followed by Dunnett′s test, **p<0.01, ***p<0.001.
Figure 3—figure supplement 2
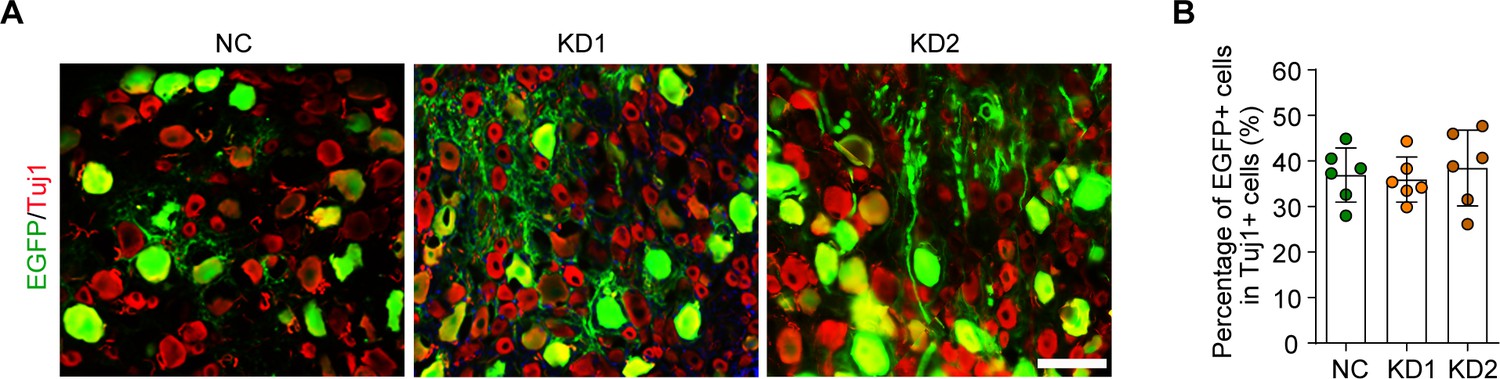
Infection efficiency of AAV2/8 in dorsal root ganglion (DRG) by intrathecal injection.
(A) DRG sections from rat after NC, KD1, and KD2 adeno-associated viruses (AAVs) intrathecal injection for 2 wk. The sections were stained for EGFP (green) and Tuj1 (red). Scale bar: 100 µm. (B) Percentage of EGFP-positive DRG neurons with Tuj1 in (A), n = 6 rats per group.
Figure 3—figure supplement 3
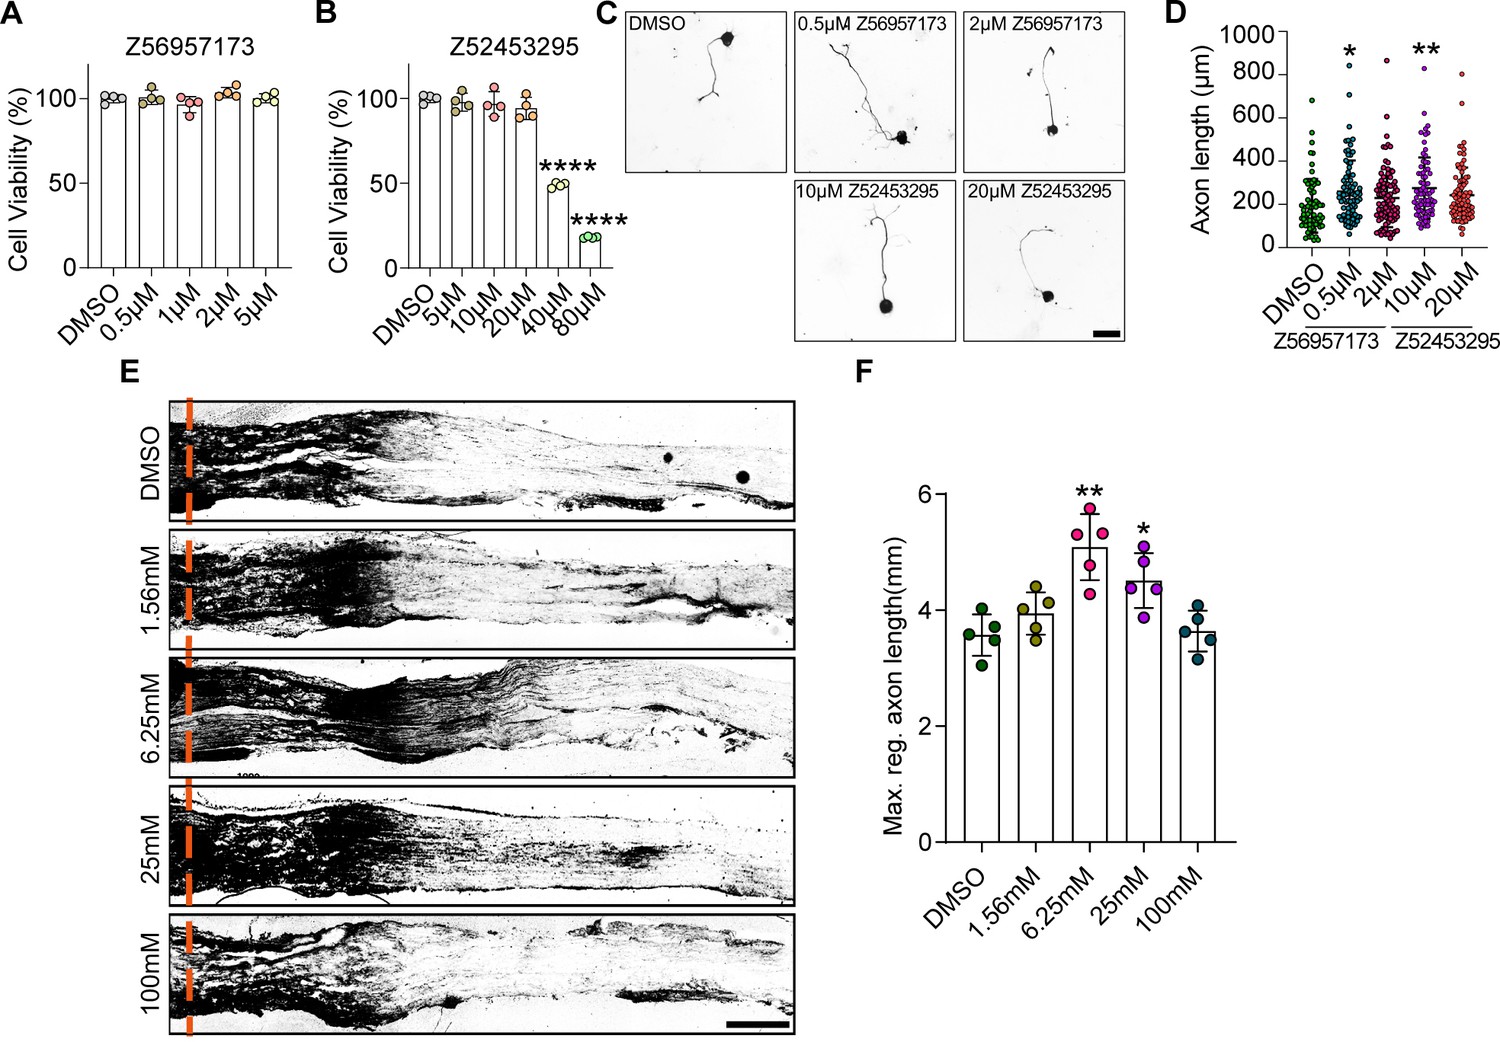
The selective ALKBH5 inhibitors (SAI) promoted axon regeneration of dorsal root ganglion (DRG) neurons.
(A, B) CCK-8 assay showing the viability of cultured DRG neurons treated with various concentrations of selective ALKBH5 inhibitors (Z56957173 or Z52453295) for 24 hr (One -way ANOVA followed by Dunnett′s test, n = 4 biologically independent experiments, ****p<0.0001). (C) Mature DRG neurons were treated with different concentration of Z56957173 (0 μM, 0.5 μM, or 2 μM) or Z52453295 (0 μM, 10 μM, or 20 μM). Axon staining was performed at 16–18 hr following cell replating. Representative images of replated DRG neurons from Z56957173 (0 μM, 0.5 μM, or 2 μM) or Z52453295 (0 μM, 10 μM, or 20 μM) groups with Tuj1 staining. Scale bar: 50 μm. (D) Quantification of the axon length in (C); the quantification data were from 3 biologically independent experiments for each group, approximately 80 neurons per group were quantified on average. One-way ANOVA followed by Dunnett′s test, *p<0.05, **p<0.01. (E) Adult rat DRGs were injected with different concentration of Z52453295 (0 μM, 1.56 mM, 6.25 mM, 25 mM or 100 mM) through intrathecal injection following sciatic nerve crush (SNC). Regenerated axons were visualized using SCG10 staining. Sections of sciatic nerves from adult rats injected with different concentration of Z52453295 at day 3 post SNC. Regenerated axons were visualized using SCG10 staining. Scale bar: 500 μm. (F) Quantification of the maximum length of the regenerated sciatic nerve axon in (E). One-way ANOVA followed by Dunnett′s test, n = 5 rats per group, *p<0.05, **p<0.01.
Figure 4 with 1 supplement
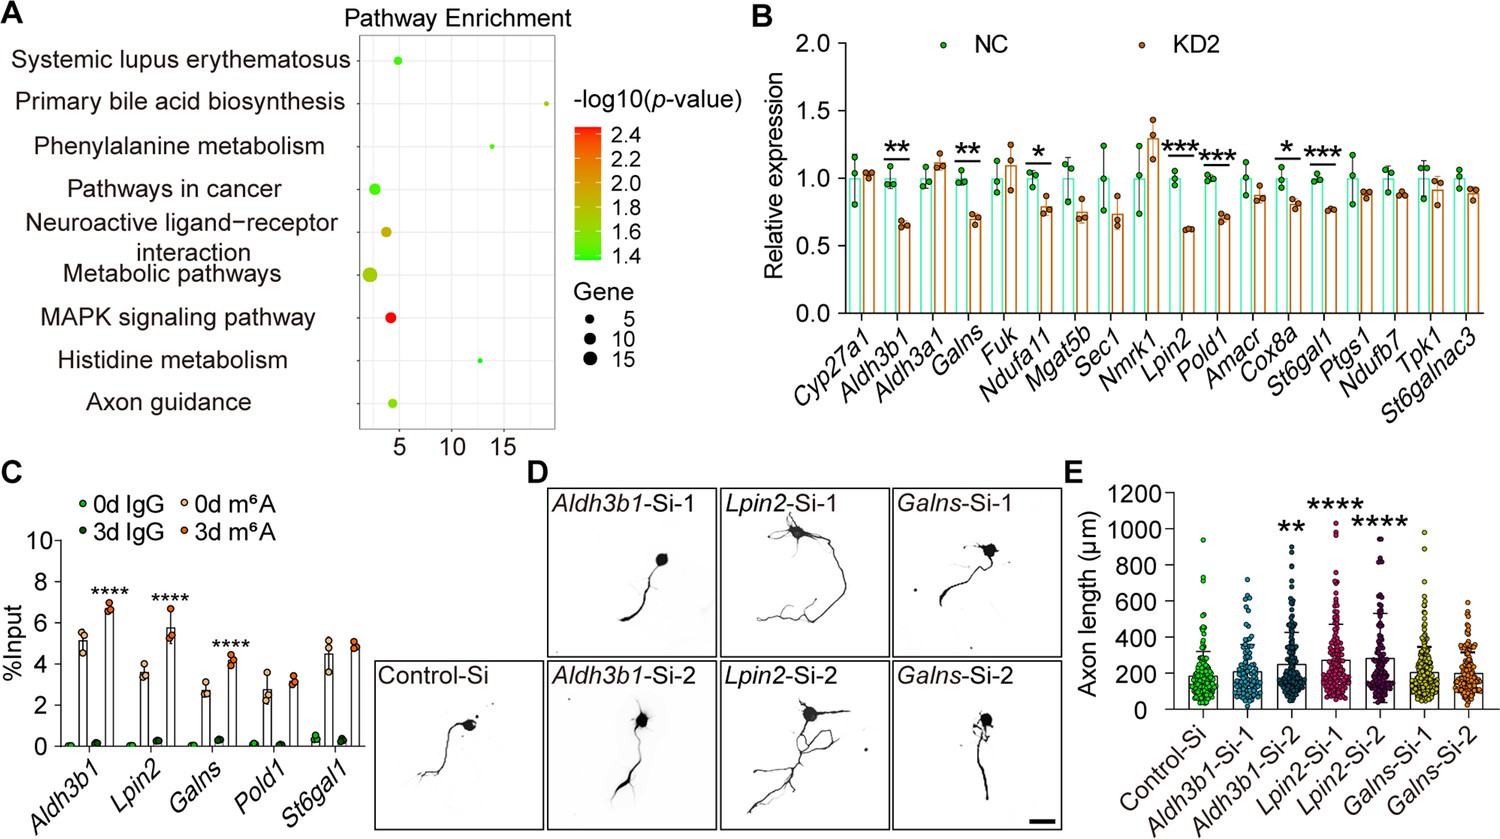
Lpin2 is a target of ALKBH5-mediated axonal regeneration.
(A) Kyoto Encyclopedia of Genes and Genomes (KEGG) pathway analyses for differential gene expression of dorsal root ganglion (DRG) neurons infected with NC or KD2. The total RNA extracts isolated from dissociated adult DRG neurons infected with the NC or KD2 adeno-associated virus (AAV) for 7 d were subjected to RNA-seq analyses for ALKBH5-induced differential gene expression. (B) Quantification of the ALKBH5-induced differential gene expression by qRT–PCR analyses in (A). Gapdh was used as the internal control. Unpaired two-tailed Student′s t-test, n = 3 biologically independent experiments, *p<0.05, **p<0.01, ***p<0.001. (C) Enrichment of m6A-modified Aldh3b1, Lpin2, Galns, Pold1, and St6gal1 in DRG neurons on days 0 and 3 following sciatic nerve crush (SNC). Total RNA extracts isolated from dissociated adult DRG neurons were subjected to MeRIP-qPCR analyses for the m6A enrichment of ALKBH5-induced differential gene expression. Two-way ANOVA followed by Tukey′s test, n = 3 biologically independent experiments, ****p<0.0001. (D) Representative images of replated DRG neurons from RNA interference (RNAi)-mediated functional screening of ALKBH5 target gene (Aldh3b1, Lpin2, and Galns) with Tuj1 staining. DRG neurons were dissociated and transfected with the sicontrol (Control-Si), siAldh3b1 (Aldh3b1-Si-1 and Aldh3b1-Si-2), siLpin2 (Lpin2-Si-1 and Lpin2-Si-2), and siGalns (Galns-Si-1 and Galns-Si-2) for 2 d. Neurons were replated and fixed after 16–18 hr. DRG neurites were visualized using Tuj1 staining. Scale bar: 50 μm. (E) Quantification of the axon length in (D); the quantification data were from 3 biologically independent experiments for each group, approximately 100–200 neurons per group were quantified on average. One-way ANOVA followed by Dunnett′s test, **p<0.01, ****p<0.0001. Validation of the interfering efficiency for the indicated m6A-related gene is shown in Figure 4—figure supplement 1.
-
Figure 4—source data 1
The data underlying all the graphs shown in Figure 4.
- https://cdn.elifesciences.org/articles/85309/elife-85309-fig4-data1-v2.xlsx
-
Figure 4—source data 2
The data underlying all the graphs shown in Figure 4—figure supplement 1.
- https://cdn.elifesciences.org/articles/85309/elife-85309-fig4-data2-v2.xlsx
Figure 4—figure supplement 1
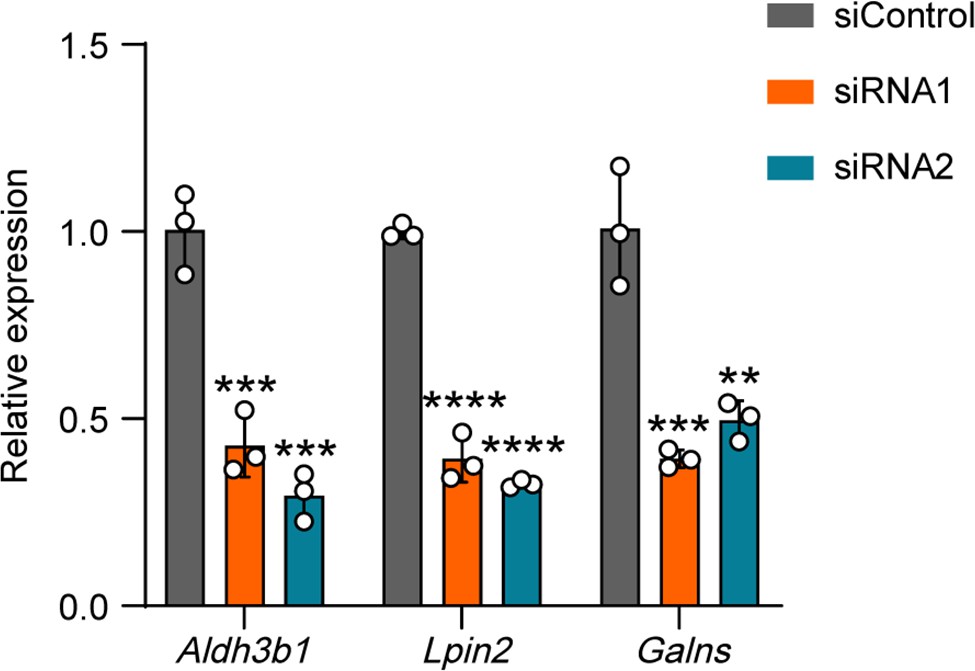
Validation of the interference efficiency for ALKBH5-induced differential gene expression.
Quantification of mRNA expression by qRT-PCR validating the knockdown efficiency of the ALKBH5-induced differentially expressed genes (Aldh3b1, Lpin2, and Galns) in dorsal root ganglion (DRG) neurons on day 2 following transfection with the control (siControl) or target siRNA (siRNA1 or siRNA2). Gapdh was used as the internal control. One-way ANOVA followed by Dunnett′s test, n = 3 biologically independent experiments, **p<0.01, ***p<0.001, ****p<0.0001.
Figure 5 with 3 supplements
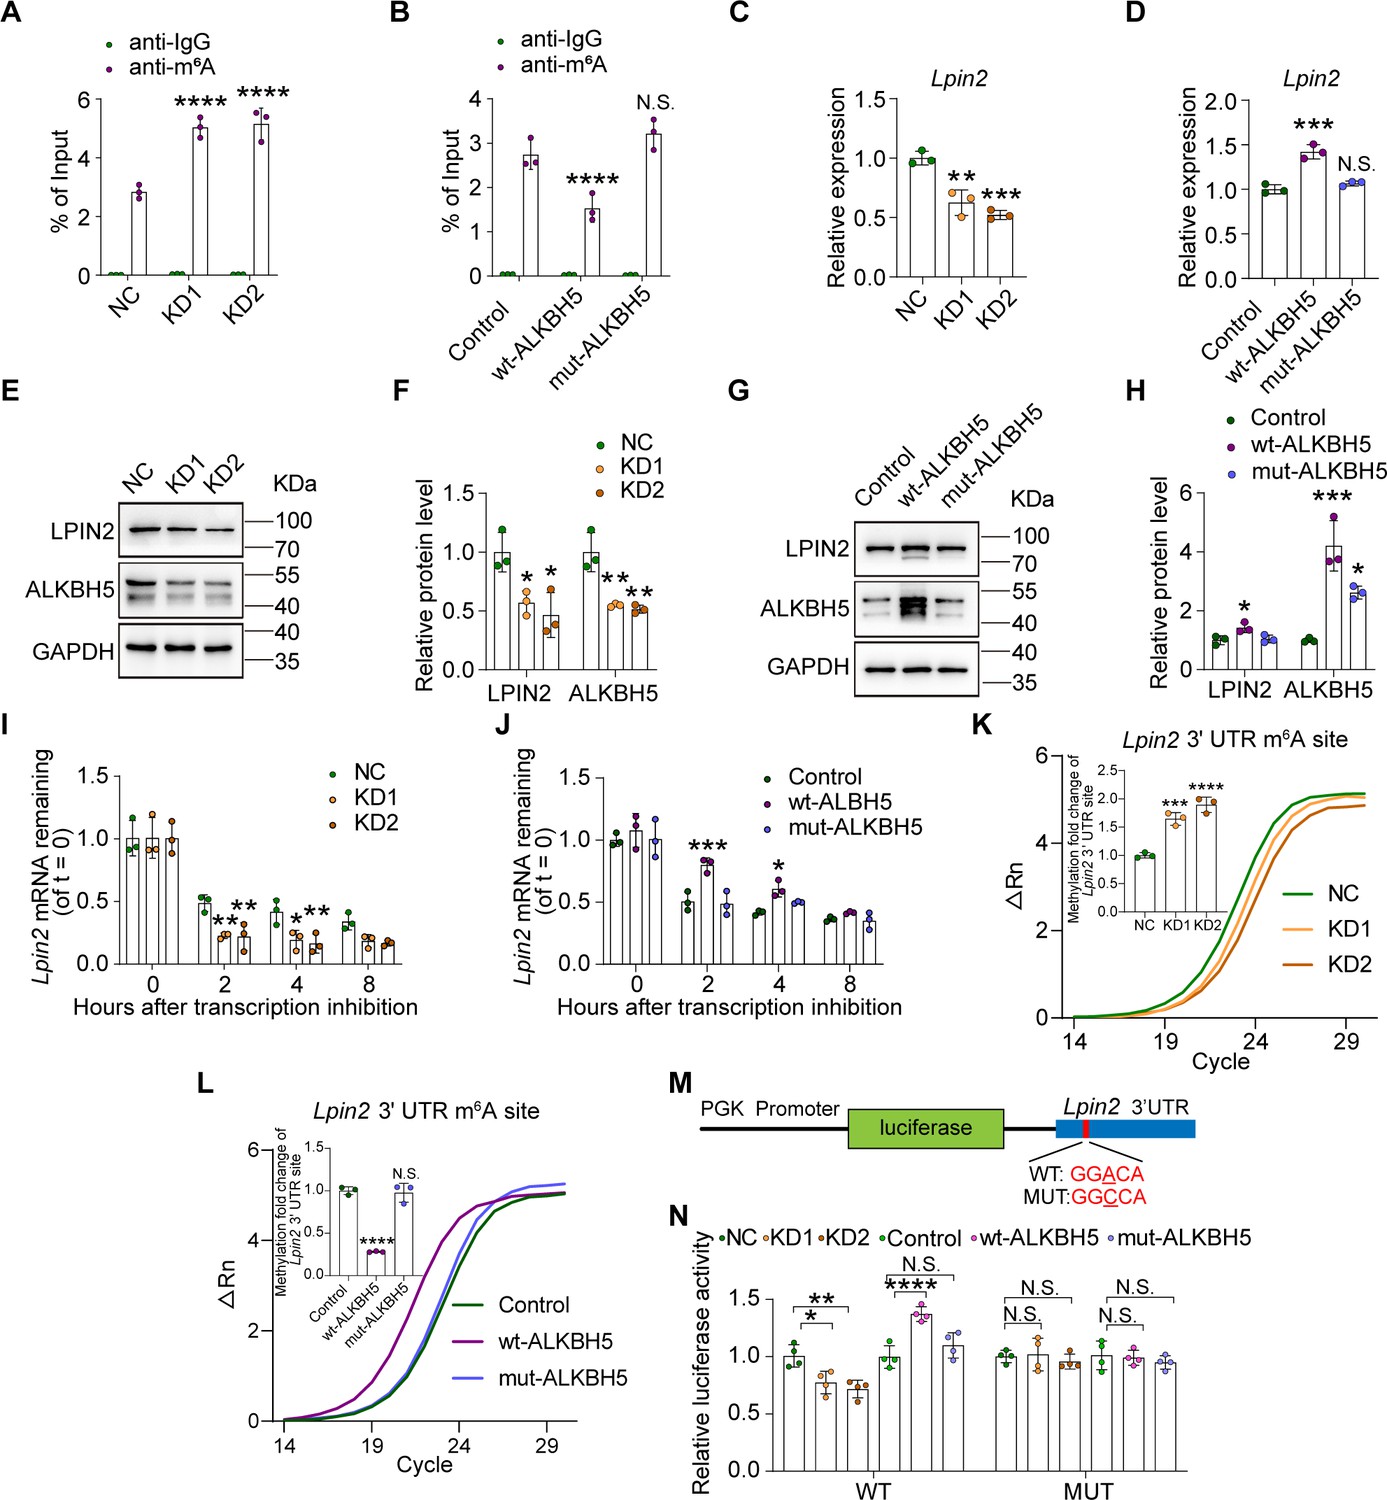
ALKBH5 impacts Lpin2 mRNA stability through its RNA demethylase activity.
(A, B) Changes in the m6A-modified Lpin2 level with ALKBH5 knockdown or overexpression. RNA extracts isolated from dissociated adult dorsal root ganglion (DRG) neurons infected with NC, KD1, and KD2 or control, wt-ALKBH5, and mut-ALKBH5 adeno-associated viruses (AAVs) for 7 d were subjected to MeRIP-qPCR analyses. Two-way ANOVA followed by Dunnett′s test, n = 3 biologically independent experiments, ****p<0.0001, N.S., not significant. (C, D) Quantification of Lpin2 gene expression by qRT–PCR analysis of total RNA extracts isolated from dissociated adult DRG neurons infected with the NC, KD1, and KD2 or control, wt-ALKBH5, and mut-ALKBH5 AAVs for 7 d were subjected to qRT-PCR analyses. Gapdh was used as the internal control. One-way ANOVA followed by Dunnett′s test, n = 3 biologically independent experiments, **p<0.01, ***p<0.001, N.S., not significant. (E, G) Quantification of the LPIN2 and ALKBH5 protein expression by western blot. Protein extracts isolated from dissociated adult DRG neurons infected with the NC, KD1, and KD2 or control, wt-ALKBH5, and mut-ALKBH5 AAVs for 7 d were subjected to western blot. GAPDH was used as the loading control. (F, H) Quantitative data in (E, G). One-way ANOVA followed by Dunnett′s test, n = 3 biologically independent experiments, *p<0.05, **p<0.01, ***p<0.001. (I, J) Quantification of Lpin2 mRNA expression by qRT-PCR in adult DRG neurons. Total RNA extracts isolated from dissociated adult DRG neurons incubated with Act-D for the indicated times (0, 2, 4, and 8 hr) following infection with NC, KD1, and KD2 or control, wt-ALKBH5, and mut-ALKBH5 AAVs for 7 d were subjected to qRT-PCR analyses. Gapdh was used as the internal control. Two-way ANOVA followed by Dunnett′s test, n = 3 biologically independent experiments, *p<0.05, **p<0.01, ***p<0.001. (K, L) Validation of m6A modification levels of the GGACA motif in Lpin2 3' UTR region in DRG neurons infected with NC, KD1, KD2, or control, wt-ALKBH5, mut-ALKBH5 AAVs for 7 d by SELECT-m6A analysis. The curve in the figure is the amplification curve, and the histogram is the fold change of m6A modification level. One-way ANOVA followed by Dunnett’s test, n = 3 biologically independent experiments, ***p<0.001, ****p<0.0001, N.S., not significant. The m6A modification sites on Lpin2 mRNA predicted by SRAMP. Blue frame represents the 3' UTR region of Lpin2 in Figure 5—figure supplement 3. (M, N) Schema for the constructs and co-transfection experiments. A fragment of 3′ UTR of Lpin2 (wild-type and mutant in A to C) was cloned into a pmirGLO vector, downstream of the firefly luciferase gene. The construct was co-transfected with the NC, KD1, and KD2 or control, wt-ALKBH5, and mut-ALKBH5 into HEK293T cells. Cells were harvested after 48 hr. Firefly luciferase activity was measured and normalized to that of Renilla luciferase. Two-way ANOVA followed by Tukey’s test, n = 4 biologically independent experiments, *p<0.05, **p<0.01, ****p<0.0001, N.S., not significant.
-
Figure 5—source data 1
The data underlying all the graphs shown in Figure 5.
- https://cdn.elifesciences.org/articles/85309/elife-85309-fig5-data1-v2.xlsx
-
Figure 5—source data 2
The data underlying all the graphs shown in Figure 5—figure supplement 1.
- https://cdn.elifesciences.org/articles/85309/elife-85309-fig5-data2-v2.xlsx
-
Figure 5—source data 3
The data underlying all the graphs shown in Figure 5—figure supplement 2.
- https://cdn.elifesciences.org/articles/85309/elife-85309-fig5-data3-v2.xlsx
-
Figure 5—source data 4
Source files for LPIN2 and ALKBH5 western graphs.
- https://cdn.elifesciences.org/articles/85309/elife-85309-fig5-data4-v2.zip
Figure 5—figure supplement 1
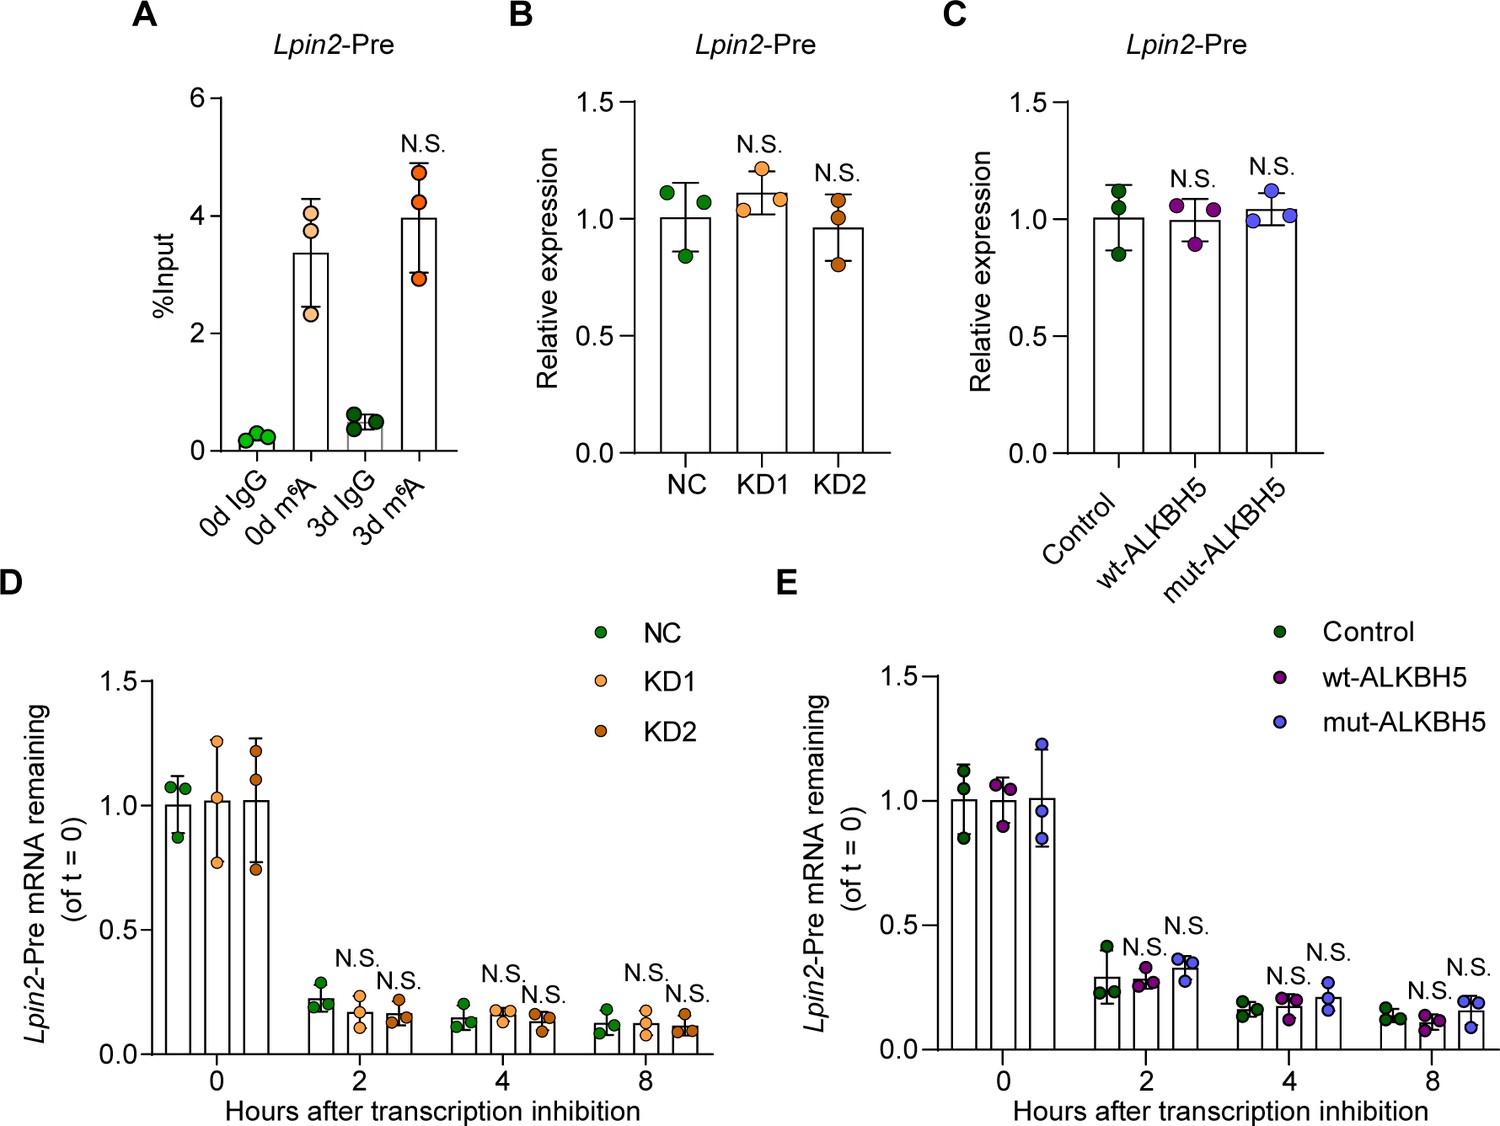
ALKBH5 has no impact on Lpin2 pre-mRNA stability during the axonal regeneration.
(A) Enrichment of Lpin2-Pre mRNA m6A-level in dorsal root ganglion (DRG) neurons at days 0 and day 3 following sciatic nerve crush (SNC). Total RNA extracts isolated from dissociated adult DRG neurons were subjected to MeRIP-qPCR analyses for the Lpin2-pre-mRNA m6A enrichment level. One-way ANOVA followed by Bonferroni′s test, n = 3 biologically independent experiments. N.S., not significant. (B, C) Quantification of Lpin2 pre-mRNA expression by qRT-PCR analyses total RNA extracts isolated from dissociated adult DRG neurons transfected with NC, KD1, and KD2, or the control, wt-ALKBH5, and mut-ALKBH5 adeno-associated viruses (AAVs) for 7 d were subjected to qRT-PCR analyses. Gapdh was used as the internal control. One-way ANOVA followed by Dunnett′s test, n = 3 biologically independent experiments. N.S., not significant. (D, E) Quantification of Lpin2 pre-mRNA expression by qRT-PCR in adult DRG neurons. Total RNA extracts isolated from dissociated adult DRG neurons incubated with Act-D for indicated times (0, 2, 4, and 8 hr) following transfection with NC, KD1, and KD2, or control, wt-ALKBH5, and mut-ALKBH5 AAVs for 7 d were subjected to qRT-PCR analyses. Gapdh was used as the internal control. Two-way ANOVA followed by Tukey′s test, n = 3 biologically independent experiments. N.S., not significant.
Figure 5—figure supplement 2
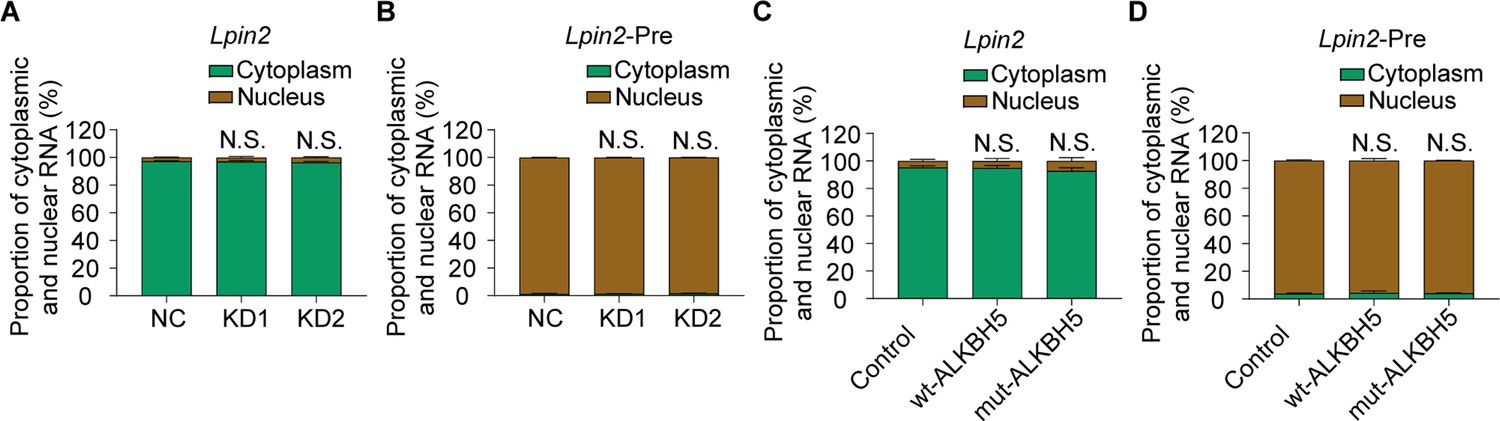
ALKBH5 did not affected the nuclear export of Lpin2 or Lpin2-pre mRNA during the axonal regeneration.
(A–D) The distributed proportion of Lpin2 mRNA or Lpin2-Pre mRNA in dorsal root ganglion (DRG) neurons nucleus and cytoplasm RNA isolated from dissociated adult DRG neurons transfected with NC, KD1, and KD2, or control, wt-ALKBH5, and mut-ALKBH5 adeno-associated viruses (AAVs) for 7 d were subjected to qRT-PCR analyses. Gapdh was used as the internal control. Two-way ANOVA followed by Dunnett′s test, n = 3 biologically independent experiments. N.S., not significant.
Figure 5—figure supplement 3
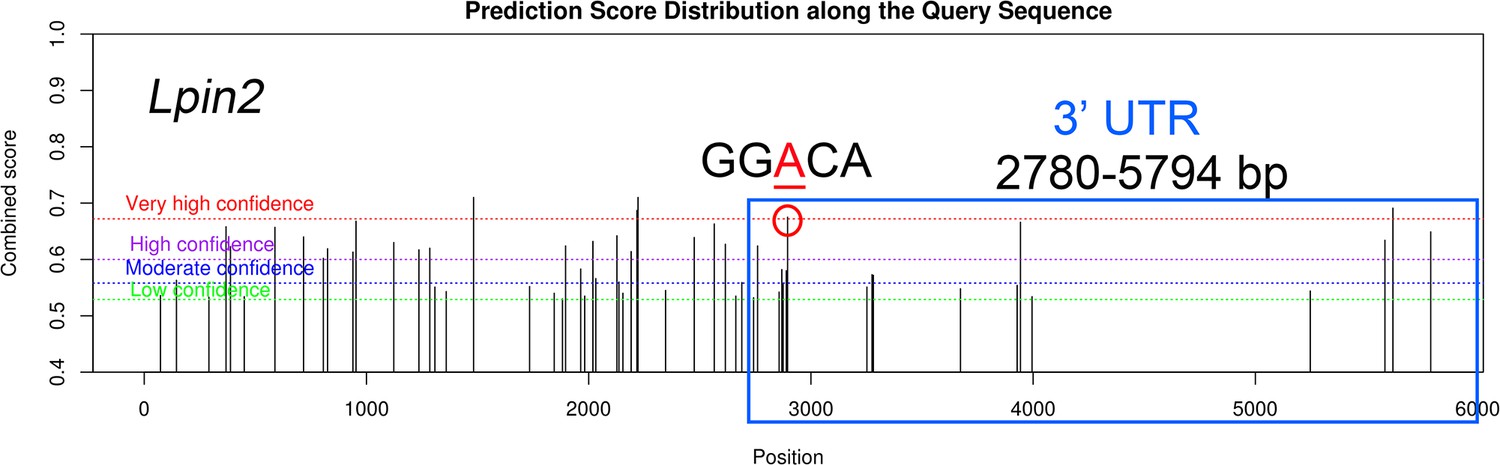
The m6A modification sites on Lpin2 mRNA predicted by SRAMP.
Blue frame represents the 3′ UTR region of Lpin2, and red circle represents the m6A motif GGACA located near the stop codon in the 3′ UTR.
Figure 6 with 1 supplement
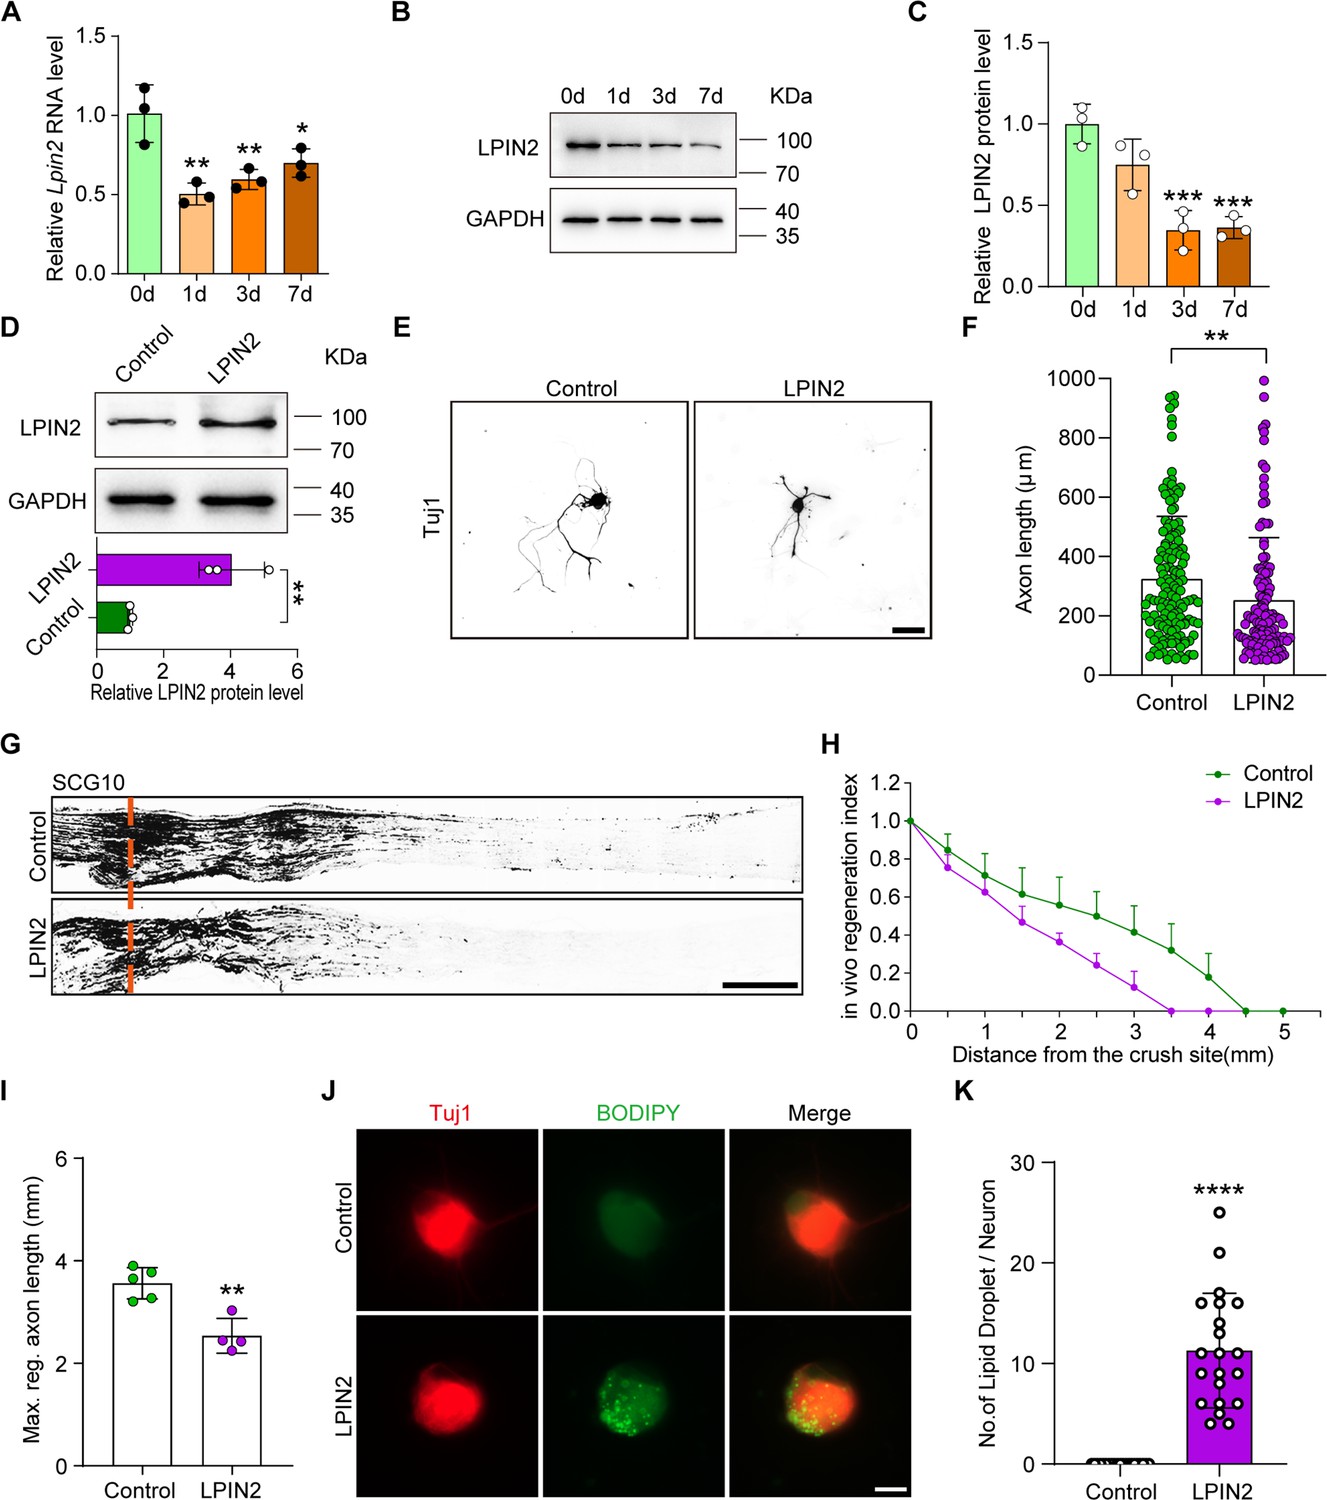
LPIN2 impairs axon regeneration.
(A) Quantification of Lpin2 mRNA expression by qRT-PCR in adult rat L4-5 DRGs following sciatic nerve crush (SNC). Gapdh was used as the internal control. Adult dorsal root ganglions (DRGs) were dissected at days 0, 1, 3, and 7 following SNC. One-way ANOVA followed by Dunnett’s test, n = 3 biologically independent experiments, *p<0.05, **p<0.01. (B) LPIN2 protein expression by western blot. Protein extracts isolated from the adult rat L4-5 DRGs at days 0, 1, 3, and 7 following sciatic nerve injury were subjected to western blot. GAPDH was used as the loading control. (C) Quantitative data in (B). One-way ANOVA followed by Dunnett’s test, n = 3 biologically independent experiments, ***p<0.001. (D) LPIN2 protein expression by western blot. Protein extracts isolated from dissociated adult DRG neurons infected with the EGFP (control) and LPIN2 adeno-associated viruses (AAVs) for 7 d were subjected to western blot. GAPDH was used as the loading control. Top, results of western blot; bottom, quantitative data of western blot. Unpaired two-tailed Student’s t-test, n = 3 biologically independent experiments, **p<0.01. (E) Representative images of replated DRG neurons from control and LPIN2 groups with Tuj1 staining. DRG neurons were dissociated and infected with the EGFP and LPIN2 AAVs for 7 d. Neurons were then replated and fixed after 16–18 hr. DRG neurites were visualized using Tuj1 staining. Scale bar: 50 μm. (F) Quantification of the axon length in (E); the quantification data were from 3 biologically independent experiments for each group, approximately 120 neurons per group were quantified on average. Unpaired two-tailed Student’s t-test, **p<0.01. (G) Sections of sciatic nerves from adult rats infected with the control and LPIN2 AAVs at day 3 post SNC. The regenerated axons were visualized using SCG10 staining. Adult rat DRGs were infected with EGFP and LPIN2 AAVs by intrathecal injection for 14 d. The sciatic nerve was crushed and fixed 3 d after SNC. Regenerated axons were visualized using SCG10 staining. Scale bar: 500 μm. (H, I) Quantification of the regeneration index and the maximum length of the regenerated sciatic nerve axon in (G). Unpaired two-tailed Student’s t-test, n = 4–5 rats per group, **p<0.01. Infection efficiency of Control and LPIN2 AAV2/8 in DRG by intrathecal injection is shown in Figure 6—figure supplement 1A and B. (J) Representative images of replated DRG neurons from control and LPIN2 groups with lipid droplet staining. DRG neurons were dissociated and infected with the control and LPIN2 AAVs for 7 d. The neurons were then replated and fixed after 3 d. The lipid droplets in DRG neurons were examined using BODIPY staining. Scale bar: 10 μm. (K) Quantification of the lipid droplet number in DRG (J); the quantification data were from 3 biologically independent experiments for each group, approximately 20 neurons per group were quantified on average, Unpaired two-tailed Student’s t-test, ****p<0.0001.
-
Figure 6—source data 1
The data underlying all the graphs shown in Figure 6.
- https://cdn.elifesciences.org/articles/85309/elife-85309-fig6-data1-v2.xlsx
-
Figure 6—source data 2
The data underlying all the graphs shown in Figure 6—figure supplement 1.
- https://cdn.elifesciences.org/articles/85309/elife-85309-fig6-data2-v2.xlsx
-
Figure 6—source data 3
Source files for LPIN2 western graphs.
- https://cdn.elifesciences.org/articles/85309/elife-85309-fig6-data3-v2.zip
Figure 6—figure supplement 1
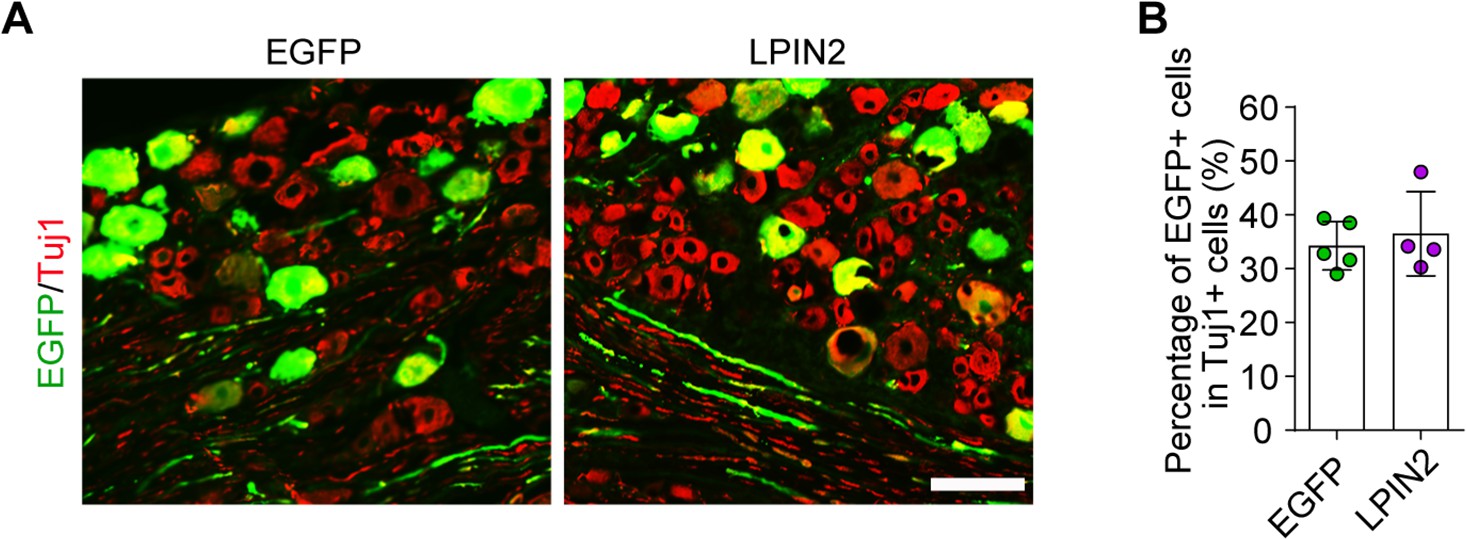
Infection efficiency of AAV2/8 in dorsal root ganglion (DRG) by intrathecal injection.
(A) DRG sections from rat after intrathecal injection of control and LPIN2 adeno-associated viruses (AAVs) for 2 wk. The sections were stained for EGFP (green) and Tuj1 (red). Scale bar: 100 µm. (B) Percentage of EGFP-positive DRG neurons with Tuj1 in (A), n = 4–5 rats per group.
Figure 7
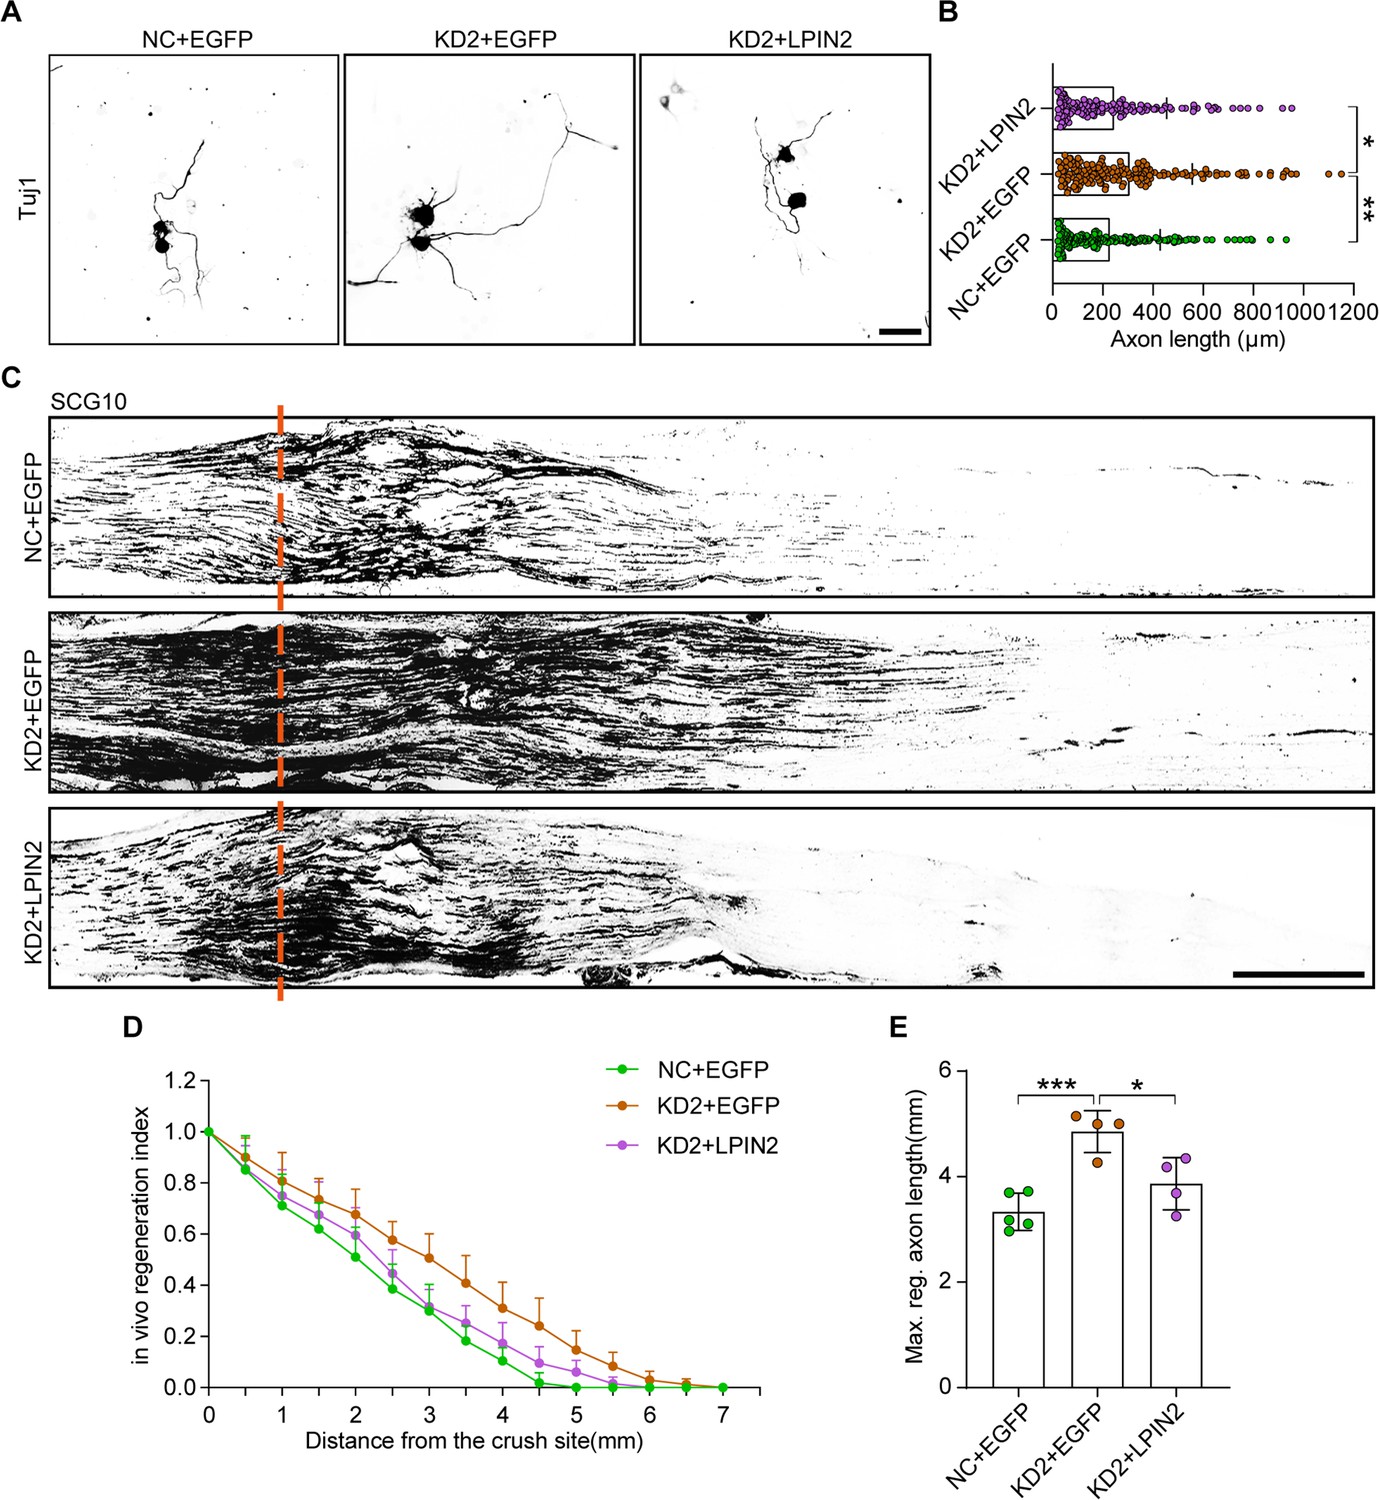
LPIN2 reverses ALKBH5 deficiency-induced axonal regeneration following sciatic nerve crush (SNC).
(A) Representative images of replated dorsal root ganglion (DRG) neurons from NC + EGFP, KD2 + EGFP, and KD2 + LPIN2 groups with Tuj1 staining. DRG neurons were dissociated and infected with the NC + EGFP, KD2 + EGFP, and KD2 + LPIN2 adeno-associated viruses (AAVs) for 7 d before replating and fixing after 16–18 hr. DRG neurites were visualized using Tuj1 staining. Scale bar: 50 μm. (B) Quantification of the axon length in (A); the quantification data were from 3 biologically independent experiments for each group, approximately 150 neurons per group were quantified on average. One-way ANOVA followed by Tukey’s test, *p<0.05, **p<0.01. (C) Sections of sciatic nerves from adult rats infected with the NC + EGFP, KD2 + EGFP, and KD2 + LPIN2 AAVs at 3 d post SNC. The regenerated axons were visualized using SCG10 staining. Adult rat DRGs were infected with the NC + EGFP, KD2 + EGFP, and KD2 + LPIN2 AAVs by intrathecal injection for 14 d. The sciatic nerve was crushed and fixed 3 d after SNC. Regenerated axons were visualized using SCG10 staining. Scale bar: 500 μm. (D, E) Quantification of the regeneration index and the maximum length of the regenerated sciatic nerve axon in (C). One-way ANOVA followed by Tukey’s test, n = 4–5 rats per group, *p<0.05, ***p<0.001.
-
Figure 7—source data 1
The data underlying all the graphs shown in Figure 7.
- https://cdn.elifesciences.org/articles/85309/elife-85309-fig7-data1-v2.xlsx
Figure 8 with 1 supplement
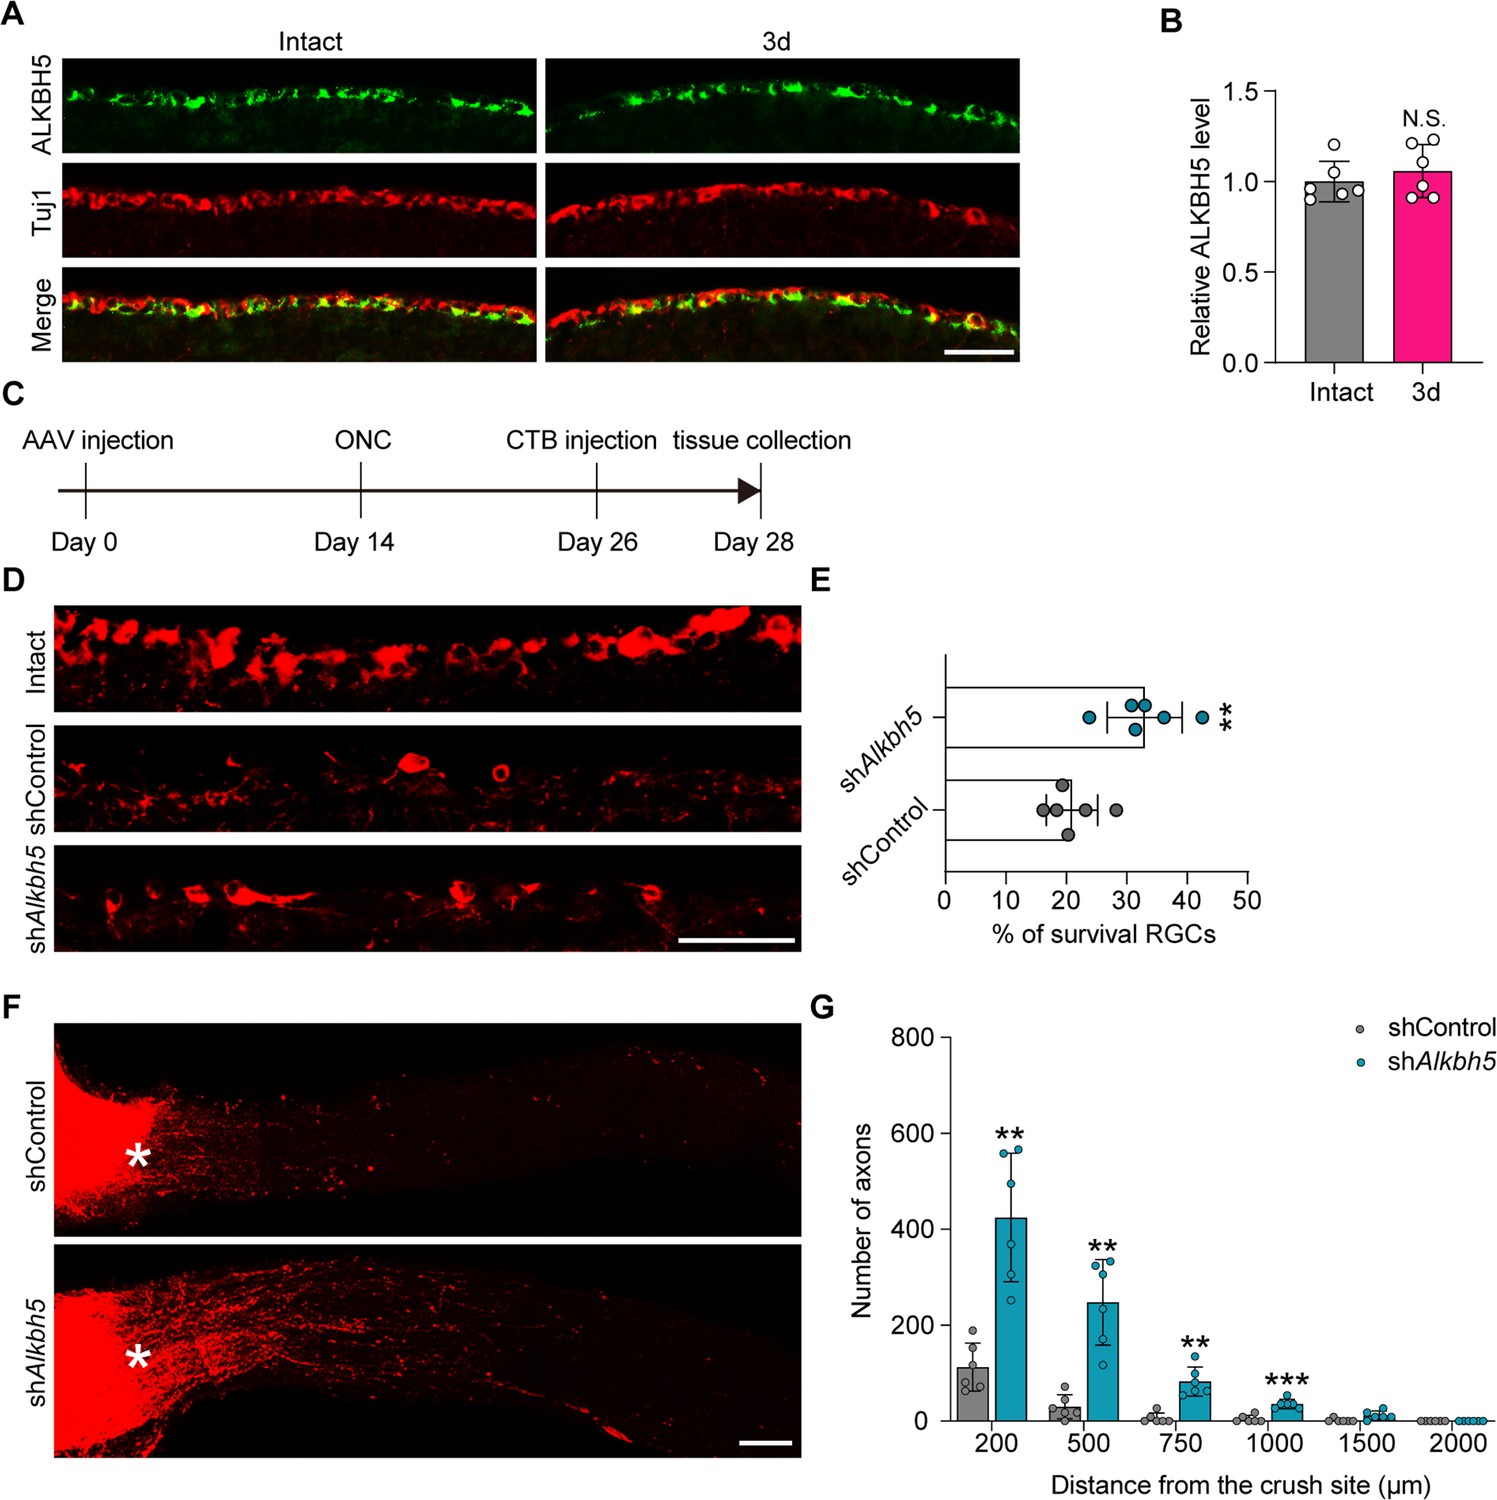
ALKBH5 inhibition promotes retinal ganglion cell (RGC) survival and optic nerve regeneration after optic nerve crush (ONC).
(A) Retinal sections from adult mice from day 0 (Intact) and day 3 (3d) following ONC were collected and stained with ALKBH5 and Tuj1. Red for Tuj1, green for ALKBH5; scale bar: 50 μm. (B) Relative intensity of ALKBH5 in RGCs at the indicated times. Unpaired two-tailed Student’s t-test. n = 6 mice per group, N.S., not significant. (C) Timeline of the in vivo experiment. Adult mice were infected with the shControl or shAlkbh5 AAV2/2 by intravitreal injection for 14 d. ONC was performed. CTB-555 labeling was performed on day 12 after ONC. The retina and optic nerve were collected on day 14 post ONC. (D) Sections from mice retinas injected with shControl or shAlkbh5 AAV at 14 d after ONC were collected and stained for Tuj1 (red). Scale bar: 50 μm. (E) Quantification of the RGC survival rate examined by Tuj1 staining. Unpaired two-tailed Student’s t-test, n = 6 mice per group, **p<0.01. (F) Regenerated axons were visualized using CTB-555 labeling. Optic nerves from mice at 14 d post-ONC were collected following injection with shControl or shAlkbh5 AAV for 14 d. Scale bar: 100 μm. (G) Number of regenerating axons at indicated distances distal to the lesion site. Two-way ANOVA followed by Bonferroni’s test, n = 6 mice per group **p<0.01, ***p<0.001. Infection efficiency of the AAV2/2 in RGCs by intravitreal injection is shown in Figure 8—figure supplement 1.
-
Figure 8—source data 1
The data underlying all the graphs shown in Figure 8.
- https://cdn.elifesciences.org/articles/85309/elife-85309-fig8-data1-v2.xlsx
-
Figure 8—source data 2
The data underlying all the graphs shown in Figure 8—figure supplement 1.
- https://cdn.elifesciences.org/articles/85309/elife-85309-fig8-data2-v2.xlsx
Figure 8—figure supplement 1
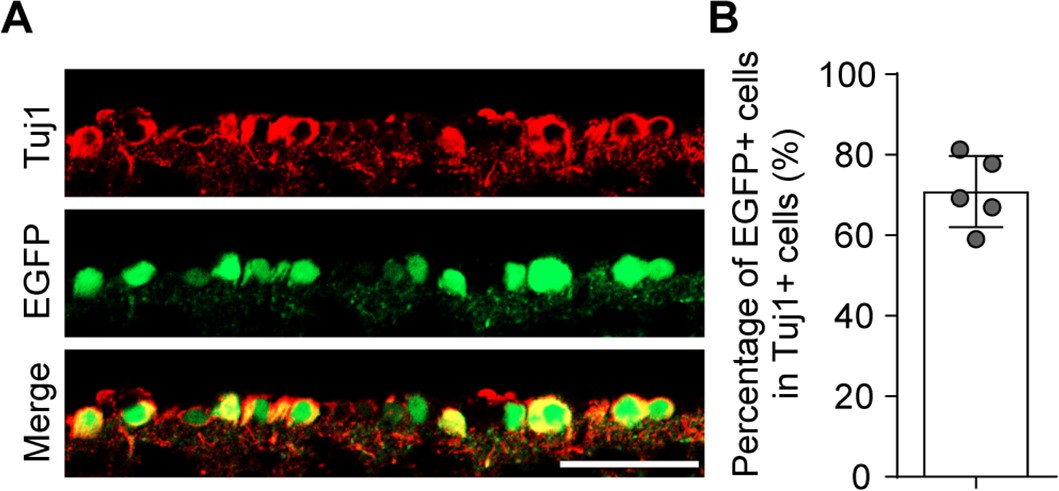
Infection efficiency of the AAV2/2 in retinal ganglion cells (RGCs) by intravitreal injection.
(A) Retinal sections from mice after AAV2/2 intravitreal injection for 2 wk. Retinal sections were stained for EGFP (green) and Tuj1 (red); scale bar: 50 µm. (B) Percentage of EGFP-positive RGCs with Tuj1 in (A), n = 5 mice per group.
Author response image 1
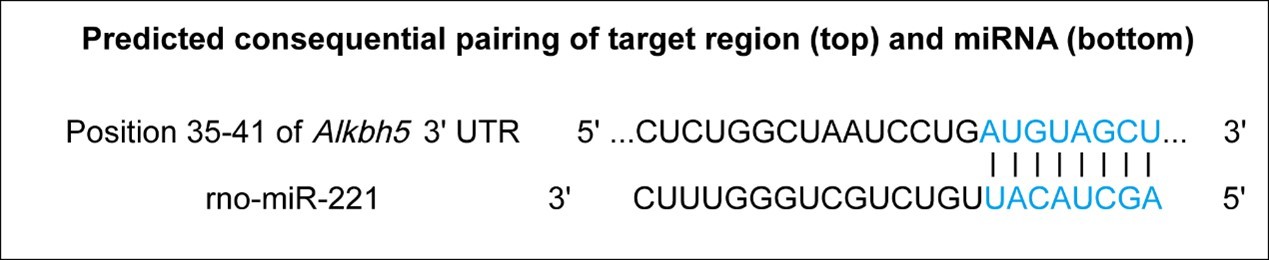
The prediction result for miR-221 binding with the 3'UTR region of Alkbh5.
Author response image 2
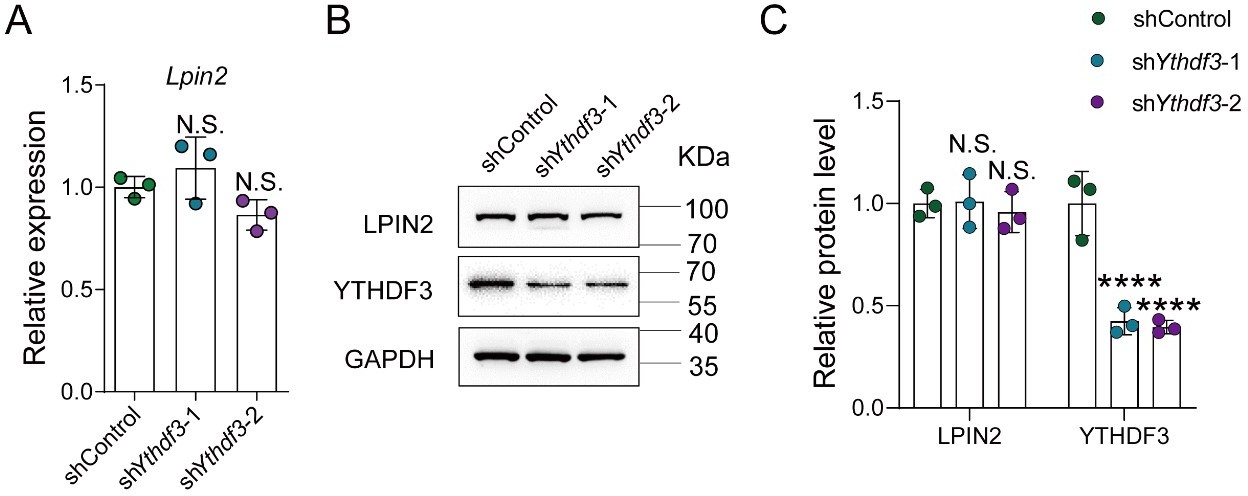
YTHDF3 knockdown did not impact the Lpin2 mRNA and protein expression.
(A) Quantification of Lpin2 mRNA expression by qRT-PCR analysis of total RNA extracts isolated from dissociated adult DRG neurons infected with the shControl, shYthdf3-1, or shYthdf3-2 AAVs for 7 days. Gapdh was used as the internal control. One-way ANOVA followed by Dunnett’s test, n = 3 biologically independent experiments, N.S.: Not significant. (B) Quantification of the LPIN2 and YTHDF3 protein expression by Western blot. Protein extracts isolated from dissociated adult DRG neurons infected with the shControl, shYthdf3-1, or shYthdf3-2 AAVs for 7 days were subjected to Western blot. GAPDH was used as the loading control. (C) Quantitative data in (B). One-way ANOVA followed by Dunnett's test, n = 3 biologically independent experiments, ****p < 0.0001, N.S.: Not significant.
Author response image 3
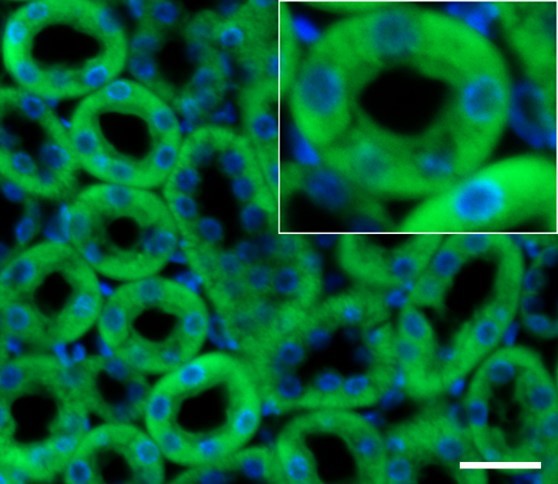
Kidney sections from adult rat stained with ALKBH5 antibody (Abcam, Cat# ab195377) (green) and DAPI (blue); scale bar: 25 μm.
Author response image 4
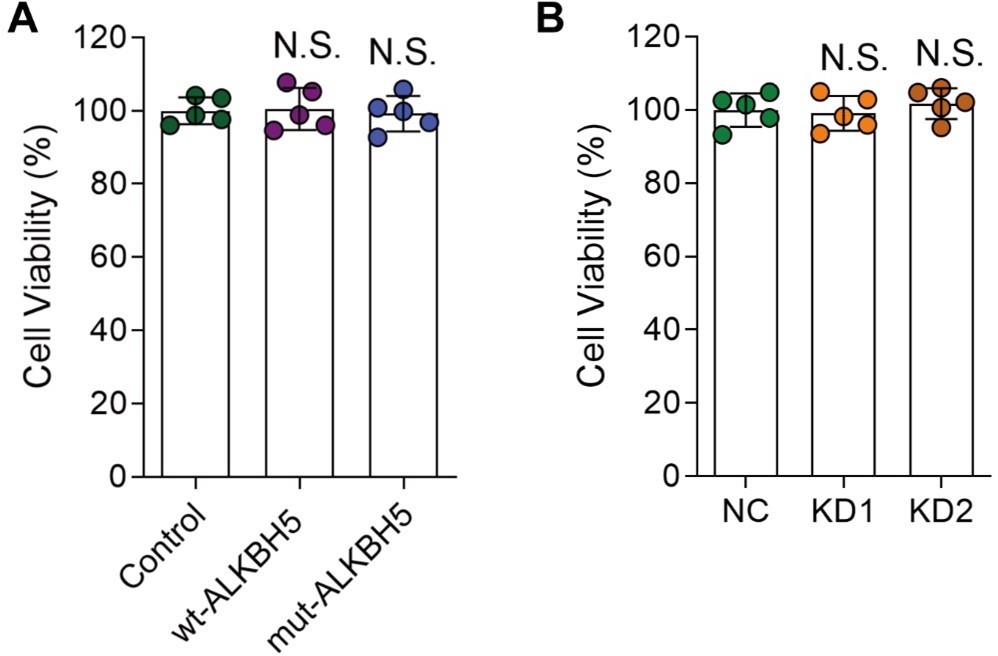
The viability of cultured DRG neurons infected with various AAVs.
(A, and B) DRG neurons were infected with various AAVs (Control, wt-ALKBH5, mut-ALKBH5 or NC, KD1, KD2) for 16 hours, cultured for 7 days and replated for another 16 hours. Then the cell viability was examined by CCK-8 assay. One-way ANOVA followed by Dunnett's test, n = 5 biologically independent samples, N.S., not significant.
Author response image 5
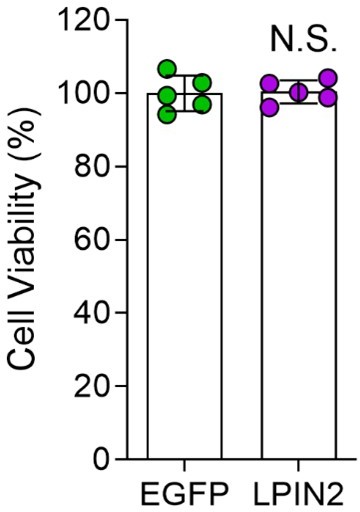
The viability of cultured DRG neurons infected with AAVs overexpressing LPIN2.
DRG neurons were infected with EGFP or LPIN2 AAVs for 16 hours, cultured for 7 days and replated for another 16 hours. Then the cell viability was examined by CCK-8 assay. Unpaired two-tailed Student's t-test, n = 5 biologically independent samples, N.S., not significant.
Tables
Key resources table
| Reagent type (species) or resource | Designation | Source or reference | Identifiers | Additional information |
|---|---|---|---|---|
| Gene (Rattus norvegicus) | Alkbh5 | GenBank | Gene ID: 303193 | |
| Gene (R. norvegicus) | Lpin2 | GenBank | Gene ID: 316737 | |
| Cell line (Homo sapiens) | HEK-293T | ATCC | CRL-3216 | |
| Strain, strain background (AAV) | AAV2/8-CMV bGlobin-eGFP-U6-shRNA | OBiO | Express control shRNA in DRG | |
| Strain, strain background (AAV) | AAV2/8-CMV bGlobin-eGFP-U6-Alkbh5 shRNA1 | OBiO | Express Alkbh5 shRNA-1 in DRG | |
| Strain, strain background (AAV) | AAV2/8-CMV bGlobin-eGFP-U6-Alkbh5 shRNA2 | OBiO | Express Alkbh5 shRNA-2 in DRG | |
| Strain, strain background (AAV) | AAV2/8-CMV-3xFLAG-P2A-mNeonGreen-tWPA | OBiO | Express EGFP in DRG | |
| Strain, strain background (AAV) | AAV2/8-CMV-LPIN2-3xFLAG-P2A-mNeonGreen-tWPA | OBiO | Express LPIN2 in DRG | |
| Strain, strain background (AAV) | AAV2/8-hSyn-EGFP-WPRE-hGH polyA | BrianVTA | Express EGFP in DRG | |
| Strain, strain background (AAV) | AAV2/8-hSyn-ALKBH5-EGFP-WPRE-hGH polyA | BrianVTA | Express wild type rat ALKBH5 in DRG | |
| Strain, strain background (AAV) | AAV2/8-hSyn-ALKBH5(H205D)-EGFP-WPRE-hGH polyA | BrianVTA | Express mutant rat ALKBH5 in DRG | |
| Strain, strain background (AAV) | AAV2/2-CMV bGlobin-eGFP-U6-shRNA | OBiO | Express control shRNA in RGC | |
| Strain, strain background (AAV) | AAV2/2-CMV bGlobin-eGFP-U6-Alkbh5 shRNA | OBiO | Express Alkbh5 shRNA in RGC | |
| Antibody | Anti-ALKBH5 (rabbit monoclonal) | Abcam | Cat# ab195377; RRID:AB_2827986 | IF (1:500), WB (1:1000) |
| Antibody | Anti-Tuj1 (mouse monoclonal) | R&D Systems | Cat# MAB1195; RRID:AB_357520 | IF (1:500) |
| Antibody | Anti-LPIN2 (rabbit monoclonal) | Abcam | Cat# ab176347; RRID:AB_2924332 | WB (1:1000) |
| Antibody | Anti-SCG10 (rabbit polyclonal) | Novus | Cat# NBP1-49461; RRID:AB_10011569 | IF (1:500) |
| Antibody | Anti-m6A (rabbit polyclonal) | Synaptic Systems | Cat# 202003; RRID:AB_2279214 | MeRIP (1:100) |
| Antibody | Anti-IgG (rabbit monoclonal) | Abcam | Cat# ab172730; RRID:AB_2687931 | MeRIP (1:100) |
| Antibody | Anti-GFP (chicken polyclonal) | Abcam | Cat# ab13970; RRID:AB_300798 | IF (1:500) |
| Antibody | Anti-GAPDH (rabbit polyclonal) | Sigma | Cat# G9545; RRID:AB_796208 | WB (1:5000) |
| Antibody | Anti-mouse-647 secondary antibody (goat polyclonal) | Invitrogen | Cat# A32728; RRID:AB_2633277 | IF (1:1000) |
| Antibody | Anti-rabbit-488 secondary antibody (donkey polyclonal) | Invitrogen | Cat# A21206; RRID:AB_2535792 | IF (1:1000) |
| Antibody | Anti-rabbit IgG H&L(goat polyclonal) | Jackson ImmunoResearch Labs | Cat# 111-035-003; RRID:AB_2313567 | WB (1:5000) |
| Antibody | Anti-chicken-488 secondary antibody (goat polyclonal) | Abcam | Cat# ab150169; RRID:AB_2636803 | IF (1:1000) |
| Antibody | Anti-rabbit-594 secondary antibody (goat polyclonal) | Invitrogen | Cat# A11012; RRID:AB_2534079 | IF (1:1000) |
| Peptide, recombinant protein | Cholera Toxin Subunit B (Recombinant), Alexa Fluor 555 Conjugate | Invitrogen | Cat# C34776 | 1 μg/μL |
| Recombinant DNA reagent | pmirGLO–Lpin2(rat)–3′ UTR-wt (plasmid) | Miaoling Biology | P25026 | |
| Recombinant DNA reagent | pmirGLO–Lpin2(rat)–3′ UTR-mut (plasmid) | Miaoling Biology | P25121 | |
| Commercial assay or kit | SELECT m6A site identification kit | Epibiotek | R202106M-01-10T | Detect the m6A level of m6A motif (GGACA) in Lpin2-3’ UTR region |
| Chemical compound, drug | Z52453295 | Enamine | CAS:956935-02-7 | 0, 5, 10, 20, 40, 80 μM (in vitro); 0, 1.56, 6.25, 25, 100 mM (in vivo) |
| Chemical compound, drug | Z56957173 | Enamine | CAS:37510-29-5 | 0, 0.5, 1, 2, 5 μM (in vitro) |
| Software, algorithm | ImageJ software | NIH | https://imagej.nih.gov/ij/ | |
| Software, algorithm | GraphPad Prism 8 | GraphPad Software | https://www.graphpad.com |
Additional files
-
Supplementary file 1
Primers for qRT-PCR validation of candidate Genes.
- https://cdn.elifesciences.org/articles/85309/elife-85309-supp1-v2.docx
-
Supplementary file 2
Interference sequence (IS) designed for target gene.
- https://cdn.elifesciences.org/articles/85309/elife-85309-supp2-v2.docx
-
MDAR checklist
- https://cdn.elifesciences.org/articles/85309/elife-85309-mdarchecklist1-v2.docx
Download links
A two-part list of links to download the article, or parts of the article, in various formats.
Downloads (link to download the article as PDF)
Open citations (links to open the citations from this article in various online reference manager services)
Cite this article (links to download the citations from this article in formats compatible with various reference manager tools)
Promoting axon regeneration by inhibiting RNA N6-methyladenosine demethylase ALKBH5
eLife 12:e85309.
https://doi.org/10.7554/eLife.85309


