Exposure to high-sugar diet induces transgenerational changes in sweet sensitivity and feeding behavior via H3K27me3 reprogramming
- Life Sciences Institute, Zhejiang University, China
- Hunan Key Laboratory of Molecular Precision Medicine, Department of Neurosurgery, Xiangya Hospital, and Hunan Key Laboratory of Medical Genetics, School of Life Sciences, Central South University, China
- The Biobank of Xiangya Hospital, Xiangya Hospital, Central South University, China
- Center for Neurointelligence, School of Medicine, Chongqing University, China
- Institute of Molecular Physiology, Shenzhen Bay Laboratory, China
Figures
Figure 1 with 2 supplements
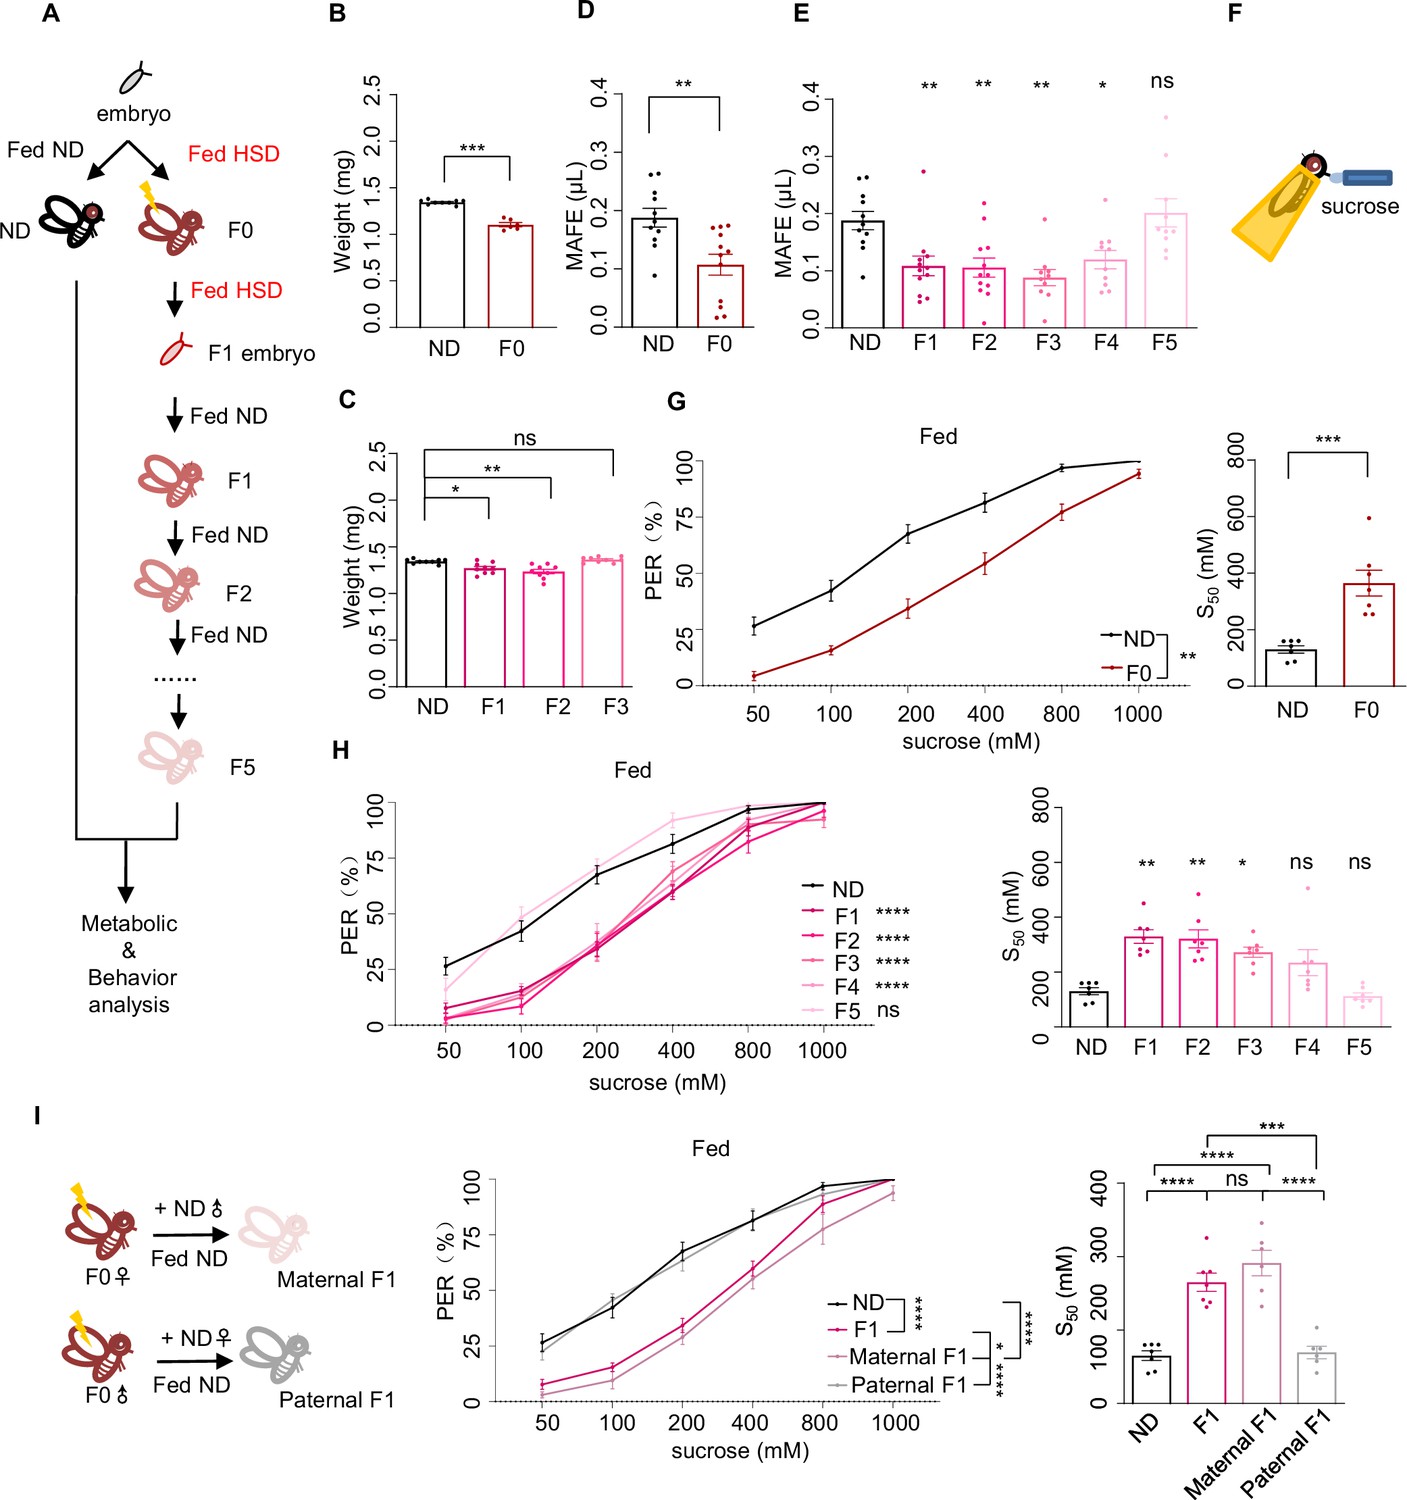
Ancestral high-sugar diet (HSD) exposure decreased sweet sensitivity and feeding behavior across multiple generations of offspring.
(A) The illustration of experimental design for B-I. The embryos of wild-type Canton-S flies were collected and fed with normal diet (ND) (black, referred to ND controls) or HSD (red, referred to HSD-F0) until maturity. HSD-F0 flies were mated to produce the next generation (HSD-F1). The embryos of HSD-F1 flies were transferred to ND right after egg laying and kept on ND until adulthood. HSD-F1 flies were mated to propagate multiple generations of offspring (HSD-F2 to F5) on ND diet for metabolic and behavioral assays. (B–C) The body weight of individual flies from different treatment groups (n=6 biological replicates, each containing 5 flies). (D–E) Volume of 400 mM sucrose consumed by individual flies using the Manual Feeding (MAFE) assay (n=10–12). (F) Schematic illustration of the proboscis extension reflex (PER) assay. (G–I) Fractions of flies showing PER responses to different concentrations of sucrose (n≥6 biological replicates, each containing 8–12 flies). The S50 indicated the sucrose concentration that induced PER responses in 50% of the tested flies. Data were shown as means ± SEM. ns p>0.05; *p<0.05; **p < 0.01; ***p < 0.001; ****p < 0.0001.
-
Figure 1—source data 1
Raw data of the metabolic and behavioral experiments shown in Figure 1.
- https://cdn.elifesciences.org/articles/85365/elife-85365-fig1-data1-v2.xlsx
Figure 1—figure supplement 1
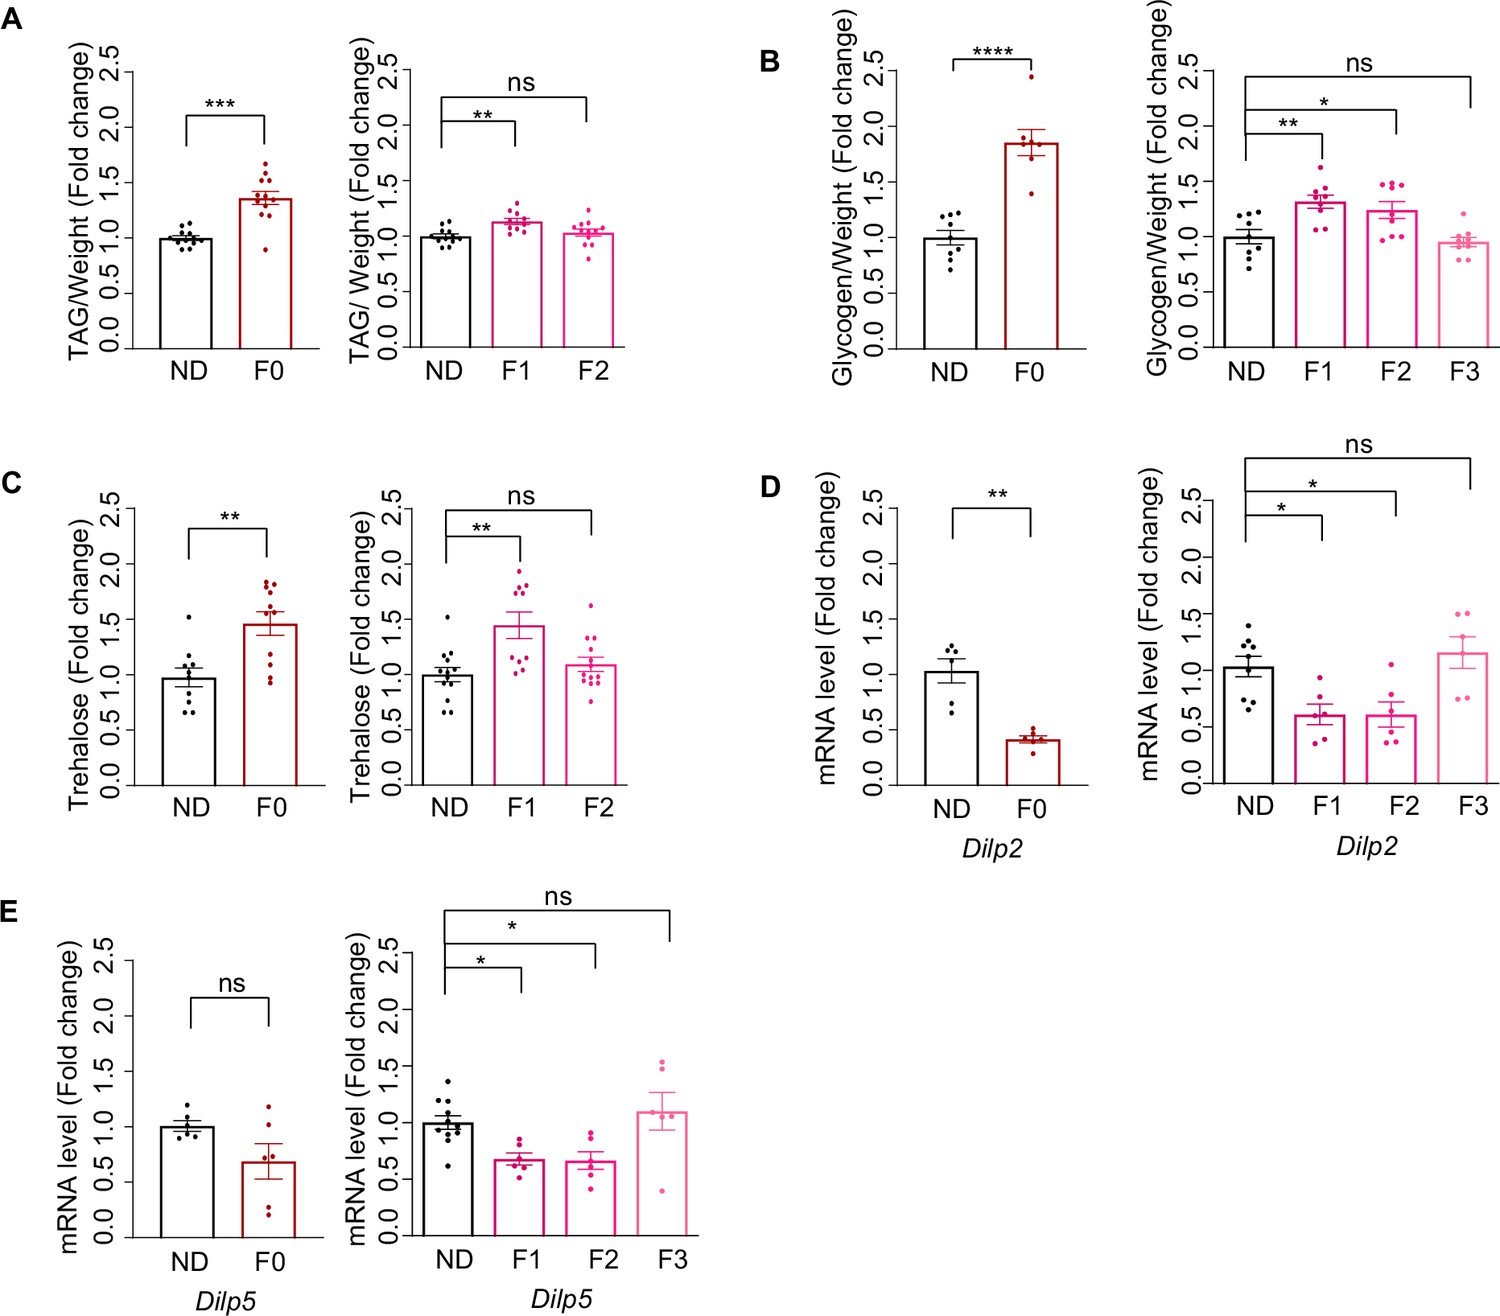
Ancestral high-sugar diet (HSD) exposure induced metabolic changes in the offspring.
(A–C) The levels of triglyceride (A), glycogen (B), and trehalose (C) of individual female flies of the indicated groups (normalized with normal diet [ND] flies, n=8–15 biological replicates, A and C containing 5 flies, B containing 40–60 flies). (D–E) mRNA expression levels of Dilp2 (D) and Dilp5 (E) in the head tissues of indicated flies by qPCR (n=6–9 biological replicates, each containing 15 flies). Data are shown as means ± SEM. ns p>0.05; *p<0.05; **p < 0.01; ***p < 0.001; ****p < 0.0001.
-
Figure 1—figure supplement 1—source data 1
Raw data of the metabolic and qPCR experiments shown in Figure 1—figure supplement 1.
- https://cdn.elifesciences.org/articles/85365/elife-85365-fig1-figsupp1-data1-v2.xlsx
Figure 1—figure supplement 2
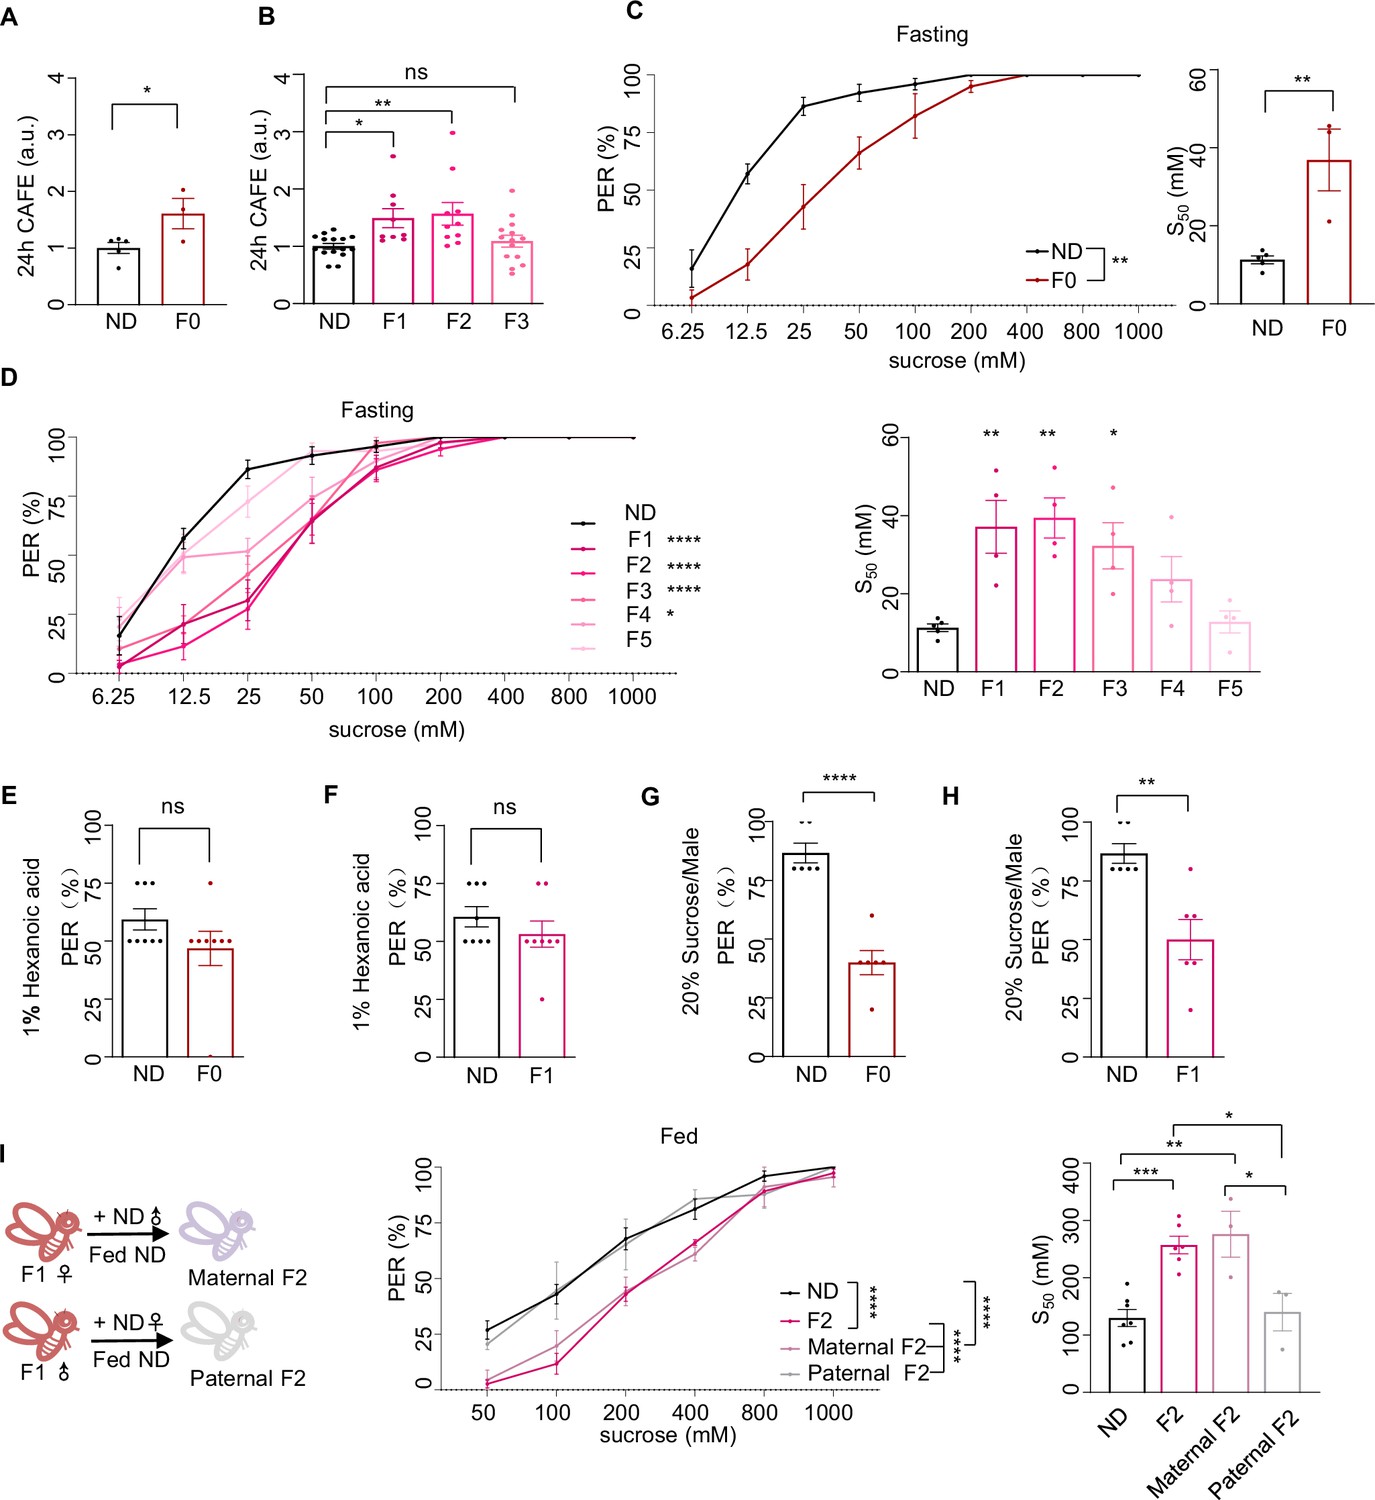
Ancestral high-sugar diet (HSD) exposure induced behavioral changes in the offspring.
(A–B) Volume of 20% sucrose consumed by indicated flies during 24 hr using the Capillary Feeder (CAFE) assay (normalized with normal diet [ND] flies, n=3–15 biological replicates, each containing 20 flies). (C–D) Fractions of indicated flies showing proboscis extension reflex (PER) responses to different concentrations of sucrose (n=3–6 biological replicates, each containing 8–12 flies). The S50 indicated the sucrose concentration that induced PER responses in 50% of the tested flies. The flies in B and C were pre-starved for 12 hr (fasting) before the assay. (E–F) Fractions of flies showing PER responses to 1% hexanoic acid (n=8, each containing 5 flies). (G–H) Fractions of male flies showing PER responses to 20% sucrose (n=6, each containing 5 flies). (I) Fractions of indicated flies showing PER responses to different concentrations of sucrose (n=3–6 biological replicates, each containing 8–12 flies). The S50 indicated the sucrose concentration that induced PER responses in 50% of the tested flies. Data were shown as means ± SEM. ns p>0.05; * p<0.05; **p < 0.01; ***p < 0.001; ****p < 0.0001.
-
Figure 1—figure supplement 2—source data 1
Raw data of the metabolic and behavioral experiments shown in Figure 1—figure supplement 2.
- https://cdn.elifesciences.org/articles/85365/elife-85365-fig1-figsupp2-data1-v2.xlsx
Figure 2 with 2 supplements
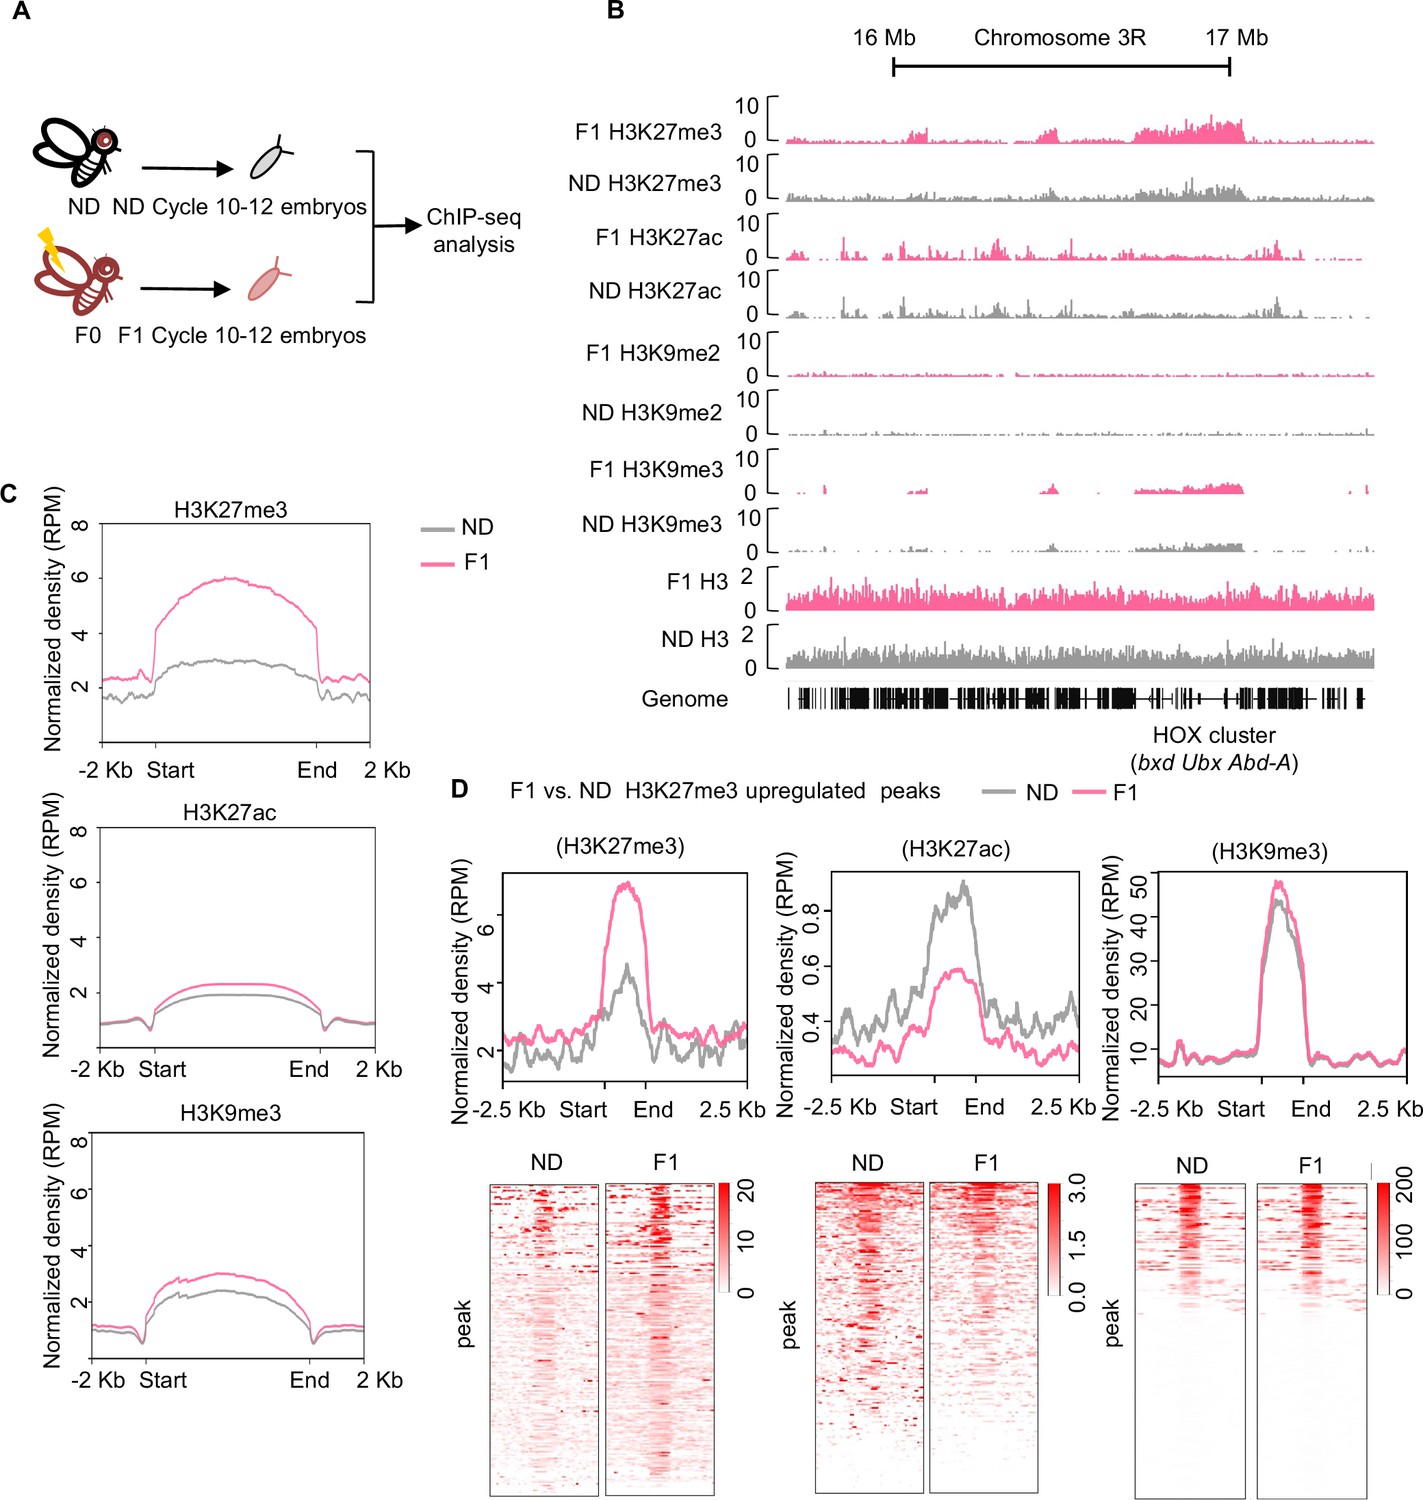
Ancestral high-sugar diet (HSD) exposure increased genome-wide H3K27me3 levels in the offspring.
(A) The workflow of the chromatin-immunoprecipitation followed by sequencing (ChIP-seq) assay. Embryos of normal diet (ND) and HSD-F1 flies were collected from population cages at 25°C for 30 min, and allowed to develop for 80 min to target mitotic cycle 10–12 for ChIP-seq analysis. (B) Genome browser view of H3K27me3, H3K27ac, H3K9me2, H3K9me3, and H3 density at the HOX cluster (bxd, Ubx, and Abd-A) gene regions in embryos of ND and HSD-F1 embryos. (C) Average density plots showing the signal profiles of H3K27me3, H3K27ac, and H3K9me3 at their peaks plotted across a 4 kb window (±2 kb around the start/end of signals). (D) Average density plots (top) and heatmap (bottom) showing the distribution for the changes of H3K27me3, H3K27ac, and H3K9me3 signals for regions with upregulated H3K27me3 peaks in HSD-F1 embryos, respectively. Color bar showed the Z-score value in the heatmap.
Figure 2—figure supplement 1
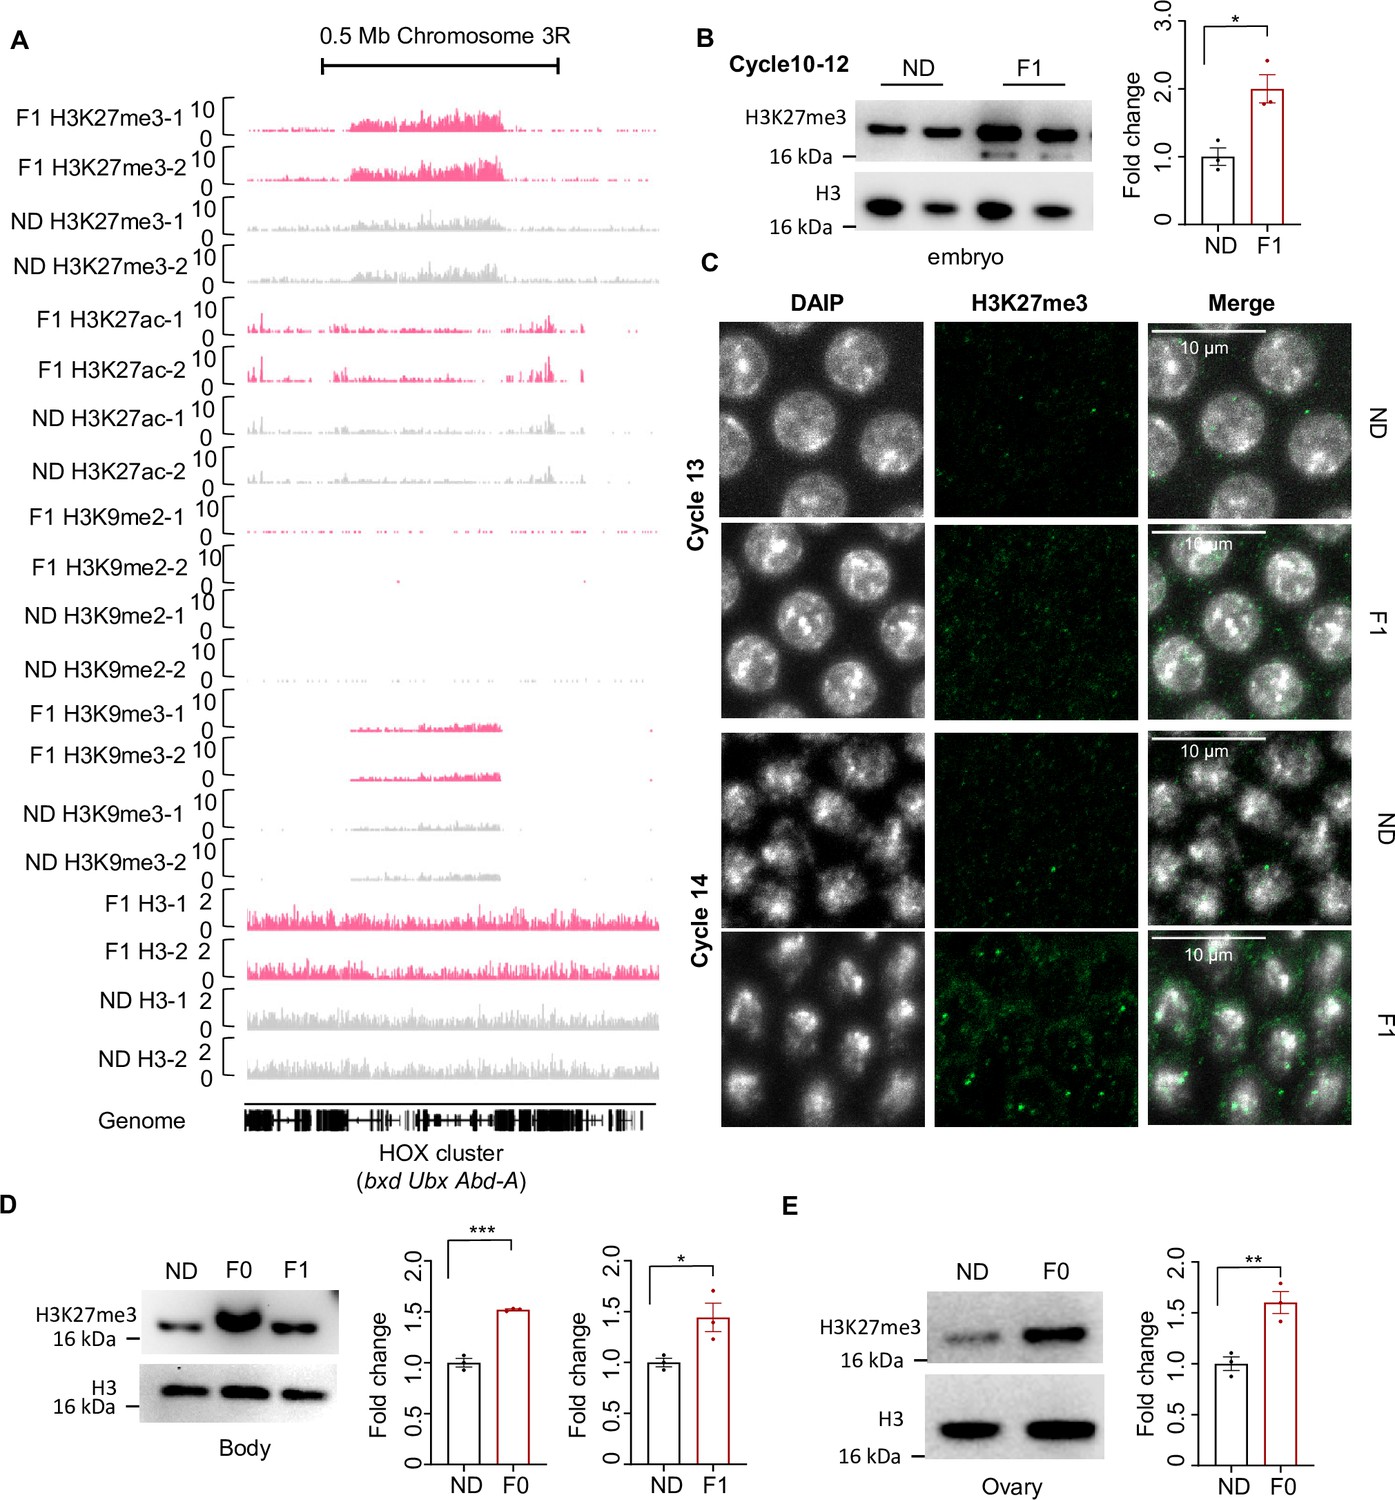
Ancestral high-sugar diet (HSD) exposure increased H3K27me3 levels in both maternal and offspring.
(A) Genome browser view of H3K27me3, H3K27ac, H3K9me2, H3K9me3, and H3 density at the HOX cluster (bxd, Ubx, and Abd-A) gene regions in embryos of two replicates normal diet (ND) and F1 flies. (B) H3K27me3 modification levels of fly cycle 10–12 embryos were analyzed by western blot (n=3 biological replicates, each containing 250 embryos). Antibodies against H3K27me3 and H3 proteins were used in the western blot. (C) H3K27me3 modification levels of fly cycle 13 (top) and cycle 14 (bottom) embryos were analyzed by immunofluorescence staining. Antibodies against H3K27me3 proteins and DAPI were used in the immunofluorescence staining. In the images H3K27me3 is in green and DAPI in white. Scale bar, 10 μm. (D–E) H3K27me3 modification levels of bodies and ovaries of indicated flies were analyzed by western blot (n=3 biological replicates, each containing 20 flies). Antibodies against H3K27me3 and H3 proteins were used in the western blot. Data are shown as means ± SEM. ns p>0.05; *p<0.05; **p < 0.01; ***p < 0.001; ****p < 0.0001.
-
Figure 2—figure supplement 1—source data 1
Raw data of the western blot and immunofluorescence staining experiments shown in Figure 2—figure supplement 1.
- https://cdn.elifesciences.org/articles/85365/elife-85365-fig2-figsupp1-data1-v2.xlsx
Figure 2—figure supplement 2
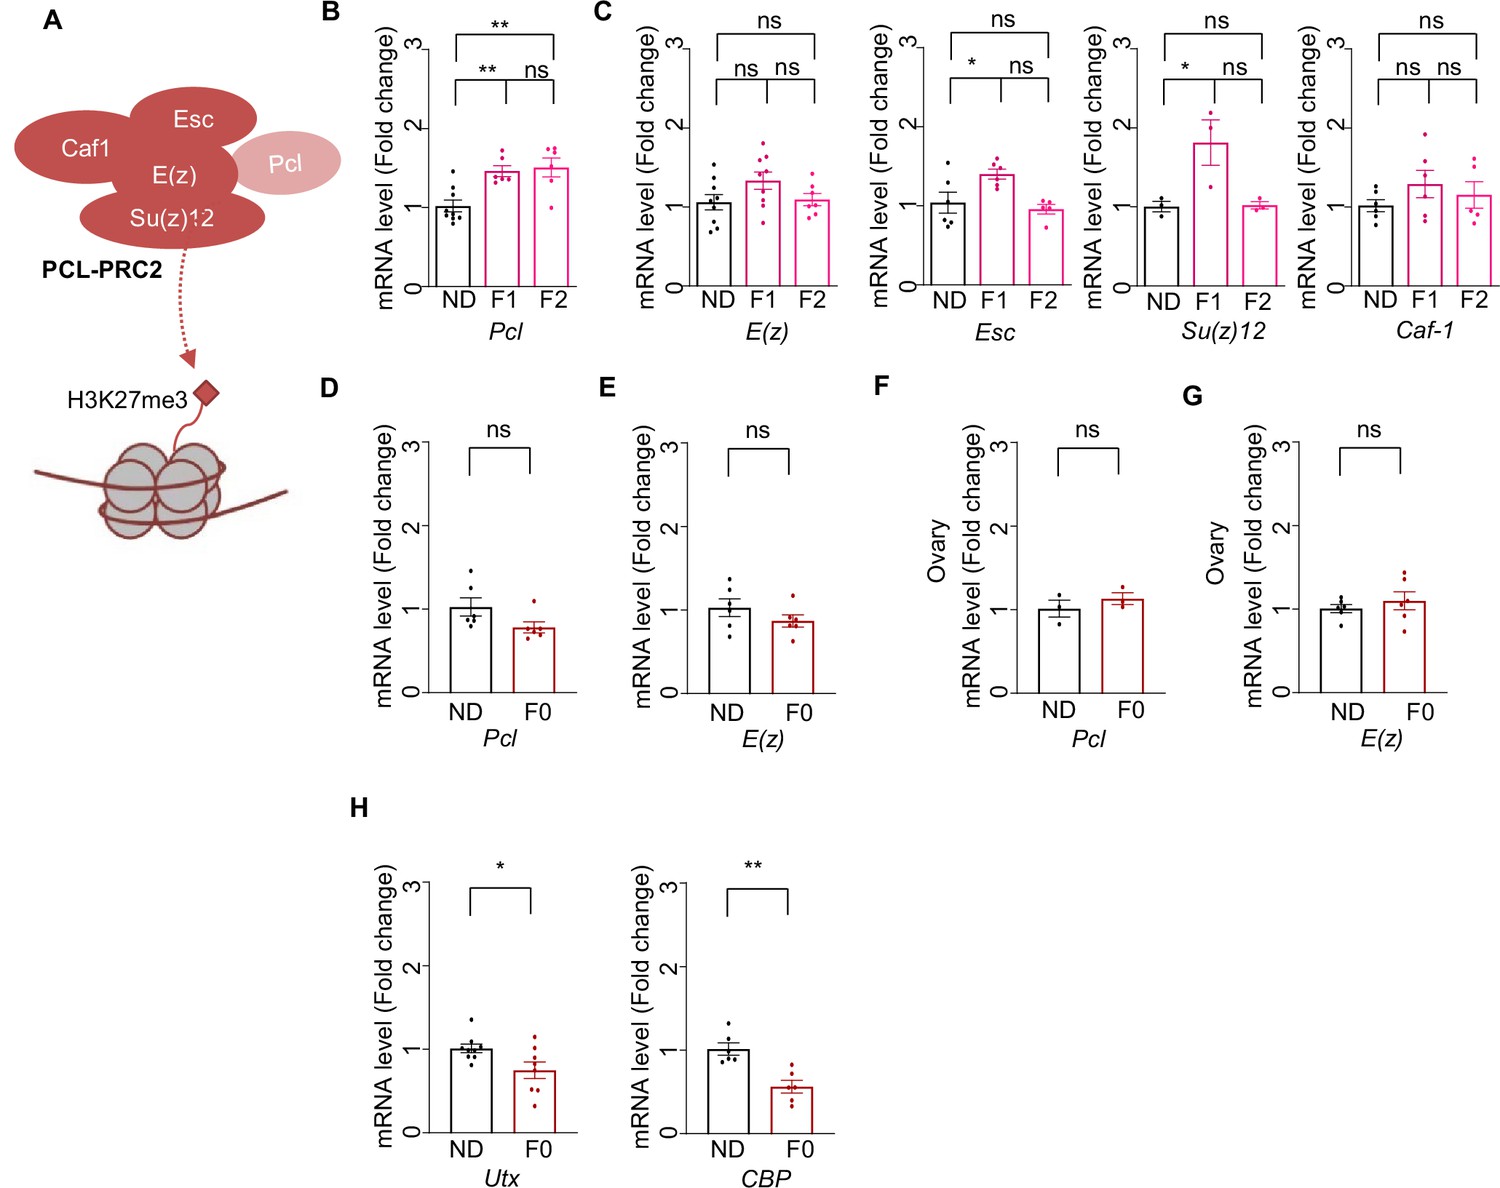
Ancestral high-sugar diet (HSD) exposure enhanced Pcl expression in the offspring.
(A) Schematic diagram of PCL-PRC2 complex. Polycomb repressive complex 2 (PRC2) is a chromatin-modifying enzyme that catalyzes the methylation of histone H3 at lysine 27 and contains the enhancer of zeste [E(z)], the enzymatic component of PRC2, suppressor of zeste 12 [Su(z)12], extra sex combs, and chromatin assembly factor-1 (Caf-1). Polycomb-like (PCL) interacts with PRC2 to constitute a specific form of PCL-PRC2 complex to generate high levels of H3K27me3. (B–C) mRNA expression levels of Pcl (B), E(z), Caf-1, Su(z)12, and Esc (C) of indicated flies (n=3–6 biological replicates, each containing 3 flies). (D–E) mRNA expression levels of Pcl (D) and E(z) (E) of indicated flies’ body (n=6 biological replicates, each containing 3 flies). (F–G) mRNA expression levels of Pcl (F) and E(z) (G) of indicated flies’ ovaries (E) (n=6 biological replicates, each containing 15 flies). (H) mRNA expression levels of Utx and Cbp of indicated flies (n=3–6 biological replicates, each containing 3 flies). Data were shown as means ± SEM. ns p>0.05; *p<0.05; **p < 0.01; ***p < 0.001; ****p < 0.0001.
-
Figure 2—figure supplement 2—source data 1
Raw data of the qPCR experiments shown in Figure 2—figure supplement 2.
- https://cdn.elifesciences.org/articles/85365/elife-85365-fig2-figsupp2-data1-v2.xlsx
Figure 3 with 3 supplements
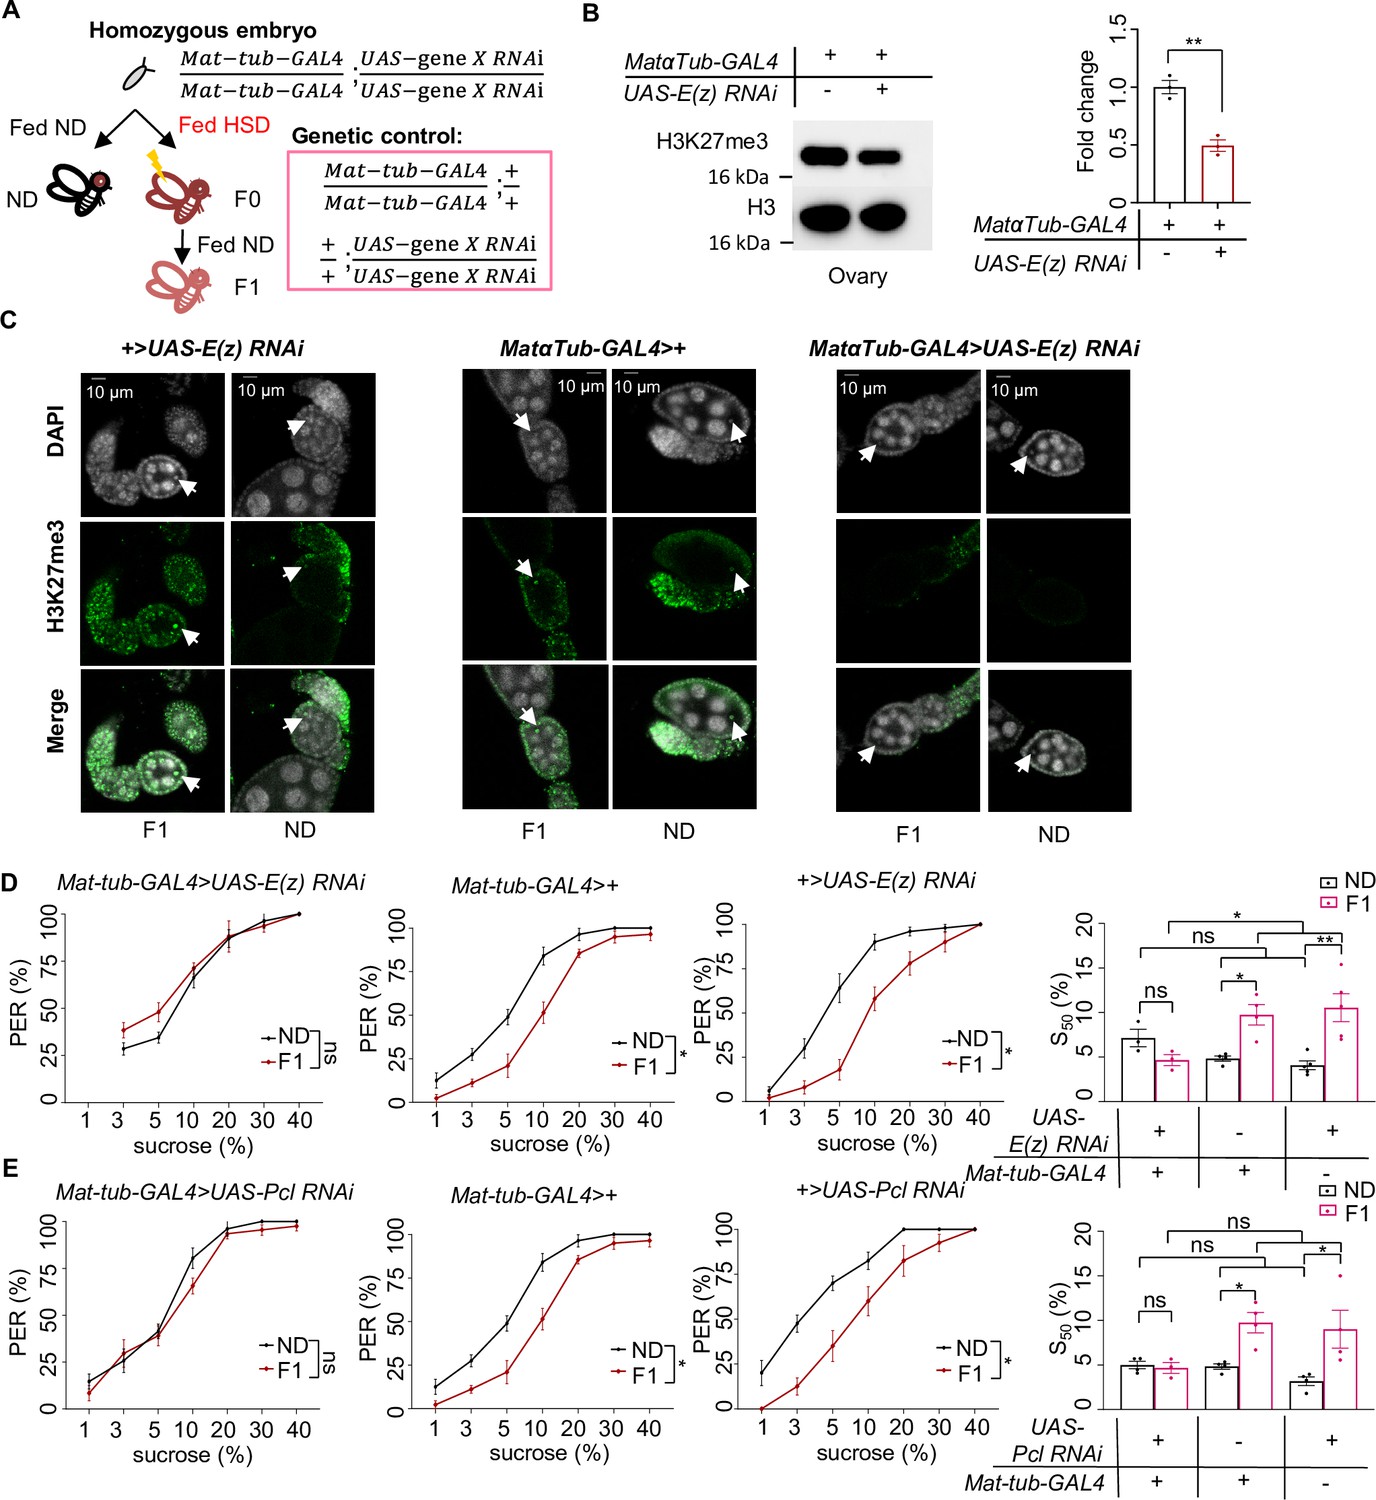
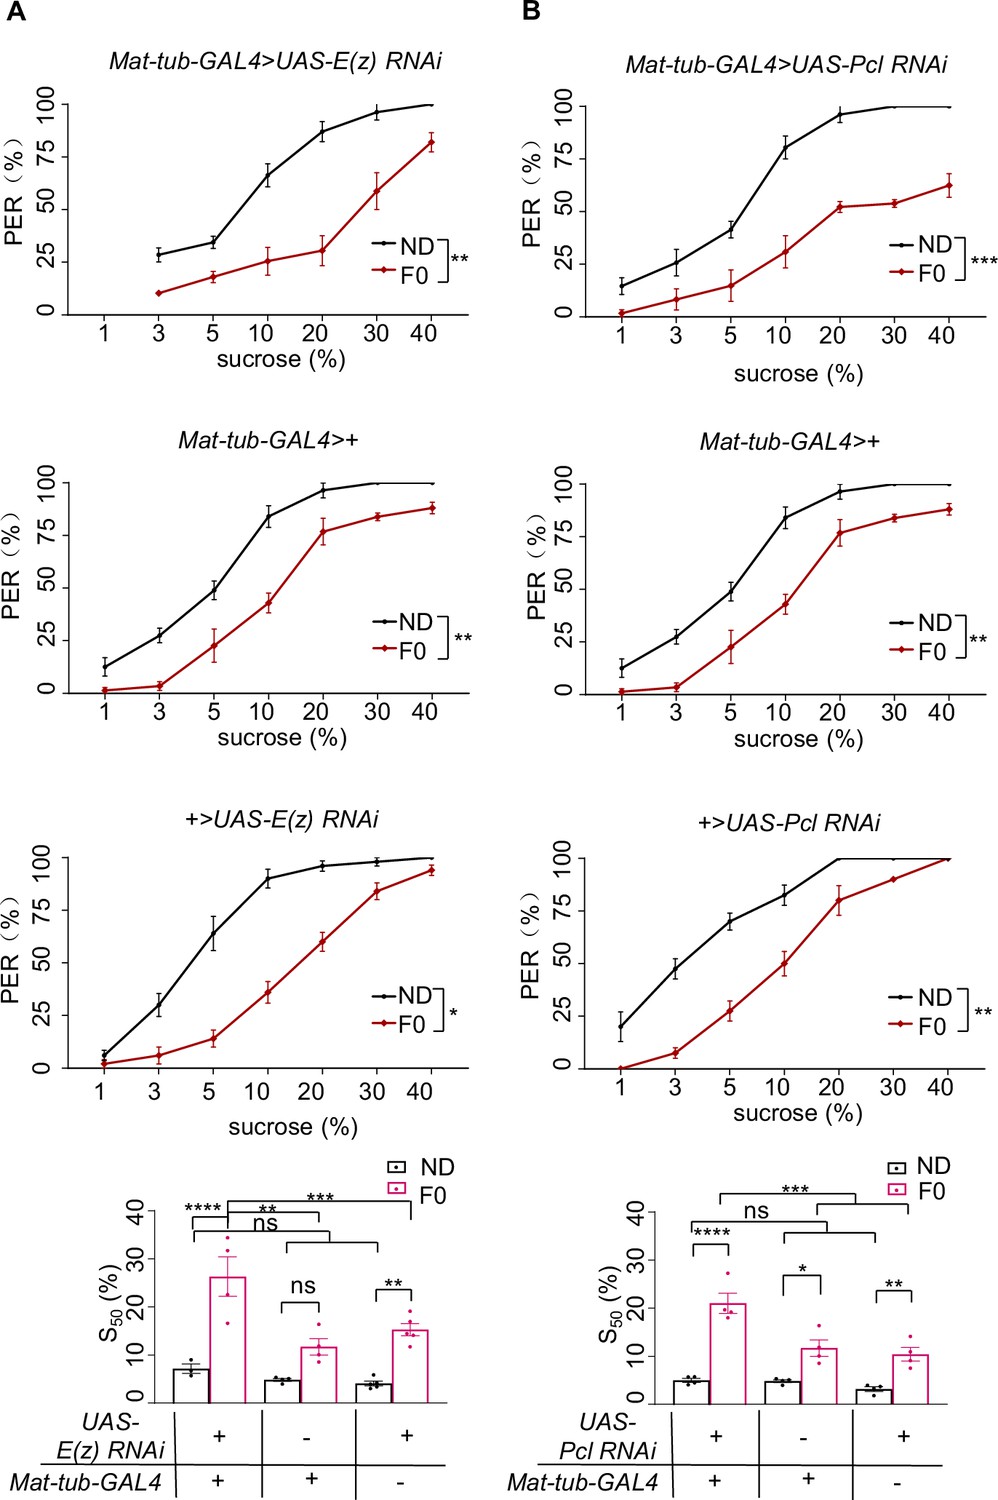
H3K27me3 modifications were essential for the transgenerational regulation of sweet sensitivity and feeding behavior upon ancestral high-sugar diet (HSD) exposure.
(A) Schematic diagram of the PRC2 germline RNAi experiment. Note that UAS-gene X RNAi was integrated into both two third chromosomes and Mat-tub-GAL4 was integrated into both two second chromosomes. The embryos of Mat-tub-GAL4>UAS gene X RNAi flies were collected and fed with normal diet (ND) (black, referred to ND controls) or HSD (red, referred to HSD-F0) until maturity. HSD-F0 flies were mated to produce the next generation (HSD-F1). These flies were prepared for biochemical and behavioral assays. (B) H3K27me3 modification levels in fly ovaries were analyzed by western blot (n=3 biological replicates, each containing 15 flies). Antibodies against H3K27me3 and H3 proteins were used in the western blot. (C) H3K27me3 modification levels in fly germarium were analyzed by immunofluorescence staining. Antibodies against H3K27me3 proteins and DAPI were used in the immunofluorescence staining. In the images H3K27me3 was shown in green and DAPI in white. Examples of oocyte nucleus were indicated by white arrowheads. Scale bar, 10 μm. (D–E) Fractions of flies of the indicated genotypes showing proboscis extension reflex (PER) responses to sucrose (n=3–5 biological replicates, each containing 8–12 flies). The S50 indicated the sucrose concentration that elicited PER responses in 50% of the tested flies. Data were shown as means ± SEM. ns p>0.05; *p<0.05; **p < 0.01; ***p < 0.001; ****p < 0.0001.
-
Figure 3—source data 1
Raw data of the western blot, immunofluorescence staining, and behavioral experiments shown in Figure 3.
- https://cdn.elifesciences.org/articles/85365/elife-85365-fig3-data1-v2.xlsx
Figure 3—figure supplement 1
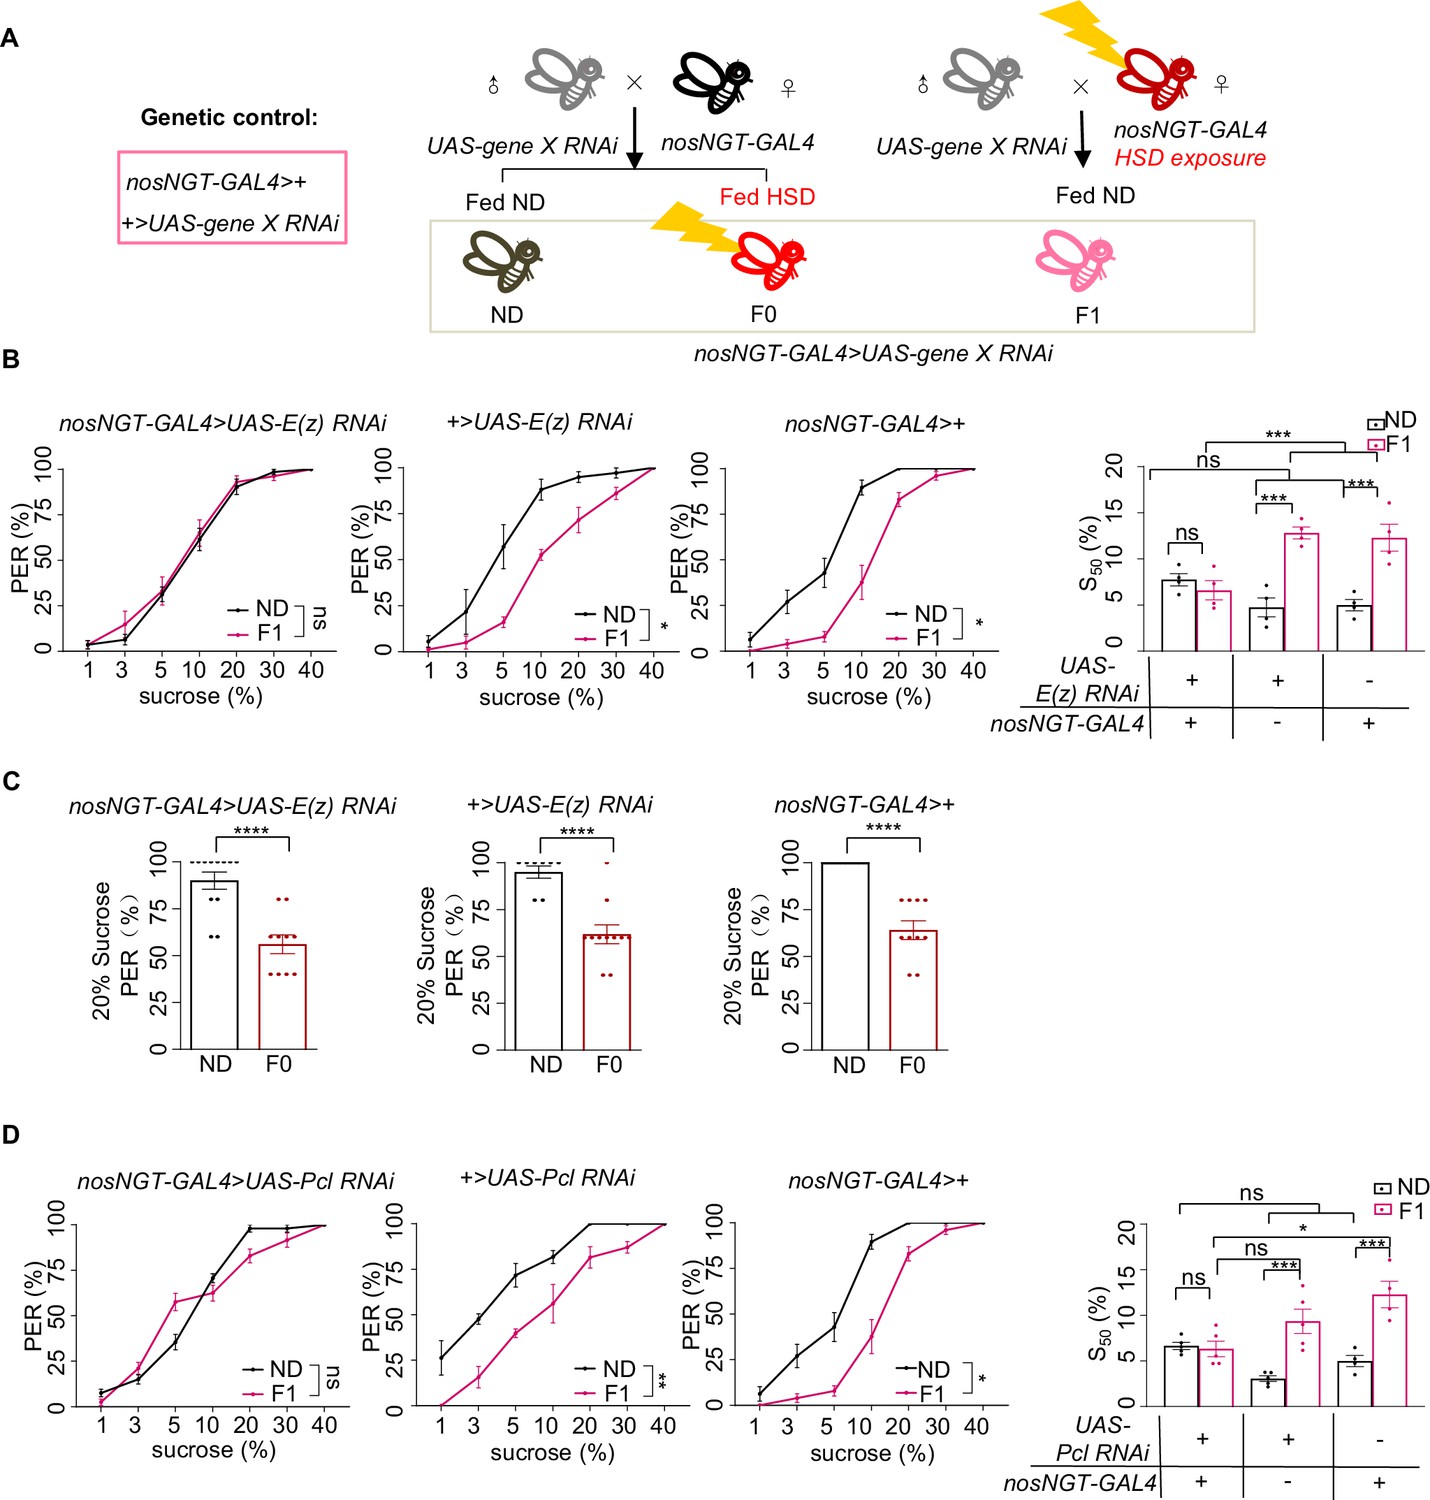
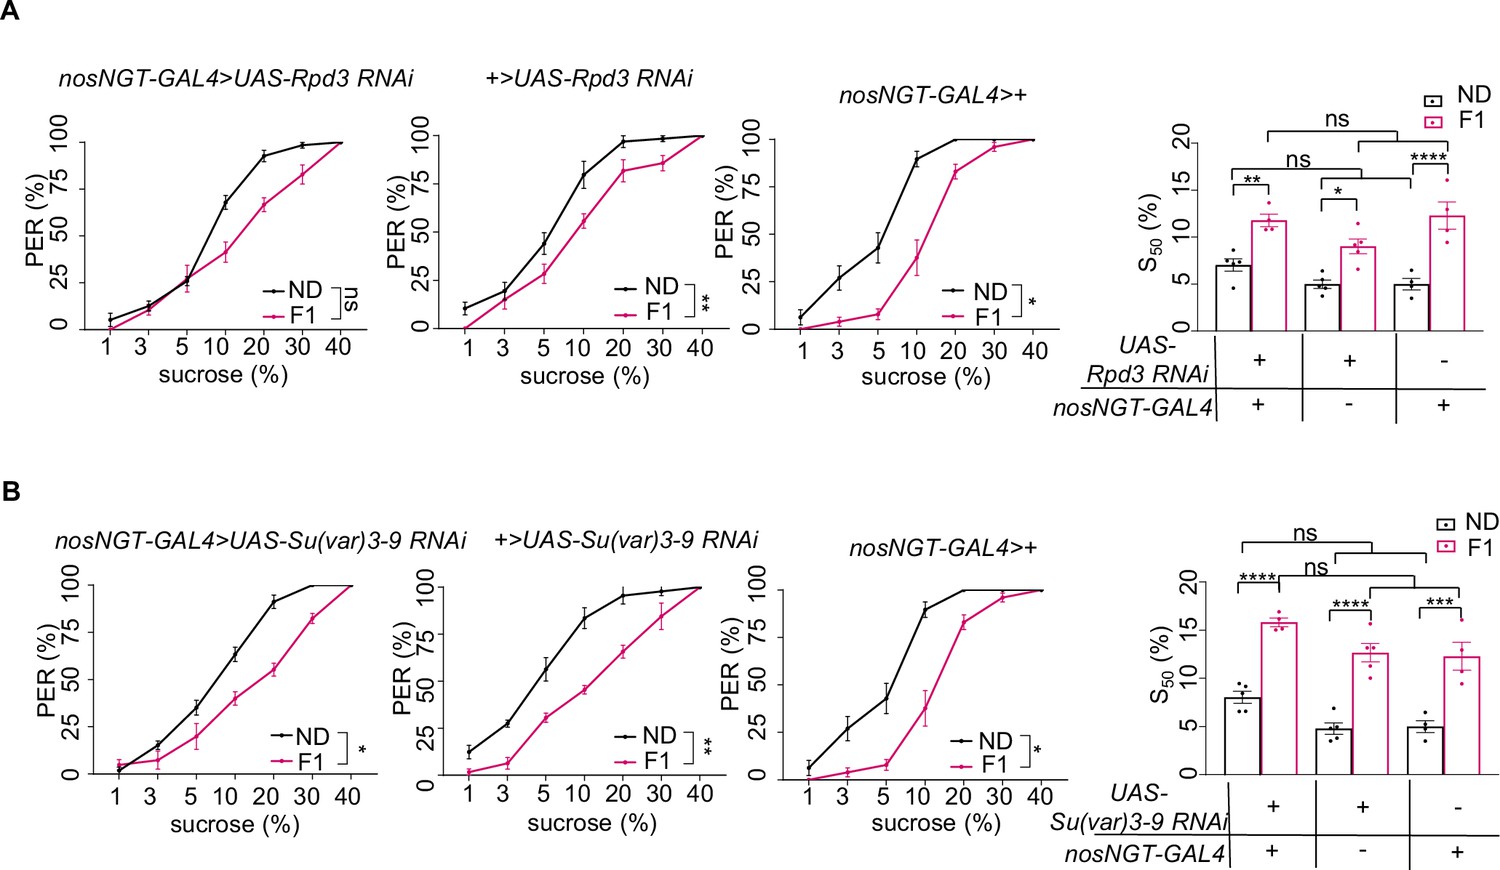
H3K27me3 in the early embryo was required for transgenerational modulation of sweet sensitivity and feeding behavior.
(A) Schematic diagram of PRC2 embryo RNAi experiments. The embryos of nosNGT-GAL4 flies were collected and fed with normal diet (ND) until maturity and mated to UAS-gene X RNAi flies produce the next generation nosNGT-GAL4>UAS gene X RNAi. The next generation fed with ND until maturity is called ND (black, referred to ND controls) and fed with HSD until maturity is called F0 (red referred to HSD-F0). The HSD exposure nosNGT-GAL4 flies (fed with HSD from embryo) mated to UAS-gene X RNAi flies produce the next generation and fed with ND until maturity is called F1 (pink, referred to HSD-F1). These flies were prepared for behavioral assays. (B) Fractions of flies of the indicated genotypes showing proboscis extension reflex (PER) responses to different concentrations of sucrose (n=3–6 biological replicates, each containing 8–12 flies). The S50 indicated the sucrose concentration that induced PER responses in 50% of the tested flies. (C) Fractions of flies of the indicated genotypes showing PER responses to 20% sucrose (n=10–12, each containing 5 flies). (D) Fractions of flies of the indicated genotypes showing PER responses to different concentrations of sucrose (n=3–6 biological replicates, each containing 8–12 flies). The S50 indicated the sucrose concentration that induced PER responses in 50% of the tested flies. Data were shown as means ± SEM. ns p>0.05; *p<0.05; **p < 0.01; ***p < 0.001; ****p < 0.0001.
-
Figure 3—figure supplement 1—source data 1
Raw data of the behavioral experiments shown in Figure 3—figure supplement 1.
- https://cdn.elifesciences.org/articles/85365/elife-85365-fig3-figsupp1-data1-v2.xlsx
Figure 3—figure supplement 2
H3K27ac and H3K9me3 in the early embryo were not required for transgenerational modulation of sweet sensitivity and feeding behavior.
(A–B) Fractions of flies of the indicated genotypes showing proboscis extension reflex (PER) responses to different concentrations of sucrose (n=3–6 biological replicates, each containing 8–12 flies). The S50 indicated the sucrose concentration that induced PER responses in 50% of the tested flies. Data were shown as means ± SEM. ns p>0.05; *p<0.05; **p < 0.01; ***p < 0.001; ****p < 0.0001.
-
Figure 3—figure supplement 2—source data 1
Raw data of the behavioral experiments shown in Figure 3—figure supplement 2.
- https://cdn.elifesciences.org/articles/85365/elife-85365-fig3-figsupp2-data1-v2.xlsx
Figure 3—figure supplement 3
H3K27me3 in the germline was not required for sweet sensitivity and feeding behavior induced by high-sugar diet (HSD) exposure.
(A–B) Fractions of flies of the indicated genotypes showing proboscis extension reflex (PER) responses to different concentrations of sucrose (n=3–6 biological replicates, each containing 8–12 flies). The S50 indicated the sucrose concentration that induced PER responses in 50% of the tested flies. Data were shown as means ± SEM. ns p>0.05; *p<0.05; **p < 0.01; ***p < 0.001; ****p < 0.0001.
-
Figure 3—figure supplement 3—source data 1
Raw data of the behavioral experiments shown in Figure 3—figure supplement 3.
- https://cdn.elifesciences.org/articles/85365/elife-85365-fig3-figsupp3-data1-v2.xlsx
Figure 4 with 1 supplement
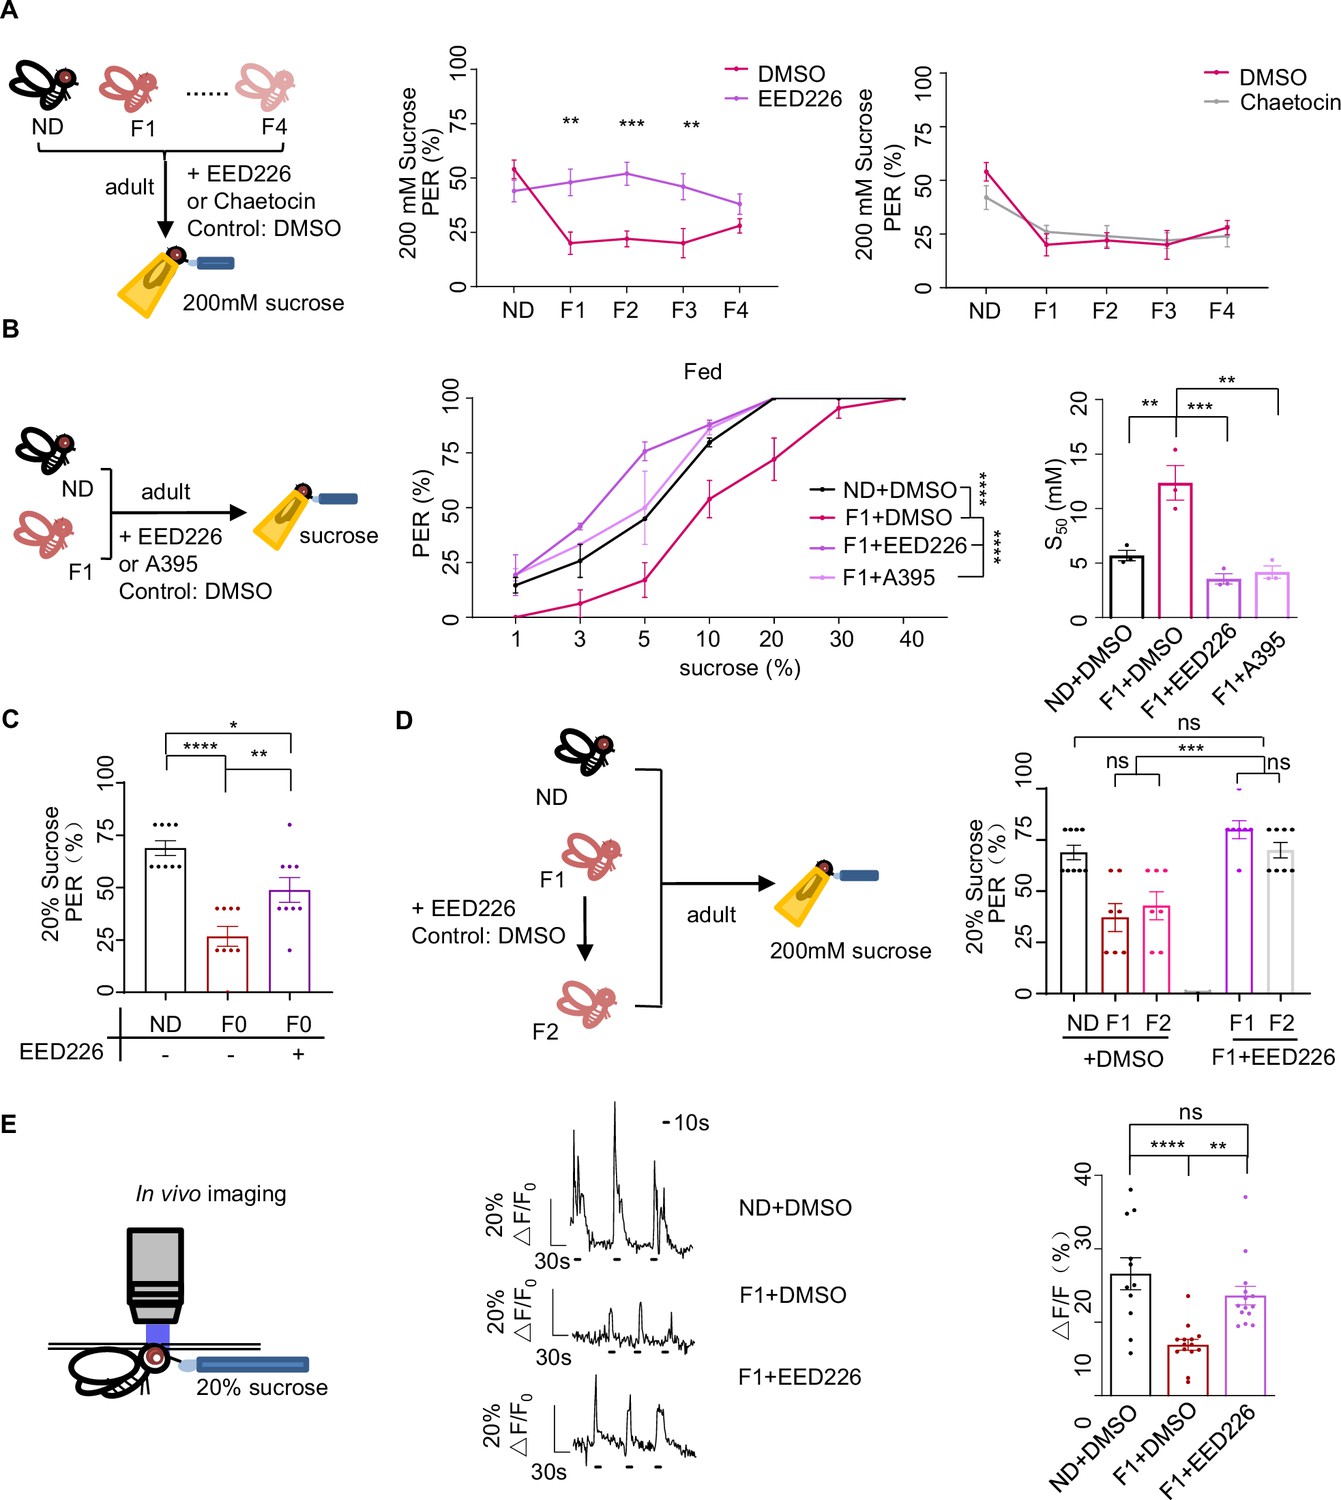
H3K27me3 modifications suppressed sweet sensitivity of Gr5a+ gustatory neurons.
(A) Fractions of flies with or without EED226/Chaetocin feeding showing proboscis extension reflex (PER) responses to 200 mM sucrose (n=10, each containing 5 flies). Schematic diagram of experiments shown on left: normal diet (ND), HSD-F1 to HSD-F4 adult flies were fed with indicated chemicals for 5 days before being tested for PER response. (B) Fractions of flies with or without EED226/A395 feeding showing PER responses to different concentrations of sucrose (n=3–6 biological replicates, each containing 8–12 flies). The S50 indicated the sucrose concentration that induced PER responses in 50% of the tested flies. (C) Fractions of flies with or without EED226 showing PER responses to 20% sucrose (n=9, each containing 5 flies). (D) Fractions of EED226-fed HSD-F1 flies and these offspring (HSD-F2) showing PER responses to 20% sucrose (n=7–9, each containing 5 flies). Schematic diagram of experiments shown on left: HSD-F1 flies were fed with indicated chemicals for 5 days, then transferred to normal medium to lay eggs to obtain HSD-F2 which mother has undergone pharmacologically treated. (E) The calcium signals in Gr5a+ neurons in indicated flies upon 20% sucrose. Schematic diagram of in vivo calcium imaging was shown on left. Representative traces of the calcium responses were shown in middle. Horizontal black bars represent feeding episodes. Quantification of the calcium responses was shown on right (n=13–16). Data were shown as means ± SEM. ns p>0.05; *p<0.05; **p < 0.01; ***p < 0.001; ****p < 0.0001.
-
Figure 4—source data 1
Raw data of the behavioral and Ca2+ imaging experiments shown in Figure 4.
- https://cdn.elifesciences.org/articles/85365/elife-85365-fig4-data1-v2.xlsx
Figure 4—figure supplement 1
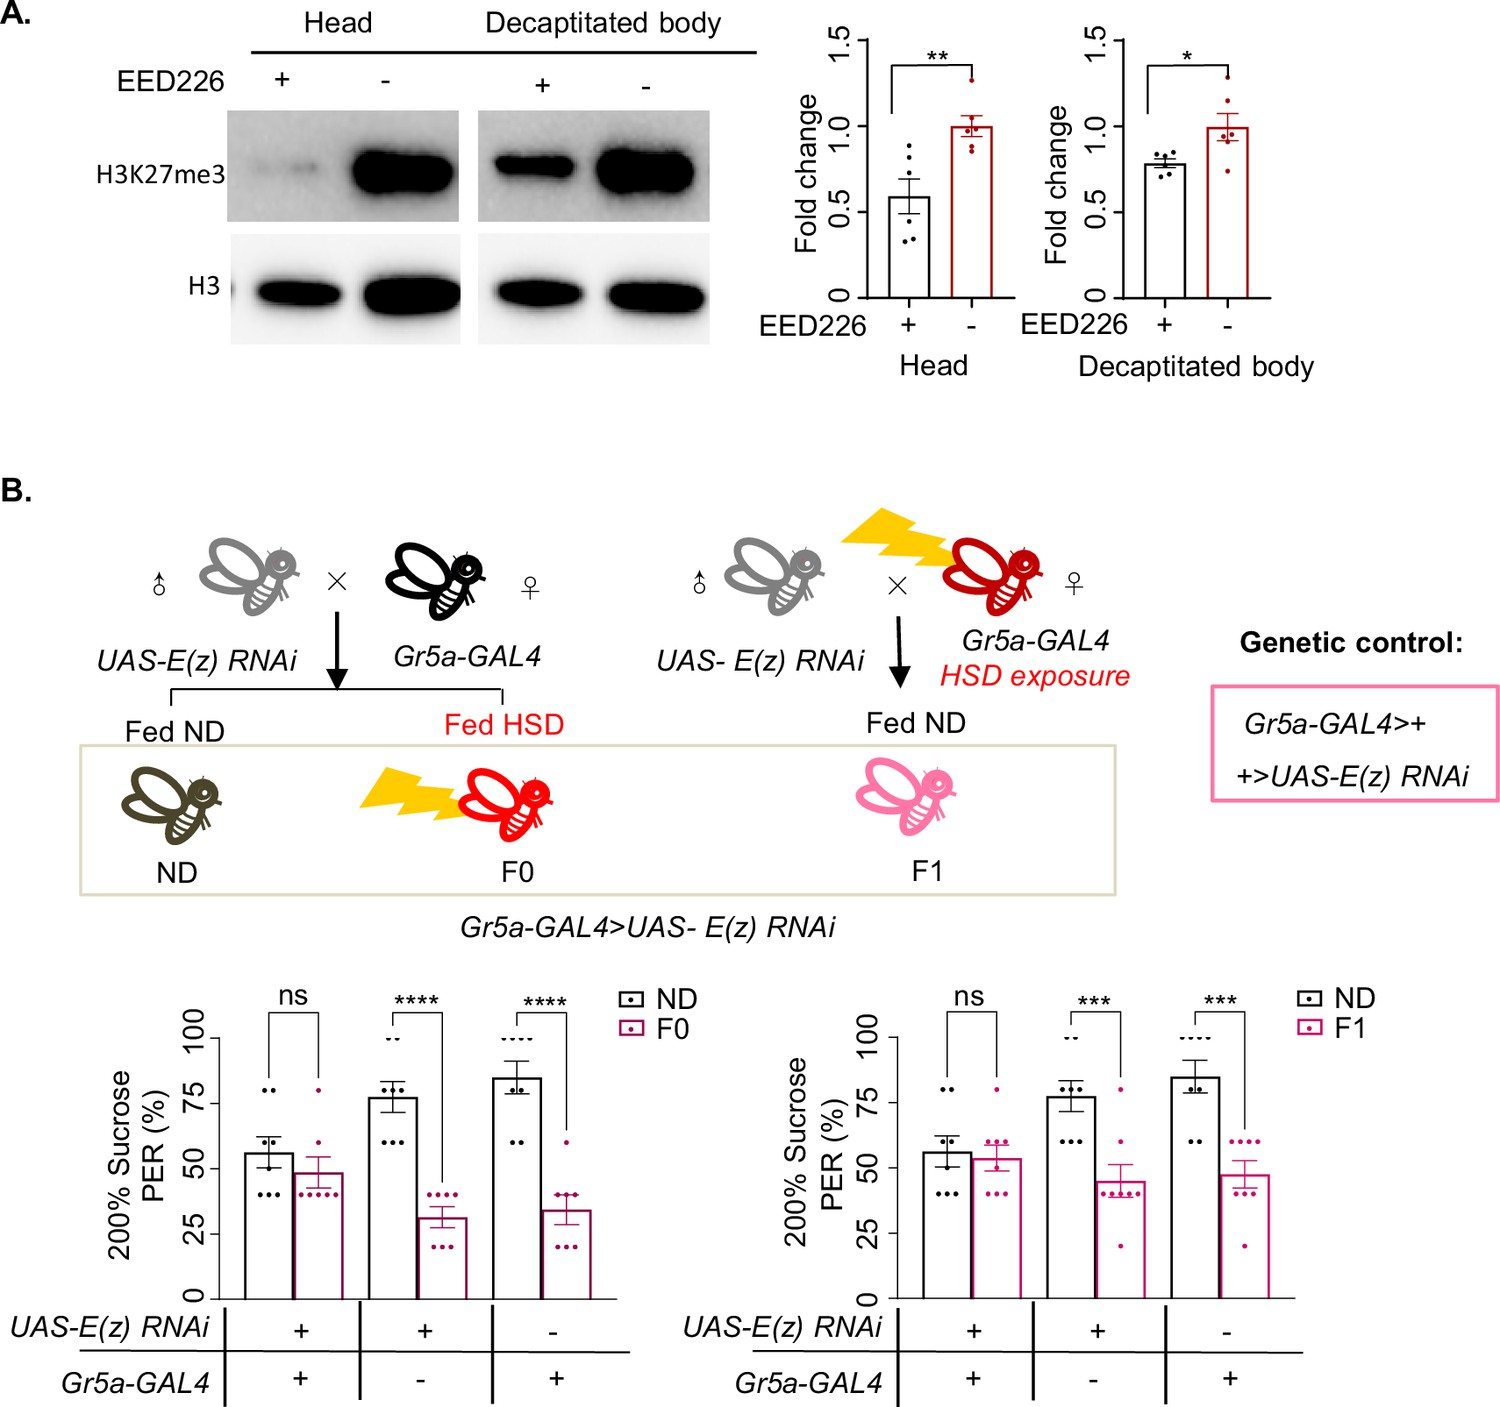
Inhibiting PRC2 in Gr5a+ gustatory neurons rescued sweet sensitivity.
(A) H3K27me3 modification levels of fly heads (left) and decapitated body (right) were analyzed by western blot (n=6 biological replicates, each containing 20 flies). Antibodies against H3K27me3 and H3 proteins were used in the western blot. Flies were fed with indicated chemicals for 5 days. (B) Fractions of flies of the indicated genotypes showing proboscis extension reflex (PER) responses to 20% sucrose (n=8, each containing 5 flies). Schematic diagram of E(z) RNAi in Gr5a+ neuron experiment. Data were shown as means ± SEM. ns p>0.05; *p<0.05; **p < 0.01; ***p < 0.001; ****p < 0.0001.
-
Figure 4—figure supplement 1—source data 1
Raw data of the behavioral and western blot experiments shown in Figure 4—figure supplement 1.
- https://cdn.elifesciences.org/articles/85365/elife-85365-fig4-figsupp1-data1-v2.xlsx
Figure 5 with 2 supplements
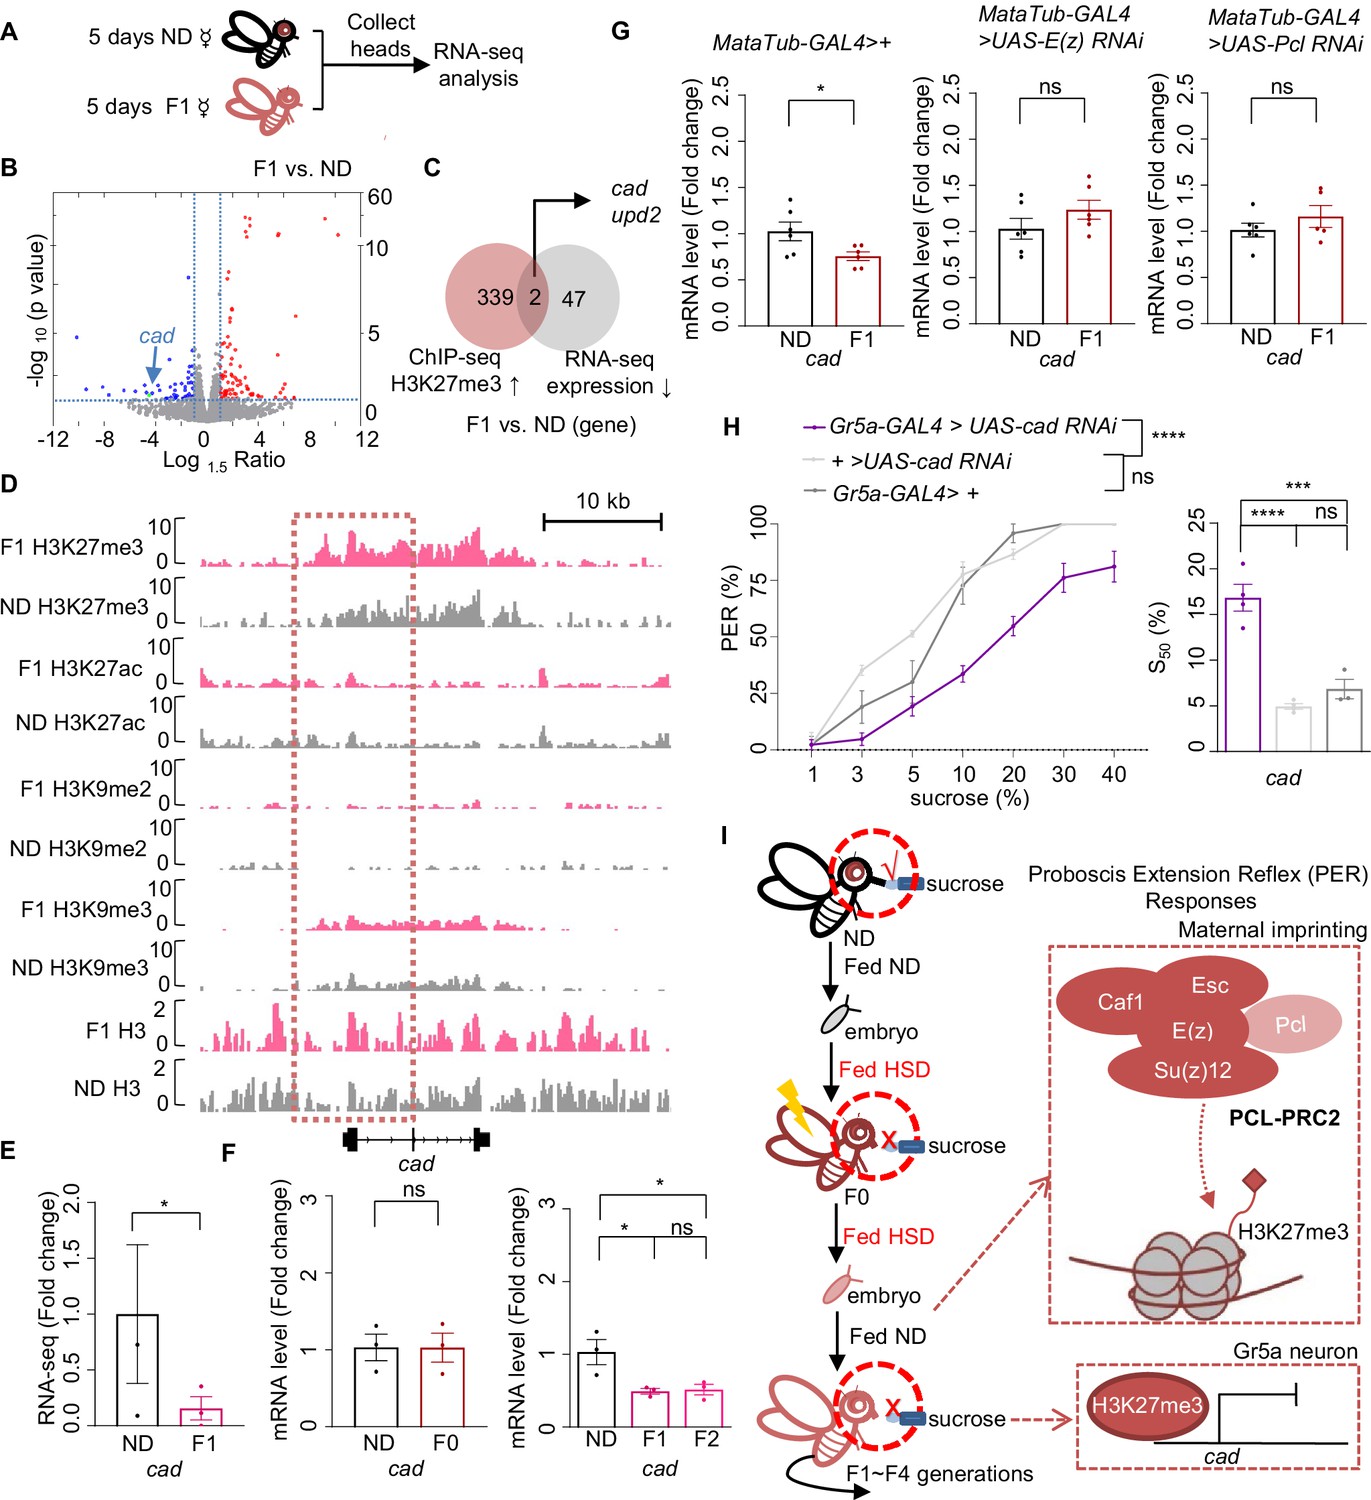
Cad mediated the inhibitory effect of H3K27me3 modifications on sweet sensitivity and feeding behavior.
(A) Preparation of RNA samples for RNA-seq. (B) Volcano plot showed differentially expressed genes between normal diet (ND) and HSD-F1 flies (blue: downregulated genes in HSD-F1 flies; red: upregulated genes in HSD-F1 flies; green: cad). The horizontal line indicated the significance threshold (p=0.05) and the vertical lines indicated the 1.5-fold change threshold. (C) Venn diagram of downregulated genes and H3K27me3-target genes between ND and HSD-F1 flies (gray: downregulated genes in the heads of HSD-F1 flies via RNA-seq analysis, fold change >1.5; red: H3K27me3-target genes in HSD-F1 embryos via chromatin-immunoprecipitation followed by sequencing [ChIP-seq] analysis, log10 likelihood ratio >1). (D) Genome browser view of H3K27me3, H3K27ac, H3K9me2, H3K9me3, and H3 density around the cad gene in embryos of ND and HSD-F1 flies. (E–G) mRNA expression levels of cad in indicated flies. Fly heads were collected and subjected to RNA-seq (E) (n=3 biological replicates, each containing 15 fly heads) or quantitative RT-PCR (F and G) (n=3–6 biological replicates, each containing 15 fly heads). (H) Fractions of flies of the indicated genotypes showing PER responses to different concentrations of sucrose (n=3–6 biological replicates, each containing 8–12 flies). The S50 indicated the sucrose concentration that induced PER responses in 50% of the tested flies. (I) A working model: Upon ancestral HSD exposure, PCL-PRC2 complex was activated and maintained high levels of H3K27me3 imprinting in maternal germline and the offspring. H3K27me3 targeted cad promoter regions and suppressed its expression, resulting in an inhibitory effect in Gr5a+ sweet-sensing gustatory neurons. Consequently, both sweet sensitivity and feeding behavior in the offspring were suppressed. Data are shown as means ± SEM. ns p>0.05; *p<0.05; **p < 0.01; ***p < 0.001; ****p < 0.0001.
-
Figure 5—source data 1
Raw data of the RNA-seq, qPCR, and behavioral experiments shown in Figure 5.
- https://cdn.elifesciences.org/articles/85365/elife-85365-fig5-data1-v2.xlsx
Figure 5—figure supplement 1
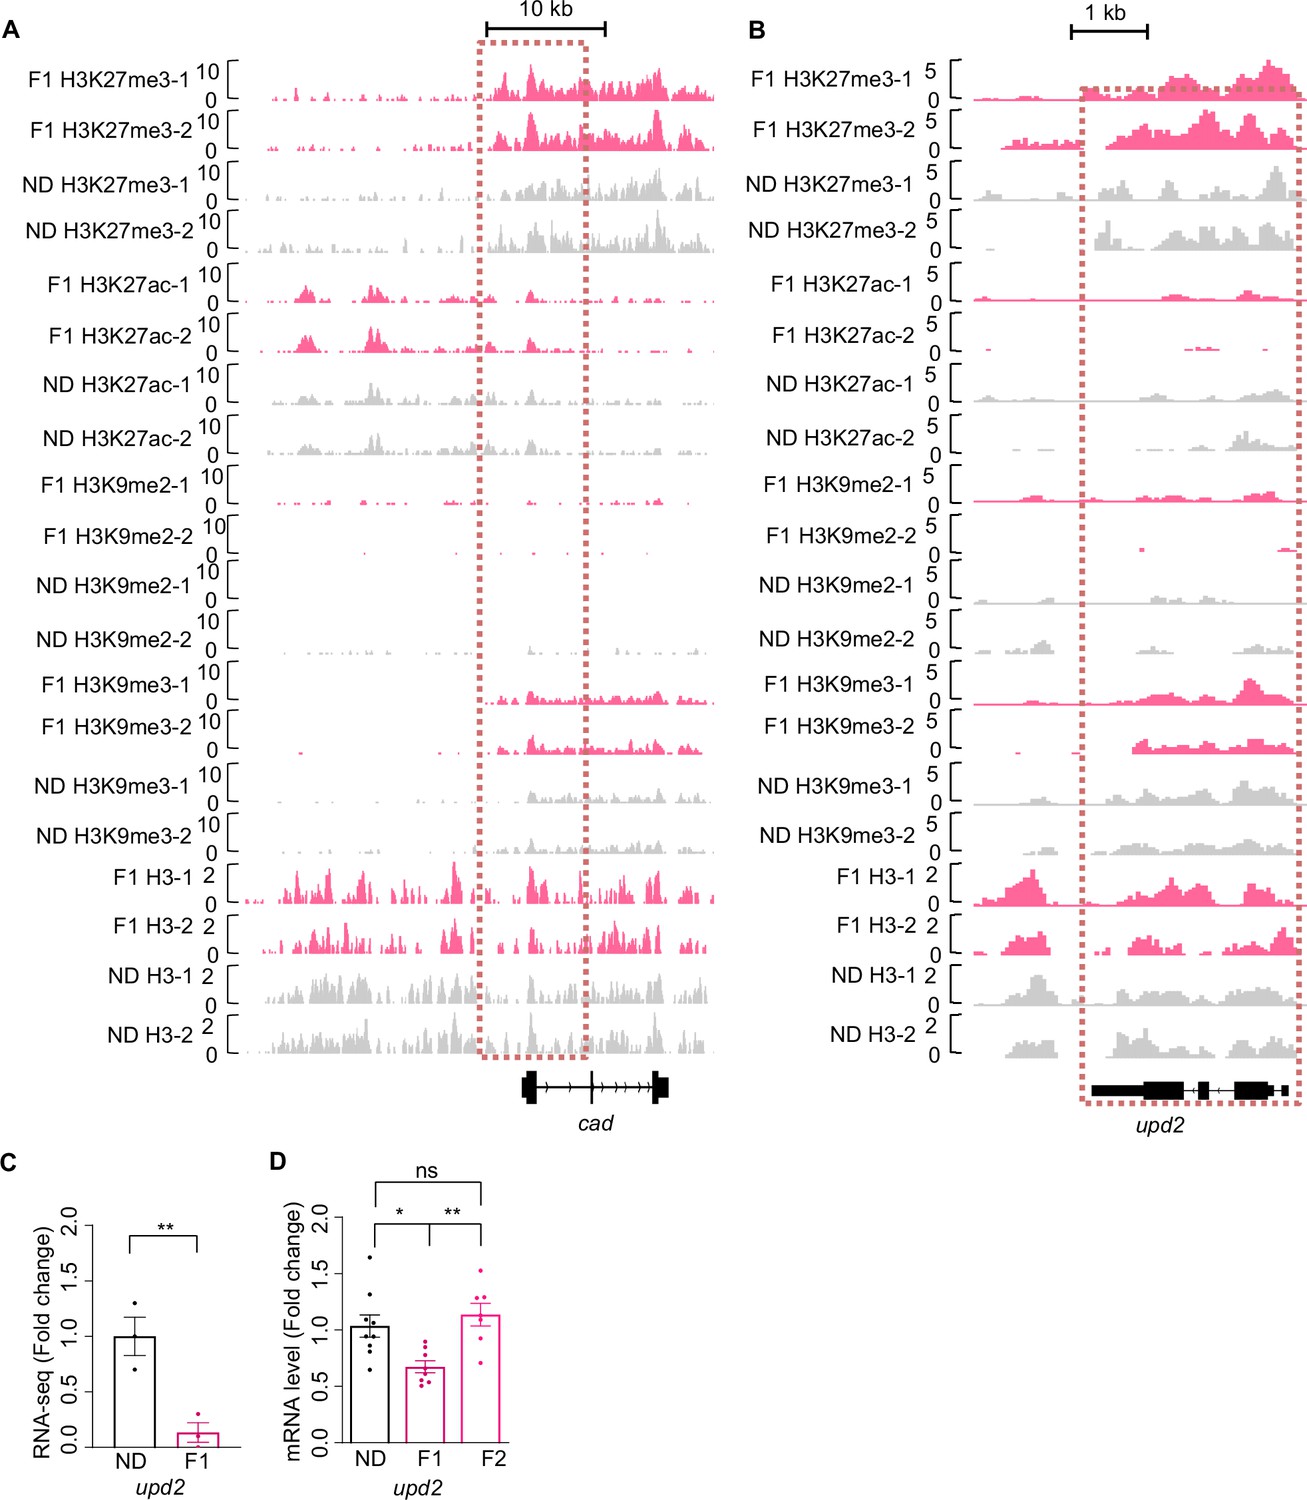
H3K27me3 modifications and mRNA expression of cad and upd2 genes upon ancestral high-sugar diet (HSD) exposure.
(A–B) Genome browser view of H3K27me3, H3K27ac, H3K9me2, H3K9me3, and H3 density at the cad (A) and upd2 (B) genes in embryos of normal diet (ND) and HSD-F1 flies. (C–D) mRNA expression levels of upd2 in indicated flies. The fly heads were collected and subjected to RNA-seq (C) (n=3 biological replicates, each containing 15 fly heads) or quantitative RT-PCR (D) (n=6–9 biological replicates, each containing 15 flies). Data were shown as means ± SEM. ns p>0.05; *p<0.05; **p < 0.01; ***p < 0.001; ****p < 0.0001.
-
Figure 5—figure supplement 1—source data 1
Raw data of the RNA-seq and qPCR experiments shown in Figure 5—figure supplement 1.
- https://cdn.elifesciences.org/articles/85365/elife-85365-fig5-figsupp1-data1-v2.xlsx
Figure 5—figure supplement 2
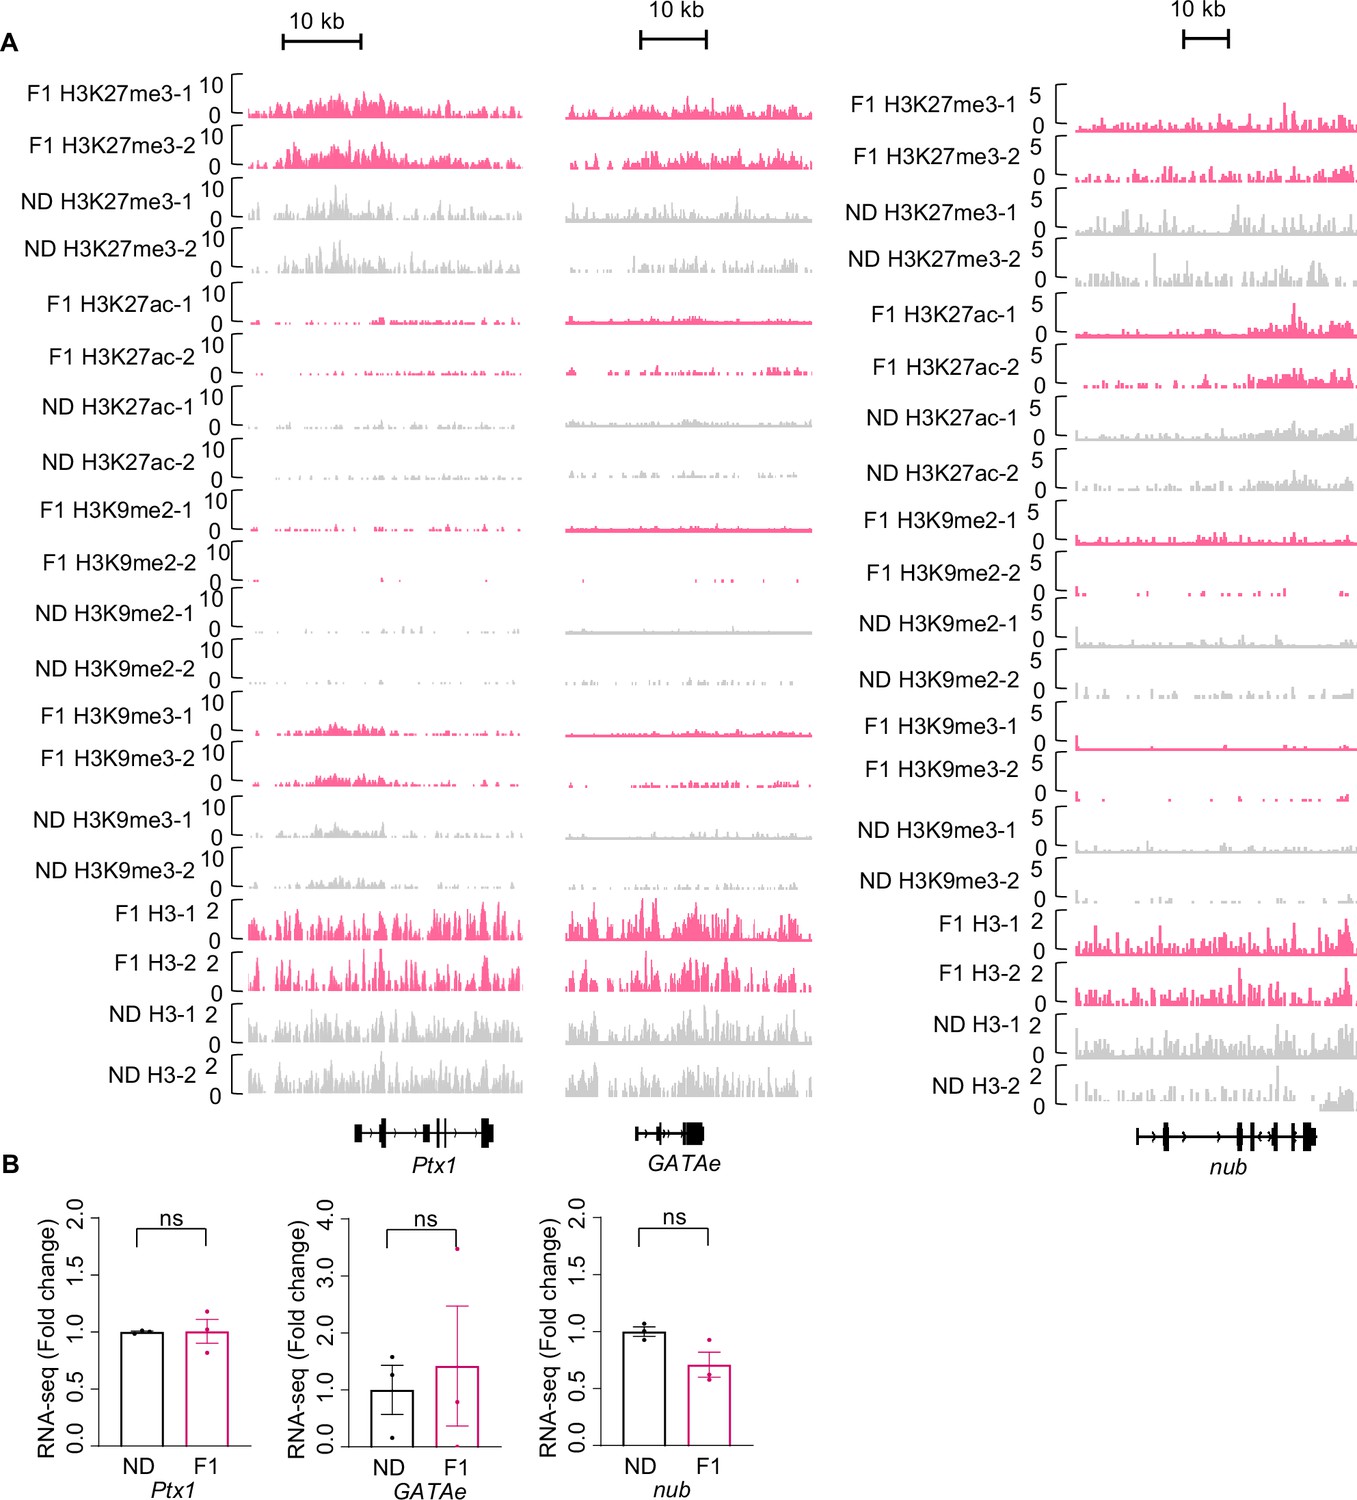
H3K27me3 modifications and mRNA expression of Ptx1, GATAe, and nub upon ancestral high-sugar diet (HSD) exposure.
(A) Genome browser view of H3K27me3, H3K27ac, H3K9me2, H3K9me3, and H3 density at the Ptx1 (left), GATAe (middle), and nub (right) genes in embryos of normal diet (ND) and HSD-F1 flies. (B) mRNA expression levels of Ptx1, GATAe, and nub in indicated flies. The fly heads were collected and subjected to RNA-seq (n=3 biological replicates, each containing 15 fly heads). Data were shown as means ± SEM. ns p>0.05.
-
Figure 5—figure supplement 2—source data 1
Raw data of the RNA-seq experiments shown in Figure 5—figure supplement 2.
- https://cdn.elifesciences.org/articles/85365/elife-85365-fig5-figsupp2-data1-v2.xlsx
Tables
Key resources table
| Reagent type (species) or resource | Designation | Source or reference | Identifiers | Additional information |
|---|---|---|---|---|
| Genetic reagent (D. melanogaster) | nosNGT-GAL4 | Bloomington Drosophila Stock Center | Cat: #31777 RRID:BDSC_31777 | FlyBase symbol: P{Gal4-nos.NGT}40 |
| Genetic reagent (D. melanogaster) | Maternal-tubulin-Gal4 | Bloomington Drosophila Stock Center | Cat: #2318 PMID:23105012 | FlyBase symbol: P{matα4-GAL-VP16} |
| Genetic reagent (D. melanogaster) | UAS-GCaMP6m | Bloomington Drosophila Stock Center | Cat: #42748 RRID:BDSC_42748 | FlyBase symbol: w[1118]; P{y[+t7.7] w[+mC]=20XUAS-IVS-GCaMP6m}attP40 |
| Genetic reagent (D. melanogaster) | Gr5a-GAL4 | Bloomington Drosophila Stock Center | Cat: #57592; RRID:BDSC_57592 | FlyBase symbol: w[*]; P{w[+mC]=Gr5a-GAL4.8.5}6; Dr[1]/TM3, Sb |
| Genetic reagent (D. melanogaster) | UAS-E(z) RNAi | Tsinghua Fly Center | Cat: #2831 | |
| Genetic reagent (D. melanogaster) | UAS-Su(var)3–9 RNAi | Tsinghua Fly Center | Cat: #3558 | |
| Genetic reagent (D. melanogaster) | UAS-Rpd3 RNAi | Tsinghua Fly Center | Cat: #0695 | |
| Genetic reagent (D. melanogaster) | UAS-cad RNAi | Tsinghua Fly Center | Cat: #03,877.N | |
| Antibody | Anti-Histone H3 (di methyl K9) mouse polyclonal | Abcam | Cat: #ab1220 RRID:AB_449854 | ChIP-seq 10 μg |
| Antibody | Anti-acetyl histone-h3-k27 rabbit polyclonal | Abcam | Cat: #ab4729 RRID:AB_2118291 | ChIP-seq 10 μg |
| Antibody | Anti-Histone H3 (tri methyl K27) mouse polyclonal | Abcam | Cat: #ab6002 RRID:AB_305237 | ChIP-seq 10 μg |
| Antibody | Anti-Histone H3 (tri methyl K9) rabbit polyclonal | Abcam | Cat: #ab8898 RRID:AB_306848 | ChIP-seq 10 μg |
| Antibody | Anti-Histone H3 antibody rabbit polyclonal | Abcam | Cat: #ab1791 RRID:AB_302613 | ChIP-seq 10 μg WB 1:1000 |
| Antibody | Anti-Histone H3 (tri methyl K27) rabbit polyclonal | Jingjie PTM BioLab | Cat: #PTM-647RM | WB 1:1000 IF 1:200 |
| Antibody | Anti-rabbit IgG, HRP-linked Antibody goat polyclonal | Jackson ImmunoResearch Laboratories Inc | Cat: #111-035-003 RRID: AB_2313567 | WB 1:1000 |
| Antibody | Anti-Histone H3 (tri methyl K27) mouse polyclonal | Jingjie PTM BioLab | Cat: #PTM-5002 | WB 1:1000 IF 1:200 |
| Antibody | Goat anti-mouse IgG (H+L) Cross-Adsorbed Secondary Antibody, Alexa Fluor 488 goat polyclonal | Invitrogen | Cat: #a11001 RRID: AB_2534069 | IF 1:1000 |
| Antibody | Goat anti-Rabbit IgG (H+L) Highly Cross-Adsorbed Secondary Antibody, Alexa Fluor 633 goat polyclonal | Invitrogen | Cat: #a21071 RRID: AB_2535732 | IF 1:1000 |
| Chemical compound | Fluoroshield with DAPI | Sigma-Aldrich | Cat: #F6057 | 10 μL |
| Chemical compound | EED226 | Selleck | Cat: #S8496 | 5 μM |
| Chemical compound | Chaetocin | Selleck | Cat: #S8068 | 5 μM |
| Chemical compound | A-395 | Sigma-Aldrich | Cat: #SML1923 | 10 μM |
| Commercial assay or kit | Graduated glass capillary | VWR | Cat: #53432-604 | |
| Commercial assay or kit | Triglyceride Quantification Colorimetric/Fluorometric Kit | Nanjing Jiancheng Bioengineering Institute | Cat: #A110-1-1 | |
| Commercial assay or kit | Liver/Muscle glycogen assay kit | Nanjing Jiancheng Bioengineering Institute | Cat: #A043-1-1 | |
| Commercial assay or kit | Trehalose quantification kit | Nanjing Jiancheng Bioengineering Institute | Cat: #A149-1-1 | |
| Commercial assay or kit | MOPS Running Buffer Powder MOPS | GenScript Biotech Corporation | Cat: #M00138 | for Western blotting |
| Commercial assay or kit | ExpressPlus PAGE Gel,10×8, 4–20%, 15 wells | GenScript Biotech Corporation | Cat: #M42015c | for Western blotting |
| Commercial assay or kit | SDS-PAGE Sample Loading Buffer,5× | Biosharp | Cat: #BL502A | for Western blotting |
| Commercial assay or kit | Affinity ECL kit(picogram) | Affinity | Cat: #KF8001 | for Western blotting |
| Commercial assay or kit | Goat Serum | Beyotime | Cat: #C0265 | for Western blotting |
| Chemical compound | Hexanoic acid | macklin | Cat: #H810882 | |
| Chemical compound | Sucrose | Sigma-Aldrich | Cat: #S0389 | |
| Chemical compound | NaCl | Sigma-Aldrich | Cat: #S3014 | |
| Chemical compound | CaCl2 | Sigma-Aldrich | Cat: #C5670 | |
| Chemical compound | MgCl2 | Sigma-Aldrich | Cat: #M4880 | |
| Chemical compound | KCl | Sigma-Aldrich | Cat: #P9541 | |
| Chemical compound | HEPES | Sigma-Aldrich | Cat: #54457 | |
| Chemical compound | NaHCO3 | Sigma-Aldrich | Cat: #S5761 | |
| Chemical compound | NaH2PO4 | Sigma-Aldrich | Cat: #S3139 | |
| Software, algorithm | Fiji/ImageJ | NIH | https://imagej.nih.gov/ij/download.html | |
| Software, algorithm | Rstudio | https://www.rstudio.com/ | ||
| Software, algorithm | GraphPad Prism 9 | GraphPad Software | https://www.graphpad.com/scientificsoftware/prism/ | |
| Software, algorithm | R version 3.6 and 4.0 | Camp Pontanezen – The R Foundation for Statistical Computing | https://www.r-project.org/ | |
| Software, algorithm | Bowtie2 version 2.3.5.1 | https://bowtie-bio.sourceforge.net/bowtie2/index.shtml | ||
| Software, algorithm | samtools version 1.10. | http://www.htslib.org/ | ||
| Software, algorithm | deeptools version 3.3.1 | https://deeptools.readthedocs.io/en/develop/ | ||
| Software, algorithm | IGV version 2.4.13 | https://software.broadinstitute.org/software/igv/download |
Additional files
-
Supplementary file 1
H3K27me3 upregulation and downregulation regions in the early embryo upon ancestral high-sugar diet (HSD) exposure (log10 likelihood ratio >3).
The cycle 10–12 embryos of HSD-F1 vs. normal diet (ND) flies were collected and subjected to chromatin-immunoprecipitation followed by sequencing (ChIP-seq) analysis. The difference peaks of ChIP-seq data were found by using model-based analysis of ChIP-seq 2 (MACS2) with the options ‘bdgdiff’. The cutoff is log10 likelihood ratio >3 (n=2 biological replicates, each containing 1000 embryos).
- https://cdn.elifesciences.org/articles/85365/elife-85365-supp1-v2.xlsx
-
Supplementary file 2
H3K27me3 upregulation and downregulation regions in the early embryo upon ancestral high-sugar diet (HSD) exposure (log10 likelihood ratio >1).
The original data of this experiment were from the same batch as Supplementary file 1, but the differential peaks were reanalyzed. The cutoff is log10 likelihood ratio >1 (n=2 biological replicates, each containing 1000 embryos).
- https://cdn.elifesciences.org/articles/85365/elife-85365-supp2-v2.xlsx
-
Supplementary file 3
Differentially expressed genes in the adult head tissues upon ancestral high-sugar diet (HSD) exposure.
The head tissues of HSD-F1 vs. normal diet (ND) flies were collected and subjected to RNA-seq analysis. The difference gene of RNA-seq data were found by using DEseq2. The cutoff is p-value less than 0.05 and |log1.5fold change| more than 1 (n=3 biological replicates, each containing 15 fly heads).
- https://cdn.elifesciences.org/articles/85365/elife-85365-supp3-v2.xlsx
-
MDAR checklist
- https://cdn.elifesciences.org/articles/85365/elife-85365-mdarchecklist1-v2.pdf
Download links
A two-part list of links to download the article, or parts of the article, in various formats.
Downloads (link to download the article as PDF)
Open citations (links to open the citations from this article in various online reference manager services)
Cite this article (links to download the citations from this article in formats compatible with various reference manager tools)
Exposure to high-sugar diet induces transgenerational changes in sweet sensitivity and feeding behavior via H3K27me3 reprogramming
eLife 12:e85365.
https://doi.org/10.7554/eLife.85365


