Treatment with tumor-treating fields (TTFields) suppresses intercellular tunneling nanotube formation in vitro and upregulates immuno-oncologic biomarkers in vivo in malignant mesothelioma
- Department of Medicine, Division of Hematology, Oncology and Transplantation, University of Minnesota, United States
- Department of Obstetrics, Gynecology and Women's Health, University of Minnesota, United States
- Department of Genetics, Cell Biology and Development, University of Minnesota, United States
- Department of Medicine, Division of Gastroenterology, Hepatology and Nutrition, University of Minnesota, United States
- Novocure Ltd, Topaz Building, MATAM Center, Israel
- Graduate Faculty, Integrative Biology and Physiology Department, University of Minnesota, United States
Figures
Figure 1 with 5 supplements
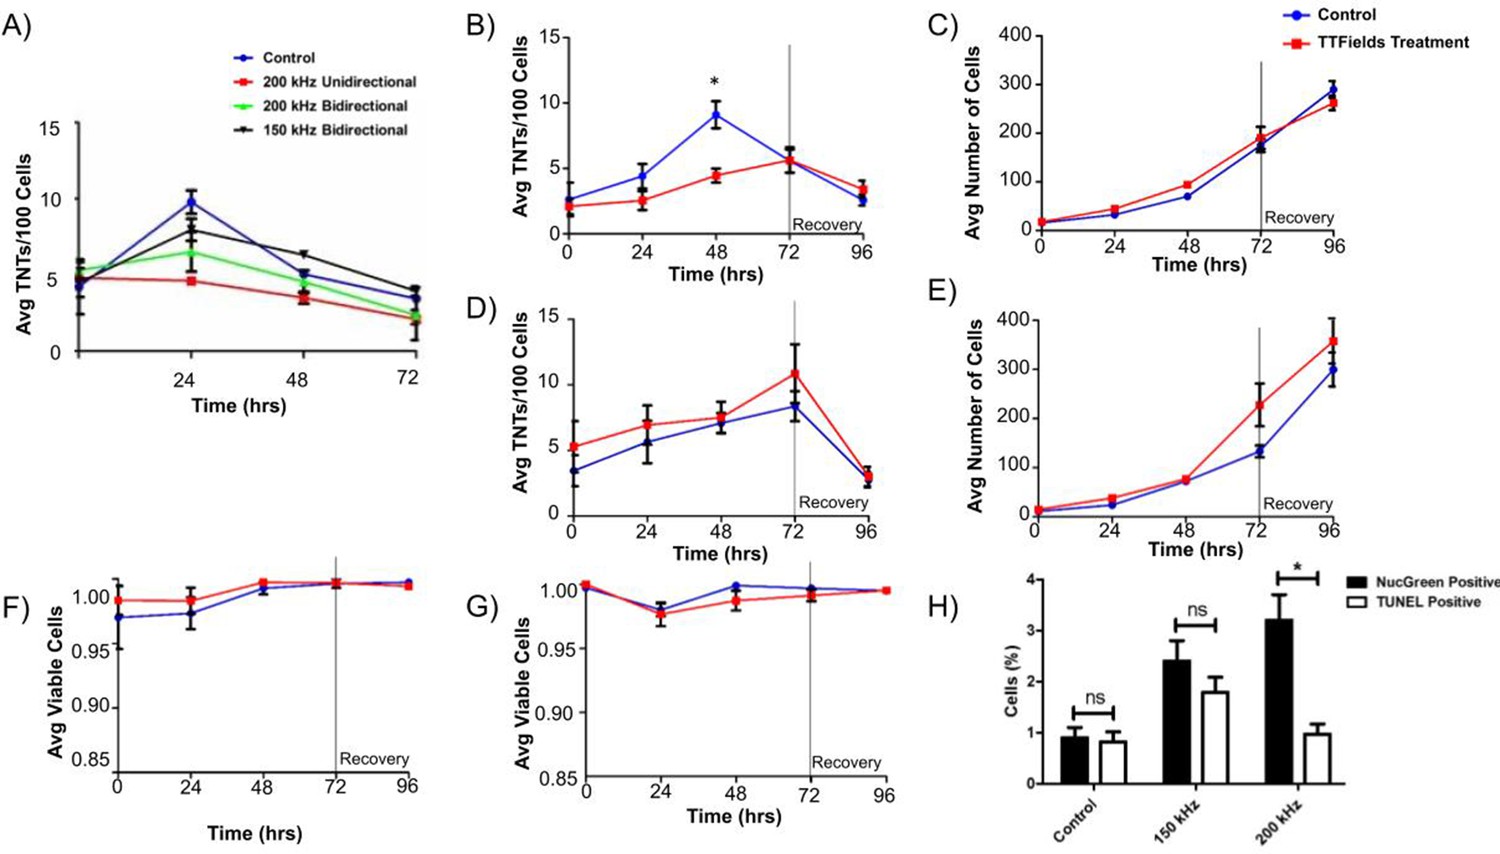
TNT formation, cell growth, and cell viability of MSTO-211H and VAMT malignant mesothelioma cells.
(A) TNT formation in MSTO-211H following continuous TTFields exposure at 1.0 V/cm while varying frequency and field direction. 40,000 MSTO-211H cells were plated in a 35 mm dish and exposed to TTFields treatment at 1.0 V/cm with the above varying parameters; media was changed every 24 hours. Additional data for 150 kHz Unidirectional treatment are available in Figure 1—figure supplement 1. (B–C) TNT formation and cell growth in MSTO-211H following TTFields exposure when compared to control. As above, 40,000 cells were plated and were exposed continuously to TTFields bidirectionally; at 72 hr, TTFields treatment was discontinued to assess recovery of TNT formation (n=3). (D–E) TNT formation and cell growth in VAMT following TTFields exposure with methodology as listed in B-C (n=3). (F–G) Cell viability in both MSTO-211H (F) and VAMT (G) respectively following TTFields exposure. Cell viability and cytotoxicity was measured through NucGreen Dead 488 expression, which assesses loss of plasma membrane integrity. Seven random fields of view were selected and the ratio of live:dead cells was recorded (n=3). (H) Cell viability measured by TUNEL assay and NucGreen Dead 488 expression in MSTO-211H exposed to TTFields at 150 and 200 kHz. MSTO-211H cells were treated with TTFields for 48 hr at either 150 kHz or 200 kHz. At the 48 hr time point, cell viability was measured through the TUNEL assay or through measuring fluorescent expression of Nuc Green Dead 488. The percentage of nonviable cells was graphed as compared to a control. A representative image of TUNEL positive control is displayed in Figure 1—figure supplement 2. Statistical significance was assessed as a result of three independent experiments, with a linear mixed model used in A and heteroscedastic t-test used in B.
Figure 1—figure supplement 1

TNT formation in MSTO-211H following TTFields unidirectional delivery at 150 kHz (1 V/cm).
As in Figure 1A, 40,000 MSTO-211H cells were seeded in a 35 mm dish and exposed to TTFields unidirectionally over 72 hr; media was changed every 24 hr (n=3).
Figure 1—figure supplement 2
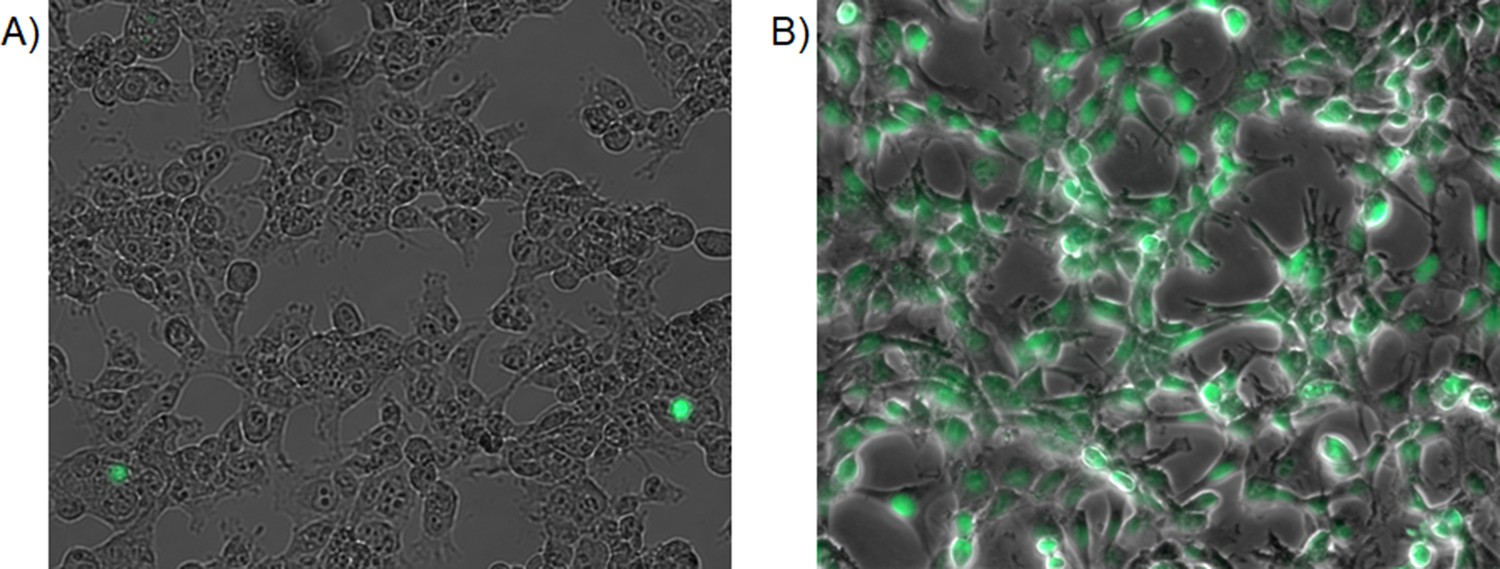
Representative images of the TUNEL assay in MSTO-211H.
(A) TUNEL assay in MSTO-211H after 48 hr of TTFields application, or (B) DNaseI treated positive control. Images were taken on a Zeiss AxioObserver M1 at 20 X, with spatial resolution (dx = dy) at 0.335 um/pixel, and processed using Zen Pro 2012 software.
Figure 1—figure supplement 3
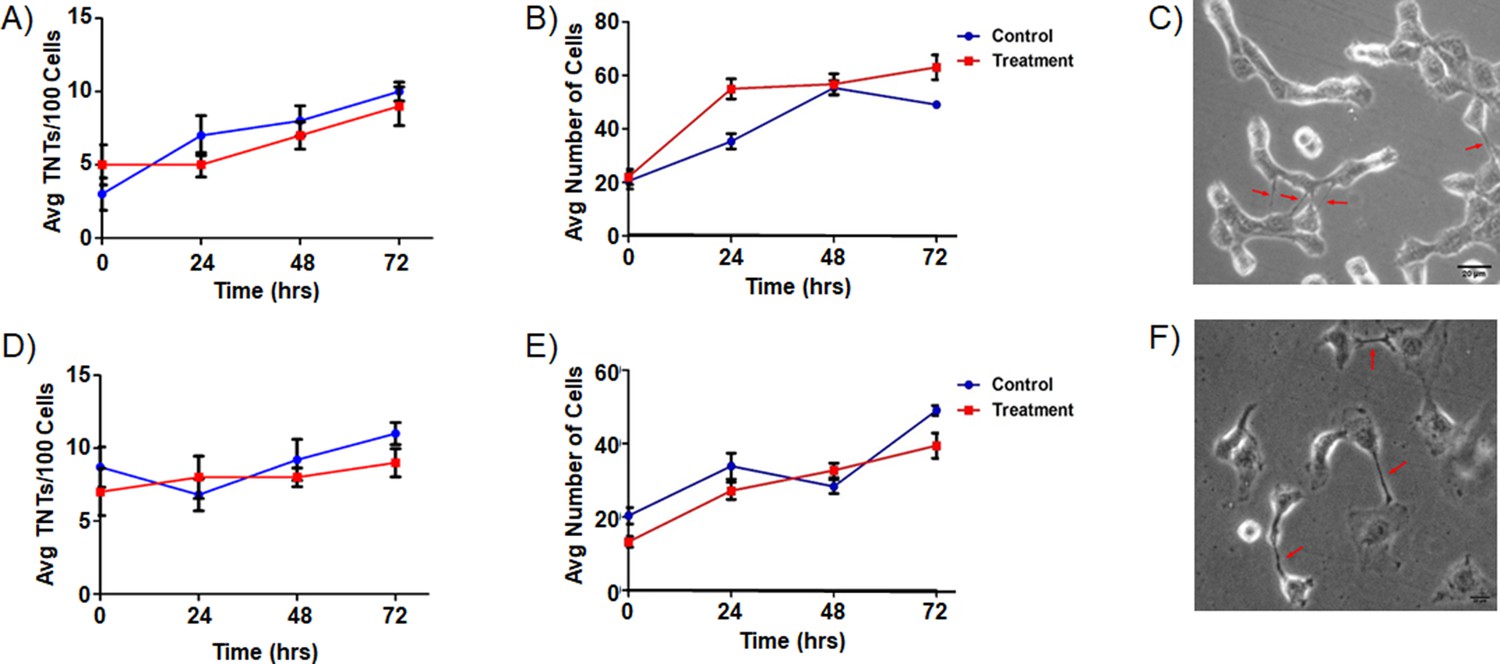
TTFields delivered at low intensity (0.5 V/cm) have no effect on TNT formation or on cell proliferation in MSTO-211H or VAMT mesothelioma cells.
TNT formation and (B) cell growth in MSTO-211H with TTFields delivered at 0.5 V/cm, 200 kHz. (C) MSTO cells. Arrows point to TNTs. (D) TNT formation and (E) cell growth in VAMT with TTFields delivered at 0.5 V/cm, 200 kHz. (F) VAMT cells. Arrows indicate TNTs.
Figure 1—figure supplement 4

TNT formation and cell growth in MSTO-211H after 48 hr of TTFields exposure (1 V/cm, 400 kHz).
(A) 40,000 MSTO-211H cells were seeded in a 35 mm dish and treated with TTFields for 48 hr to assess effects of increased frequency on TNT formation (n=3). The 48 hr time point was chosen based on our previous findings demonstrating maximal TNT suppression in MSTO-211H at 48 hr. (B) Cell growth in MSTO-211H after 48 hrof TTFields exposure at 400 kHz, 1 V/cm (n=3). ns = not significant.
Figure 1—figure supplement 5

Cell count in MSTO-211H at 1 V/cm, 200 kHz, and seeded at 10,000 cells.
(A) MSTO-211H cells were seeded at 10,000 cells/ml and treated with TTFields with the above specified parameters for 96 hr. Cell count was measured every 24 hours, starting at the 48 hr time point (n=3). Significance was assessed by heteroscedastic t-tests on three independent experiments, p=0.003 at 96 hr and p=0.048 at 72 hr. (B) Representative images of MSTO-211H cells at the 48, 72, 96 hr time points.
Figure 2
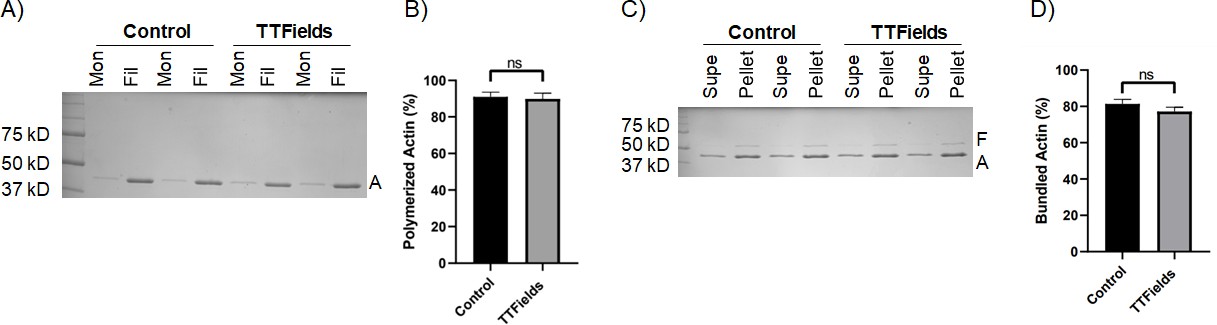
The effect of TTFields application on actin polymerization and actin filament bundling.
(A, B) Sedimentation assays quantifying actin polymerization. Purified actin monomers were polymerized for 1 hr with TTFields (200 kHz, 1.0 V/cm, 37 °C) and without TTFields (37 °C) treatment. Reactions were centrifuged at 100,000 x g to pellet filamentous actin and analyzed by SDS-PAGE. Mon refers to monomeric actin (supernatant), Fil refers to filamentous actin (pellet). A indicates the actin protein band (42 kDa). (C, D) Co-sedimentation assays quantifying bundling of actin filaments by the bundling protein fascin. Pre-polymerized actin filaments were incubated with fascin for 1 hr with TTFields (200 kHz, 1.0 V/cm, 37 °C) and without TTFields (37 °C) treatment. Reactions were spun at low-speed (10,000 x g) to pellet bundles and analyzed by SDS-PAGE. The supernatant contains monomeric actin and individual filaments. The pellet contains bundled actin. F, A indicate fascin (55 kDa) and actin (42 kDa) protein bands. The gels (A, C) represent one representative experiment. The graphs (B, D) represent the average of three experiments, and the error bars are the standard deviation.
-
Figure 2—source data 1
Source data for results shown in Figure 2, titled ‘The effect of TTFields application on actin polymerization and actin filament bundling’.
- https://cdn.elifesciences.org/articles/85383/elife-85383-fig2-data1-v1.zip
Figure 3
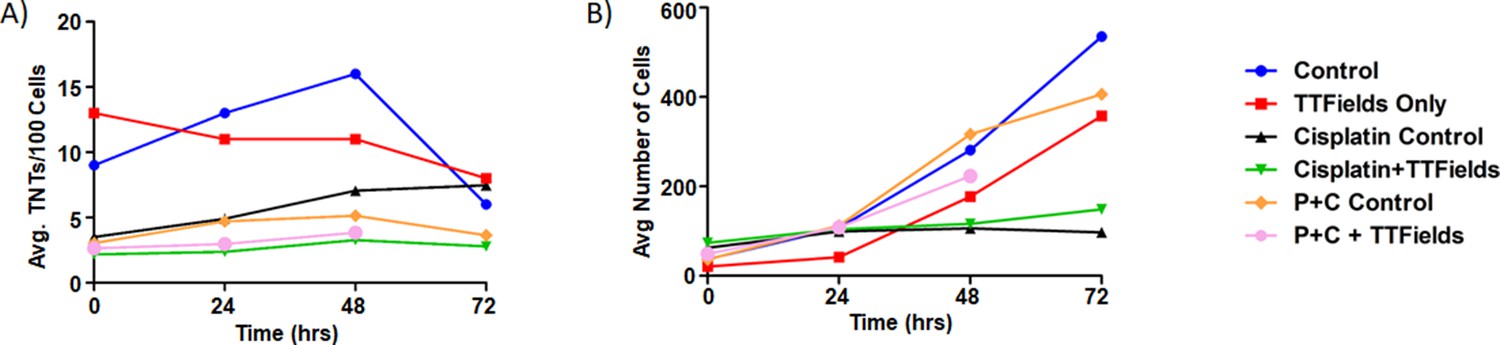
The effect of synergistic TTFields and chemotherapeutic exposure on MSTO-211H TNT formation and cell growth.
(A) TNT formation following treatment with cisplatin and cisplatin + pemetrexed over 72 hr. Intensity and frequency were set at 1.0 V/cm and 200 kHz respectively with bidirectional field delivery. (B) Cell growth with chemotherapeutic reagents (C, cisplatin and P, pemetrexed) at 1.0 V/cm, 200 kHz, bidirectional. Results are indicative of one independent experiment (n=1) but with 45 technical replicates (TNTs/cell measured in multiple regions within the same experiment) averaged for each time period and condition.
Figure 4
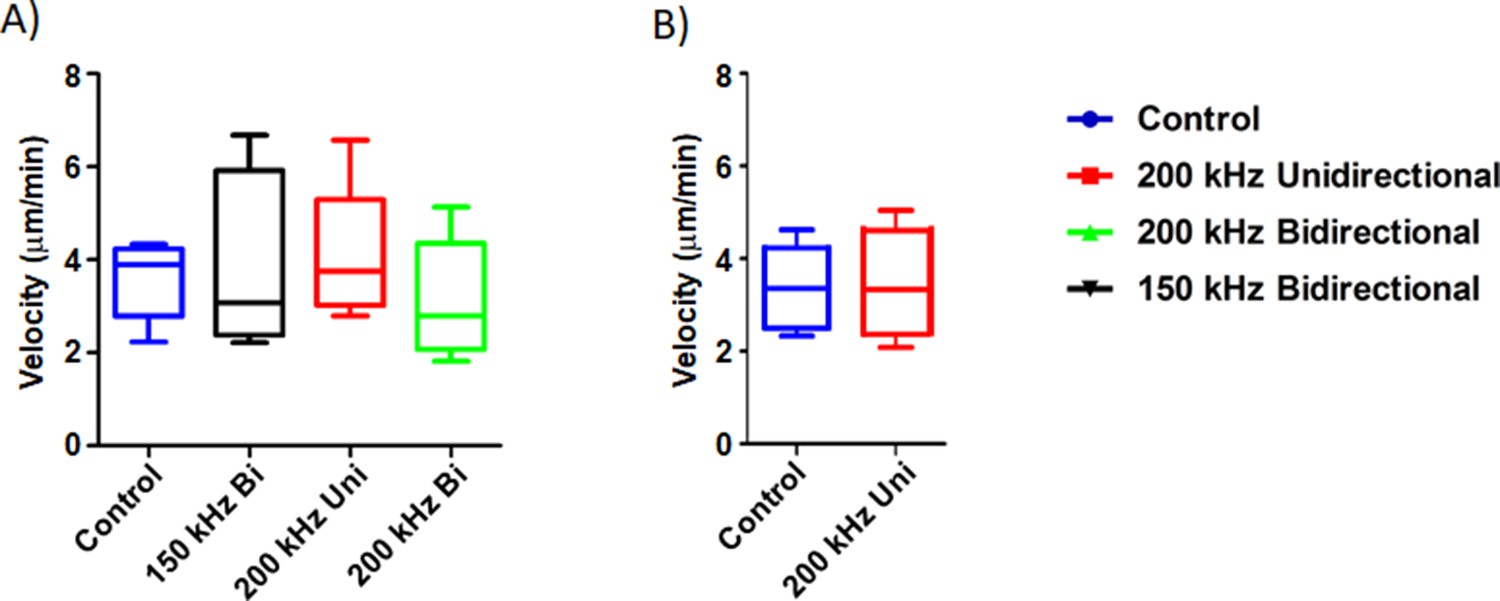
The effect of TTFields application on cargo transfer along TNTs.
(A) Cargo velocity with 1.0 V/cm, 150 or 200 kHz, unidirectional or bidirectional TTFields application. (B) Mitochondrial velocity with 1.0 V/cm, 200 kHz unidirectional TTFields application. Results are indicative of three independent experiments (n=3).
Figure 5 with 1 supplement
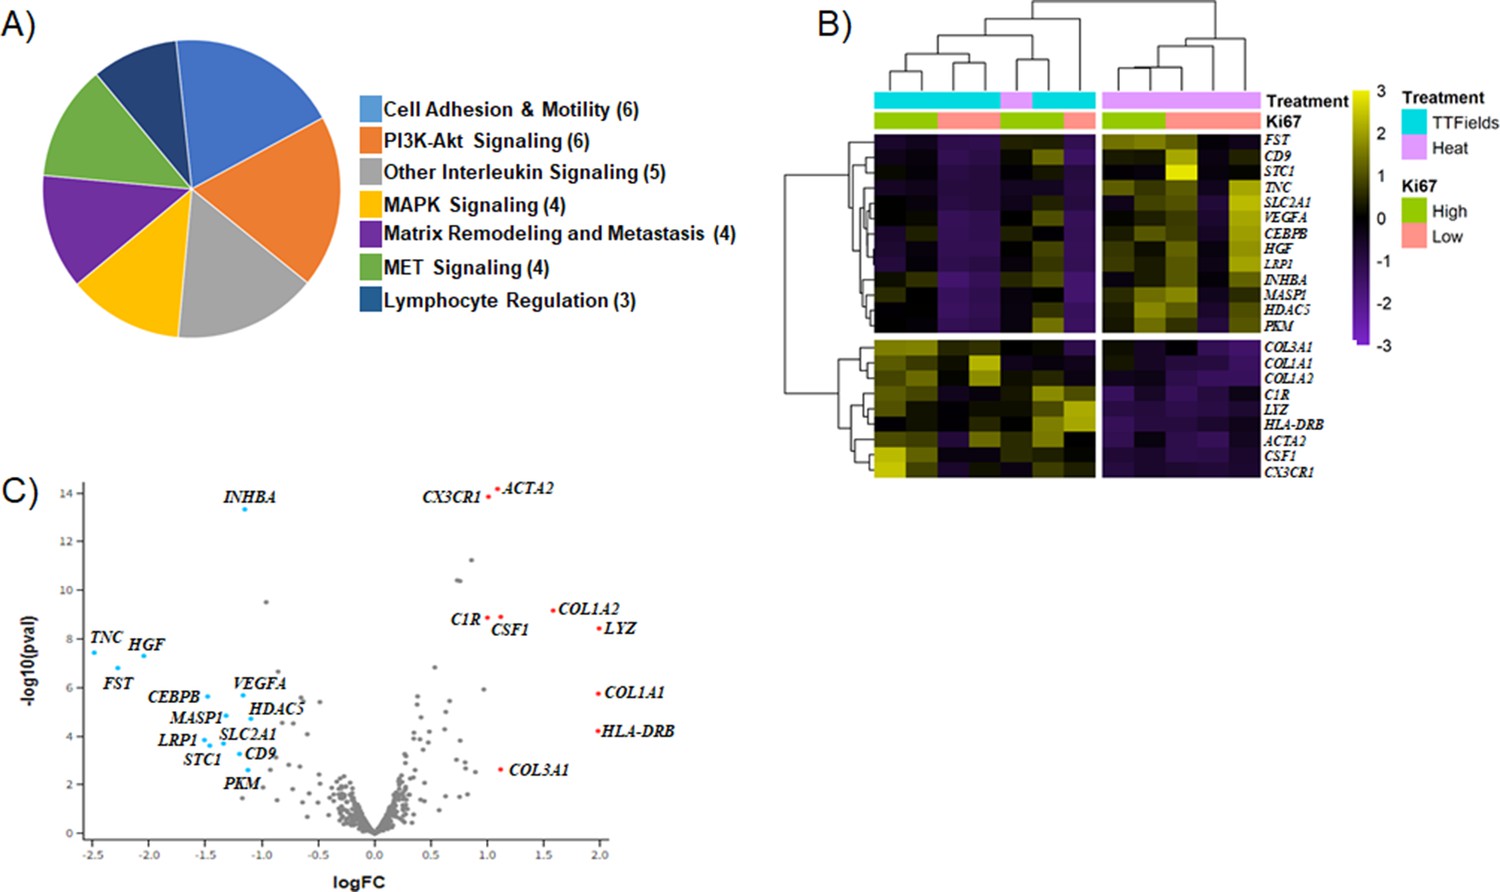
Differentially expressed genes (DEG) of TTFields-treated tumors.
(A) Categories of genes found to be differentially expressed. () indicates the number of genes, that fall into a given category. (B–C) Heatmap and Volcano plot generated by spatial omics analysis.
-
Figure 5—source data 1
GeoMX cancer transcriptome atlas gene panel containing corresponding protein function and tissue compartment information for genes involved in cancer progression.
- https://cdn.elifesciences.org/articles/85383/elife-85383-fig5-data1-v1.xlsx
Figure 5—figure supplement 1

Cluster analysis of genes in high versus low Ki67 ROI within each treatment group.
(A) TTFields treated tumors; and (B) heat sham treated tumors.
Figure 6 with 3 supplements
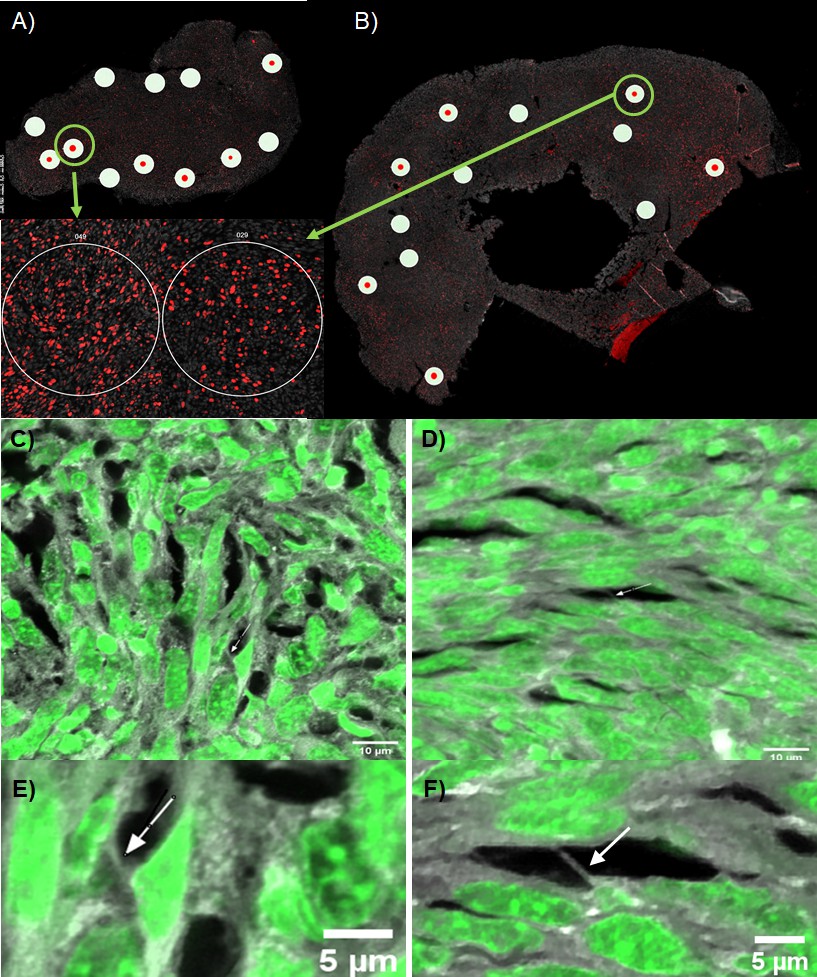
Representative fluorescence images of TNTs in intact mesothelioma tumor from our mouse model.
BALB/C mice were injected with AB1 mesothelioma cells and resulting tumors were excised, sectioned, and used for NanoString GeoMx spatial profiling, as well as for imaging on a NIKON A1RSi light confocal microscope. (A–B) Map of tumor sections and selected ROIs used for GeoMx spatial profiling (white circles) and confocal microscopy (green rings) of (A) TTFields treated tumor; and (B) heat sham treated tumor. Insets are enlarged images of the high Ki67 ROI images selected for confocal microscopy, where Ki67 is stained in red, and nuclei in gray. (C–F) Z-stack projections of TNTs identified in selected ROIs, TTFields-treated tumor slices (C, E) and heat control slices (D,F) respectively. Z-stacks were acquired at 60 X using Nyquist sampling with Sytox Green 488 nuclear stain and Alexa Fluor Phalloidin 647. Arrows point to TNT protrusions within the sample.
Figure 6—figure supplement 1

Additional representative TNT protrusion in a TTFields-treated resected murine mesothelioma tumor.
BALB/c mice tumors were resected and sectioned as described in Figure 6. The length of the TNT identified by a white arrow was 3.45 μm.
Figure 6—video 1
3-dimensional reconstruction of the heat sham-treated (negative control) intact tumor depicted in Figure 6A.
The rendering was created using Imaris Essentials imaging analysis software. Representative short TNTs/TNT-like protrusions are indicated by the white arrows. Scale bar = 5 μm.
Figure 6—video 2
3-dimensional reconstruction of the TTFields-treated MPM intact tumor depicted in Figure 6C.
The rendering was created using Imaris Essentials imaging analysis software. Representative short TNTs/TNT-like protrusions are indicated by the white arrows. Scale bar = 3 μm.
Tables
Table 1
Differentially expressed genes (DEG) of TTFields-treated tumors.
| Gene | Log2 Fold Change | p-Adjusted |
|---|---|---|
| LYZ | 1.9942 | 2.197E-07 |
| COL1A1 | 1.9875 | 6.490E-05 |
| HLA-DRB | 1.9839 | 1.179E-03 |
| COL1A2 | 1.5858 | 5.548E-08 |
| CSF1 | 1.1208 | 8.689E-08 |
| COL3A1 | 1.1203 | 2.727E-02 |
| ACTA2 | 1.0931 | 4.455E-12 |
| CX3CR1 | 1.0117 | 4.598E-12 |
| C1R | 1.0034 | 8.689E-08 |
| HDAC5 | 1.0960 | 4.199E-04 |
| PKM | 1.1221 | 2.744E-02 |
| INHBA | 1.1502 | 1.010E-11 |
| VEGFA | 1.1652 | 7.205E-05 |
| NR4A1 | 1.1725 | 1.958E-01 |
| CD9 | 1.1966 | 7.562E-03 |
| MASP1 | 1.3157 | 3.359E-04 |
| SLC2A1 | 1.3392 | 3.051E-03 |
| STC1 | 1.4611 | 3.623E-03 |
| CEBPB | 1.4803 | 7.251E-05 |
| LRP1 | 1.5079 | 2.348E-03 |
| HGF | 2.0459 | 2.519E-06 |
| FST | 2.2774 | 6.837E-06 |
| TNC | 2.4863 | 2.002E-06 |
Key resources table
| Reagent type (species) or resource | Designation | Source or reference | Identifiers | Additional information |
|---|---|---|---|---|
| Gene (Homo sapien) | Human fascin-1 | GenBank | HGNC:HGNC:11148 | |
| Strain, strain background (Escherichia coli) | BL21 DE3pLysS | Novagen | 69451 | competent cells |
| Cell line (Homo sapien) | Biphasic Mesothelioma | ATCC | CRL-2081 | MSTO-211H |
| Cell line (Homo sapien) | Sarcomatoid Mesothelioma | Authenticated | Authenticated | VAMT |
| Recombinant DNA reagent | pGV67 plasmid | This paper | GST/TEV expression vector derived from p21d (Novagen 69743) | doi: 10.1074/jbc.M111.322958 [PMID:18640983] Nolen and Pollard, 2008 |
| Recombinant DNA reagent | GeoMx Mouse Cancer Transcriptome Atlas panel | NanoString Technologies, Inc. | GMX-RNA-NGS-CTA-4 | |
| Commercial Assay or kit | NucGreen Dead 488 ReadyProbes Reagent | Thermo Fisher Scientific | R37109 | |
| Commercial assay or kit | Click-iT TUNEL Alexa Fluor 488 Imaging Assay | Thermo Fisher Scientific | C10617 | |
| Software, algorithm | Zen Pro 2012 | Carl Zeiss Microscopy | Version 1.1.1 | |
| Software, algorithm | GeoMx DSP software | NanoString Technologies, Inc. | Version 2.4.0.421 | |
| Software, algorithm | SAS | SAS Viya | Version 9.4 | |
| Software, algorithm | Deseq package in R | R Foundation for Statistical Computing | Version 3.1 | |
| Software, algorithm | GraphPad Prism | GraphPad Software | Version 7.0 | |
| software, algorithm | Fiji-ImageJ software | Fiji organization | Version 2.9.0/1.53 t | |
| Other | Nunc Thermanox coverslips | Thermo Fisher Scientific | 174977 | 22 mm plastic cell-culture coverslips used with inovitro, found in “inovitro TTFields treatment” subheading in Materials and Methods |
| Other | 35 mm high wall, glass bottom dish | Ibidi | 81158 | |
| Other | MitoTracker Orange CMTMRos | Thermo Fisher Scientific | M7510 | fluorescent dye specific to mitochondria in cells, found in “Cargo and mitochondria transfer” subheading in Materials and Methods |
Additional files
-
MDAR checklist
- https://cdn.elifesciences.org/articles/85383/elife-85383-mdarchecklist1-v1.pdf
-
Supplementary file 1
Materials and Methods for inovitro/inovitro Live treatment, actin and fascin purification and polymerization, and ex vivo microscopy.
- https://cdn.elifesciences.org/articles/85383/elife-85383-supp1-v1.pdf
Download links
A two-part list of links to download the article, or parts of the article, in various formats.
Downloads (link to download the article as PDF)
Open citations (links to open the citations from this article in various online reference manager services)
Cite this article (links to download the citations from this article in formats compatible with various reference manager tools)
Treatment with tumor-treating fields (TTFields) suppresses intercellular tunneling nanotube formation in vitro and upregulates immuno-oncologic biomarkers in vivo in malignant mesothelioma
eLife 12:e85383.
https://doi.org/10.7554/eLife.85383


