The Axin scaffold protects the kinase GSK3β from cross-pathway inhibition
- Department of Chemistry, University of Washington, United States
Figures
Figure 1
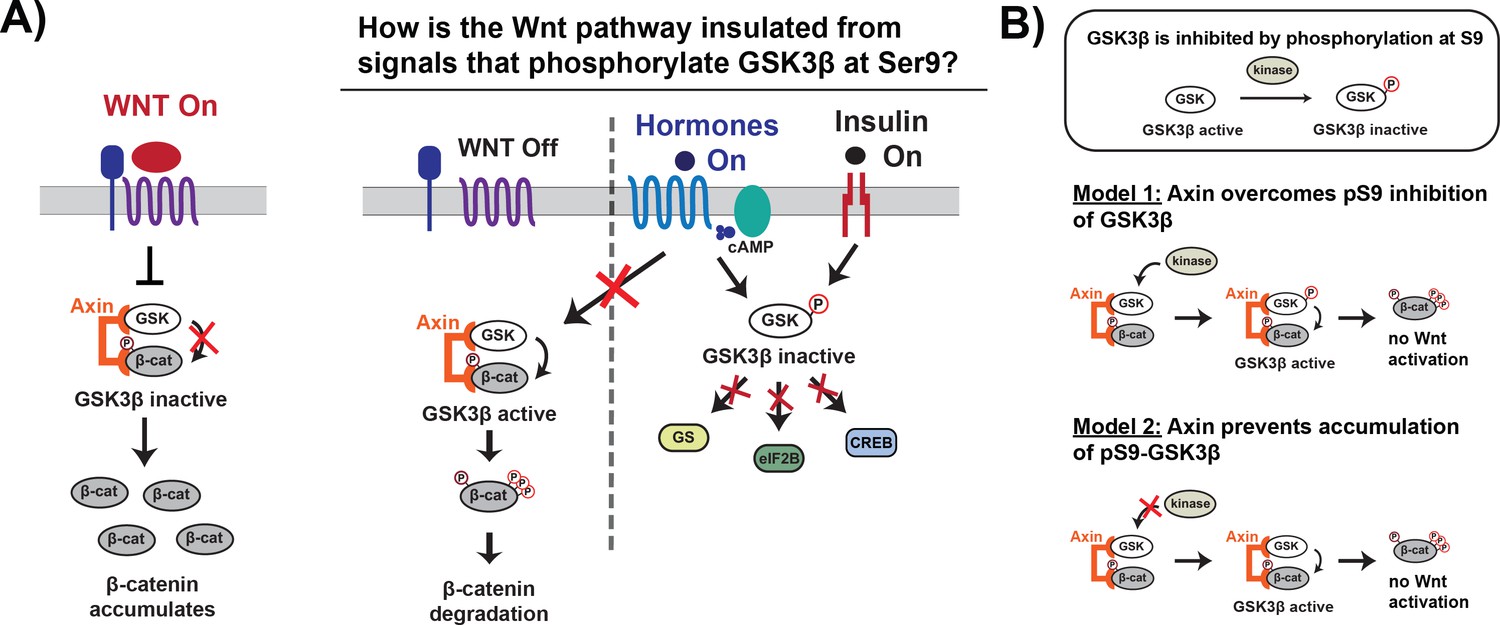
Wnt signaling is insulated from signals that phosphorylate GSK3β at Ser9.
(A) In the Wnt pathway, the scaffold protein Axin coordinates a GSK3β complex that phosphorylates β-catenin, which is then degraded. Wnt signals inhibit phosphorylation, allowing β-catenin levels to rise and initiate a transcriptional program (Nusse and Clevers, 2017). In other signaling pathways, upstream signals regulate GSK3β through phosphorylation at Ser9, which blocks substrate binding, inhibits activity toward downstream substrates, and activates downstream signaling (Sutherland, 2011). (B) The scaffold protein Axin could insulate Wnt-associated GSK3β from Ser9 inhibition by restoring GSK3β activity toward β-catenin even when phosphorylated at Ser9 (Model 1) or by preventing accumulation of pS9-GSK3β in the Wnt destruction complex (Model 2).
Figure 2 with 9 supplements
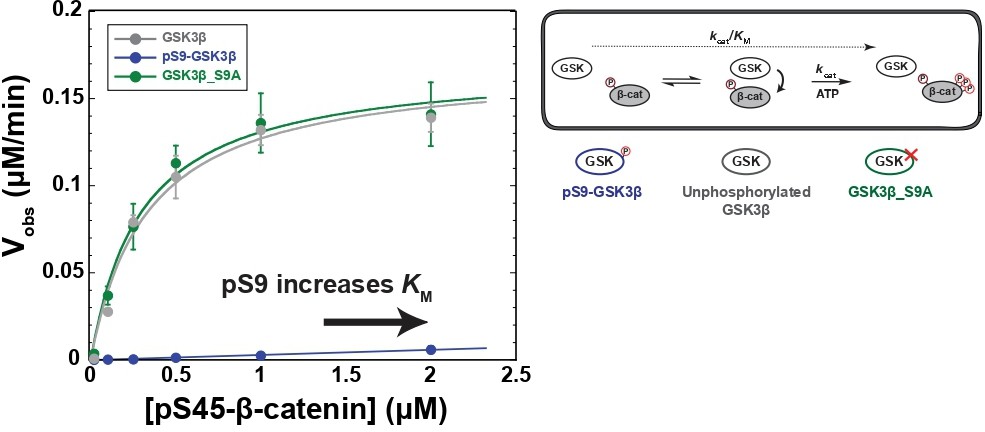
Phosphorylation at Ser9 inhibits GSK3β activity toward pS45-β-catenin.
Kinetic scheme and Michaelis-Menten plots for reactions of unphosphorylated GSK3β, pS9-GSK3β, and GSK3β_S9A with pS45-β-catenin. Plots are Vobs versus [pS45-β-catenin] at 10 nM GSK3β. GSK3β phosphorylates pS45-β-catenin at three sites: S33, S37, and T41. Values are mean ± SD for at least three biological replicates. See Supplementary file 1a for values of fitted kinetic parameters. See Figure 2—figure supplement 1C and D and Figure 2—figure supplement 9 for characterization of GSK3β phosphorylation states and mutants.
-
Figure 2—source data 1
Observed rates for data plotted in Figure 2.
- https://cdn.elifesciences.org/articles/85444/elife-85444-fig2-data1-v2.xlsx
Figure 2—figure supplement 1
Characterization of purified proteins.
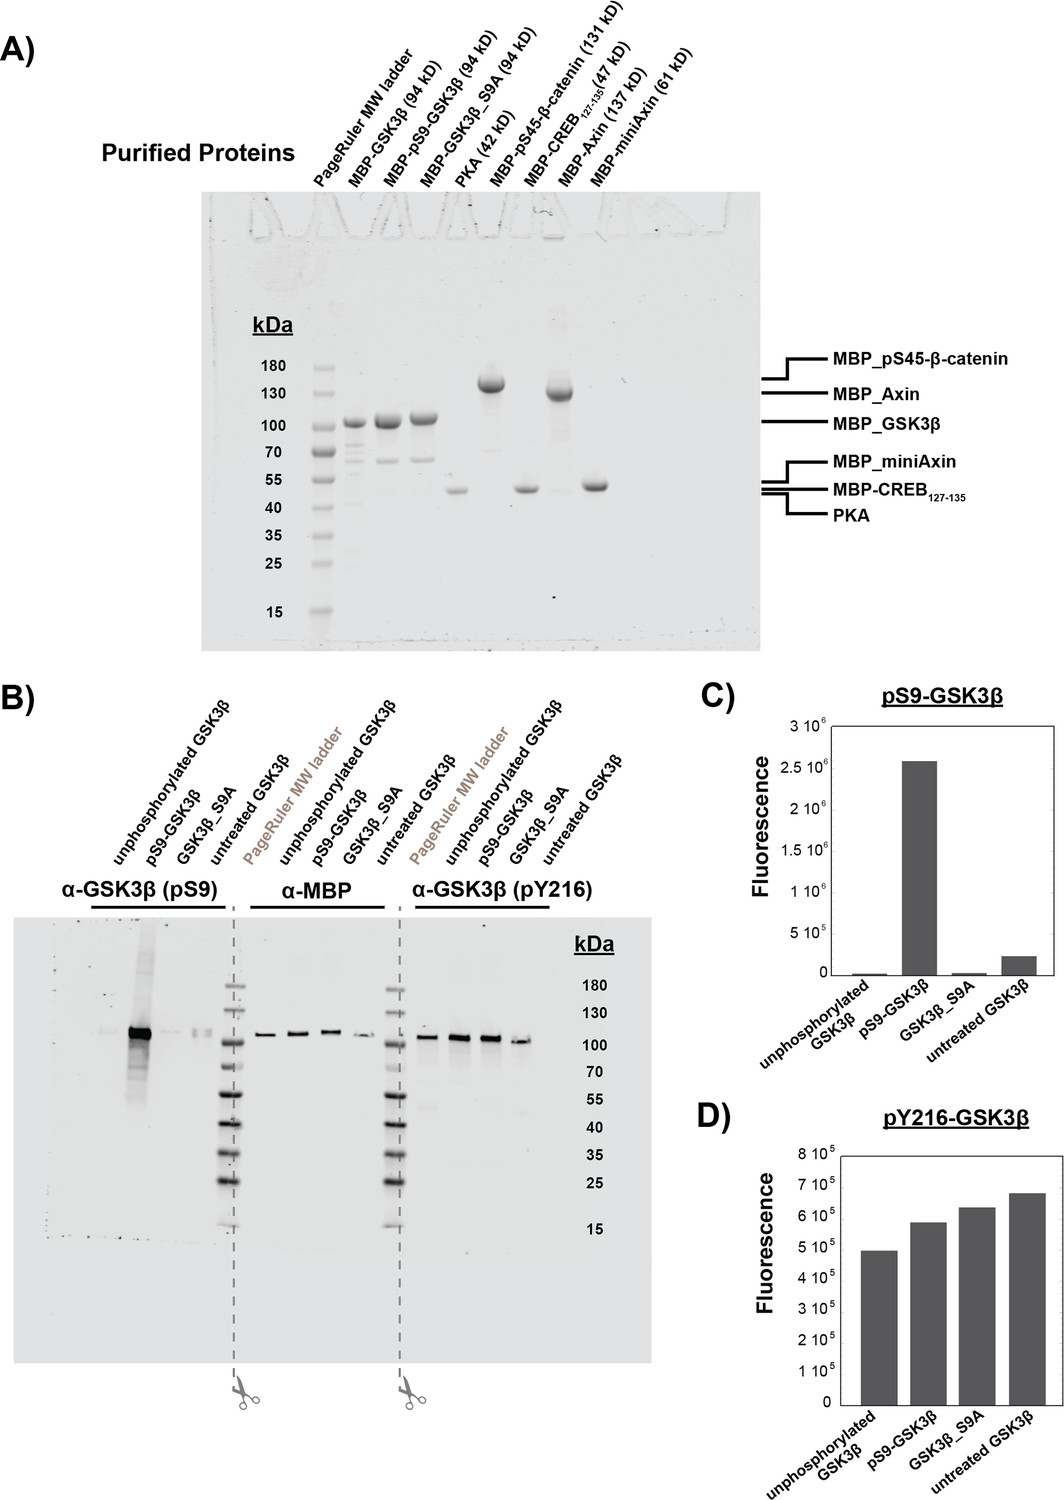
(A) Coomassie-stained SDS-PAGE of purified proteins used in this work. All proteins except PKA were purified as MBP fusion proteins (see Materials and methods). Unphosphorylated GSK3β was purified after coexpression with lambda phosphatase (see Methods). pS45-β-catenin was purified after coexpression with CK1α as described previously (Gavagan et al., 2020). Phosphorylated GSK3β and GSK3β_S9A were purified after in vitro phosphorylation with PKA (see Materials and methods). Each lane was loaded with 10 μL of 4 μM protein. (B) Western blot for phosphorylation state of GSK3β at Ser9 and Tyr216. GSK3β samples are unphosphorylated GSK3β, pS9-GSK3β, GSK3β_S9A, and untreated GSK3β (unmodified recombinant protein, not coexpressed with lambda phosphatase or treated with PKA). After the western blot transfer, the membrane was cut down the center of the MW ladder lanes so each third of the membrane could be incubated with separate antibodies (α-pS9-GSK3β, α-MBP for total protein, and α-pY216-GSK3β). The membrane fragments were placed back together for imaging. (C) PKA phosphorylates GSK3β at Ser9. The extent of Ser9 phosphorylation was quantified by western blot (B). Fluorescence values were normalized using the α-MBP total protein loading control. No significant phosphorylation at Ser9 was detected for unphosphorylated GSK3β (phosphatase-treated) or GSK3β_S9A. Untreated GSK3β is partially (~10%) phosphorylated at Ser9. (D) Recombinant GSK3β is phosphorylated at Tyr216. The extent of Tyr216 phosphorylation was quantified by western blot (B). Fluorescence values were normalized using the α-MBP total protein loading control.
-
Figure 2—figure supplement 1—source data 1
Coomassie-stained SDS-PAGE gel of purified proteins.
Coomassie-stained SDS-PAGE of purified proteins used in this work. All proteins except PKA were purified as MBP fusion proteins (see Materials and methods). Unphosphorylated GSK3β was purified after coexpression with lambda phosphatase (see Materials and methods). pS45-β-catenin was purified after coexpression with CK1α as described previously (Gavagan et al., 2020). Phosphorylated GSK3β and GSK3β_S9A were purified after in vitro phosphorylation with PKA (see Materials and methods). Each lane was loaded with 10 μL of 4 μM protein.
- https://cdn.elifesciences.org/articles/85444/elife-85444-fig2-figsupp1-data1-v2.zip
-
Figure 2—figure supplement 1—source data 2
Western blot for phosphorylation state of GSK3β at Ser9 and Tyr216.
Western blot for phosphorylation state of GSK3β at Ser9 and Tyr216. GSK3β samples are unphosphorylated GSK3β, pS9-GSK3β, GSK3β_S9A, and untreated GSK3β (unmodified recombinant protein, not coexpressed with lambda phosphatase or treated with PKA). After the western blot transfer, the membrane was cut down the center of the MW ladder lanes so each third of the membrane could be incubated with separate antibodies (α-pS9-GSK3β, α-MBP for total protein, and α-pY216-GSK3β). The membrane fragments were placed back together for imaging.
- https://cdn.elifesciences.org/articles/85444/elife-85444-fig2-figsupp1-data2-v2.zip
Figure 2—figure supplement 2
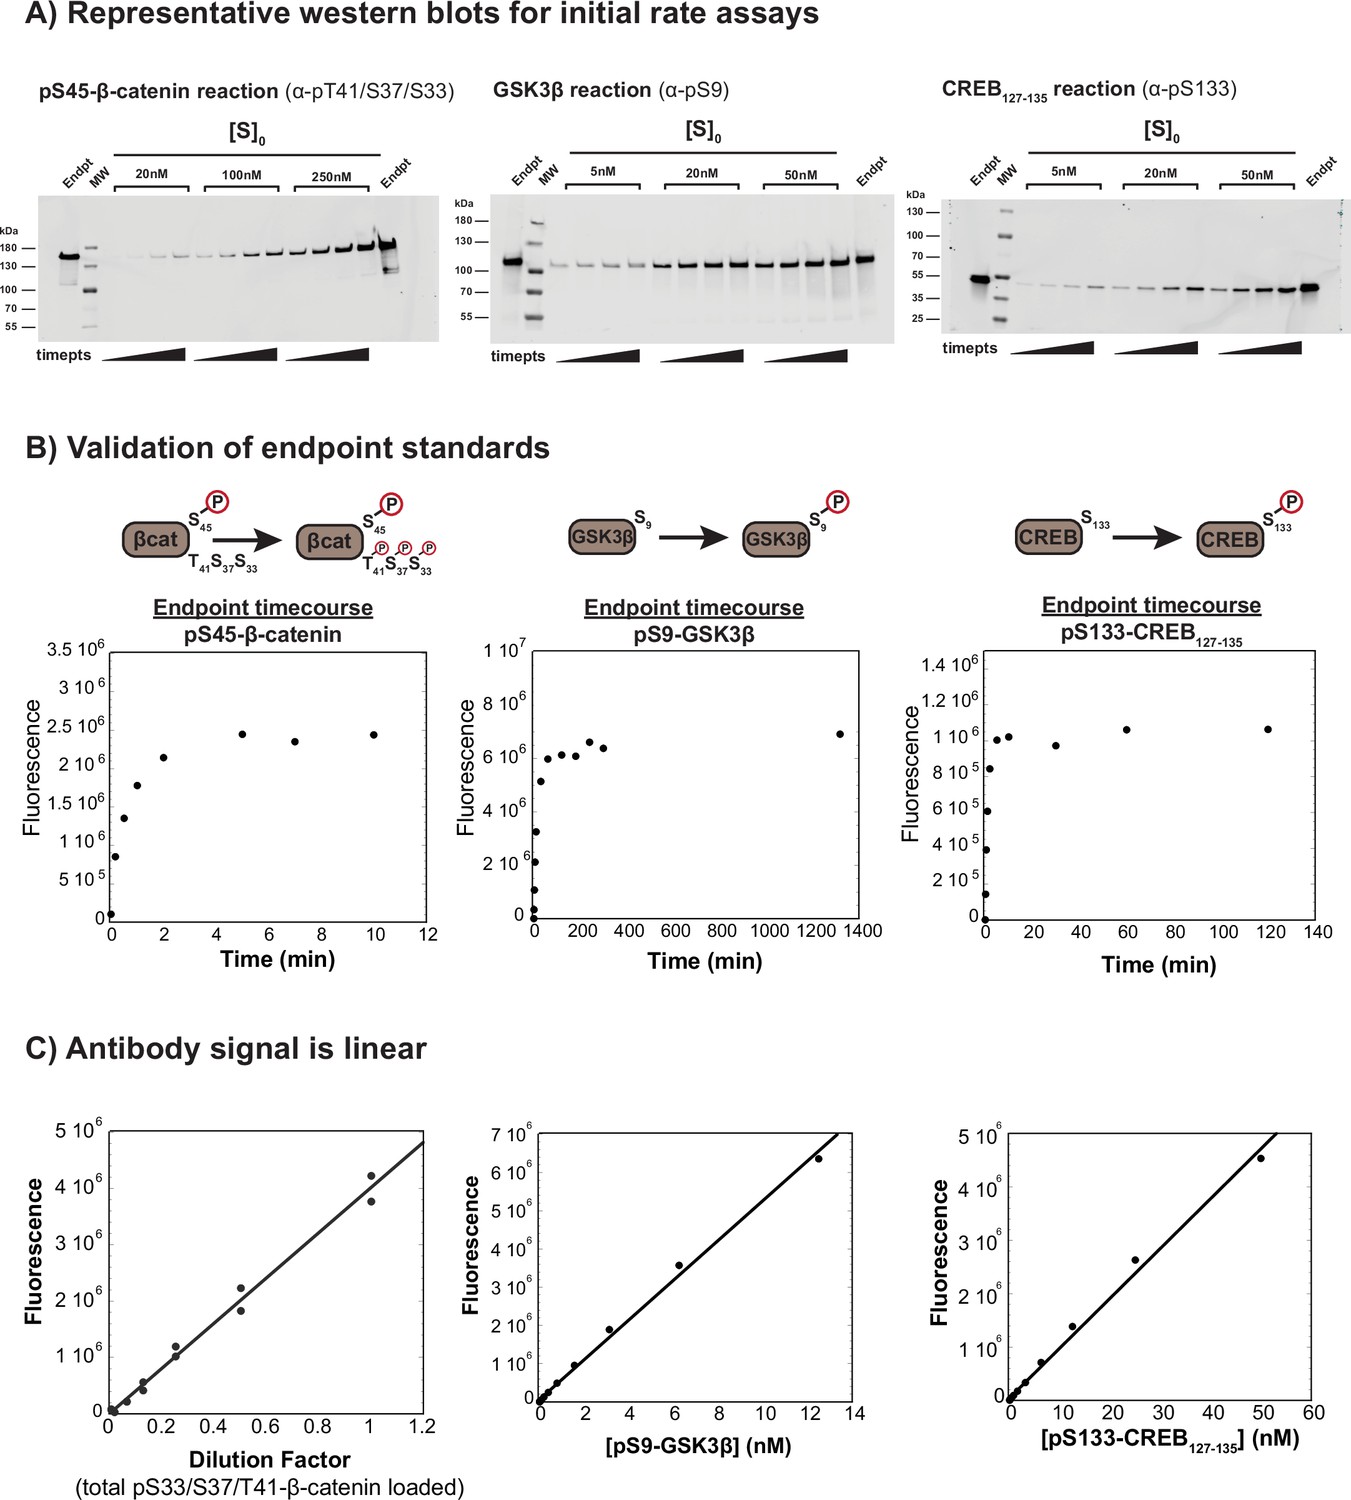
Protein phosphorylation kinetic assays.
(A) Representative western blots for reactions of GSK3β with pS45-β-catenin, PKA with GSK3β, and PKA with CREB127-135. Reactions were conducted with 10 nM GSK3β or 20 nM PKA and the substrate concentrations indicated. Each gel was cut before transferring to the membrane to facilitate multiple simultaneous transfers in the same apparatus (as seen in Figure 2—figure supplement 4, Figure 2—figure supplement 6, and Figure 4—figure supplement 1). The images shown are the complete, uncropped blot membrane images. (B) Timecourses of phosphorylation of endpoint standards for GSK3β-phosphorylated pS33/pS37/pT41-β-catenin, PKA-phosphorylated pS9-GSK3β, and PKA-phosphorylated pS133-CREB127-135. (C) The antibody signals are linear over a broad range spanning the observed signal in kinetic assays. The pS33/pS37/pT41-β-catenin data shows serial dilutions from a reaction timepoint with 3 µM pS45-β-catenin, 20 nM GSK3β and 500 nM miniAxin. The reaction was quenched at 1.5 min, which produces ~500 nM pS33/pS37/pT41-β-catenin. The quenched timepoint was diluted 1:5, then a set of twofold serial dilutions was loaded on the gel. The signal is linear over a concentration range of at least 1.5–100 nM. These data were published previously (Gavagan et al., 2020). The pS9-GSK3β and pS133-CREB127-135 plots show sets of twofold serial dilutions from a 1:4 dilution of pS9-GSK3β endpoint (PKA reactions with GSK3β) or undiluted endpoint (PKA reactions with CREB127-135), respectively. The pS9-GSK3β signal is linear over a range of at least 0.2–12.5 nM. The CREB127-135 signal is linear over a range of at least 1–50 nM.
-
Figure 2—figure supplement 2—source data 1
Representative western blots for the reaction of pS9-GSK3β with pS45-β-catenin in the presence and absence of Axin.
Western blots for reactions of varying concentrations of pS45-β-catenin with 10 nM pS9-GSK3β in the presence and absence of 500 nM Axin. All gel samples were diluted 1:5 to prevent a gel smearing artifact (see Materials and methods).
- https://cdn.elifesciences.org/articles/85444/elife-85444-fig2-figsupp2-data1-v2.zip
-
Figure 2—figure supplement 2—source data 2
Representative western blots for the reaction of PKA with GSK3β in the presence and absence of Axin.
Western blots for reactions of varying concentrations of GSK3β with 20 nM PKA +/-500 nM Axin. 500 nM GSK3β reaction gel samples without Axin were diluted 1:4 to prevent overloading the gel; all other reactions were diluted 1:2 (see Materials and methods).
- https://cdn.elifesciences.org/articles/85444/elife-85444-fig2-figsupp2-data2-v2.zip
-
Figure 2—figure supplement 2—source data 3
Representative western blots for the reaction of PKA with CREB127-135 in the presence and absence of Axin.
Western blots for reactions of varying concentrations of CREB127-135 with 20 nM PKA in the presence and absence of 500 nM Axin.
- https://cdn.elifesciences.org/articles/85444/elife-85444-fig2-figsupp2-data3-v2.zip
Figure 2—figure supplement 3
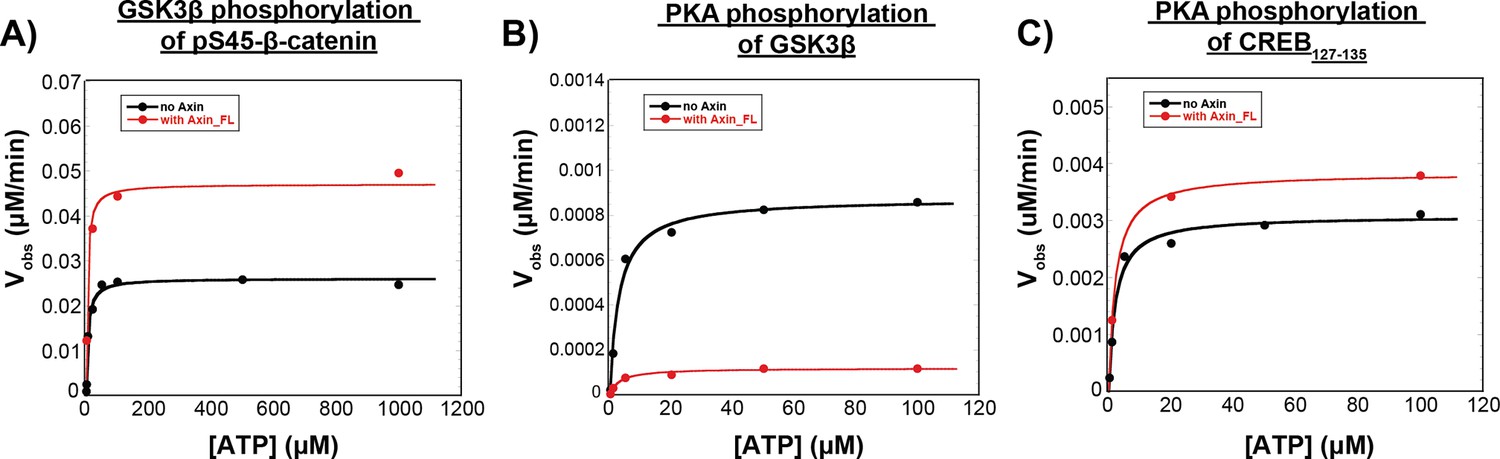
The concentration of ATP used for quantitative kinetic experiments (100 μM) is saturating for all reactions.
(A) Michaelis-Menten plot of Vobs vs. [ATP] at 10 nM unphosphorylated GSK3β and 50 nM pS45-β-catenin in the presence and absence of 500 nM Axin. Fits to the Michaelis-Menten equation give KM, ATP values of 4.6±0.9 μM and 3.7±1.3 μM in the presence and absence of Axin, respectively. (B) Michaelis-Menten plot of Vobs vs. [ATP] at 20 nM PKA and 20 nM GSK3β in the presence and absence of 500 nM Axin. Fits to the Michaelis-Menten equation give KM, ATP values of 3.0±0.6 μM and 3.3±0.8 μM in the presence and absence of Axin, respectively. (C) Michaelis-Menten plot of Vobs vs. [ATP] at 20 nM PKA and 20 nM CREB127-135 in the presence and absence of 500 nM Axin. Fits to the Michaelis-Menten equation give KM, ATP values of 2.1±0.4 μM and 2.1±0.2 μM in the presence and absence of Axin, respectively. KM values for (A)-(C) are compiled in Supplementary file 1c.
Figure 2—figure supplement 4

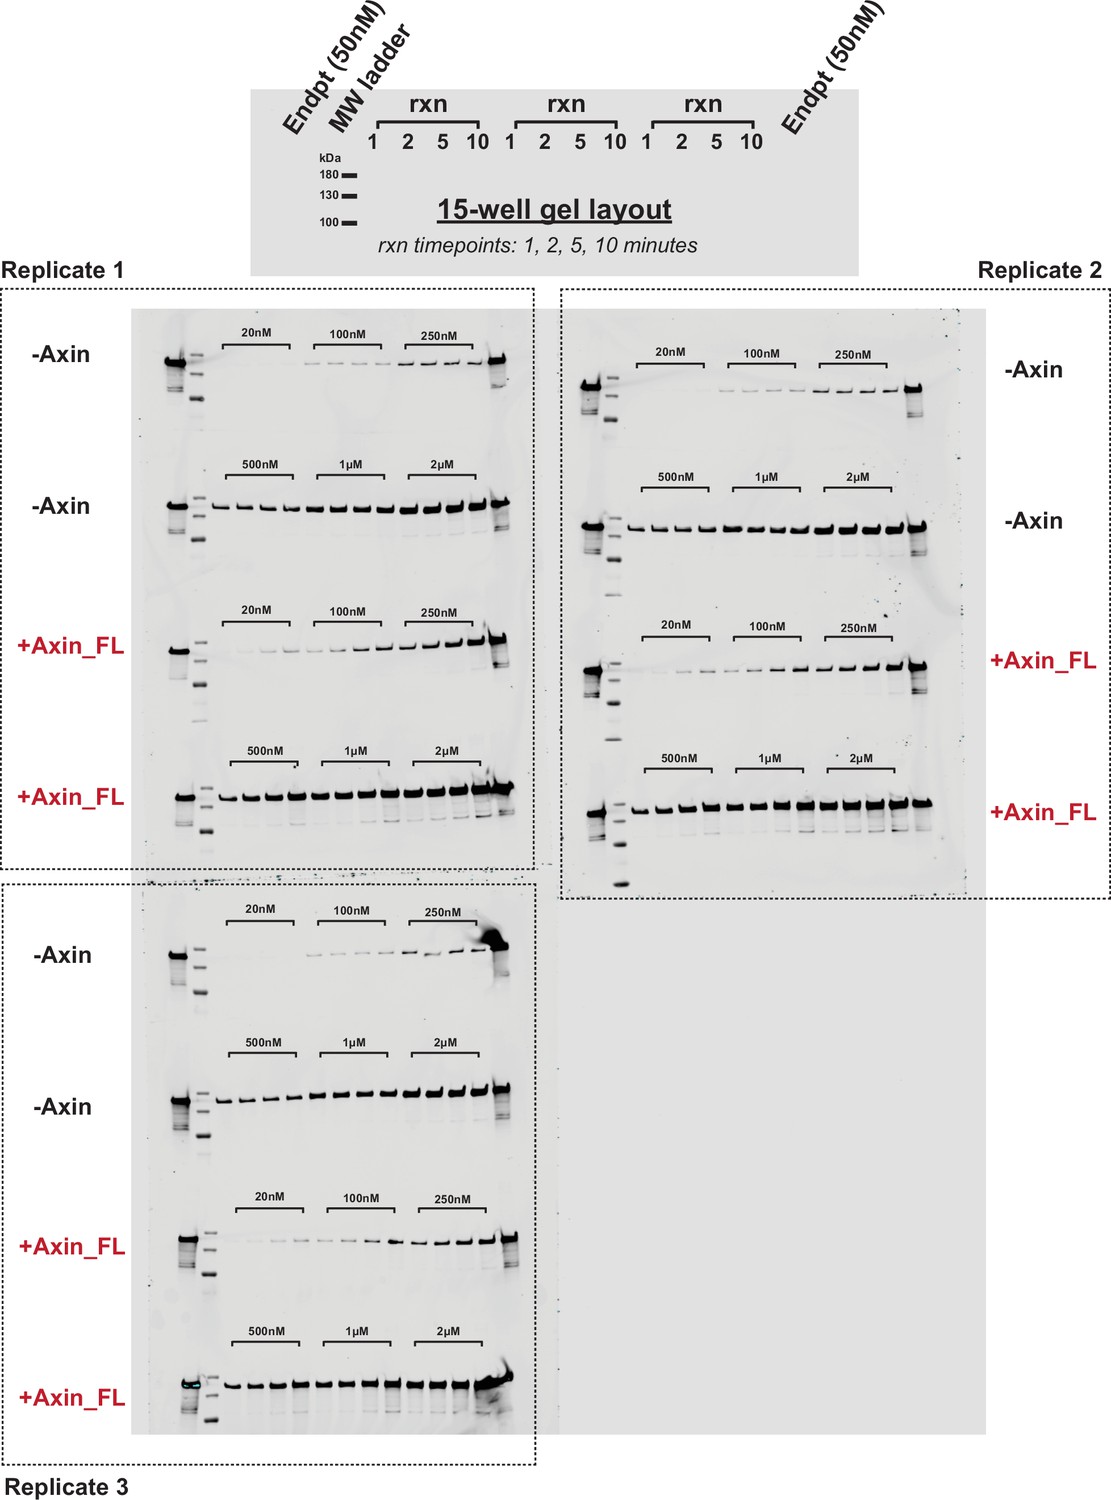
Representative western blots for the reaction of unphosphorylated GSK3β with pS45-β-catenin in the presence and absence of Axin.
Western blots for reactions of varying concentrations of pS45-β-catenin with 10 nM GSK3β in the presence and absence of 500 nM Axin. All gel samples were diluted 1:5 to prevent a gel smearing artifact (see Materials and methods). See Figure 2—figure supplement 5 for quantification.
-
Figure 2—figure supplement 4—source data 1
Representative western blots for the reaction of unphosphorylated GSK3β with pS45-β-catenin in the presence and absence of Axin.
Western blots for reactions of varying concentrations of pS45-β-catenin with 10 nM GSK3β in the presence and absence of 500 nM Axin. All gel samples were diluted 1:5 to prevent a gel smearing artifact (see Materials and methods).
- https://cdn.elifesciences.org/articles/85444/elife-85444-fig2-figsupp4-data1-v2.zip
Figure 2—figure supplement 5
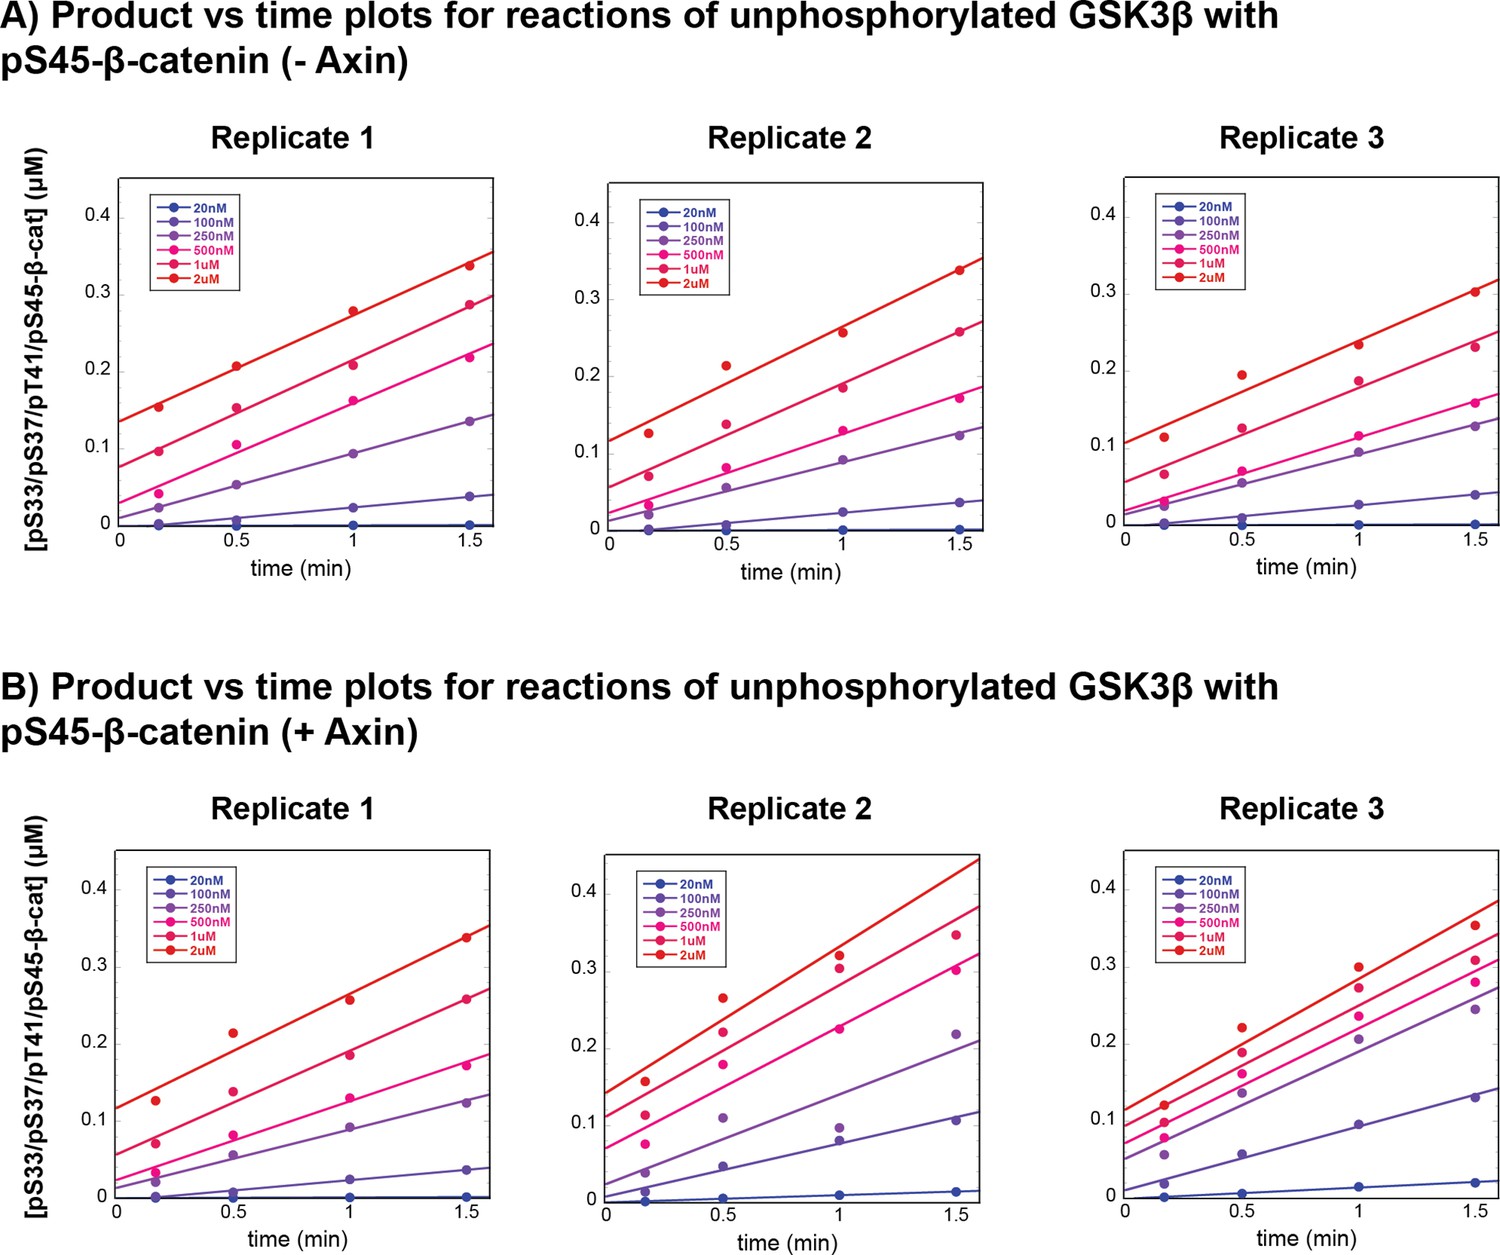
Plots of product vs. time for reaction of GSK3β with pS45-β-catenin in the presence and absence of Axin.
(A) Product vs. time plots for reactions of unphosphorylated GSK3β with pS45-β-catenin in the absence of Axin. (B) Product vs. time plots for reactions of GSK3β with pS45-β-catenin in the presence of 500 nM Axin. Data in (A) and (B) correspond to the reaction conditions and western blots shown in Figure 2—figure supplement 4.
Figure 2—figure supplement 6
Representative western blots for the reaction of pS9-GSK3β with pS45-β-catenin in the presence and absence of Axin.
Western blots for reactions of varying concentrations of pS45-β-catenin with 10 nM pS9-GSK3β in the presence and absence of 500 nM Axin. All gel samples were diluted 1:5 to prevent a gel smearing artifact (see Materials and methods). See Figure 2—figure supplement 7 for quantification.
-
Figure 2—figure supplement 6—source data 1
Representative western blots for the reaction of pS9-GSK3β with pS45-β-catenin in the presence and absence of Axin.
Western blots for reactions of varying concentrations of pS45-β-catenin with 10 nM pS9-GSK3β in the presence and absence of 500 nM Axin. All gel samples were diluted 1:5 to prevent a gel smearing artifact (see Materials and methods).
- https://cdn.elifesciences.org/articles/85444/elife-85444-fig2-figsupp6-data1-v2.zip
Figure 2—figure supplement 7
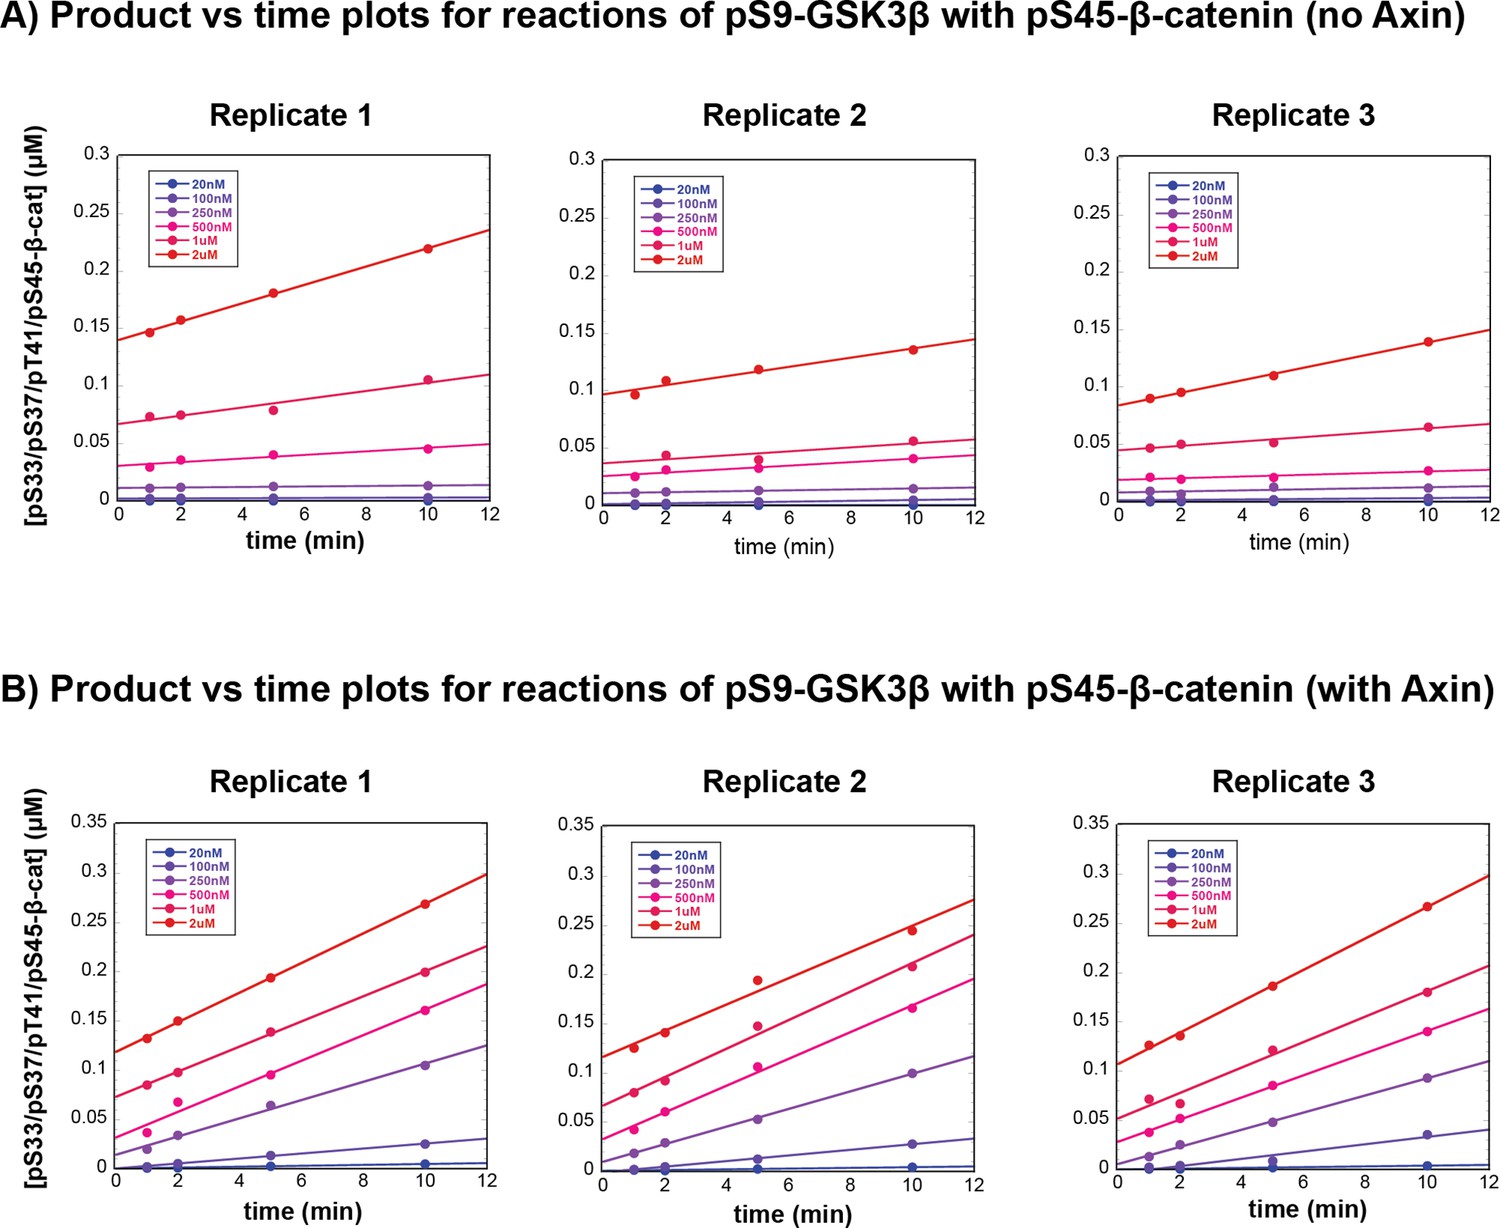
Plots of product vs. time for reaction of pS9-GSK3β with pS45-β-catenin in the presence and absence of Axin.
(A) Product vs. time plots for reactions of pS9-GSK3β with pS45-β-catenin in the absence of Axin. (B) Product vs. time plots for reactions of pS9-GSK3β with pS45-β-catenin in the presence of 500 nM Axin. Data in (A) and (B) correspond to the reaction conditions and western blots shown in Figure 2—figure supplement 6.
Figure 2—figure supplement 8
Vobs vs. [enzyme].
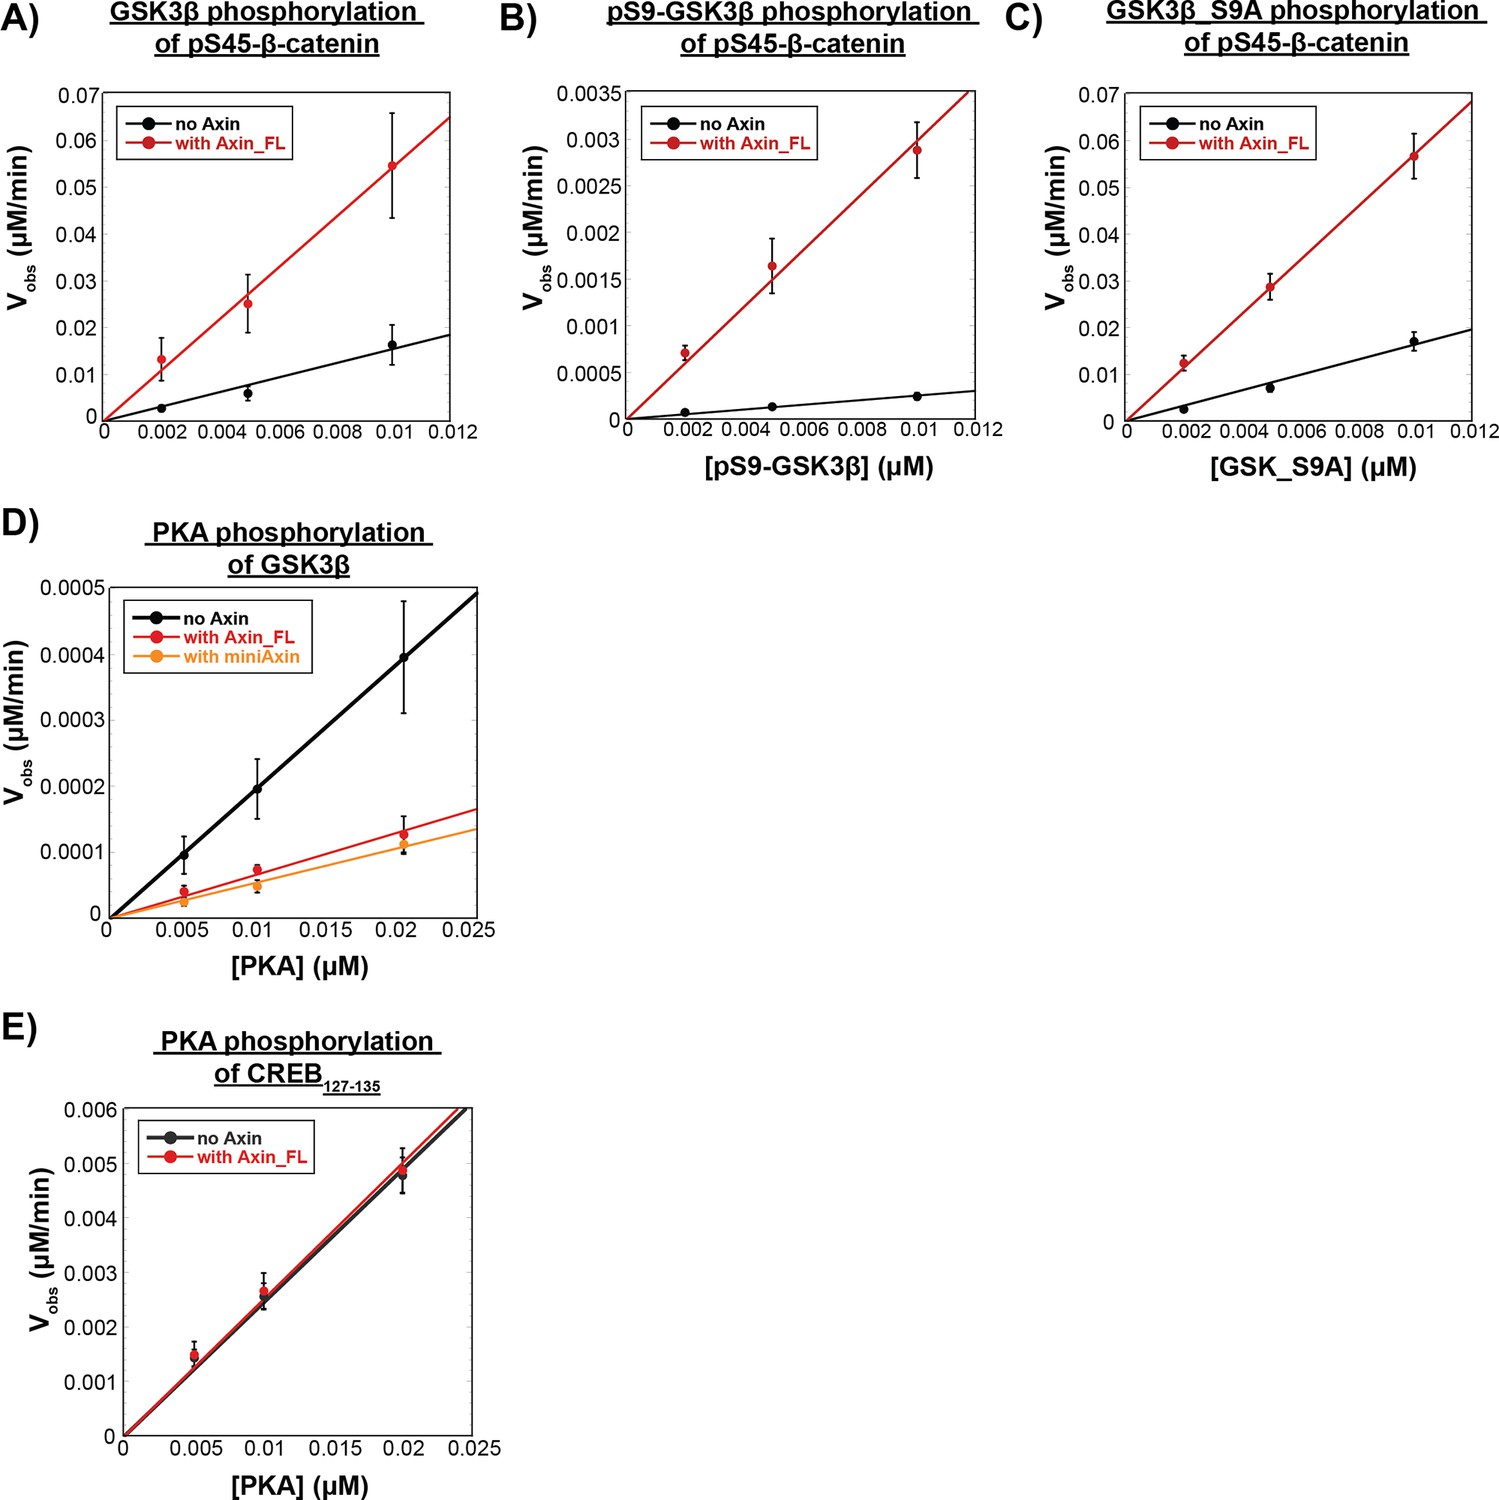
Vobs for fixed concentrations of substrate with varying concentrations of GSK3β or PKA in the presence or absence of Axin. (A) Plot of Vobs vs. [unphosphorylated GSK3β], [pS9-GSK3β], or [GSK3β_S9A] with 50 nM pS45-β-catenin in the presence and absence of 500 nM Axin. Vobs increases linearly with enzyme concentration, as expected. (B) Plot of Vobs vs. [pS9-GSK3β] with 50 nM pS45-β-catenin in the presence and absence of 500 nM Axin. (C) Plot of Vobs vs. [GSK3β_S9A] with 50 nM pS45-β-catenin in the presence and absence of 500 nM Axin. (D) Plot of Vobs vs. [PKA] with 20 nM GSK3β in the presence and absence of 500 nM Axin_FL or miniAxin. (E) Plot of Vobs vs. [PKA] at 20 nM CREB127-135 in the presence and absence of 500 nM Axin. Error bars are mean ± SD for at least three biological replicates.
Figure 2—figure supplement 9
Recombinant GSK3β is phosphorylated on multiple sites.
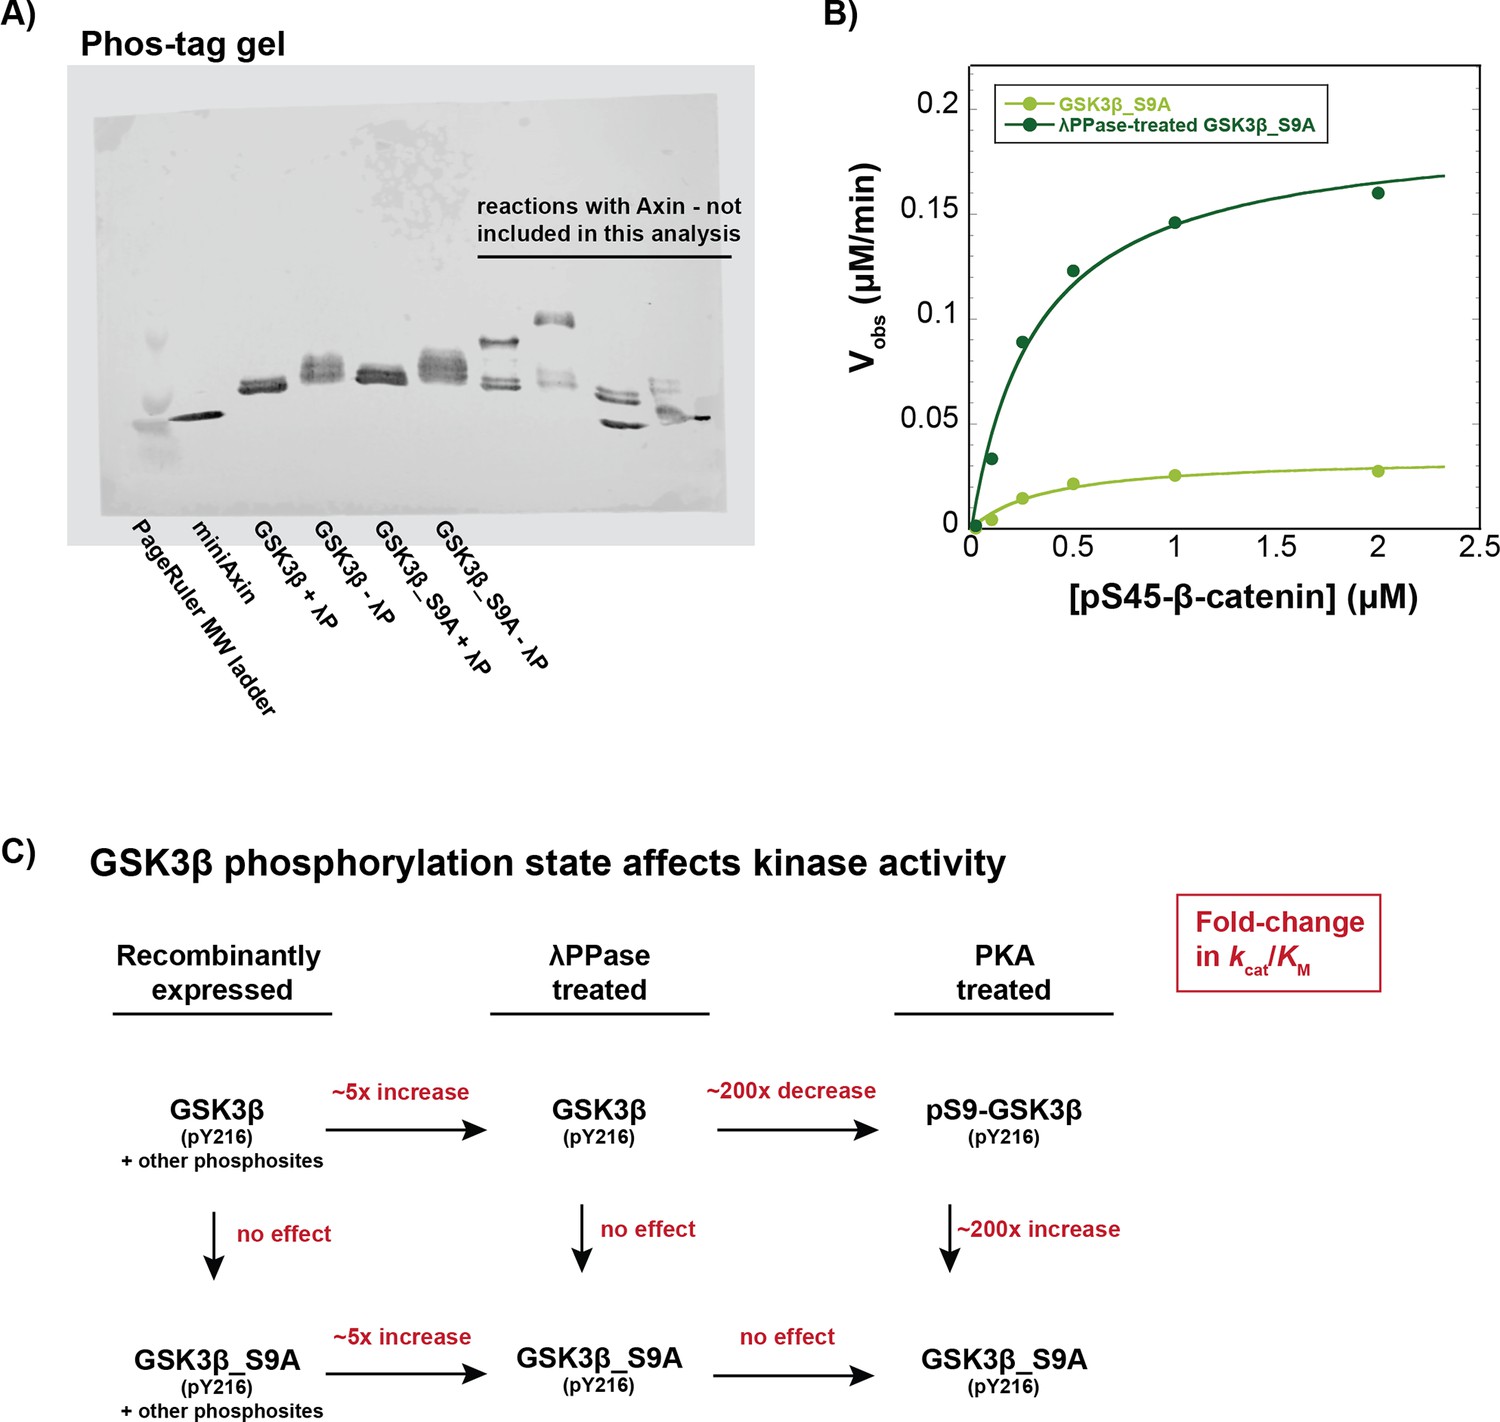
(A) Recombinant GSK3β is phosphorylated at phosphosites other than Ser9. Phos-tag gel of GSK3β and GSK3β_S9A with and without treatment with lambda phosphatase. Phos-tag gels were prepared and run as previously described (Gavagan et al., 2020; see Materials and methods). Samples with GSK3β or GSK3β_S9A were prepared in PMP buffer (NEB) with 1 mM MnCl2 and 400 nM GSK3β or GSK3β_S9A and incubated in the presence or absence of 30 μM lambda phosphatase for 30 min at 30 °C. The slower-migrating species are phosphorylated GSK3β or GSK3β_S9A. The presence of phosphorylated bands in GSK3β_S9A indicates that additional sites besides Ser9 are phosphorylated in recombinant GSK3β. (B) Michaelis-Menten plot of Vobs versus [pS45-β-catenin] at 10 nM GSK3β_S9A or 10 nM lambda phosphatase-treated GSK3β_S9A. Dephosphorylation of GSK3β_S9A by lambda phosphatase produces an ~5 fold increase in kcat/KM, largely due to a ~fivefold increase in kcat. See Supplementary file 1d for values of fitted kinetic parameters. (C) GSK3β kinase activity is affected by phosphorylation state at Ser9 and other phosphosites. Values on arrows are fold-change in kcat/KM for different preparations of GSK3β in reactions with pS45-β-catenin. Dephosphorylation of wt GSK3β or GSK3β _S9A by lambda phosphatase produces ~fivefold increases in kcat/KM (Supplementary file 1e). PKA phosphorylation of lambda phosphatase-treated GSK3β to produce pS9-GSK3β leads to a ~200-fold decrease in kcat/KM (Figure 2, Supplementary file 1a and e). PKA phosphorylation of lambda phosphatase-treated GSK3β_S9A produces no effect on kcat/KM because GSK3β_S9A cannot be phosphorylated at the inhibitory Ser9 phosphosite (Figure 2, Supplementary file 1e).
-
Figure 2—figure supplement 9—source data 1
Recombinant GSK3β is phosphorylated on multiple sites.
Recombinant GSK3β is phosphorylated at phosphosites other than Ser9. Phos-tag gel of GSK3β and GSK3β_S9A with and without treatment with lambda phosphatase. Phos-tag gels were prepared and run as previously described (Gavagan et al., 2020; see Materials and methods). Samples with GSK3β or GSK3β_S9A were prepared in PMP buffer (NEB) with 1 mM MnCl2 and 400 nM GSK3β or GSK3β_S9A and incubated in the presence or absence of 30 μM lambda phosphatase for 30 min at 30 °C. The slower-migrating species are phosphorylated GSK3β or GSK3β_S9A. The presence of phosphorylated bands in GSK3β_S9A indicates that additional sites besides Ser9 are phosphorylated in recombinant GSK3β.
- https://cdn.elifesciences.org/articles/85444/elife-85444-fig2-figsupp9-data1-v2.zip
Figure 3 with 1 supplement
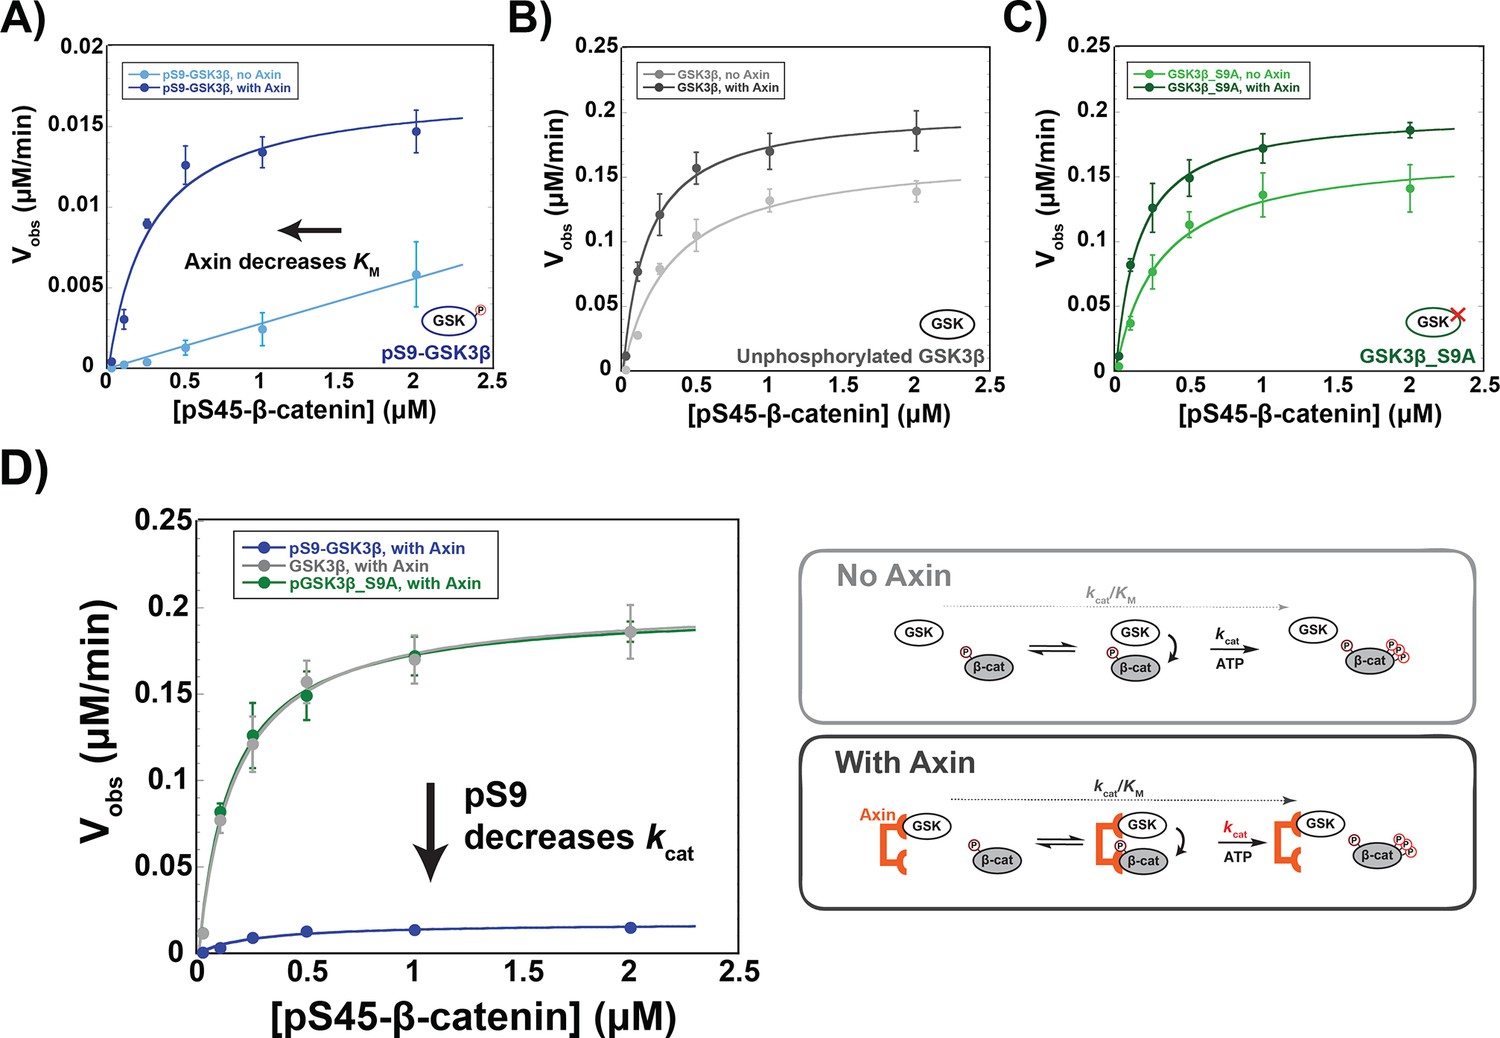
Axin restores the KM for β-catenin but cannot overcome pS9-GSK3β inactivation.
(A–C) Michaelis-Menten plots of Vobs versus [pS45-β-catenin] in the presence and absence of 500 nM Axin with 10 nM pS9-GSK3β (A), unphosphorylated GSK3β (B) or PKA-treated GSK3β_S9A (C). At the Axin concentrations used in these experiments all the GSK3β is bound to Axin (Gavagan et al., 2020). (D) Minimal kinetic scheme and Michaelis-Menten plots for reactions of GSK3β with pS45-β-catenin in the presence of Axin plotted on the same scale. Values are mean ± SD for at least three biological replicates. See Supplementary file 1a for values of fitted kinetic parameters.
-
Figure 3—source data 1
Observed rates for data plotted in Figure 3.
- https://cdn.elifesciences.org/articles/85444/elife-85444-fig3-data1-v2.xlsx
Figure 3—figure supplement 1
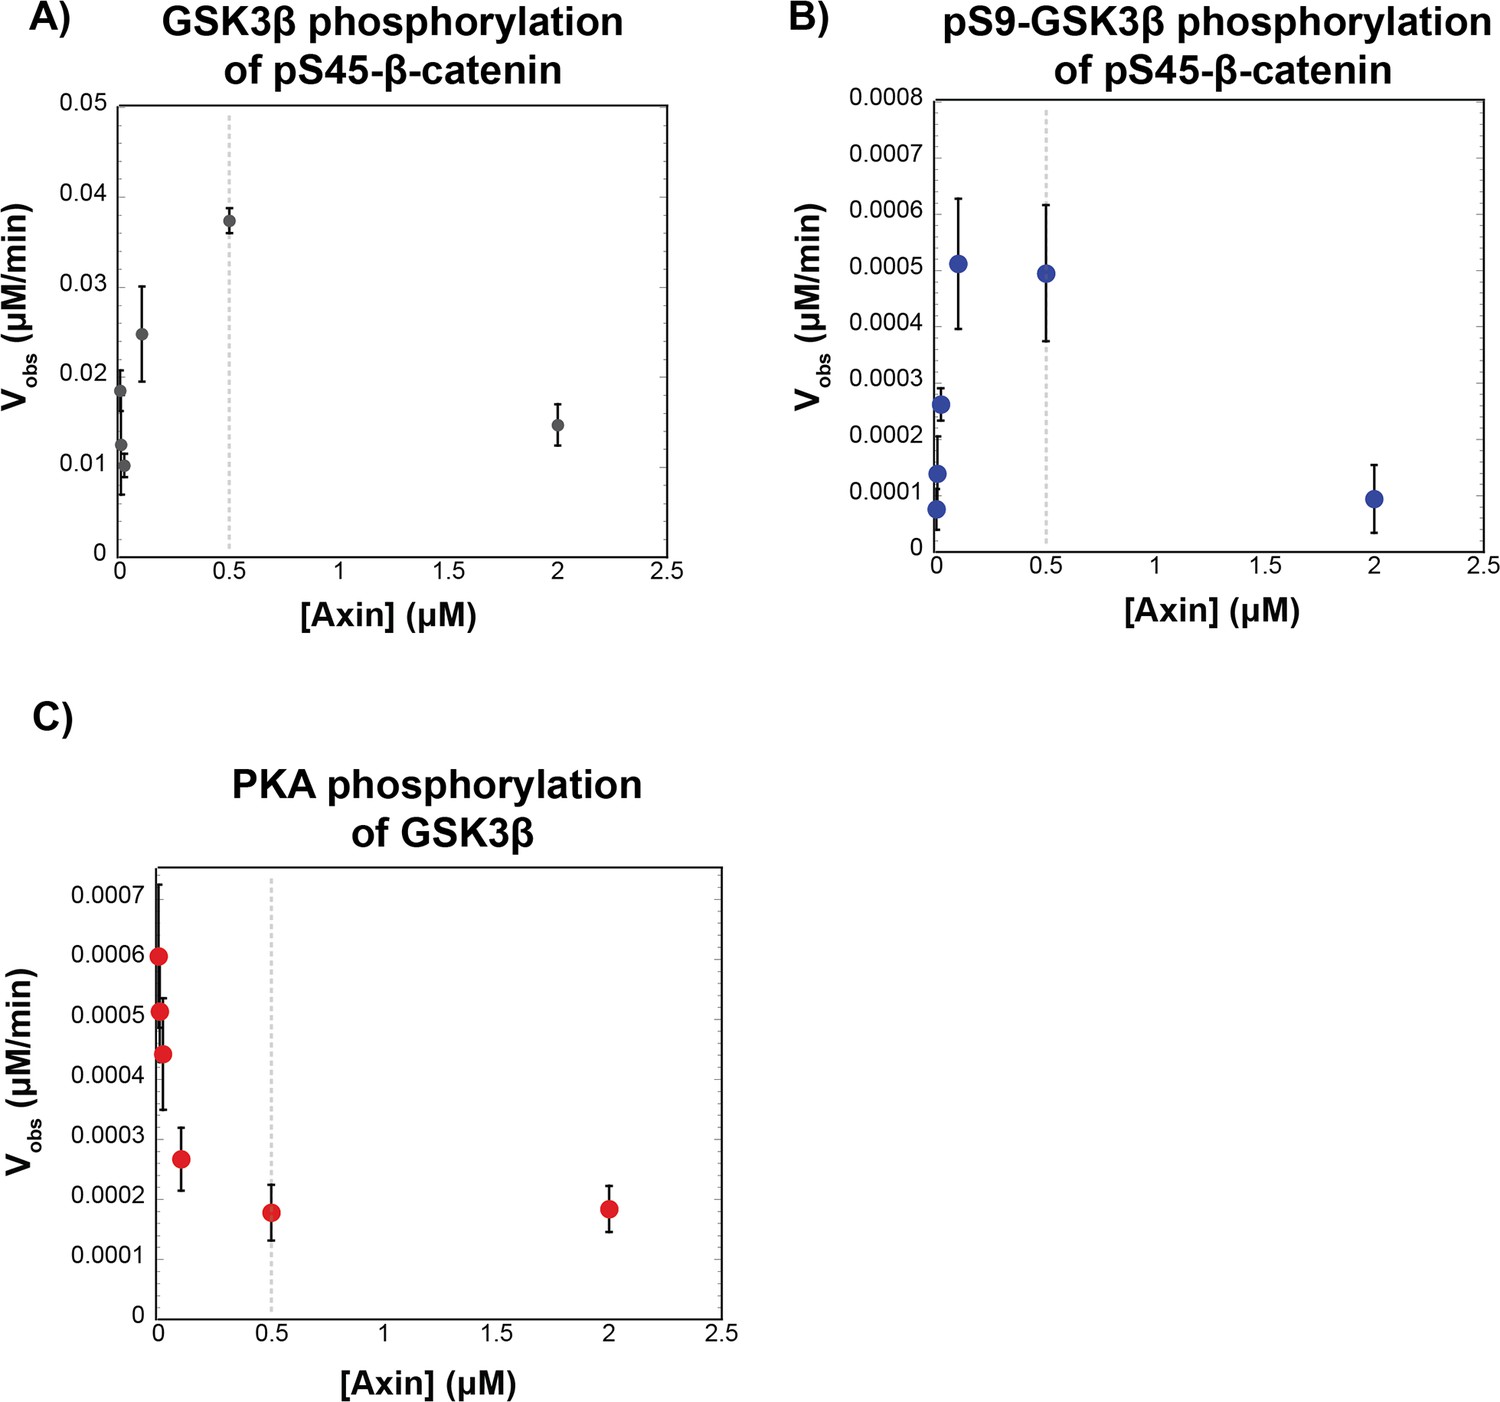
Varying the concentration of Axin does not produce larger rate effects than observed with 500 nM Axin.
(A) Plots of Vobs vs. [Axin] with 10 nM unphosphorylated GSK3β and 50 nM pS45-β-catenin. (B) Plots of Vobs vs. [Axin] with 10 nM pS9-GSK3β and 50 nM pS45-β-catenin. (C) Plots of Vobs vs. [Axin] with 20 nM PKA and 20 nM GSK3β. Error bars are mean ± SD for at least three biological replicates.
Figure 4 with 4 supplements
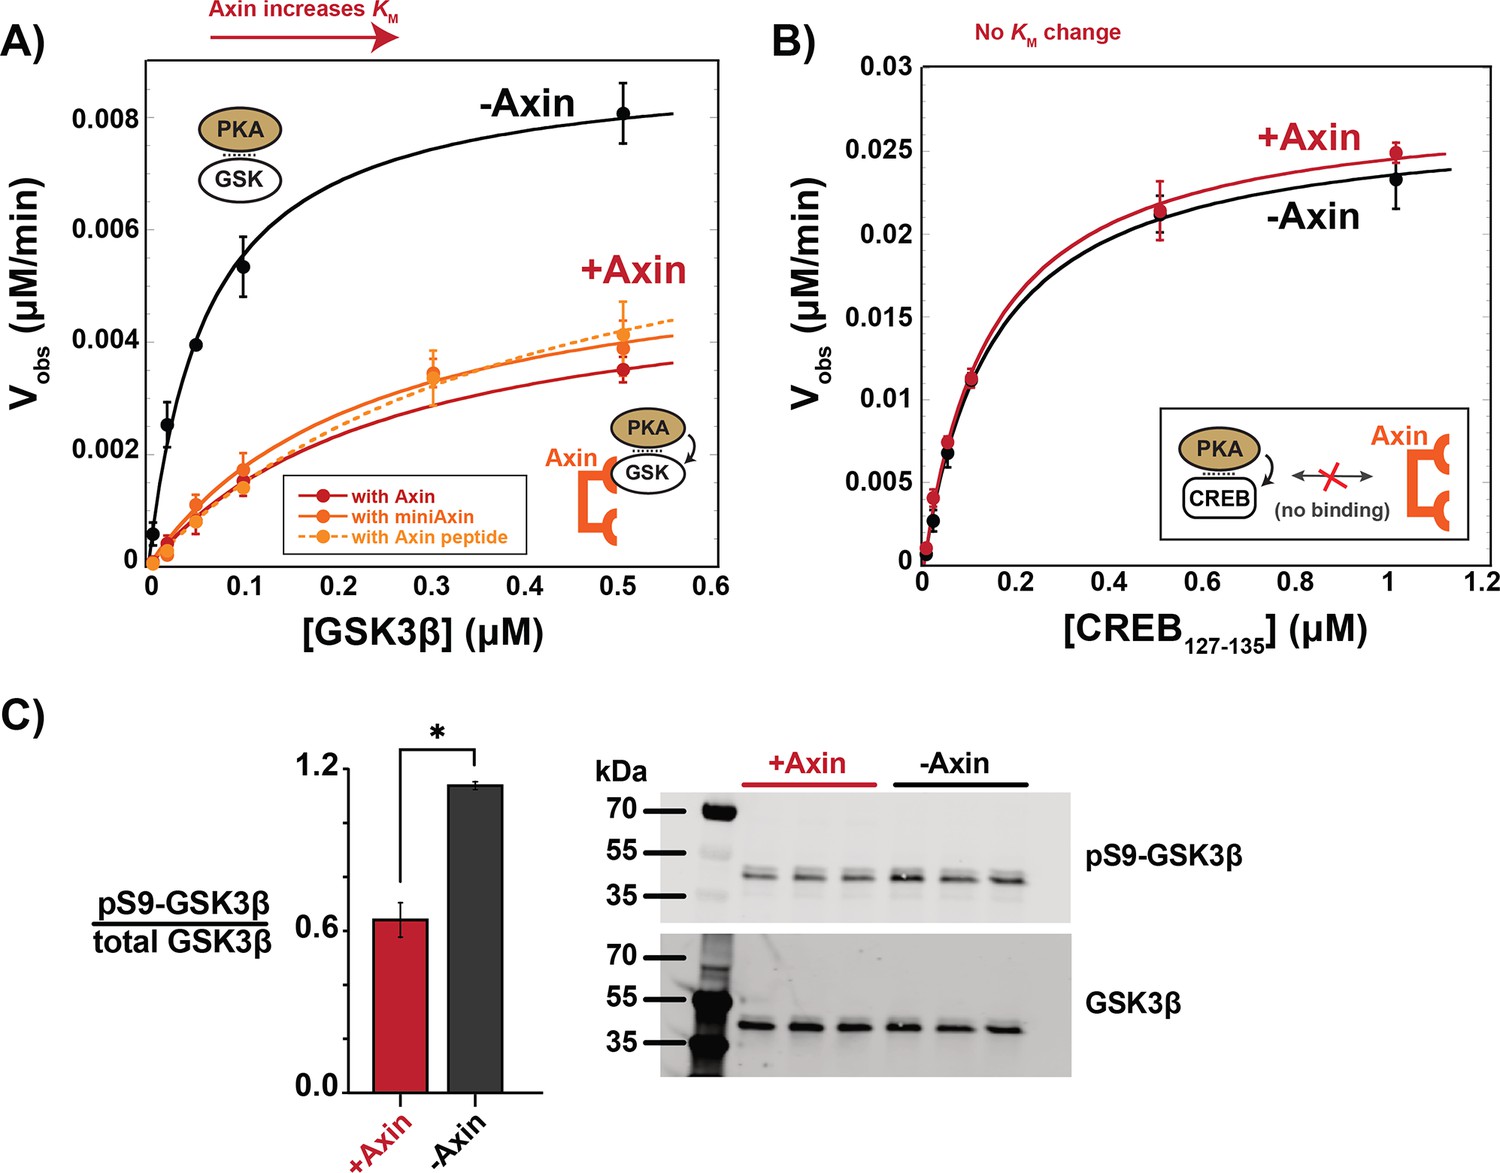
Axin prevents phosphorylation of GSK3β at Ser9.
(A) Michaelis-Menten plots of Vobs versus [GSK3β] with 20 nM PKA in the presence and absence of 500 nM Axin. (B) Michaelis-Menten plots of Vobs versus [CREB127-135] with 20 nM PKA in the presence and absence of 500 nM Axin. Values are mean ± SD for at least three biological replicates. See Supplementary file 1b for values of fitted kinetic parameters from (A) and (B). (C) Normalized western blot analysis and blot images of pS9-GSK3β in HEK293 cells transiently expressing Axin or a negative control (see Materials and methods). Normalized pS9-GSK3β levels were calculated for each biological sample by dividing pS9-GSK3β signal by total GSK3β and then averaging across three biological replicates. The p-value between Axin-expressing cells and non-Axin negative control cells is 0.00356 (two-tailed unpaired t-test). Full, uncropped western blot images are shown in Figure 4—figure supplement 3.
-
Figure 4—source data 1
Observed rates for data plotted in Figure 4A and B and quantification of western blot band intensities for Figure 4C.
- https://cdn.elifesciences.org/articles/85444/elife-85444-fig4-data1-v2.xlsx
-
Figure 4—source data 2
Uncropped western blots for pS9-GSK3β in HEK293 cells.
Western blot images of pS9-GSK3β and total GSK3β in HEK293 cells transiently expressing Axin or a negative control, related to Figure 4C.
- https://cdn.elifesciences.org/articles/85444/elife-85444-fig4-data2-v2.zip
Figure 4—figure supplement 1

Representative western blots for the reaction of PKA with GSK3β in the presence and absence of Axin.
Western blots for reactions of varying concentrations of GSK3β with 20 nM PKA +/-500 nM Axin. 500 nM GSK3β reaction gel samples without Axin were diluted 1:4 to prevent overloading the gel; all other reactions were diluted 1:2 (see Materials and methods). See Figure 4—figure supplement 2 for quantification.
-
Figure 4—figure supplement 1—source data 1
Representative western blots for the reaction of PKA with GSK3β in the presence and absence of Axin.
Western blots for reactions of varying concentrations of GSK3β with 20 nM PKA +/-500 nM Axin. 500 nM GSK3β reaction gel samples without Axin were diluted 1:4 to prevent overloading the gel; all other reactions were diluted 1:2 (see Materials and methods).
- https://cdn.elifesciences.org/articles/85444/elife-85444-fig4-figsupp1-data1-v2.zip
Figure 4—figure supplement 2

Plots of product vs. time for reaction of PKA with GSK3β in the presence and absence of Axin.
(A) Product vs. time plots for reactions of PKA with GSK3β in the absence of Axin. (B) Product vs. time plots for reactions of PKA with GSK3β in the presence of 500 nM Axin. Data in (A) and (B) correspond to the reaction conditions and western blots shown in Figure 4—figure supplement 1.
Figure 4—figure supplement 3
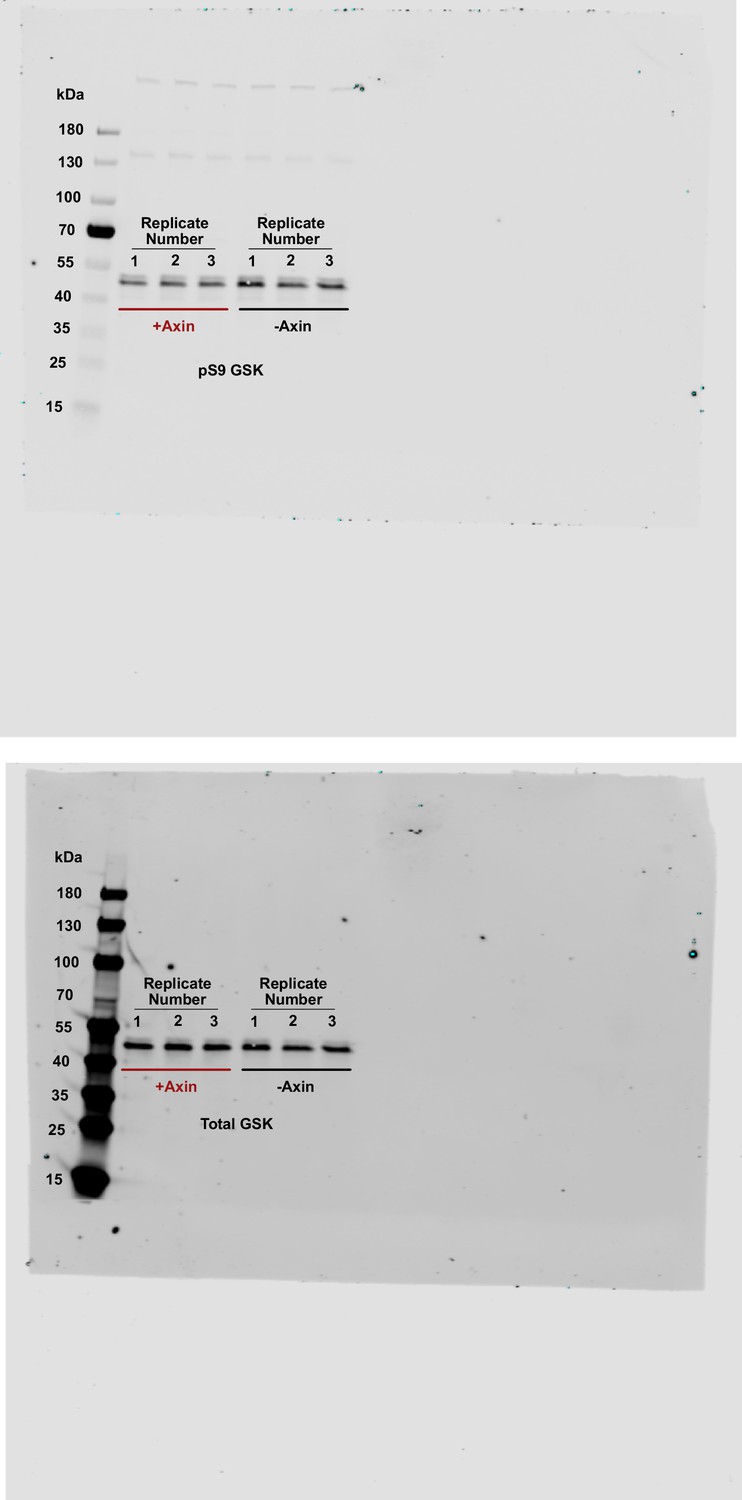
Uncropped western blots for pS9-GSK3β in HEK293 cells.
Western blot images of pS9-GSK3β and total GSK3β in HEK293 cells transiently expressing Axin or a negative control.
-
Figure 4—figure supplement 3—source data 1
Uncropped western blots for pS9-GSK3β in HEK293 cells.
Western blot images of pS9-GSK3β and total GSK3β in HEK293 cells transiently expressing Axin or a negative control.
- https://cdn.elifesciences.org/articles/85444/elife-85444-fig4-figsupp3-data1-v2.zip
Figure 4—figure supplement 4
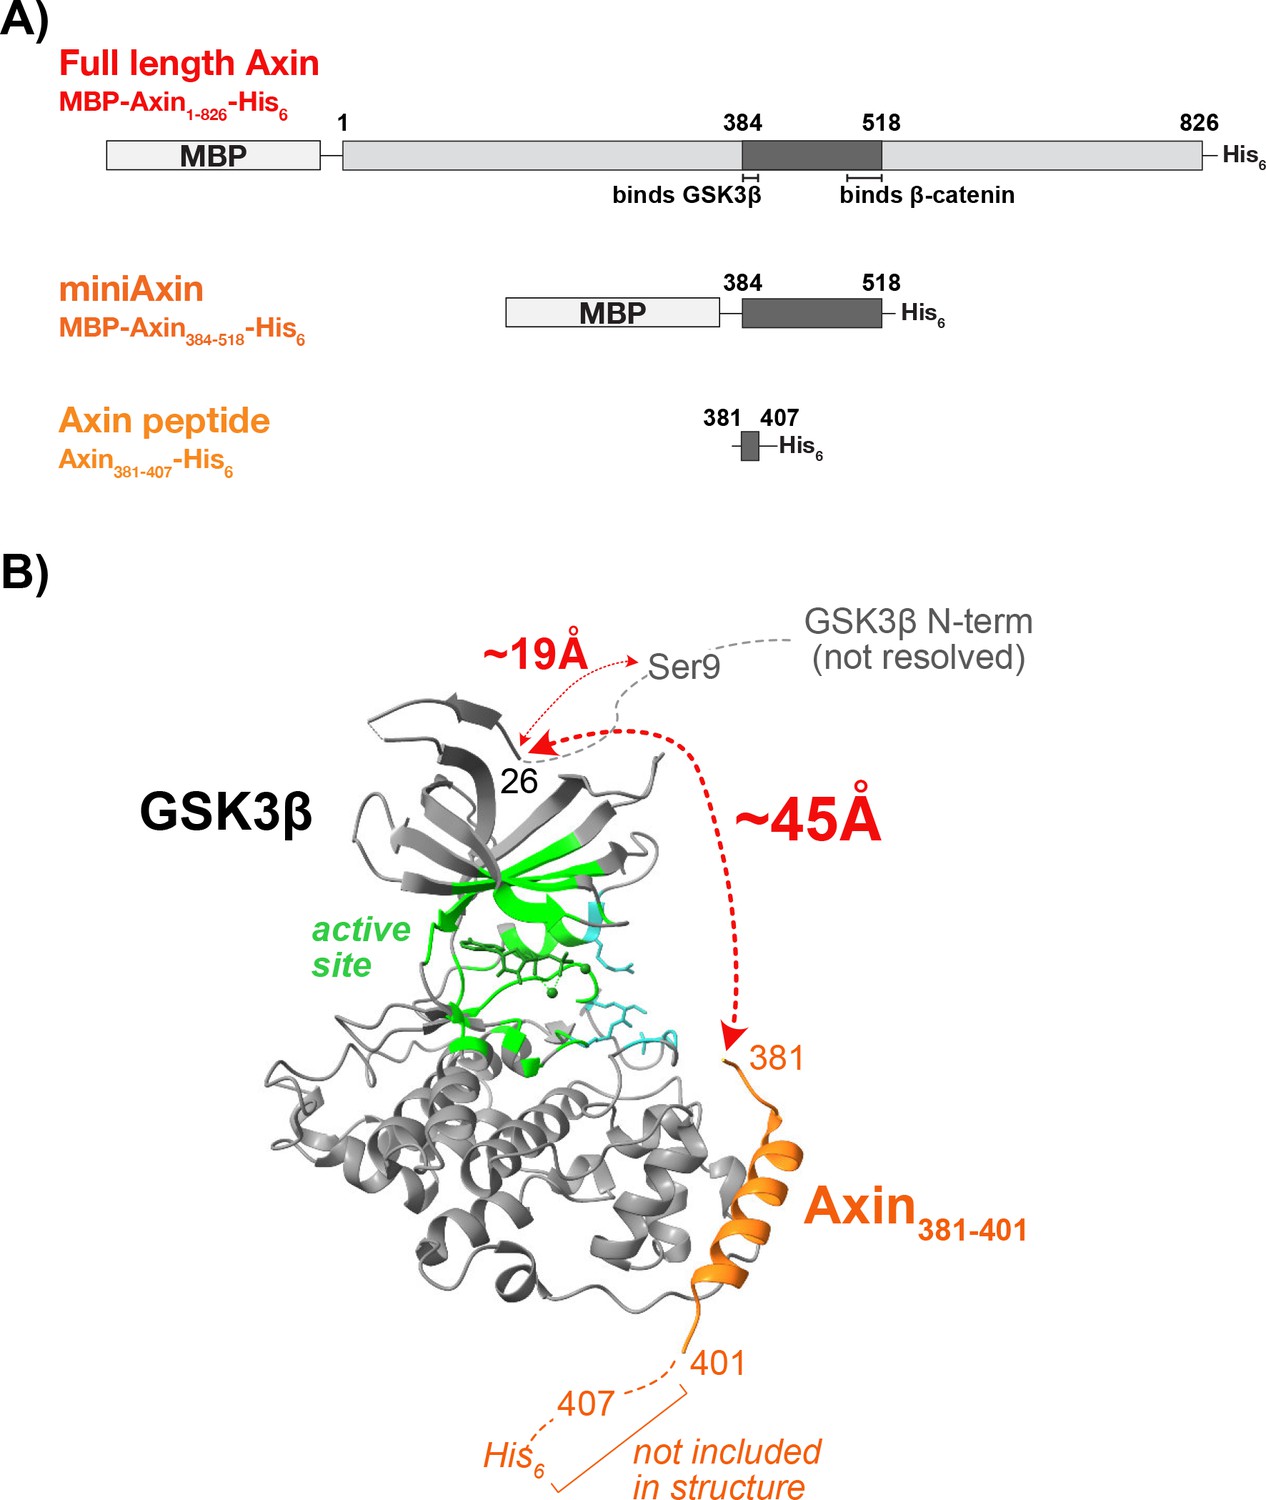
The Axin peptide is too far from the N-terminus of GSK3β to sterically occlude the Ser9 phosphorylation site.
(A) Schematics of full length Axin, miniAxin, and the minimal Axin peptide used in functional studies. Full length Axin and miniAxin were purified with an N-terminal maltose binding protein (MBP) and a C-terminal His tag. The Axin peptide was expressed as an MBP fusion and cleaved with TEV protease to produce the minimal sequence GS-Axin381-407-SGR-His6 (see Methods). (B) Crystal structure of GSK3β in complex with Axin381-401 (pdb 4nm0, Stamos et al., 2014). The GSK3β N-terminal residues 1–25 are not resolved. The Cα-Cα distance from Axin Ile381 to GSK3β Met26 is ~45 Å along the surface of GSK3β, determined by manually plotting five possible paths from Cα-Cα along the surface of GSK3β with distances of 48.1 Å, 44.7 Å, 45.4 Å, 49.9 Å, and 44.3 Å. For example, one path was calculated by measuring and summing the distances between the Cα of Met26 on GSK3β to the Cα of Lys123 on GSK3β and from the Cα of Lys123 on GSK3β to the Cα of Ile381 on Axin. These estimates are likely conservative, as we did not consider steric clash with GSK3β side chains. The direct linear Cα-Cα distance from Axin Ile381 to GSK3β Met26 is 41 Å, but this path sterically clashes with the N-lobe of the kinase. To estimate the distance of ~19 Å from GSK3β Met26 to Ser9, we used a worm-like chain model for a flexible peptide (Bertagna et al., 2008). Therefore, the minimal Axin381-407 peptide is unlikely to sterically occlude access to Ser9. Molecular graphics and analyses performed with UCSF Chimera, developed by the Resource for Biocomputing, Visualization, and Informatics at the University of California, San Francisco, with support from NIH P41-GM103311 (Pettersen et al., 2004).
Additional files
-
Supplementary file 1
For all fitted kinetic parameters, see the Methods section for the kinetic model used to fit the data to obtain observed values of kcat, KM, and kcat/KM.
Standard errors are from non-linear least squares fits to the initial rate data as described in the Methods. (a) Kinetic parameters for GSK3β reactions with pS45-β-catenin, related to Figures 2–3. a See Figures 2 and 3 for data. The pS9-GSK3β reactions in the absence of Axin did not detectably saturate up to 2 μM substrate (Figures 2 and 3), and only the value of kcat/KM could be accurately determined. No deviation from linearity was observed at 2 μM pS45-β-catenin (the highest pS45-β-catenin concentration tested), suggesting a conservative estimate that KM ≥2 μM. pS9-GSK3β, GSK3β, and GSK3β_S9A were coexpressed with lambda phosphatase. pS9-GSK3β and GSK3β_S9A were incubated with PKA and ATP before use (see Methods). The kcat/KM for λPPase-treated GSK3β is ~5 fold higher than for non-λPPase-treated GSK3β used in previous studies (Gavagan et al., 2020) (see Figure 2—figure supplement 9C and e). (b) Kinetic parameters for PKA reactions, related to Figure 4. (c) KM, ATP values for all reactions, related to Figure S3. (d) Kinetic parameters for pS45-β-catenin reactions with non-PKA treated GSK3β_S9A with and without λPPase treatment, related to Figure 2—figure supplement 9. a λPPase-treated GSK3β_S9A was coexpressed with lambda phosphatase before use (see Methods). Untreated GSK3β_S9A was expressed without lambda phosphatase. (e) Values of kcat/KM for untreated, λPPase-treated, and PKA-treated GSK3β and GSK3β_S9A in reactions with the substrate pS45-β-catenin, related to Figure 2—figure supplement 9. a See (Gavagan et al., 2020) and Figures 2 and 3, and Figure 2—figure supplement 9 for data. λPPase-treated GSK3β and GSK3β_S9A were coexpressed with lambda phosphatase before use. PKA-treated GSK3β and GSK3β_S9A were coexpressed with lambda phosphatase and then incubated with PKA and ATP before use (see Methods). PKA-treated GSK3β is pS9-GSK3β. The kcat/KM value for untreated GSK3β is from previous work (Gavagan et al., 2020). (f) Protein expression plasmids, related to Methods. a All proteins are human sequences except PKA, which is the mouse sequence. b pMBP-MG is a modified version of pMAL-p2X (New England Biolabs) with an N-terminal TEV-cleavable MBP tag and a C-terminal His6 tag. pBH4 is a modified version of pET15b (Novagen) with an N-terminal TEV-cleavable His6 tag. pBH4 and pMBP-MG were described previously (Good et al., 2009). c pMG024 was constructed by inserting GST from pETARA (Good et al., 2009) and the λPPase expression cassette (without the His tag) from pMG026 into the pES001 backbone. The GSK3β_S9A mutant (pMG071) was cloned into this dual expression cassette. d pMG051 was constructed by inserting the GST-CK1α expression cassette (without the His tag) from pMG046 into the pEF019 backbone. (g) Plasmids for cell culture experiments, related to Methods. (h) Antibodies, related to Methods.
- https://cdn.elifesciences.org/articles/85444/elife-85444-supp1-v2.docx
-
MDAR checklist
- https://cdn.elifesciences.org/articles/85444/elife-85444-mdarchecklist1-v2.pdf
-
Source data 1
Tables of data plotted in supplemental figures.
- https://cdn.elifesciences.org/articles/85444/elife-85444-data1-v2.xlsx
Download links
A two-part list of links to download the article, or parts of the article, in various formats.
Downloads (link to download the article as PDF)
Open citations (links to open the citations from this article in various online reference manager services)
Cite this article (links to download the citations from this article in formats compatible with various reference manager tools)
The Axin scaffold protects the kinase GSK3β from cross-pathway inhibition
eLife 12:e85444.
https://doi.org/10.7554/eLife.85444


