Subcortico-amygdala pathway processes innate and learned threats
- Department of Molecular Biology and Genetics, Aarhus University, Denmark
- DANDRITE, The Danish Research Institute of Translational Neuroscience, Aarhus University, Denmark
- Center for Proteins in Memory – PROMEMO, Danish National Research Foundation, Aarhus University, Denmark
- Department of Biomedicine, Aarhus University, Denmark
- Multiscale Sensory Structure Laboratory, National Institute of Genetics, Japan
- Department of Genetics, The Graduate University for Advanced Studies (SOKENDAI), Japan
Figures
Figure 1 with 4 supplements
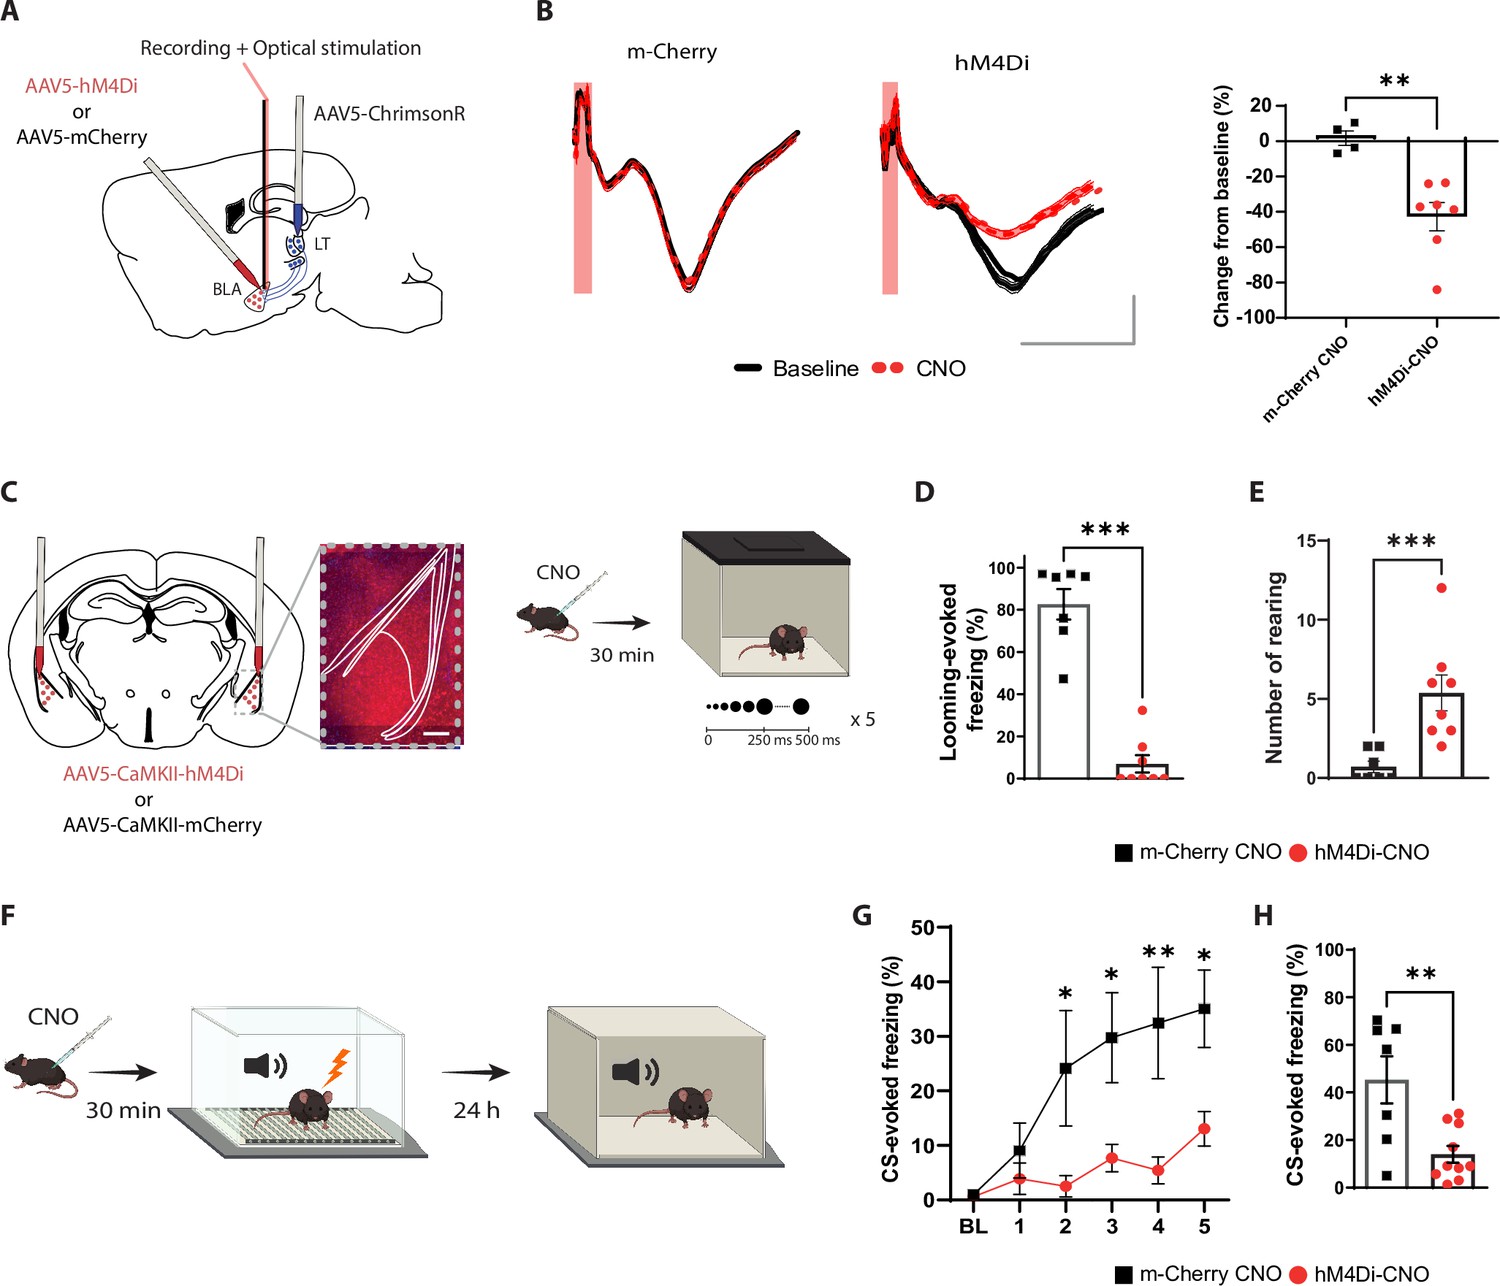
The basolateral amygdala (BLA) activity is required for processing innate as well as learned aversive signals.
(A) Experimental design of the in vivo electrophysiology experiment. Mice were injected unilaterally with AAV vectors expressing ChrimsonR in the lateral thalamus (LT) and with hM4Di or m-Cherry in the BLA. (B) Clozapine-N-oxide (CNO) reduces the amplitude of the field excitatory postsynaptic potential (fEPSP) in hM4Di- but not m-Cherry-expressing neurons. Left panel: fEPSP is unchanged after CNO injection in the m-Cherry group. Middle panel: fEPSP is reduced after CNO injection in the hM4Di group. Shadowed area represents the SEM. Scale bar, 5 ms, 0.1 mV, the red bar represents the pulse of light (0.5 ms, 638 nm). Right panel: differential score comparing the change between before and after CNO injection in the two groups (m-Cherry-CNO, n = 4; hM4Di-CNO, n = 7; unpaired t-test, p-value=0.0033). (C) Experimental design of the behavioral experiment. Mice were injected bilaterally with AAV-expressing hM4Di or m-Cherry in the BLA. Scale bar, 250 um. After 3 wk of virus expression, the mice were exposed to the looming stimulus 30 min after CNO injection. (D) The freezing level is significantly reduced in the hM4Di-CNO group (n = 8) compared to the m-Cherry-CNO group (n = 7; Mann–Whitney test, p-value=0.0003). (E) The rearing events are significantly increased in the hM4Di-CNO group (n = 8) compared to the m-Cherry-CNO group (n = 7; Mann–Whitney test, p-value=0.0006). (F) One day after the looming exposure, the same animals were injected with CNO 30 min prior to the aversive conditioning protocol. Twenty-four hours later, the mice were tested in a new context in a CNO-free trial. (G) Freezing level during the baseline period (BL) and the five tone and foot-shock pairings. The conditioned stimulus (CS)-evoked freezing is significantly reduced in the hM4Di-CNO group (n = 10) than the m-Cherry-CNO group (n = 7; repeated-measures ANOVA for group by time interactions, F: 5,80 = 3.916, p-value=0.0032 with Sìdak test correction). (H) The CS-evoked freezing in a new context is significantly reduced in the hM4Di-CNO group (n = 10) compared to the m-Cherry-CNO group (n = 7; unpaired t-test, p-value=0.0041). Results are reported as mean ± SEM. *p<0.05; **p<0.01; ***p<0.001.
Figure 1—figure supplement 1
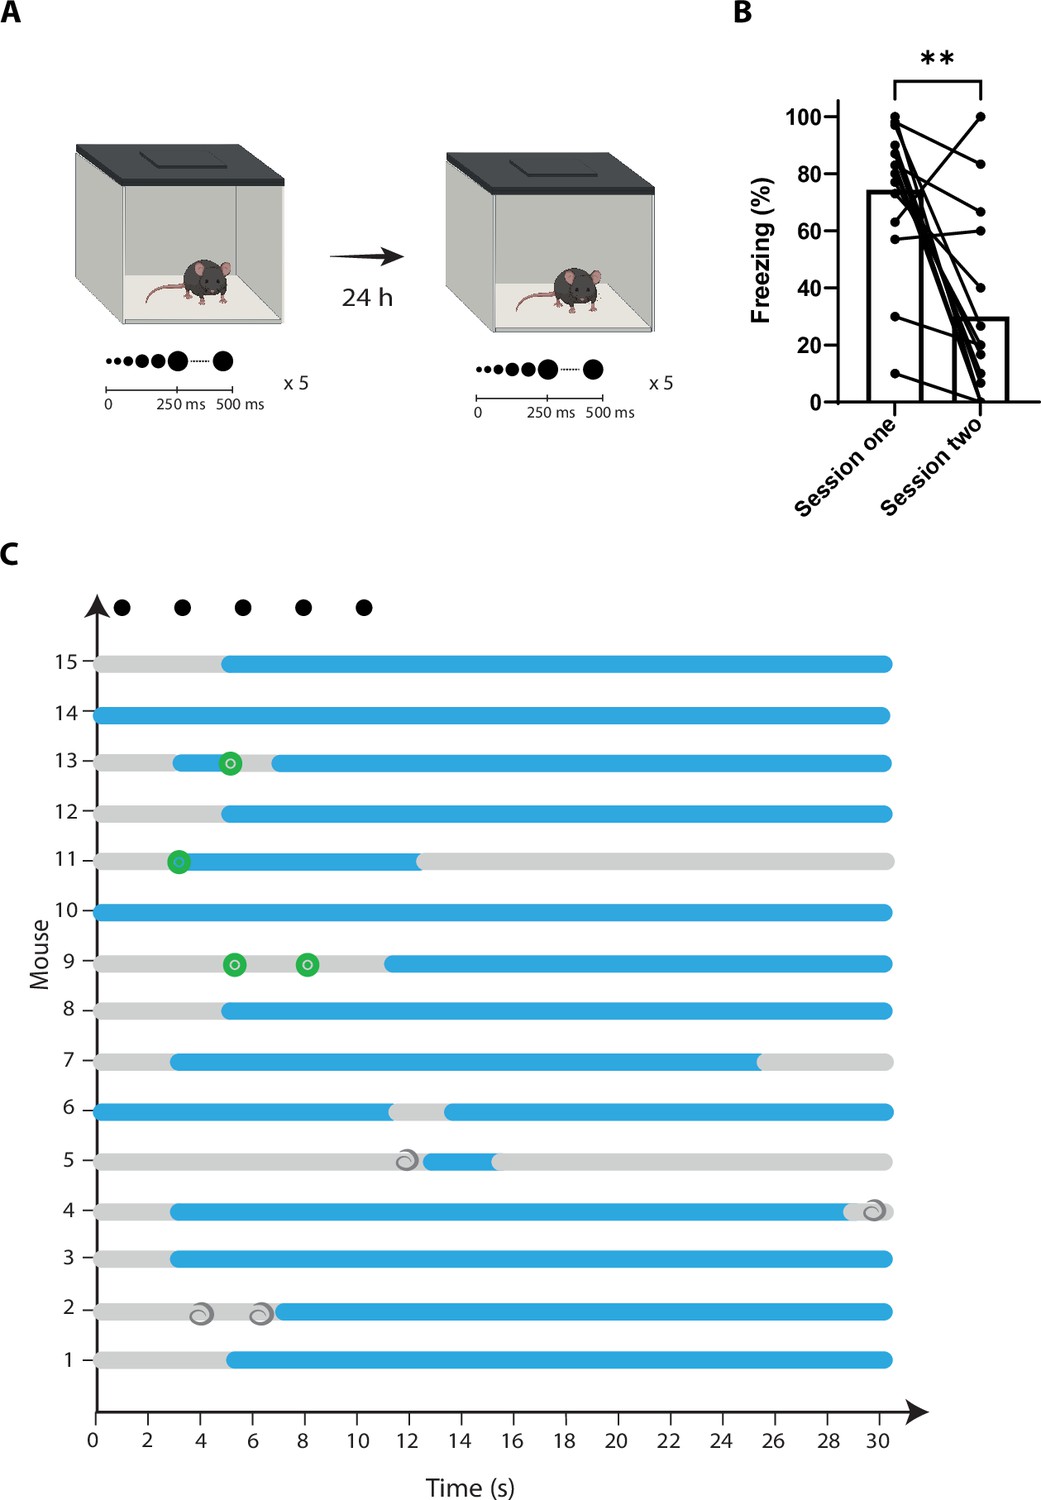
The looming stimulus response is rapidly habituated.
(A) The timeline shows the different stages of the experiment in naïve mice. (B) Looming-evoked freezing is reduced after multiple presentations of the looming stimulus (n = 15, Wilcoxon test, p-value=0.0014). (C) Ethograms display the defensive responses of each mouse during the first exposure to the looming stimulus. Results are reported as mean ± SEM. **p<0.01.
Figure 1—figure supplement 2
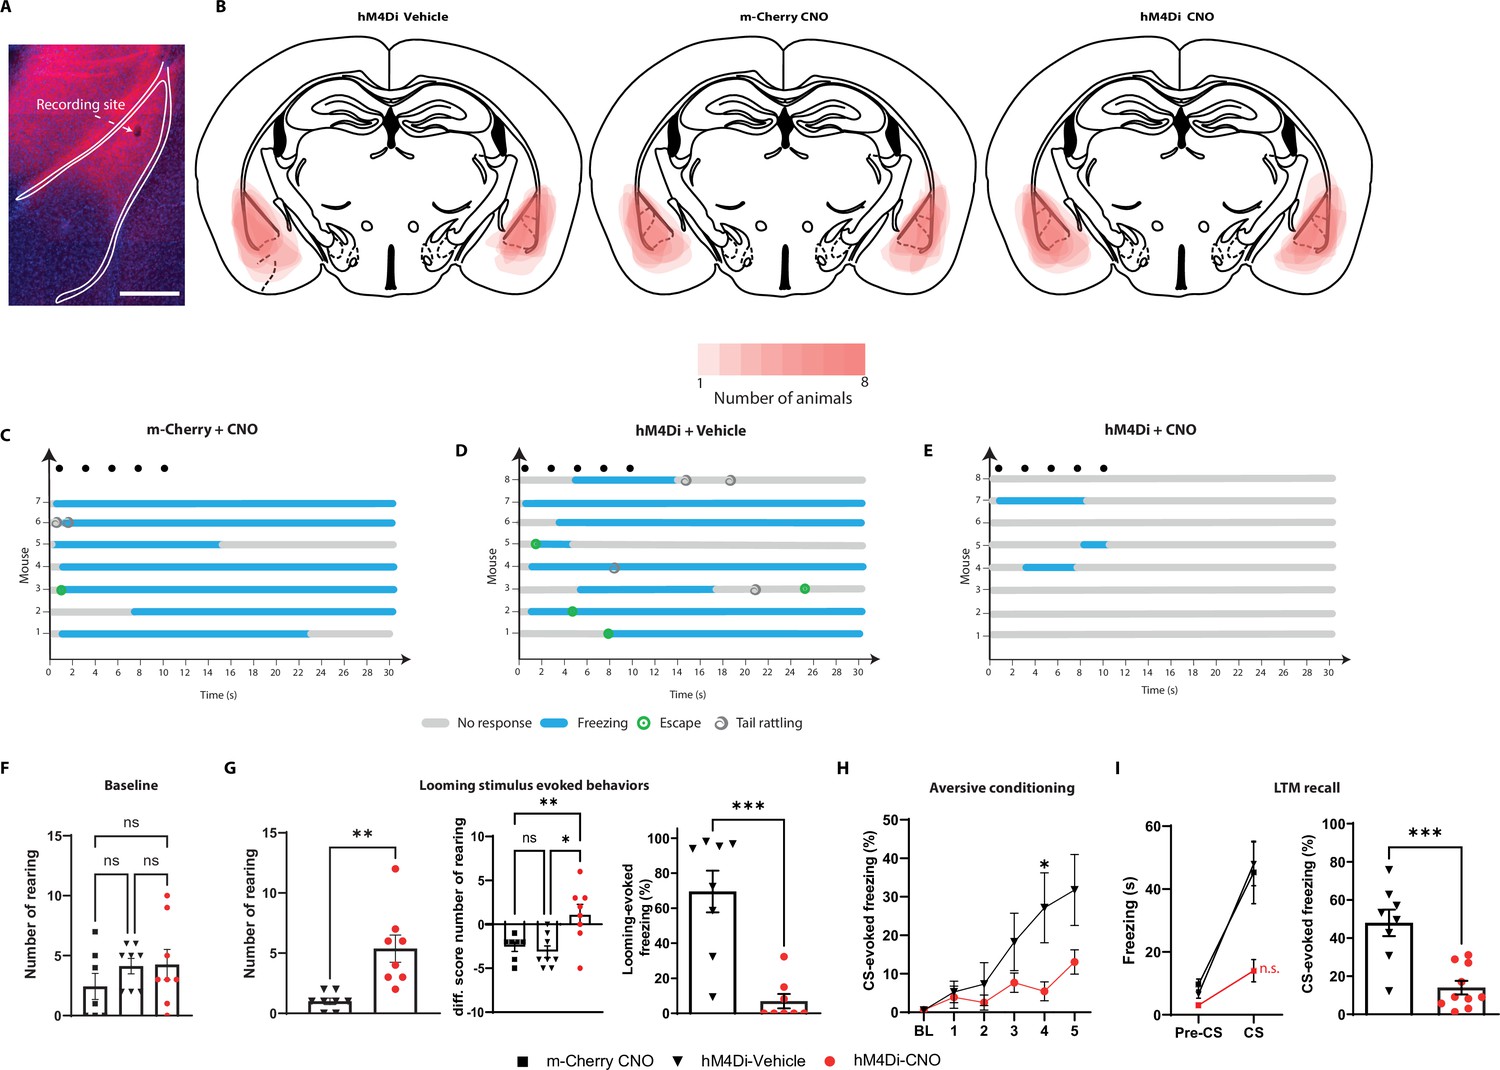
The basolateral amygdala (BLA) is required for the looming stimulus defensive response.
(A) Representative example of the placement of the recording site in a mouse from Figure 1A and B. (B) Overlay of the maximal virus expression for each mouse from Figure 1. (C–E) Ethograms show the defensive responses to the looming stimulus for the m-Cherry-CNO, hM4Di-Vehicle, and hM4Di-CNO groups, respectively. (F) The number of rearing events is comparable between the three groups during the pre-looming stimulus period (Kruskal–Wallis test, F = 3.23, p-value=0.3463). (G) Left: the number of rearing events is significantly higher in the hM4Di-CNO (n = 8) compared to the hM4Di-Vehicle group (n = 8) during the looming stimulus exposure (unpaired t-test, p-value=0.0021). Middle: hM4Di-CNO shows an increase in the differential score (diff. score) for rearing events compared to the two control groups (ordinary one-way ANOVA, F(2, 20) = 6,853, p-value=0.0054). Right: the hM4Di-CNO (n = 8) group shows a significant reduction in the freezing level when exposed to the looming stimulus compared to the hM4Di-Vehicle group (n = 8, unpaired t-test, p-value=0.0002). (H) The graph shows the freezing level during the baseline period (BL) and the five pairings during the conditioning protocol. The hM4Di-CNO group (n=10) shows a significant reduction in conditioned stimulus (CS)-evoked freezing than the hM4Di-Vehicle group (n = 8; repeated-measures ANOVA for group by time interactions, F: 5,75 = 3.808, p-value=0.0040 with Sìdak test correction). (I) Left: the hM4di-Vehicle and m-Cherry-CNO groups showed significantly higher freezing during the CS presentation compared to the pre-CS period (mixed-effects analysis, Group × Phase interaction: F(2,45) = 6.477; p-value=0.0034; simple effect of phase within the hM4Di-CNO group: p-value=0.2111; simple effect of phase within each of the remaining groups: p<0.0001). Right: the graph shows the CS-evoked freezing in a new context. The hM4Di-CNO group (n = 10) shows a significant reduction in tone-evoked freezing than the hM4Di-Vehicle group (n = 8; unpaired t-test, p-value=0.0003). Data of the hM4Di-CNO group are a replica as in Figure 1. Results are reported as mean ± SEM. ns, nonsignificant; *p<0.05; **p<0.01; ***p<0.001.
Figure 1—figure supplement 3
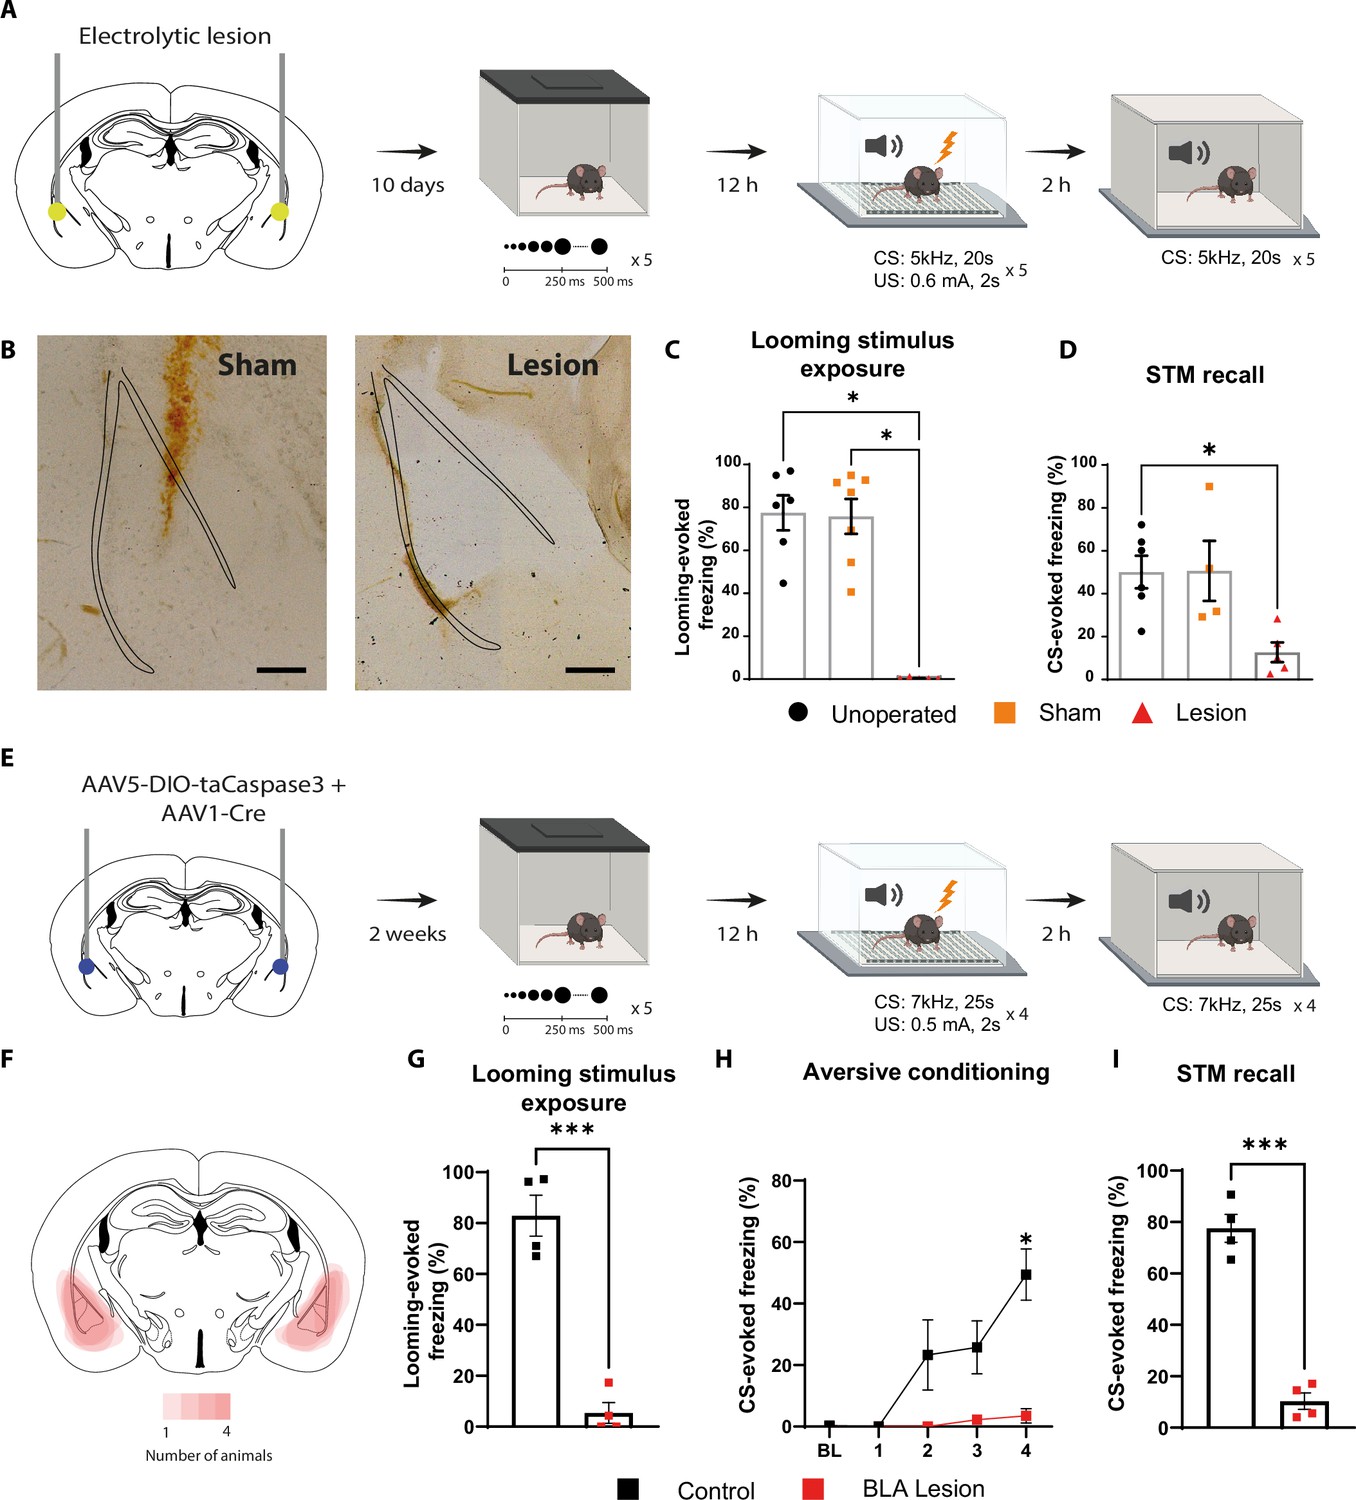
Lesioning basolateral amygdala (BLA) blocks the defensive responses to the looming stimulus and the aversive conditioning.
(A) Timeline showing the different stages of the experiment. (B) Representative images showing the electrode placement in a mouse from the sham group (left) and the extent of the lesion in the BLA in a mouse from the lesioned group (right). Scale bar, 200 µm. (C) Freezing level is significantly reduced in the lesioned group (n = 5) compared to the unoperated (n = 6) and sham groups (n = 7; Kruskal–Wallis test, F: 3,18; p-value=0.0016 with Dunn’s multiple-comparison test). (D) Tone-evoked freezing in a new context during the short-term memory recall (STM). The lesioned group (n = 5) shows a significant reduction in conditioned stimulus (CS)-evoked freezing than the unoperated (n = 6) and sham groups (n = 4; Kruskal–Wallis test, F: 3,15; p-value=0.0049 with Dunn’s multiple-comparison test). (E) Timeline showing the different stages of the experiment. (F) Overlay of the maximum extent of the lesion in the BLA-lesioned group (n = 4). (G) Looming stimulus-evoked freezing is significantly reduced in the mice from the BLA-lesioned group (n = 4) compared to the control group (n = 4) injected with DIO-taCaspase3 only (unpaired t-test, p-value=0.0001). (H) During aversive conditioning, mice from the BLA-lesioned group (n = 4) shows a significant reduction in the tone-evoked freezing compared to the control group (n = 4; repeated-measures ANOVA for group by time interactions, F: 4,24 = 10.02, p-value<0.0001 with Sìdak test correction). (I) Tone-evoked freezing in a new context during the STM. The BLA-lesioned group (n = 4) shows a significant reduction in tone-evoked freezing compared to the control group (n = 4; unpaired t-test, p-value<0.0001). Results are reported as mean ± S.E.M. *p<0.05; ***p<0.001.
Figure 1—figure supplement 4
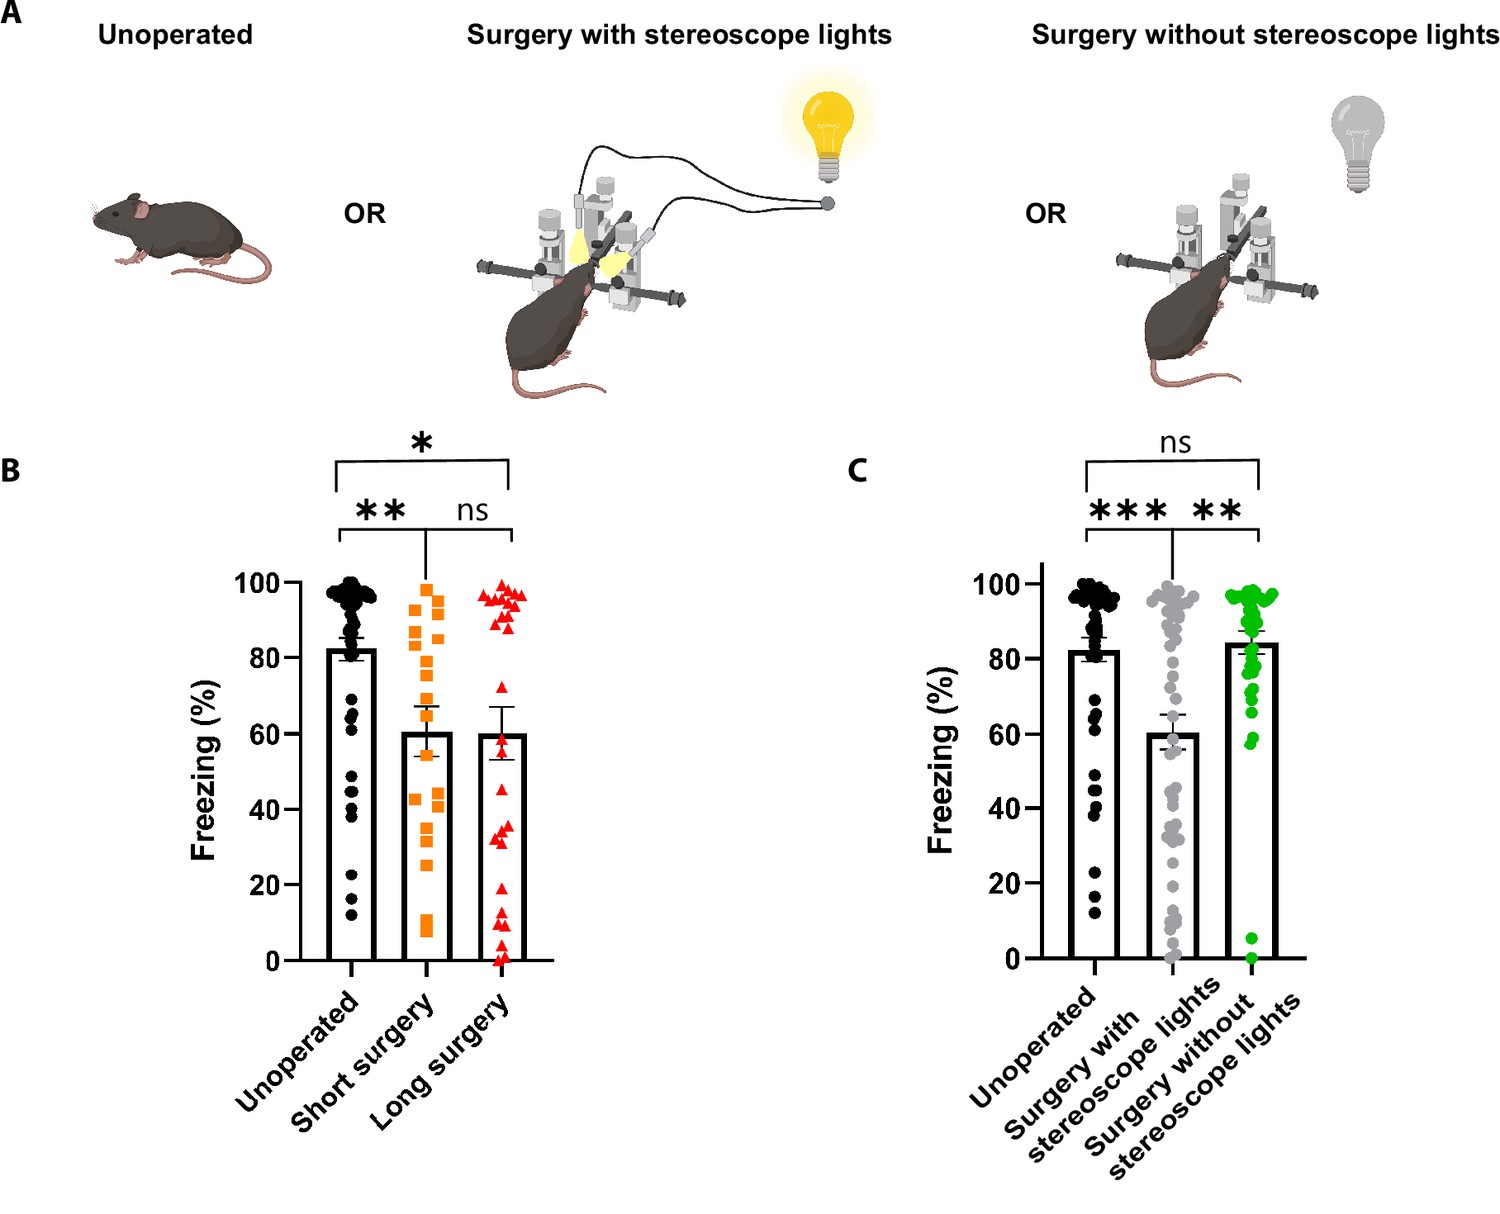
Effect of the surgery on the looming stimulus-evoked responses.
(A) Diagram of the three experimental groups. (B) The surgery with stereoscope lights significantly reduced the looming stimulus-evoked freezing regardless of the length of the surgeries (unoperated, n = 54; short surgery, n = 20; long surgery, n = 29; Kruskal–Wallis test, p-value=0.0007). (C) Surgery without the stereoscope lights group (n = 45) showed no significant difference in the looming stimulus-evoked freezing compared to the unoperated group (n = 54). Short- and long-surgery groups were pooled together in the group Surgery with stereoscope lights (n = 49; Kruskal–Wallis test, p-value=0.0002). Results are reported as mean ± SEM. ns, not significant; *p<0.05; **p<0.01; ***p<0.001.
Figure 2 with 2 supplements
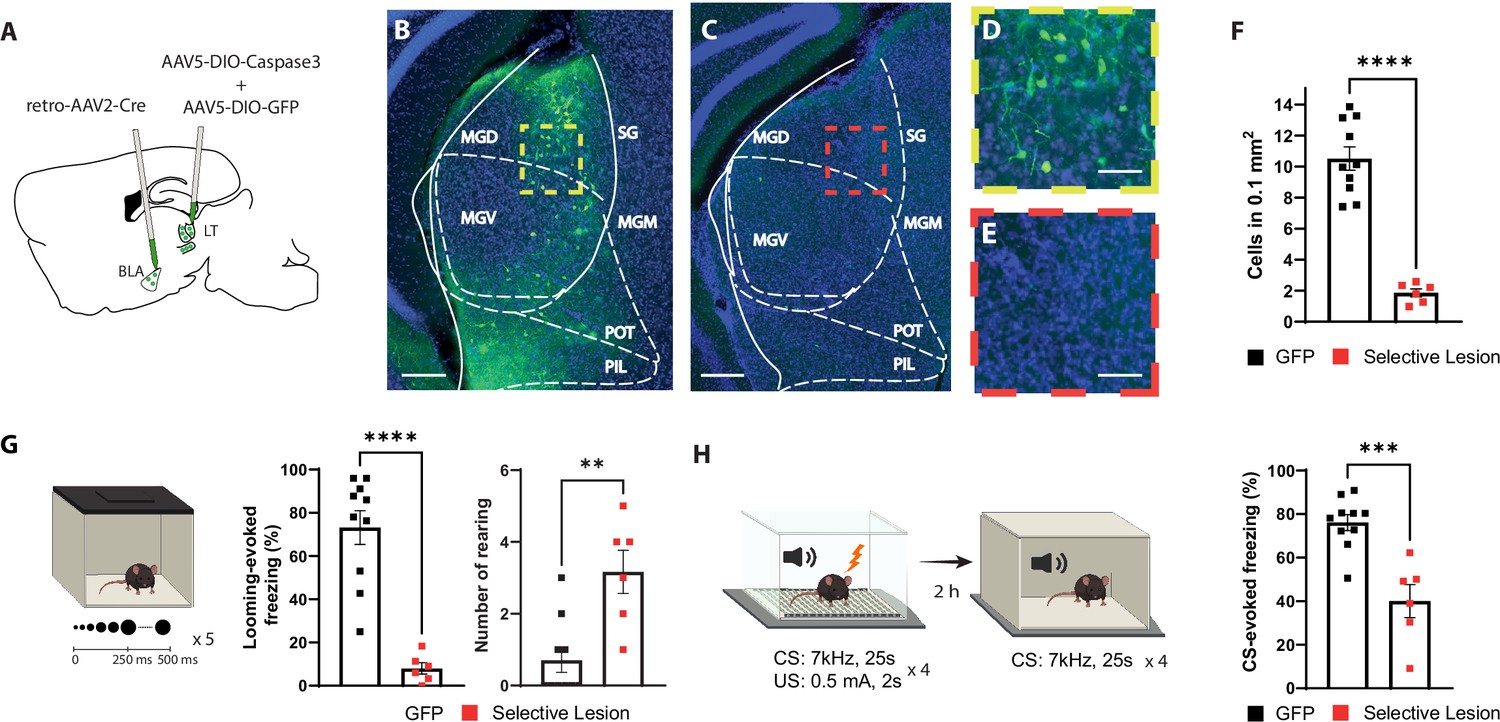
Selective lesion of the basolateral amygdala (BLA)-projecting neurons in the lateral thalamus (LT) impairs the defensive responses to the looming stimulus and the aversive conditioning.
(A) Viral strategy for the selective lesion of BLA-projecting LT neurons. The GFP group was injected with retro-AAV2-Cre in BLA and AAV5-DIO-GFP only in the LT. (B, C) Representative image showing retrogradely transported GFP in the BLA-projecting LT neurons in a mouse from the GFP group (B) and a mouse from the selective lesion group (C), respectively. Scale bar, 200 um. (D, E) Zoomed-in images from the regions outlined in yellow from (B) and in red from (C). Scale bar, 50 um. (F) Quantification of GFP+ neurons in the LT. The selective lesion group (n = 6) showed a significant reduction in the number of GFP+ neurons compared to the GFP group (n = 10; unpaired t-test, p-value<0.0001). (G) Mice were exposed to the looming stimulus. The freezing level is significantly reduced in the selective lesion group (n = 6) compared to the GFP group (n = 10; Mann–Whitney test, p-value<0.0001). The rearing frequency is significantly higher in the selective lesion group (n = 6) compared to the GFP group (n = 10; Mann–Whitney test, p-value=0.0050). (H) The same mice were conditioned 1 d after the looming exposure. The mice were tested for memory recall in a new context 2 hr later. The selective lesion group (n = 6) showed a significant reduction in conditioned stimulus (CS)-evoked freezing compared to the GFP group during the short-term memory (STM) recall (n = 10; unpaired t-test, p-value=0.0003). Results are reported as mean ± SEM. **p<0.01; ***p<0.001; ****p<0.0001.
Figure 2—figure supplement 1
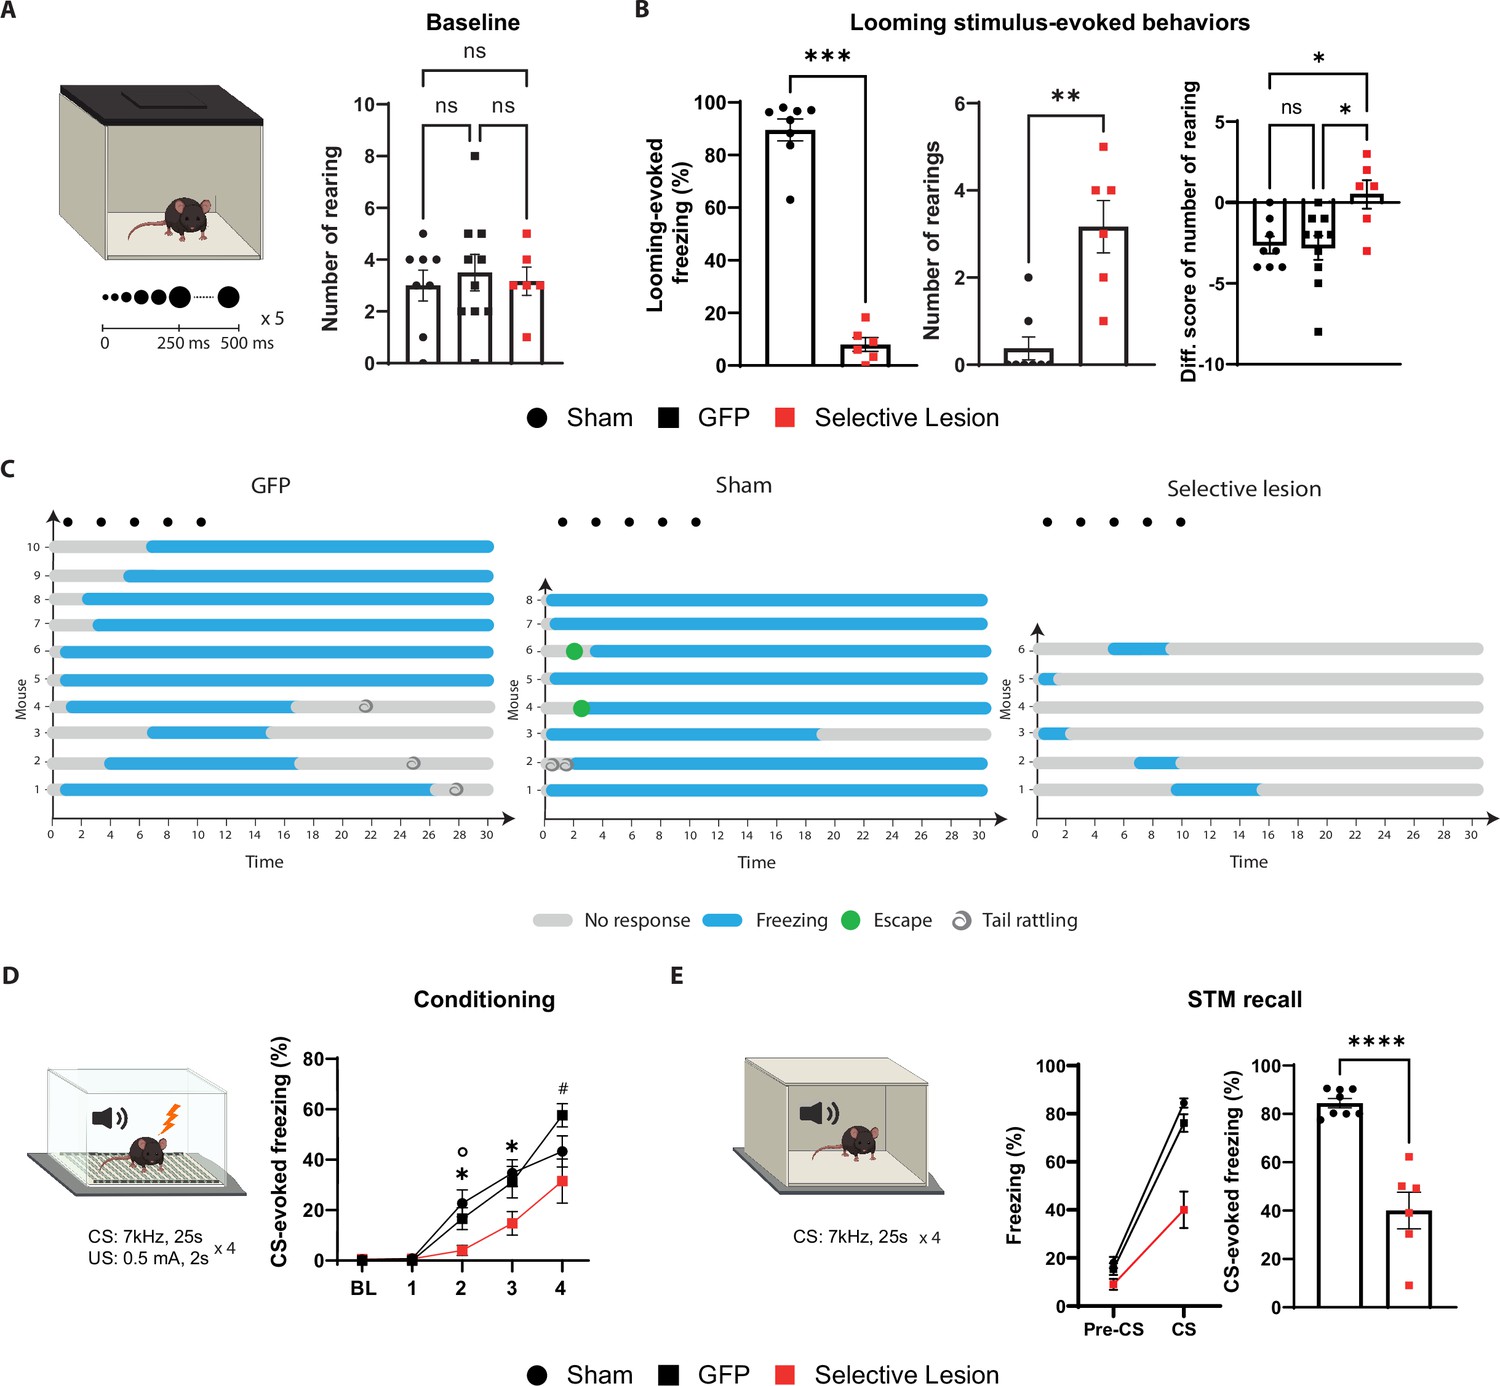
The selective lesion of the basolateral amygdala (BLA)-projecting neurons in lateral thalamus (LT) impairs the defensive responses to the looming stimulus and the aversive conditioning.
(A) The number of rearing events is comparable between the three groups during the pre-looming stimulus period (ordinary one-way ANOVA, F = 1.017 (2,21), p-value=0.3787). (B) Left: the freezing level is significantly reduced in the selective lesion group (n = 6) compared to the sham group (n = 8; Mann–Whitney test, p-value=0.0007). Middle: selective lesion group shows an increase in the differential score (diff. score) for rearing events compared to the two control groups (ordinary one-way ANOVA, F(2, 21) = 5,530; p-value=0.0118). Right: the number of rearing events is significantly higher in the selective lesion group (n = 6) compared to the sham group (n = 8) during the looming stimulus exposure (Mann–Whitney test, p-value=0.0020). (C) Ethograms represent the defensive responses to the looming stimulus for each group. (D) During aversive conditioning, mice from the selective lesion group (n = 6) show a significant reduction in the tone-evoked freezing response compared to the GFP group (n = 10) and sham group (n = 8; repeated-measures ANOVA for group by time interactions, F: 8,84=2.758, p-value=0.0093 with Holm–Sìdak test correction). (E) Left: all the groups showed significantly higher freezing during the conditioned stimulus (CS) presentation compared to the pre-CS period (mixed-effects analysis, Group x Phase interaction: F(2,21) = 17.98; p-value<0.0001). Right: CS-evoked freezing in a new context during the short-term memory recall. The selective lesion group (n = 6) shows a significant reduction in CS-evoked freezing compared to the sham group (n = 8; unpaired t-test, p-value<0.0001). The data for the selective lesion group are the replica of Figure 2. The results are reported as mean ± SEM. ns, nonsignificant; #,*p<0.05; **p<0.01; ***p<0.001; ****p<0.0001.
Figure 2—figure supplement 2

Lesioning the temporal associative cortex (TeA) and auditory cortex (AuC) does not affect the defensive responses to the looming stimulus and aversive conditioning.
(A) Timeline represents the different stages of the experiment. (B) Overlay of the maximal spread of the lesion in the mice from the cortical lesion group (n = 6). (C) The looming stimulus-evoked freezing is comparable between the mice from the cortical-lesioned group (n = 6) compared to the control group (n = 8) injected with DIO-taCaspase3 only (unpaired t-test, p-value=0.8189). (D) During aversive conditioning, the mice from the cortical-lesioned group (n = 6) show a slight reduction in the tone-evoked freezing compared to the control group, but the difference is not significant (n = 8; repeated-measures ANOVA for group by time interactions, F: 4,48=2.035, p-value=0.1043). (E) Tone-evoked freezing in a new context during the short-term memory (STM) recall. The cortical-lesioned group (n = 6) shows a similar level of tone-evoked freezing compared to the control group (n = 8; unpaired t-test, p-value=0.7672). Results are reported as mean ± SEM. ns, nonsignificant.
Figure 3 with 1 supplement
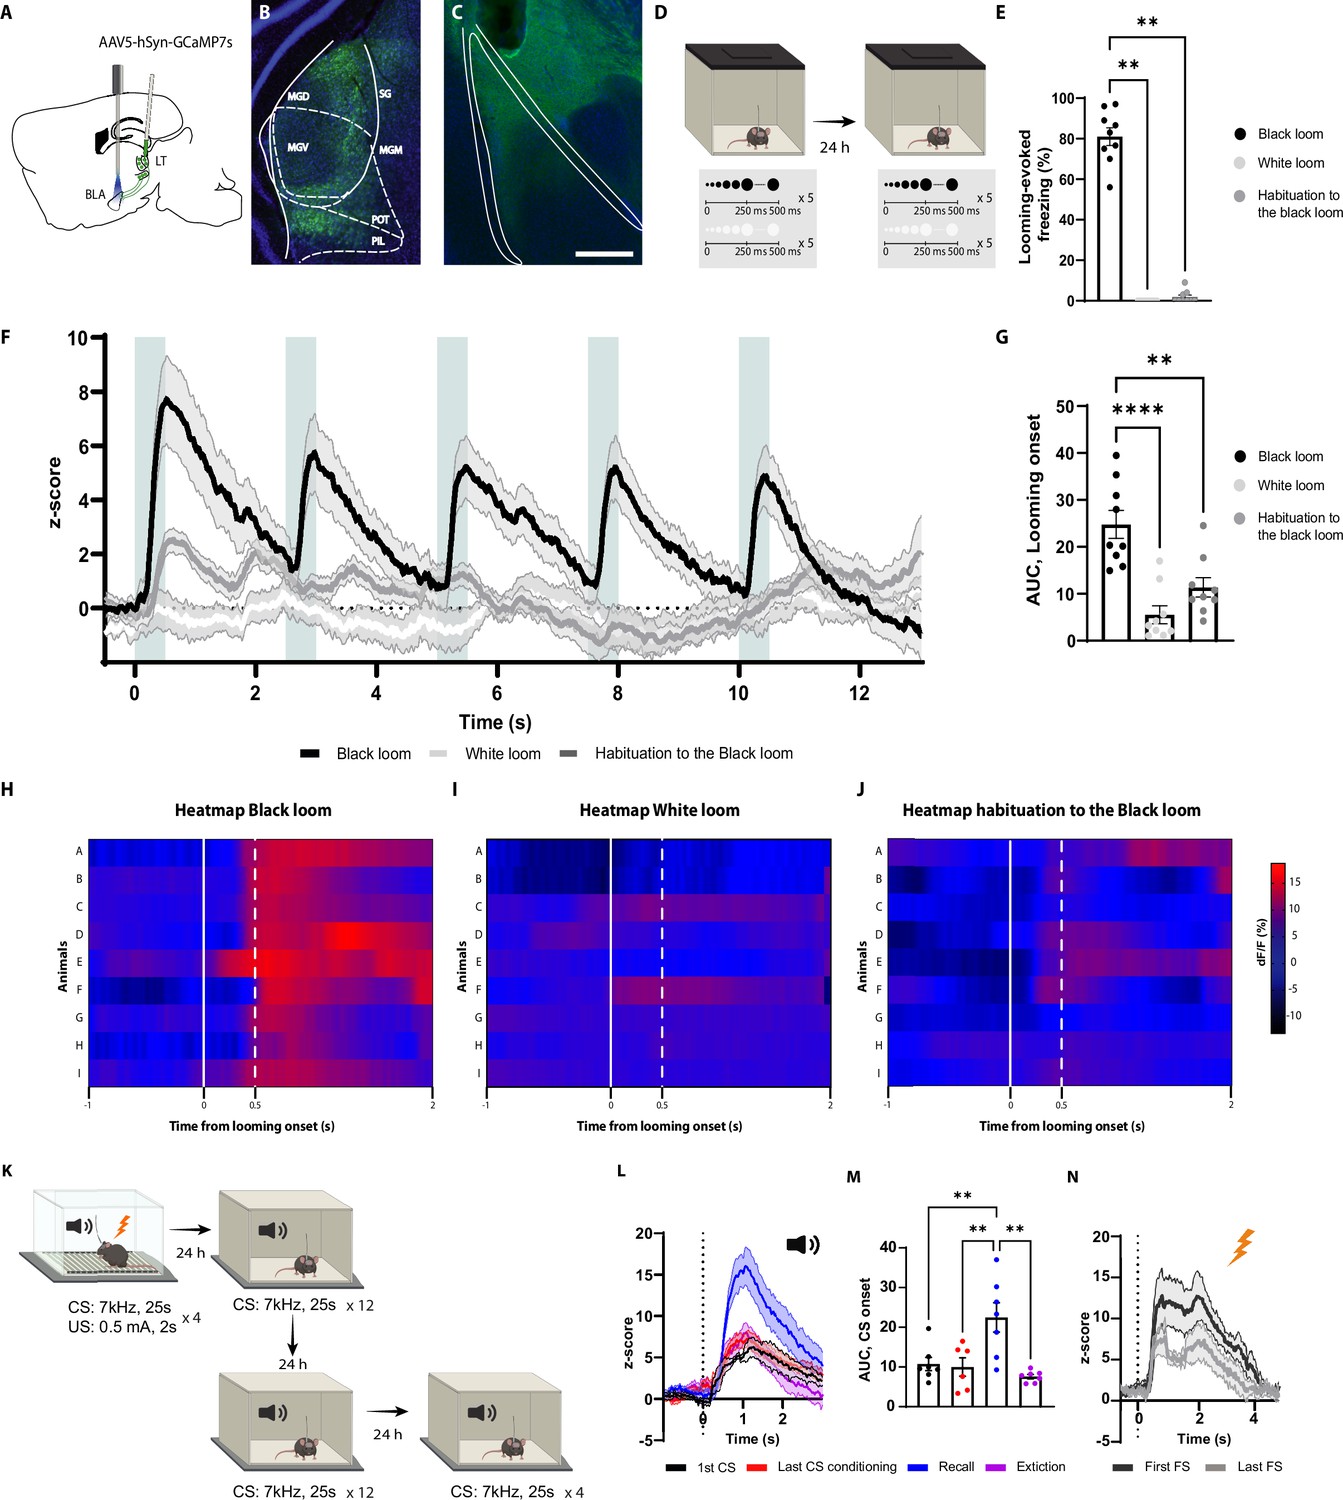
The axons of the basolateral amygdala (BLA)-projecting neurons in the lateral thalamus (LT) are activated by the looming stimulus and show an increase in conditioned stimulus (CS)-evoked response following aversive conditioning.
(A) Illustration showing virus injection and the optic fiber implantation strategy for GCaMP7s recordings from the axon terminals of the BLA-projecting MGN neurons. (B) Representative image of GCaMP7s expression in the MGN. Scale bar, 200 um. (C) Representative image of the optic fiber location above the BLA. Scale bar, 500 um. (D) After 5 wk of virus expression, the mice were exposed to the black and white looming stimulus. Twenty-four hours later, the mice were reexposed again to the looming stimulus. (E) Freezing level to the black looming stimulus (n = 9), to the white looming stimulus (n = 9), and after the habituation to the black looming (n = 9, Friedman test p-value<0.0001 with Dunn’s test). (F) Z-score of the Ca2+ response from the MGN axon terminals during the black looming stimulus (n = 9; in black; time-to-peak, mean: 818 ms, SEM: ±114 ms), white looming stimulus (n = 9; in white), and the habituation to the black looming stimulus (n = 9; in gray). (G) The area under the curve (AUC) is significantly reduced when the mice are habituated to the black looming compared to the first exposure to it (n = 9; paired t-test, p-value=0.0001). (H–J) Heatmap of the response to the first expansion of the black looming stimulus (H), white looming stimulus (I), and after the habituation to the black looming stimulus (J) for each mouse. (K) Mice were conditioned and tested as previously described. After the recall session, the same went through an extinction protocol for the following two days. (L) Z-score of the Ca2+ response from the axon terminals of the BLA-projecting MGN neurons during the first CS presentation (n = 7; in black; time-to-peak, mean: 973 ms, SEM: ±160 ms), the last CS presentation of the conditioning (n = 6; in red; time-to-peak, mean: 939 ms, SEM: ±62 ms), the first CS presentation during the recall session (n = 7; in blue; time-to-peak, mean: 948 ms, SEM:±41 ms), and the first CS presentation after the extinction training (n = 7; in purple; time-to-peak, mean: 956 ms, SEM: ±96 ms). (M) The AUC is significantly increased when the mice are exposed to the CS during the recall session (n = 7) compared to the CS-evoked response at the beginning of the conditioning (n = 7) and at the end of the conditioning (n = 7) and after the extinction training (n = 7; mixed-effects analysis, F: 3,17 = 8.791, p-value=0.0010 with Tukey test correction). (N) Z-score of the Ca2+ response from the axon terminals of the BLA-projecting neurons in the MGN during the first (time-to-peak, mean: 776 ms, SEM: ±57 ms) and last footshock presentation (n = 5; time-to-peak, mean: 660 ms, SEM: ±76 ms). Results are reported as mean ± SEM. **p<0.01; ***p<0.001.
Figure 3—figure supplement 1
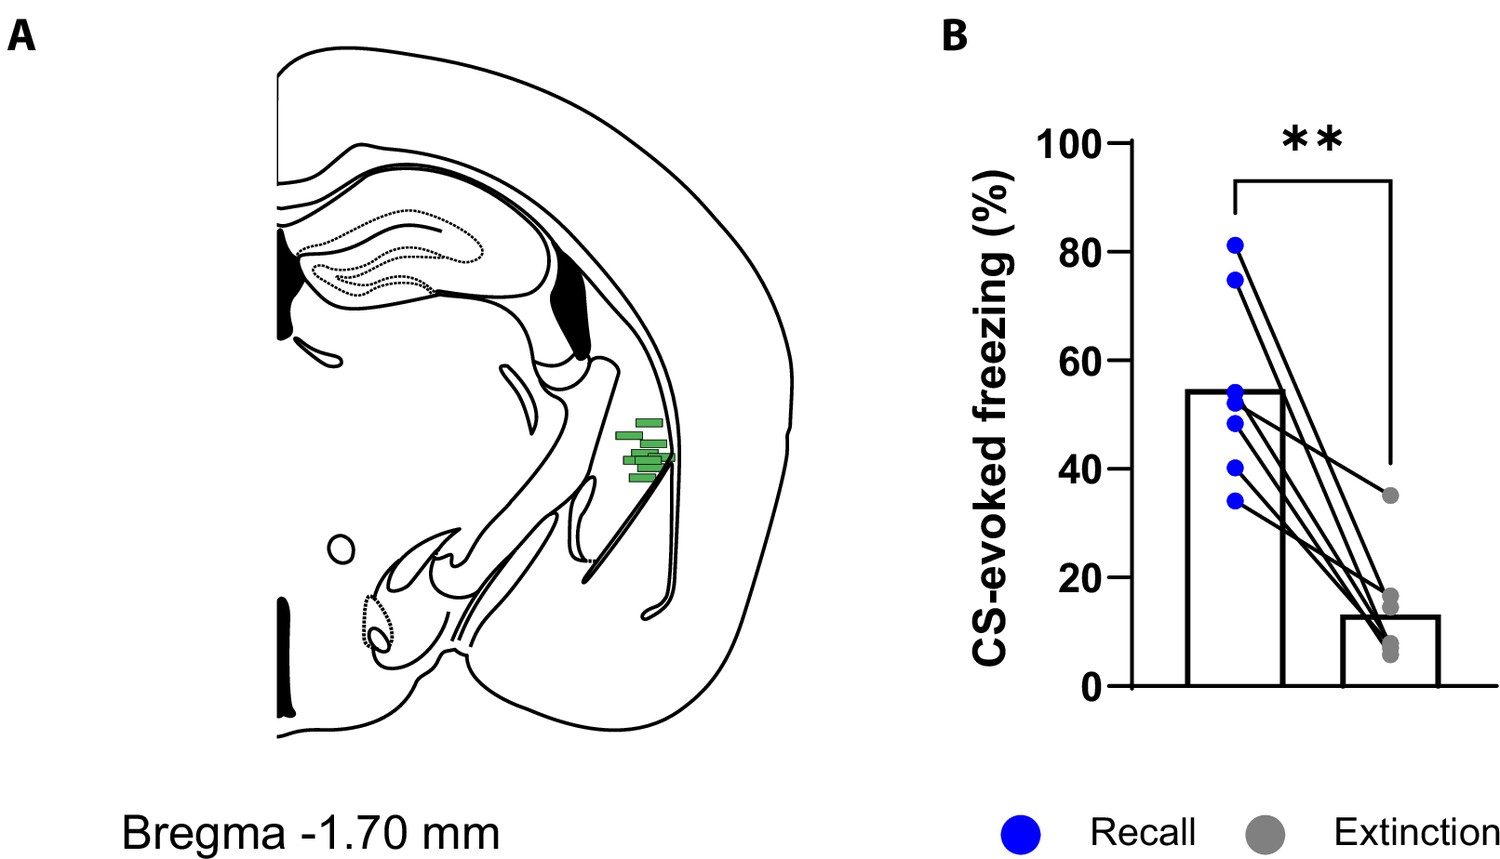
Optic fiber location and efficacy of extinction protocol.
(A) The illustration shows the optic fiber location in the mice from Figure 3 (n = 9). (B) The conditioned stimulus (CS)-evoked freezing is significantly reduced after the extinction protocol (n = 7, paired t-test, p-value=0.0019). Results are reported as mean ± SEM. **p<0.01.
Figure 4 with 2 supplements
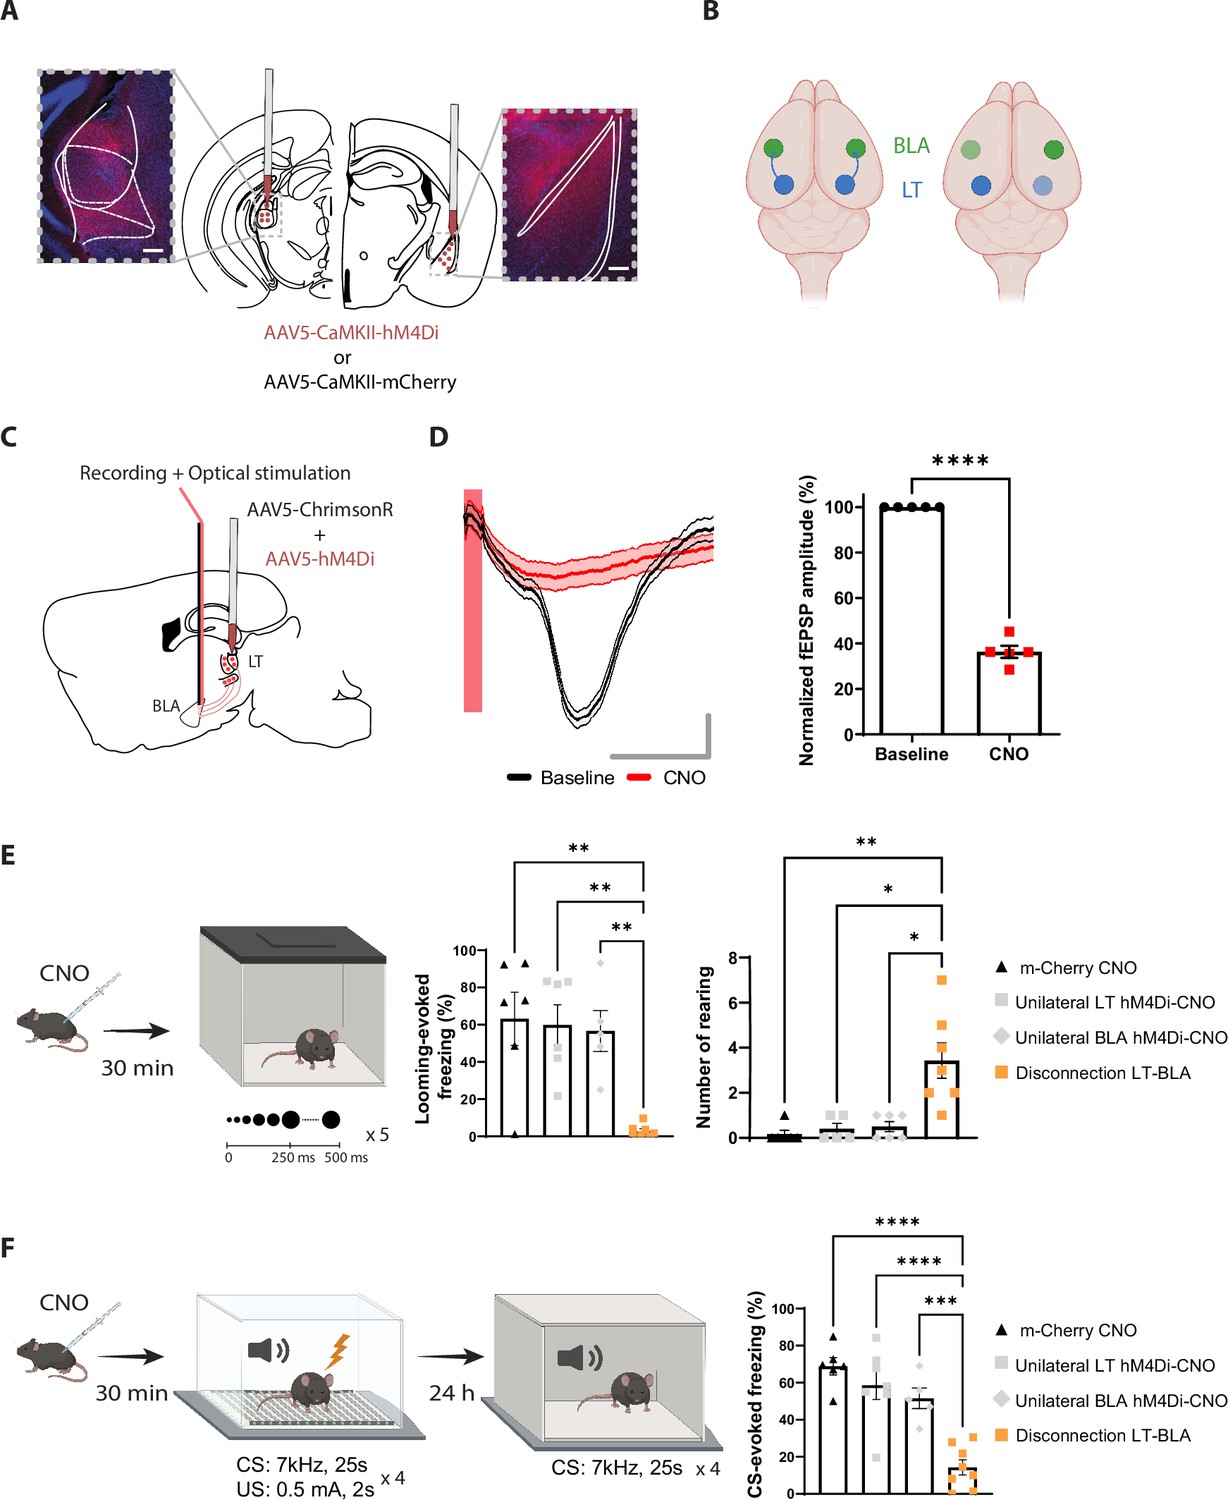
Reversible contralateral disconnection of the lateral thalamus-basolateral amygdala (LT-BLA) pathway impairs the defensive responses to the looming stimulus and the aversive conditioning.
(A) hM4Di injections in the LT and the contralateral BLA. Scale bar, 200 um. (B) Left: the LT and the BLA are connected through a non-reciprocal and ipsilateral connection. Right: contralateral disconnection of the LT-BLA pathway. (C) Diagram showing the experimental design of the in vivo electrophysiology experiment. Mice were co-injected unilaterally with AAV vectors expressing ChrimsonR and hM4Di in the LT. (D) Clozapine-N-oxide (CNO) reduced the field excitatory postsynaptic potential (fEPSP) in mice expressing hM4Di and injected with CNO. Left panel: representative traces from one mouse from the hM4Di-CNO group. The red bar represents the pulse of light (0.5 ms, 638 nm). Shadowed area represents SEM. Scale bar, 5 ms, 0.1 mV. Right panel: the graph shows the normalized fEPSP values before and after CNO injection in mice expressing hM4Di and injected with CNO (n = 5; paired t-test, p-value<0.0001). (E) Mice were injected with CNO 30 min before being exposed to the looming stimulus. The disconnection LT-BLA group (n = 7) showed a significant reduction in the freezing level compared to all the groups. The unilateral inhibition of the LT (n = 6) and the BLA (n = 5) did not impair the looming stimulus-evoked freezing (ordinary one-way ANOVA, F = 3,20, p-value=0.0006). Right: the rearing events are significantly higher in the disconnection LT-BLA group (n = 7) compared to all the other groups during the looming stimulus presentation (Kruskal–Wallis test, F = 2,24, p-value=0.0016). (F) Mice were reinjected with CNO 30 min before aversive conditioning, and they were exposed to the conditioned stimulus (CS) in a new context in a CNO-free trial. The disconnection LT-BLA group (n = 7) showed a significant reduction in the CS-evoked freezing level compared to all control groups during the LTM recall (ordinary one-way ANOVA, F = 3,22, p-value<0.0001). Results are reported as mean ± SEM. *p<0.05; **p<0.01; ***p<0.001; ****p<0.0001.
Figure 4—figure supplement 1
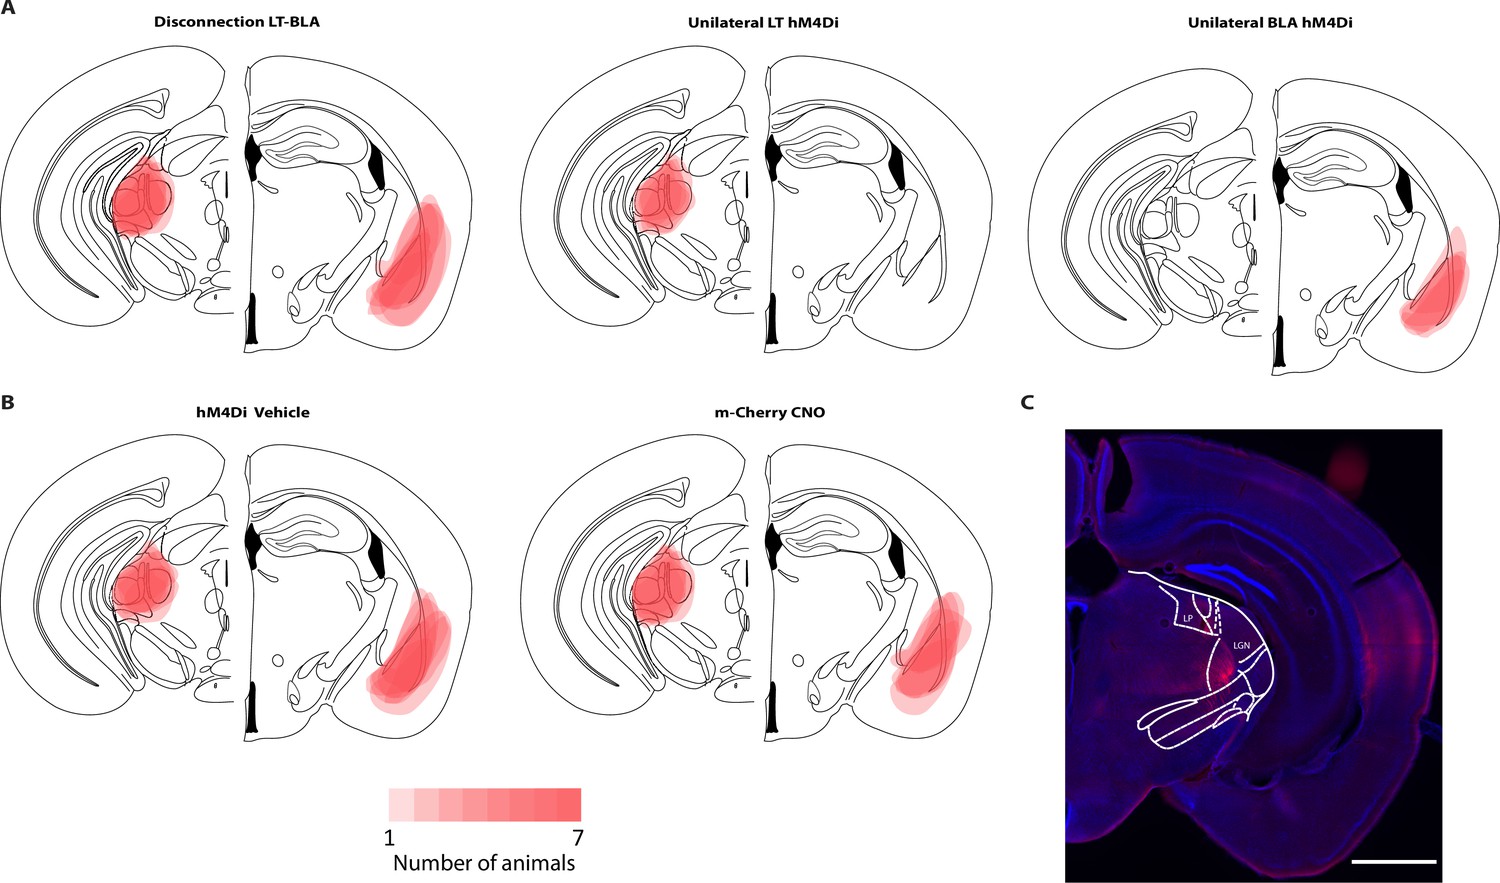
Virus expression and maximal spreading in mice from Figure 4.
(A, B) Overlay of the AVV5-CaMKII-hM4Di-mCherry or AVV5-CaMKII-mCherry in all the mice included in Figure 4 and Figure 4—figure supplement 2A–J. (C) Representative figure from a mouse from the disconnection lateral thalamus-basolateral amygdala (LT-BLA) group, showing the lack of expression of hM4Di-mCherry in the cell bodies of the lateral geniculate nucleus (LGN) and lateral posterior nucleus of the thalamus (LP). Axonal labeling in the temporal associative cortex (TeA) and auditory cortex (AuC), and in zona Incerta is shown in the image. Scale bar, 1 mm.
Figure 4—figure supplement 2
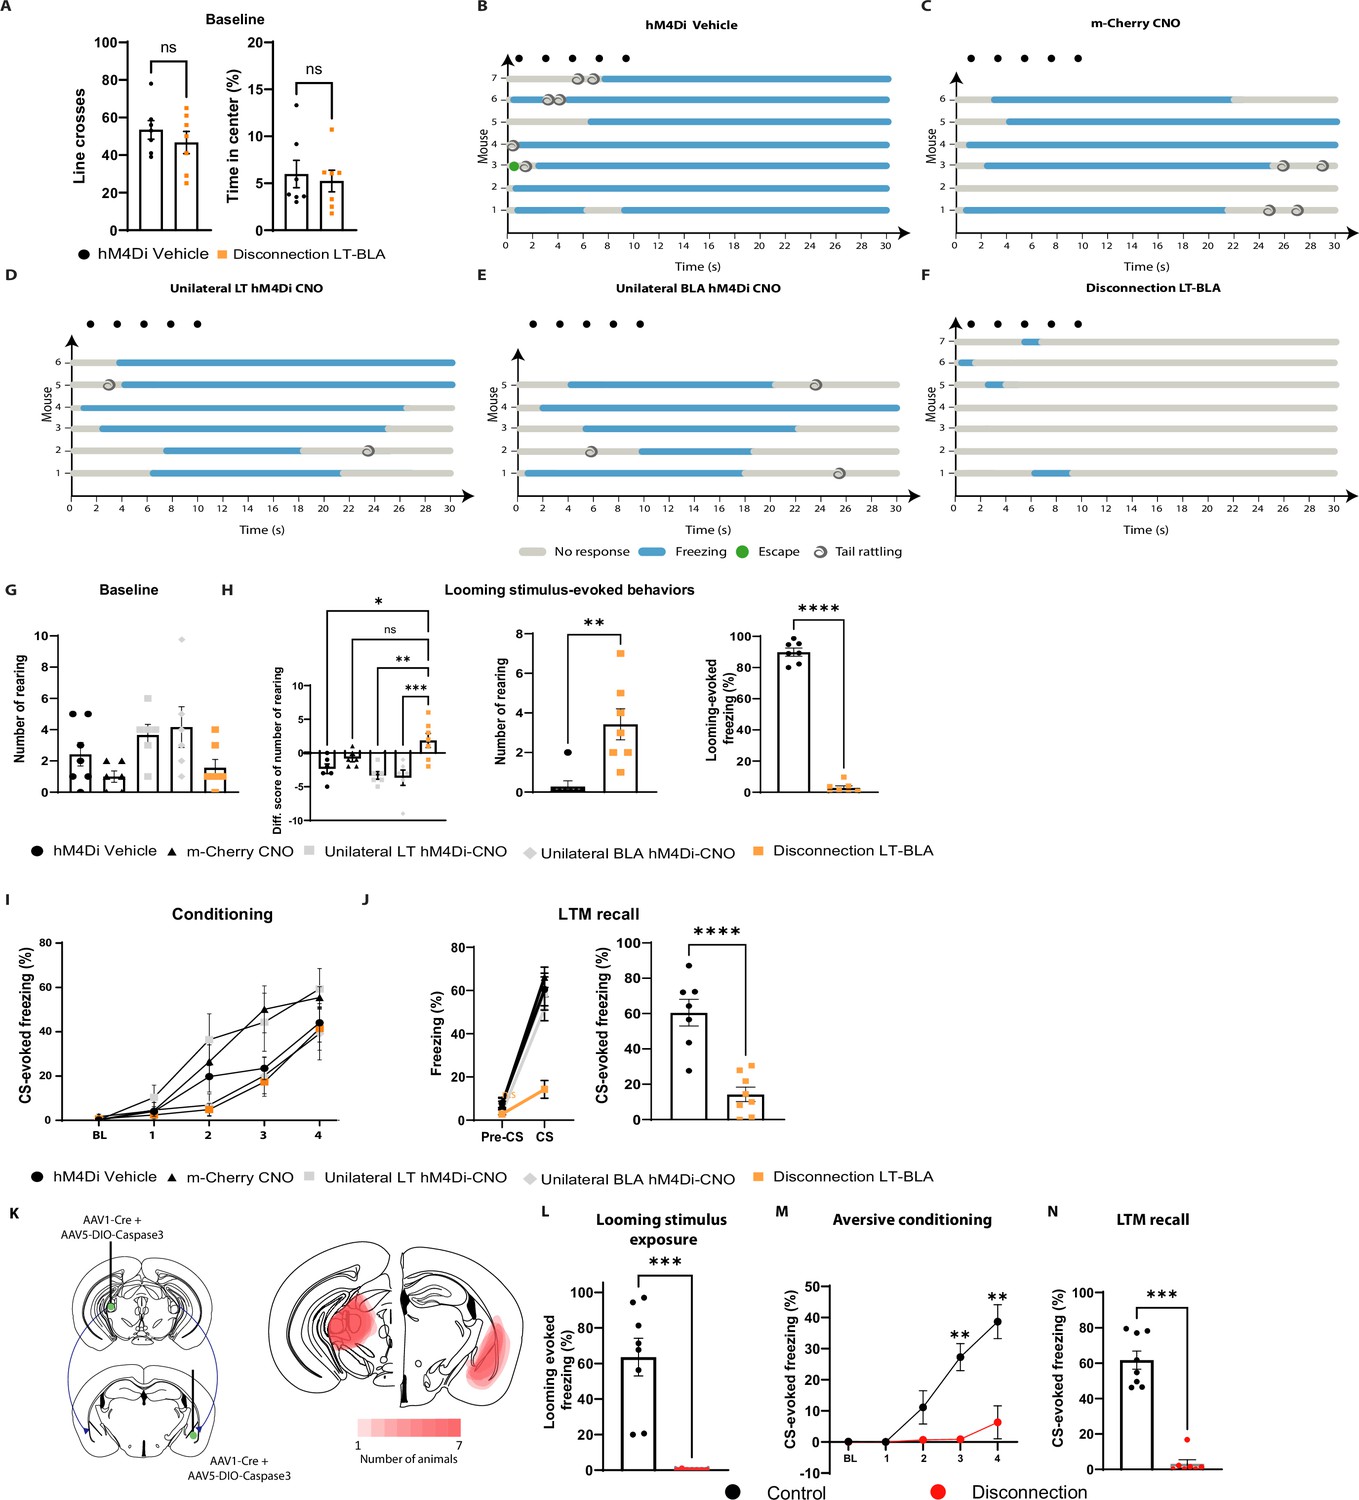
Reversible and irreversible contralateral disconnection of the lateral thalamus-basolateral amygdala (LT-BLA) pathway impairs the defensive responses to the looming stimulus and the aversive conditioning.
(A) Mice were expressing hM4Di were injected with Vehicle (n = 7) or clozapine-N-oxide (CNO) (n = 7) 30 min before being place in the looming arena. Locomotion was indicated by line crosses in the looming arena during the first 8 min of habituation. Anxiety-like behavior was measured as percentage of time spent in the center part of the looming arena. Disconnection of the LT-BLA does not affect the locomotion (unpaired t-test, p-value=0.4000) nor the anxiety levels (unpaired t-test, p-value=0.6957). (B–F) Ethograms show the defensive responses to the looming stimulus for the hM4Di-Vehicle, m-Cherry-CNO, unilateral LT hM4Di-CNO, unilateral BLA hM4Di-CNO, and disconnection LT-BLA, respectively. (G) The number of rearing events is comparable between the five groups during the pre-looming stimulus period (Kruskal–Wallis test, F (5,32), p-value=0.0427). (H) Left: the disconnection LT-BLA group shows an increase in the differential score (diff. score) for rearing events compared to the three of the control groups (ordinary one-way ANOVA, F (4, 26) = 7.400; p-value=0.0004). Middle: the number of rearing events is significantly higher in the disconnection LT-BLA (n = 7) compared to the hM4Di-Vehicle (n = 7) during the looming stimulus exposure (Mann–Whitney test, p-value=0.0023). Right: the looming stimulus-evoked freezing is significantly reduced in the disconnection LT-BLA group (n = 7) to the hM4Di-vehicle group (n = 7; unpaired t-test, p-value<0.0001). (I) The day after the looming stimulus exposure, the mice were reinjected with clozapine-N-oxide (CNO) 30 min before aversive conditioning. Twenty-four hours later, the mice were exposed to the conditioned stimulus (CS) in a new context in a CNO-free trial. The graph shows the CS-evoked freezing during the baseline (BL) and the four pairings of the conditioning session. The contralateral disconnection of the LT-BLA pathway did not significantly affect the CS-evoked freezing during the conditioning session (repeated-measures ANOVA for group by time interactions, F: 16,120 = 1.844, p-value=0.0328 with Tukey test correction). (J) Left: all the groups except the disconnection LT-BLA groups showed significantly higher freezing during the CS presentation compared to the pre-CS period (mixed-effects analysis, Group x Phase interaction: F(4,58) = 9.918; p-value<0.0001; simple effect of phase within the disconnection group: p-value=0.2540; simple effect of phase within each of the remaining groups: p<0.0001). Right: the disconnection LT-BLA group (n = 8) showed a significant reduction in CS-evoked freezing than the hM4Di-Vehicle group (n = 7) during the recall session (unpaired t-test, p-value<0.0001). (K) Viral strategy and overlay of the extent of the lesion in the LT and in the BLA. (L) The looming stimulus-evoked freezing level is significantly reduced in the disconnection group (n = 7) compared to the control group (n = 8; Mann–Whitney test, p-value=0.0003) that was injected contralaterally with DIO-ta-Caspase3 only. (M) The disconnection group (n = 7) shows a significant reduction in CS-evoked freezing compared to the control group across the conditioning protocol (n = 8; repeated-measures ANOVA for group by time interactions, F: 4,52 = 10.10, p-value<0.0001 with Sìdak test correction). (N) The CS-evoked freezing is significantly reduced in the disconnection group (n = 7) compared to the control group (n = 8; Mann–Whitney test, p-value=0.0003). Data of disconnection LT-BLA group is the same as in Figure 4. Results are reported as mean ± SEM. *p<0.05; **p<0.01; ***p<0.001; ****p<0.0001.
Figure 5 with 1 supplement
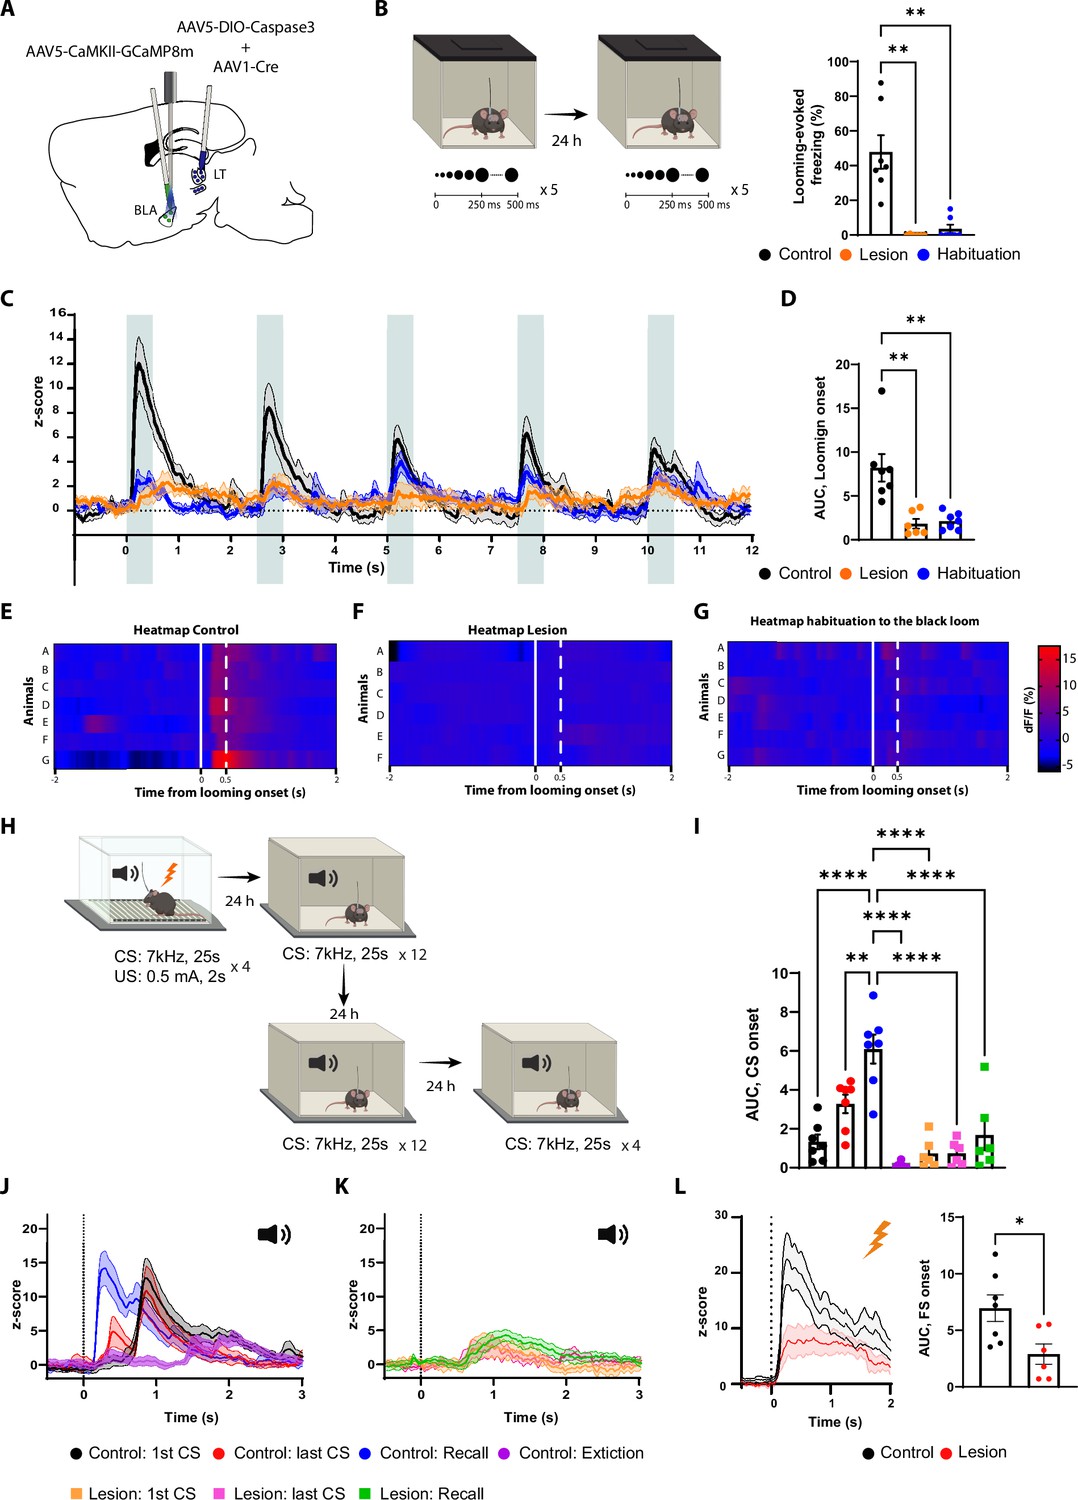
The lateral thalamus (LT) lesion impairs the basolateral amygdala (BLA) response to the looming, the conditioned stimulus (CS), and the unconditioned stimulus (US) stimuli.
(A) Illustration showing the virus injections and the optic fiber implantation. (B) Mice were exposed to the looming stimulus on day 1. On day 2, the control group was habituated to the looming stimulus. The mice from the lesion group (n = 6) have a significant reduction in the freezing level to the looming stimulus compared to the control group (n = 7). Similarly to the control group, once the mice were habituated to the black looming stimulus (n = 7; Kruskal–Wallis test, F = 3,20, p-value<0.0001). (C) Z-score of the calcium response during the black looming stimulus in the control group (n = 7; in black; time-to-peak, mean: 245 ms, SEM: ±14 ms) and in the lesion group (n = 6; in orange) and the control group after the habituation to the black loom (n = 7; in blue). (D) The area under the curve (AUC) is significantly reduced in the lesion (n = 6) and in the habituation to the black loom (n = 7) groups compared to the control group (n = 7; ordinary one-way ANOVA, F(2,17) = 12.73, p-value=0.0004) during the exposure to the black looming stimulus. (E–G) Heatmap representing the individual response to the first expansion to the black looming stimulus for the control group (E) and for the lesion group (F), and for the control group after habituation to the black loom (G) for each mouse. (H) Mice were conditioned and tested as previously described. After the recall session, the same went through an extinction protocol for the following 2 d. (I) The AUC for the first CS presentation during the recall in the control group is significantly increased compared to all conditions of the lesion group (two-way ANOVA, F: 6,33 = 16.29, p-value<0.0001 with Tukey test correction). (J) Z-score of the calcium responses during the first (n = 7; time-to-peak, mean: 978 ms, SEM: ±153m s) and last CS (n = 7; the first time-to-peak, mean: 750 ms, SEM: ±72 ms) presentation during the conditioning (in black and in red), and during the first CS presentation during the recall (n = 7; in blue; time-to-peak, mean: 448 ms, SEM: ±85 ms) and after extinction training (n = 7; in purple; time-to-peak, mean: 1600 ms, SEM: ±240 ms) in the control group. (K) Z-score of the calcium responses during the first (n = 6) and last CS (n = 6) presentation during the conditioning (in orange and magenta), and during the first CS presentation during the recall (n = 6; in green) in the lesion group. (L) Left: Z-score of the Ca2+ response during the footshock presentation for the control group (n = 7, in black; time-to-peak, mean: 387 ms, SEM: ±93 ms) and the lesion group (n = 6, in red). Right: the AUC is significantly reduced in the mice from the lesion group (n = 6) compared to the mice from the control group (n = 7; unpaired t-test, p-value=0.0219). Results are reported as mean ± SEM. *p<0.05; **p<0.01; ****p<0.0001.
Figure 5—figure supplement 1
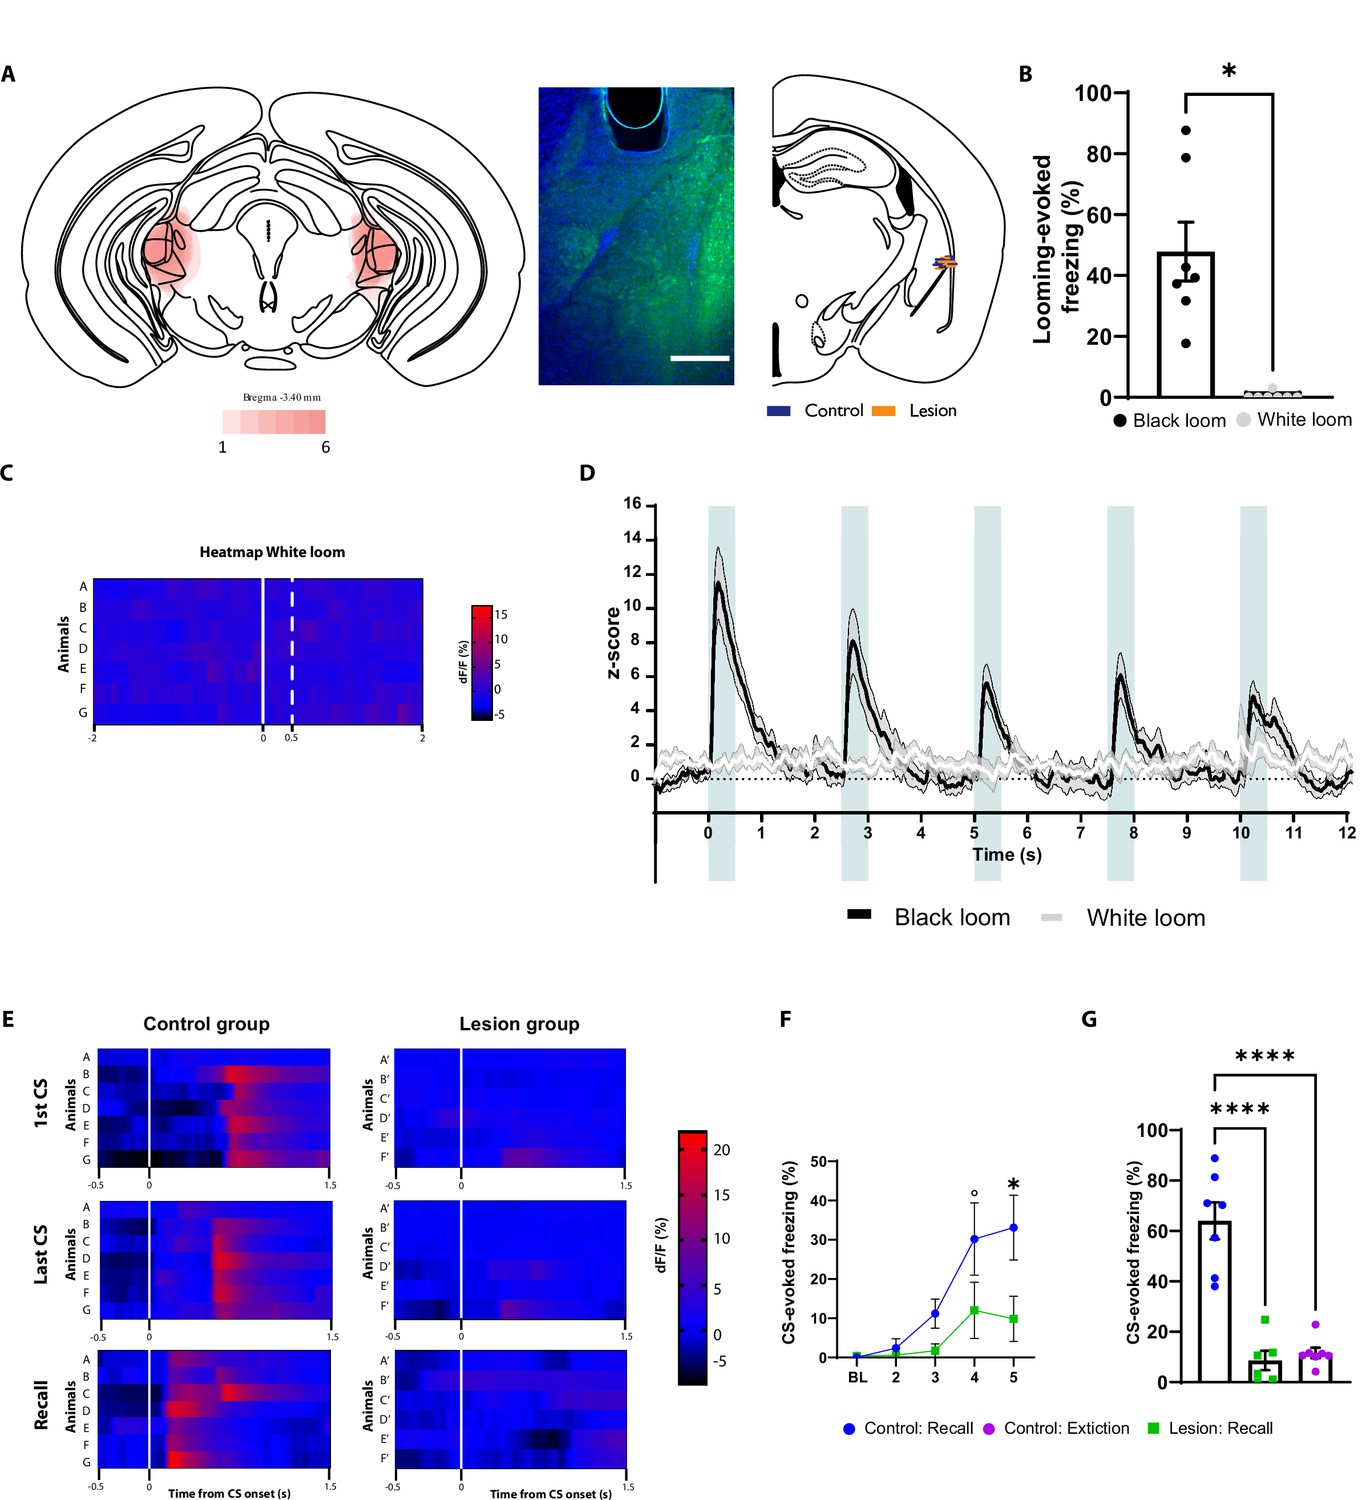
The basolateral amygdala (BLA) is not activated by the white looming stimulus and the lateral thalamus (LT) lesion impairs the conditioned stimulus (CS)-evoked BLA response.
(A) Left: overlay of the maximal extent of the lesion in the mice from the lesion group (n = 6). Middle: representative image showing GCaMP8m expression and optic fiber location. Right: each blue and orange lines represent the optic fiber placement of an individual mouse from the control and lesion groups, respectively. Scale bar, 500 um. (B) Freezing level evoked by the black looming stimulus (n = 7) is significantly higher than the one evoked by the white loom (n = 7, Wilcoxon test, p-value=0.0156). (C) Heatmap representing the individual Ca2+ responses evoked by the white looming. (D) Z-score of the Ca2+ response during the black looming stimulus (n = 7; in black), and the white looming stimulus (n = 7; in white). (E) Heatmap representing the individual Ca2+ response to the first CS (top), last CS of the aversive conditioning (middle), and the recall (bottom) for the control group (left column) and the lesion group (right column). (F) The lesion group (n = 6) shows a significant reduction in the CS-evoked freezing during the last pairing compared to the control group (n = 7; repeated-measures ANOVA for group by time interactions, F: 4,44 = 2.817, p-value=0.0364 with Sìdak test correction). (G) LT lesion reduces the CS-evoked freezing during the recall session, similar to the CS-evoked freezing after extinction training (n = 7) in the control group (ordinary one-way ANOVA, F(2,17) = 39.15, p-value<0.0001). * Data from black loom group is a replica of Figure 5. Results are reported as mean ± SEM. °p<0.10; *p<0.05; ****p<0.0001.
Figure 6 with 2 supplements
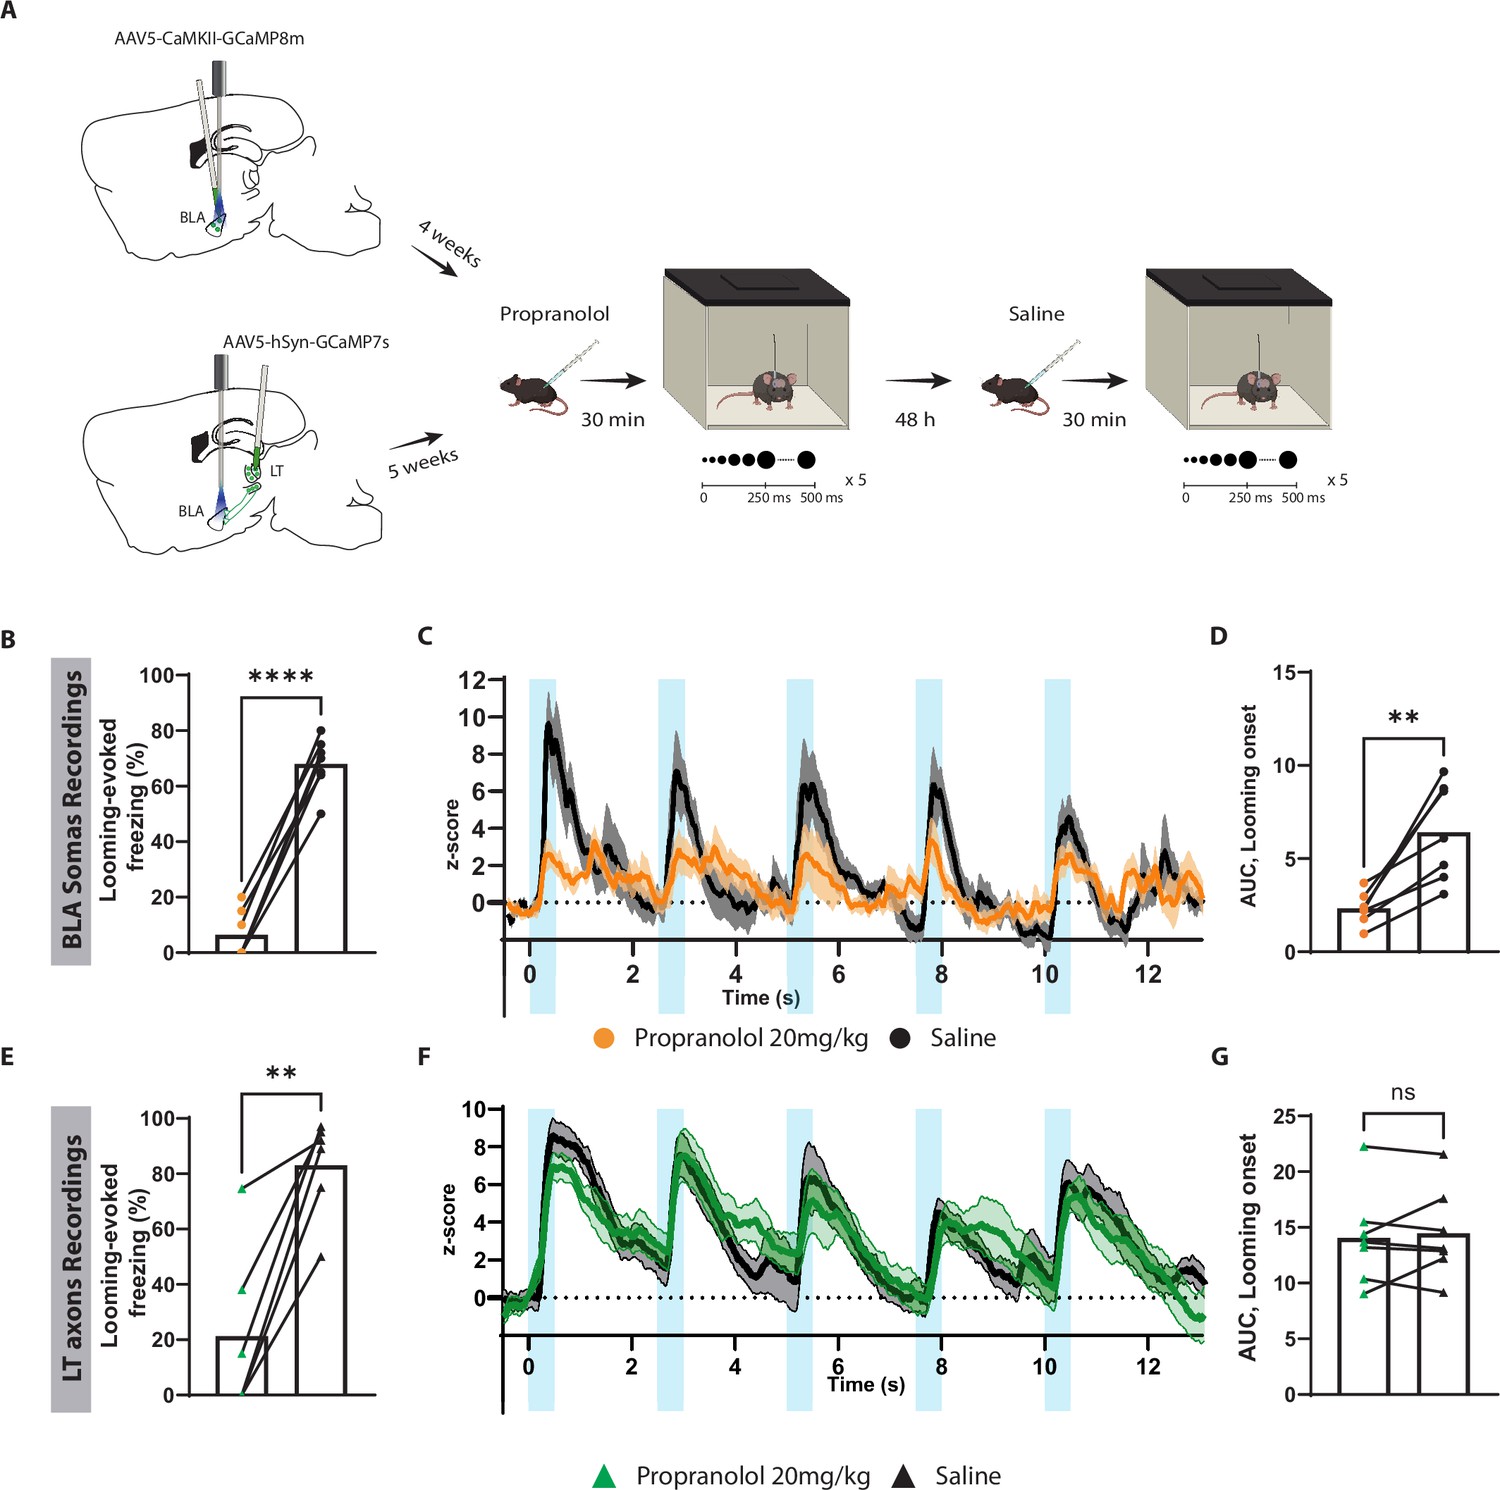
Blocking β-adrenergic receptors reduces the defensive response and the basolateral amygdala (BLA) activation to the innately aversive threat.
(A) Timeline showing the different stages of the experiment. (B) The looming stimulus-evoked freezing is significantly reduced in the propranolol trial compared to the re-exposure trial in which the same mice were injected with saline (n = 7; paired t-test, p-value<0.0001). (C) The graph shows the average of the Z-score of the Ca2+ responses of the looming stimulus presentation in the BLA after propranolol injection (n = 7, in orange) and saline injection (n = 7; in black). (D) The area under the curve (AUC) is significantly reduced in the propranolol trial (n = 7) compared to the saline trial (n = 7; paired t-test, p-value=0.0034). (E) The looming stimulus-evoked freezing is significantly reduced in the propranolol trial compared to the re-exposure trial in which the same mice were injected with saline (n = 7; paired t-test, p-value=0.0022). (F) The graph shows the average of the Z-score of the Ca2+ responses of the looming stimulus presentation of the lateral thalamus (LT) axon terminals after propranolol injection (n = 7, in green) and saline injection (n = 7; in black). (G) The AUC is unchanged in the propranolol trial (n = 7) compared to the saline trial (n = 7; paired t-test, p-value=0.6016). Results are reported as mean ± SEM. ns, nonsignificant; **p<0.01; ****p<0.0001.
Figure 6—figure supplement 1
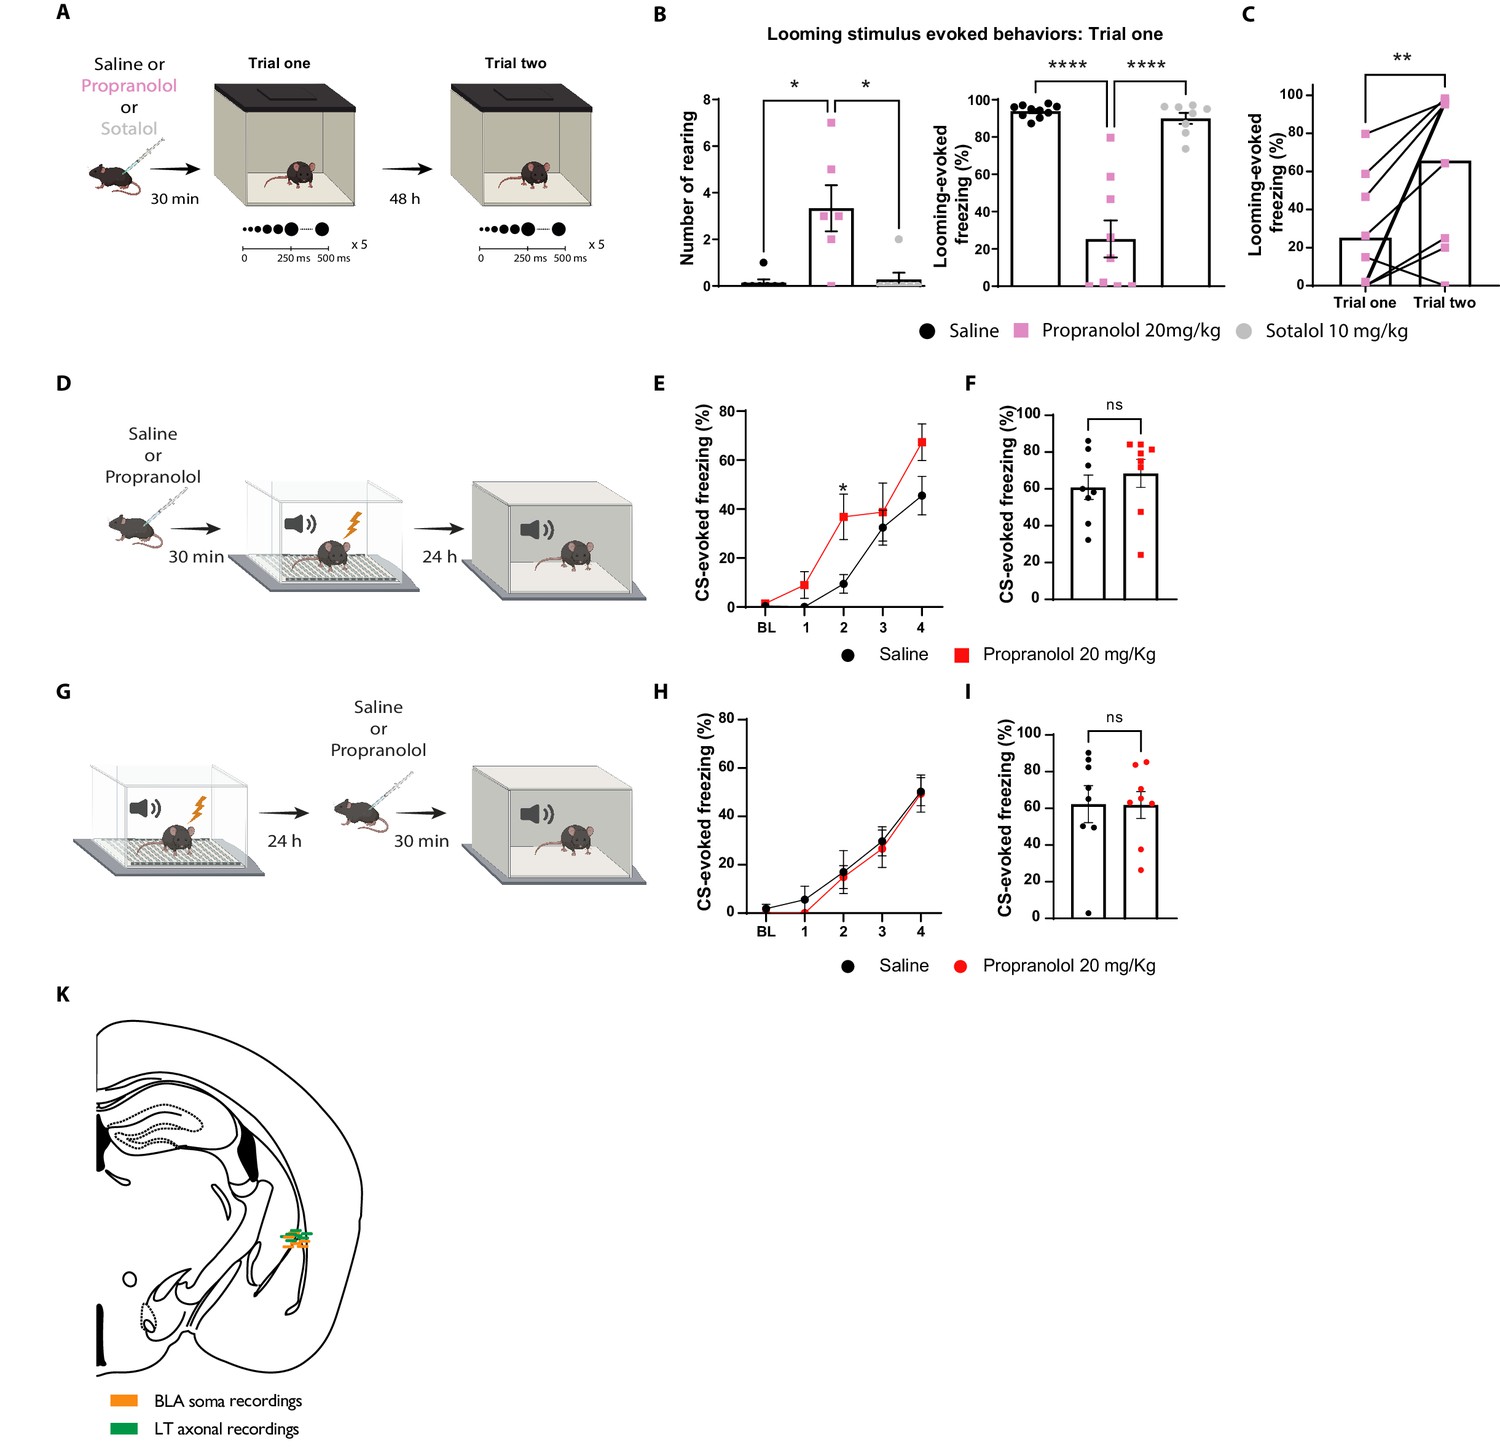
Propranolol reduces defensive response to a looming stimulus but it does not impair aversive conditioning.
(A) Diagram showing the timeline of the experiment. (B) Left: the number of rearing events during the looming stimulus is significantly higher in the propranolol group (n = 6) compared to sotalol (n = 7) and saline (n = 7) groups (Kruskal–Wallis test, p-value=0.0026). Right: the propranolol group (n = 9) shows a significant reduction in the freezing level during the looming stimulus compared to the saline group (n = 10) and the sotalol group (n = 8; ordinary one-way ANOVA, F(2,24) = 41.89, p-value<0.0001). (C) The propranolol group shows a significant increase in the freezing level evoked by the looming stimulus during the re-exposure trial (paired t-test, p-value=0.0053). (D) Timeline showing the different stages of the experiment. (E) Freezing level during the baseline (BL) period and the consecutive four pairs is similar between the saline (n = 8) and the propranolol (n = 8) groups. The only significant difference is in the conditioned stimulus (CS)-evoked freezing level during the second pairing of the conditioning (two-way ANOVA, F(4, 56) = 2.084, p-value=0.0950). (F) There is no significant difference in the CS-evoked freezing level between the saline (n = 8) and the propranolol groups (n = 8; Mann–Whitney test, p-values=0.4866). (G) A separate cohort of mice was conditioned and injected with saline or propranolol 30 min before long-term memory recall in a new context. (H) Freezing level during the BL period and the consecutive four pairs is comparable between the saline (n = 8) and the propranolol (n = 8) groups (two-way ANOVA, F(4, 70) = 0.04946, p-value=0.9953). (I) There is no significant difference in the CS-evoked freezing level between the saline (n = 8) and the propranolol groups (n = 8) during the recall session (unpaired t-test, p-values=0.9732). (J) Timeline showing the different stages of the experiments. (K) Optic fiber location for mice from Figure 6. Results are reported as mean ± SEM. ns, nonsignificant; *p<0.05; ****p<0.0001.
Figure 6—figure supplement 2
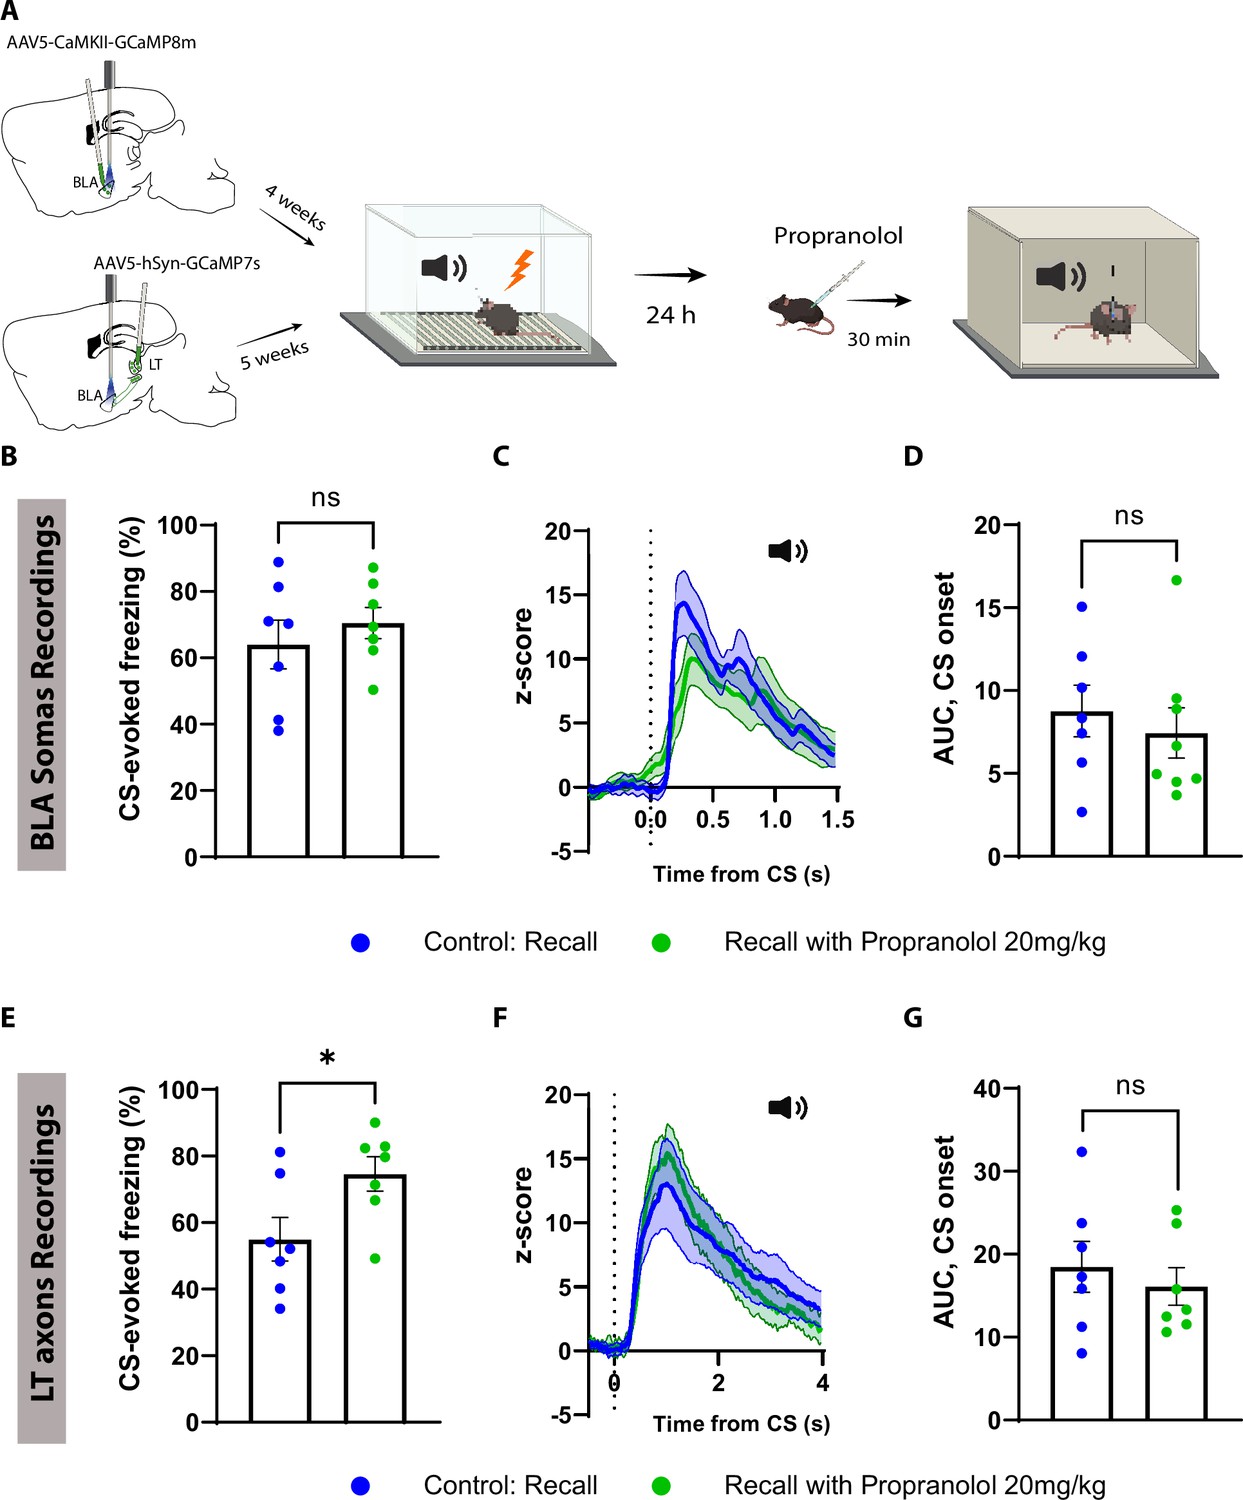
Propranolol does not affect the conditioned stimulus (CS)-evoked activity in the basolateral amygdala (BLA) or in the lateral thalamus (LT) projections to the BLA.
(A) Timeline showing the different stages of the experiment. (B) The CS-evoked freezing is comparable between a group of mice injected with propranolol (n = 7) compared to the control group (n = 7; unpaired t-test, p-value=0.4732). The control group is a replica of Figure 5—figure supplement 1G. (C) Z-score of the Ca2+ responses in the BLA to the first CS presentation during the recall for the control group (n = 7) and in the group injected with propranolol before the recall session (n = 7). The control group is a replica of Figure 5. (D) The area under the curve (AUC) is comparable between the controls (n = 7) and the group injected with propranolol (n = 7; unpaired t-test, p-value=0.5535). (E) CS-evoked freezing is significantly higher in the group injected with (n = 7) compared to the control group (n = 7; unpaired t-test, p-value=0.0359). The control group is a replica of Figure 3—figure supplement 1B. (F) Z-score of the Ca2+ responses in the LT axons to the first CS presentation during the recall for the control group (n = 7) and the group injected with propranolol before the recall session (n = 7). The control group is a replica of Figure 3. (G) The AUC is comparable between the controls (n = 7) and the group injected with propranolol (n = 7; unpaired t-test, p-value=0.5456). Results are reported as mean ± SEM. ns, nonsignificant; *p<0.05.
Author response image 1
Tables
Key resources table
| Reagent type (species) or resource | Designation | Source or reference | Identifiers | Additional information |
|---|---|---|---|---|
| Antibody | Anti-NeuN antibody (mouse) | Merck Millipore | MAB377 | 1:500 |
| Antibody | Anti-GFP antibody (rabbit) | Invitrogen | CAB4211 | 1:1000 |
| Antibody | Cy3 goat antimouse | Thermo Fisher Scientific | A10521 | 1:500 |
| Antibody | Alexa Fluor 488 (goat anti-rabbit) | Thermo Fisher Scientific | A-11008 | 1:1000 |
| Recombinant DNA reagent | AAV-5/2-hEF1αdlox- (pro)taCasp3_2A _TEVp(rev)-dlox | VVF | V185-5 | |
| Recombinant DNA reagent | AAV-1/2-hCMVchI-Cre | VVF | V36-1 | |
| Recombinant DNA reagent | AAV-5/2- mCaMKIIαhM4D(Gi)_mChe rry | VVF | V102-5 | |
| Recombinant DNA reagent | AAV-5/2- mCaMKIIαmCherry | VVF | V199-5 | |
| Recombinant DNA reagent | AAV-5/2-hSyn1- dlox-EGFP(rev)- dlox | VVF | V115-5 | |
| Recombinant DNA reagent | AAV-retro/2- hCMV-chI-Cre | VVF | V36-retro | |
| Recombinant DNA reagent | AAV-5/2-hSyn1- chI-jGCaMP7s | VVF | V406-5 | |
| Recombinant DNA reagent | AAV-5/2- mCaMKIIαjGCaMP8m | VVF | V630-5 | |
| Recombinant DNA reagent | AAV-5/2-hSyn1- chIChrimsonR_tdTo mato | VVF | V334-5 | |
| Chemical compound, drug | Propranolol hydrochloride | Merck | P0884 | |
| Chemical compound, drug | Sotalol hydrochloride | Merck | S0278 | |
| Chemical compound, drug | Clozapine noxide dihydrochloride (CNO watersoluble) | HelloBio | HB6149 | |
| Chemical compound, drug | Fentanyl | Hameln | 007007 | |
| Chemical compound, drug | Midazolam | Hameln | 002124 | |
| Chemical compound, drug | Medetomidine | VM Pharma | 087896 | |
| Chemical compound, drug | IsoFlo vet 100% | Zoetis | 37071/4000 | |
| Software | GraphPad Prism | GraphPad Software | Version 9 | |
| Software | ImageJ | National Institutes of Health | 1.53t | |
| Software | Doric Studio | Doric Lenses | 5.4.1.23 | |
| Software | MATLAB | MathWorks, Inc | R2021b | |
| Software, algorithm | PhotometrySignal-Analysis | This paper | https://github.com/NabaviLab-Git/Photometry-Signal-Analysis; Nabavi Lab, 2022 | |
| Other | DAPI | Sigma | D9542 | 1:1000 |
Additional files
Download links
A two-part list of links to download the article, or parts of the article, in various formats.
Downloads (link to download the article as PDF)
Open citations (links to open the citations from this article in various online reference manager services)
Cite this article (links to download the citations from this article in formats compatible with various reference manager tools)
Subcortico-amygdala pathway processes innate and learned threats
eLife 12:e85459.
https://doi.org/10.7554/eLife.85459


