Decapping factor Dcp2 controls mRNA abundance and translation to adjust metabolism and filamentation to nutrient availability
- Division of Molecular and Cellular Biology, Eunice Kennedy Shriver National Institute of Child Health and Human Development, United States
- Department of Biology, Saint Louis University, United States
- Department of Biological Sciences, State University of New York, United States
- Department of Biological Sciences, Wayne State University, United States
Figures
Figure 1 with 2 supplements
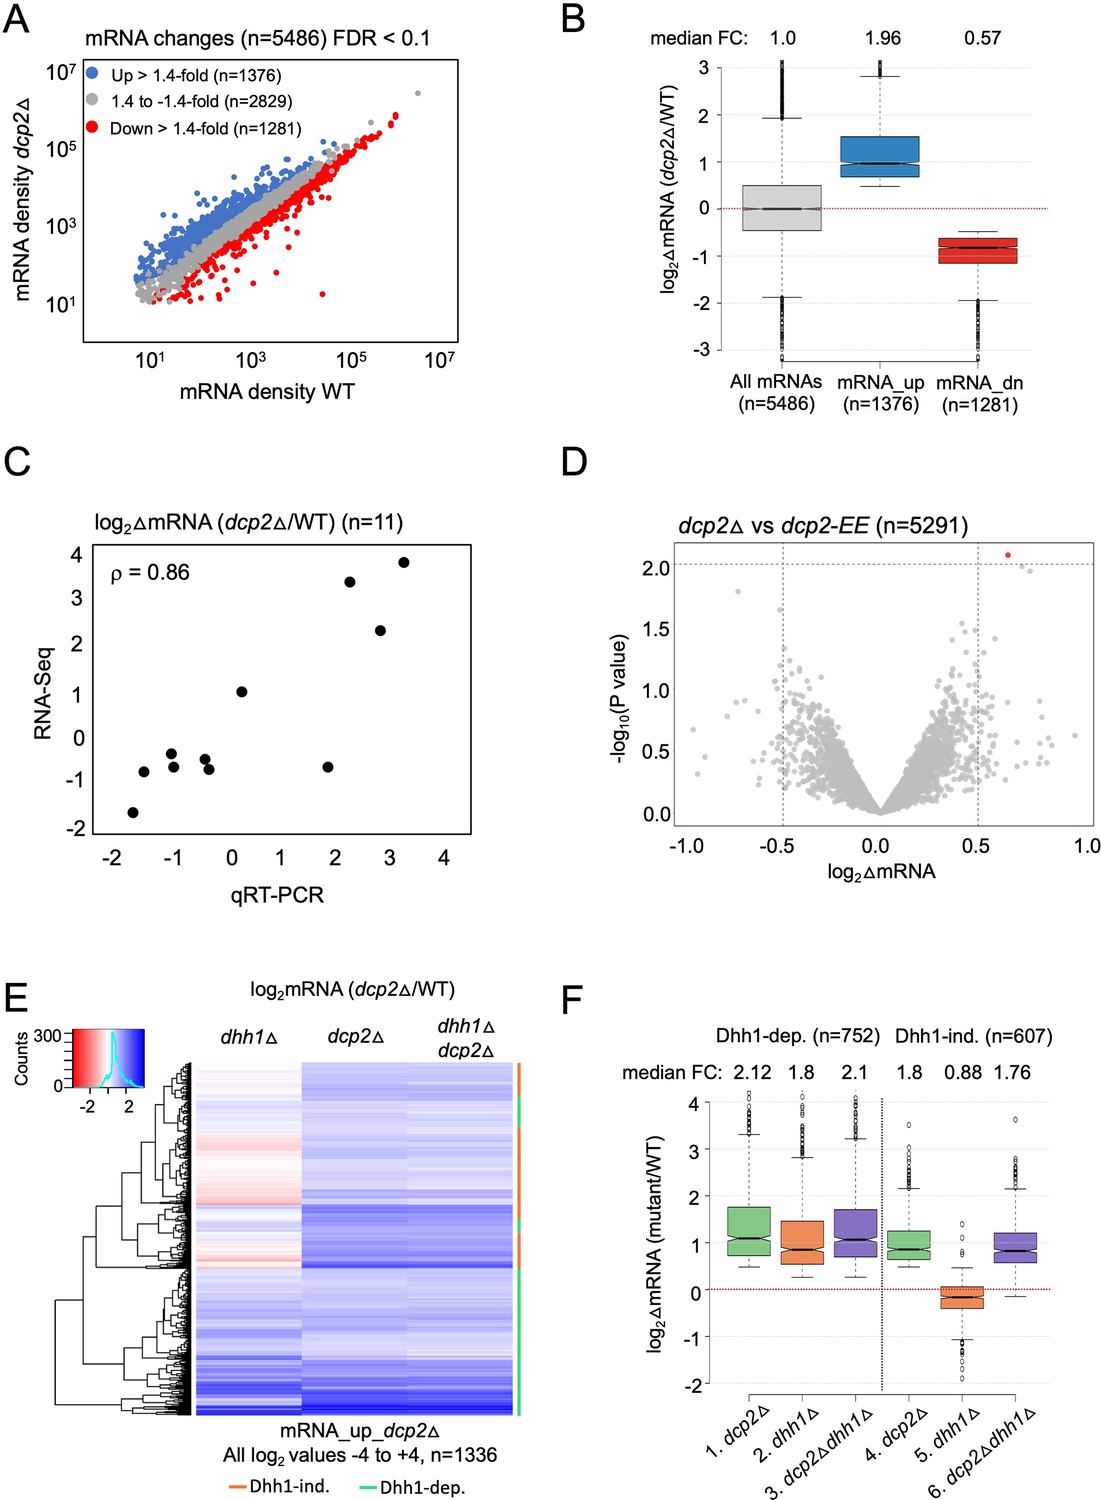
Dhh1-dependent and -independent regulation of mRNA abundance by decapping factor Dcp2.
(A) Scatterplot of normalized mRNA densities in RPKM (Reads Per Kilobase of transcript, per Million mapped reads) for 5486 genes in dcp2Δ vs. WT cells determined by RNA-Seq. Genes showing significant changes in mRNA abundance of >1.4-fold in dcp2Δ vs. WT cells at false discovery rate (FDR) <0.1 as determined by DESeq2 analysis are shown as blue or red dots. (B) Notched box-plot of the log2 fold-changes in mRNA abundance (from RNA-Seq) in dcp2Δ vs. WT cells for all mRNAs (n = 5486, median FC = 1) or subsets of transcripts either increased (n = 1376, median FC = 1.96) or decreased (n = 1281, median FC = 0.57). Median values for each group are indicated at the top, and the numbers of mRNAs for which data were obtained for each group is indicated at the bottom. A few outliers (n = 34 for mRNA_up and n = 44 for mRNA_dn groups) were omitted to expand the y-axis scale. (C) Scatterplot showing correlation between the log2 fold-changes in mRNA abundance determined by RNA-Seq vs. qRT-PCR for 11 different genes in dcp2Δ vs. WT cells, with the Spearman correlation coefficient (ρ) indicated. (D) Evidence that mRNA changes conferred by dcp2Δ result from loss of Dcp2 catalytic activity. A Volcano plot showing log2 fold-changes in mRNA abundance (from RNA-Seq) in dcp2Δ vs. dcp2-E149Q,E153Q (dcp2-EE) (x-axis) vs. −log10 p values for the mRNA changes (y-axis) cells for all mRNAs (n = 5291). (E) Hierarchical clustering analysis of the log2 fold-changes in mRNA abundance conferred by dhh1Δ, dcp2Δ, or dhh1Δdcp2Δ vs. WT for 1336 of the mRNA_up_dcp2∆ transcripts that are increased in abundance in dcp2∆ vs. WT cells. Transcripts annotated on the right with green or red bars require Dhh1 or are independent of Dhh1, respectively, for their repression by Dcp2 in WT cells. The color scale indicating log2∆mRNA values ranges from 4 (strong derepression, dark blue) to −4 (strong repression, dark red). A few outlier mRNAs (n = 40) with log2∆mRNA values of >4.0 or <−4.0 were excluded to enhance the color differences among the remaining mRNAs. (F) Notched box-plot of log2∆mRNA values in the mutants indicated at the bottom vs. WT for the two sets of mRNAs decreased in abundance by Dcp2 in a manner dependent (cols. 1–3) or independent of Dhh1 (cols. 4–6). Note that 17 of the 1376 mRNA_up_dcp2Δ transcripts were not detected in the dhh1Δ vs. WT experiment and, hence, were excluded from consideration. A few outliers (n = 8 from columns 1 and 3, and n = 14 from column 2) were omitted from the plots to expand the y-axis scale. Horizontal red dotted lines indicate log2∆mRNA values of zero, for a median fold-change of 1.
-
Figure 1—source data 1
log2 fold-changes in mRNA abundance observed by RNA-Seq analysis in dcp2Δ vs. WT cells for all transcripts, mRNA_up_dcp2Δ, and mRNA_dn_dcp2Δ groups (Figure 1A, B).
- https://cdn.elifesciences.org/articles/85545/elife-85545-fig1-data1-v2.zip
-
Figure 1—source data 2
Comparison of qRT-PCR and RNA-Seq analyses of mRNA changes for 11 selected genes observed in dcp2Δ vs. WT cells (Figure 1C).
- https://cdn.elifesciences.org/articles/85545/elife-85545-fig1-data2-v2.zip
-
Figure 1—source data 3
log2 fold-changes in mRNA abundance observed by RNA-Seq analysis in dcp2Δ vs. dcp2Δ-EE cells for all transcripts (Figure 1D).
- https://cdn.elifesciences.org/articles/85545/elife-85545-fig1-data3-v2.zip
-
Figure 1—source data 4
log2 fold-changes in mRNA abundance observed by RNA-Seq analysis in dcp2Δ, dhh1Δ, and dcp2Δdhh1Δ mutants vs. WT for all transcripts, Dhh1-dependent mRNA_up_dcp2Δ and Dhh1-independent mRNA_up_dcp2Δ groups of transcripts (Figure 1E, F).
- https://cdn.elifesciences.org/articles/85545/elife-85545-fig1-data4-v2.zip
Figure 1—figure supplement 1
Supporting information that Dcp2 regulates mRNA abundance in a manner dependent or independent of Dhh1.
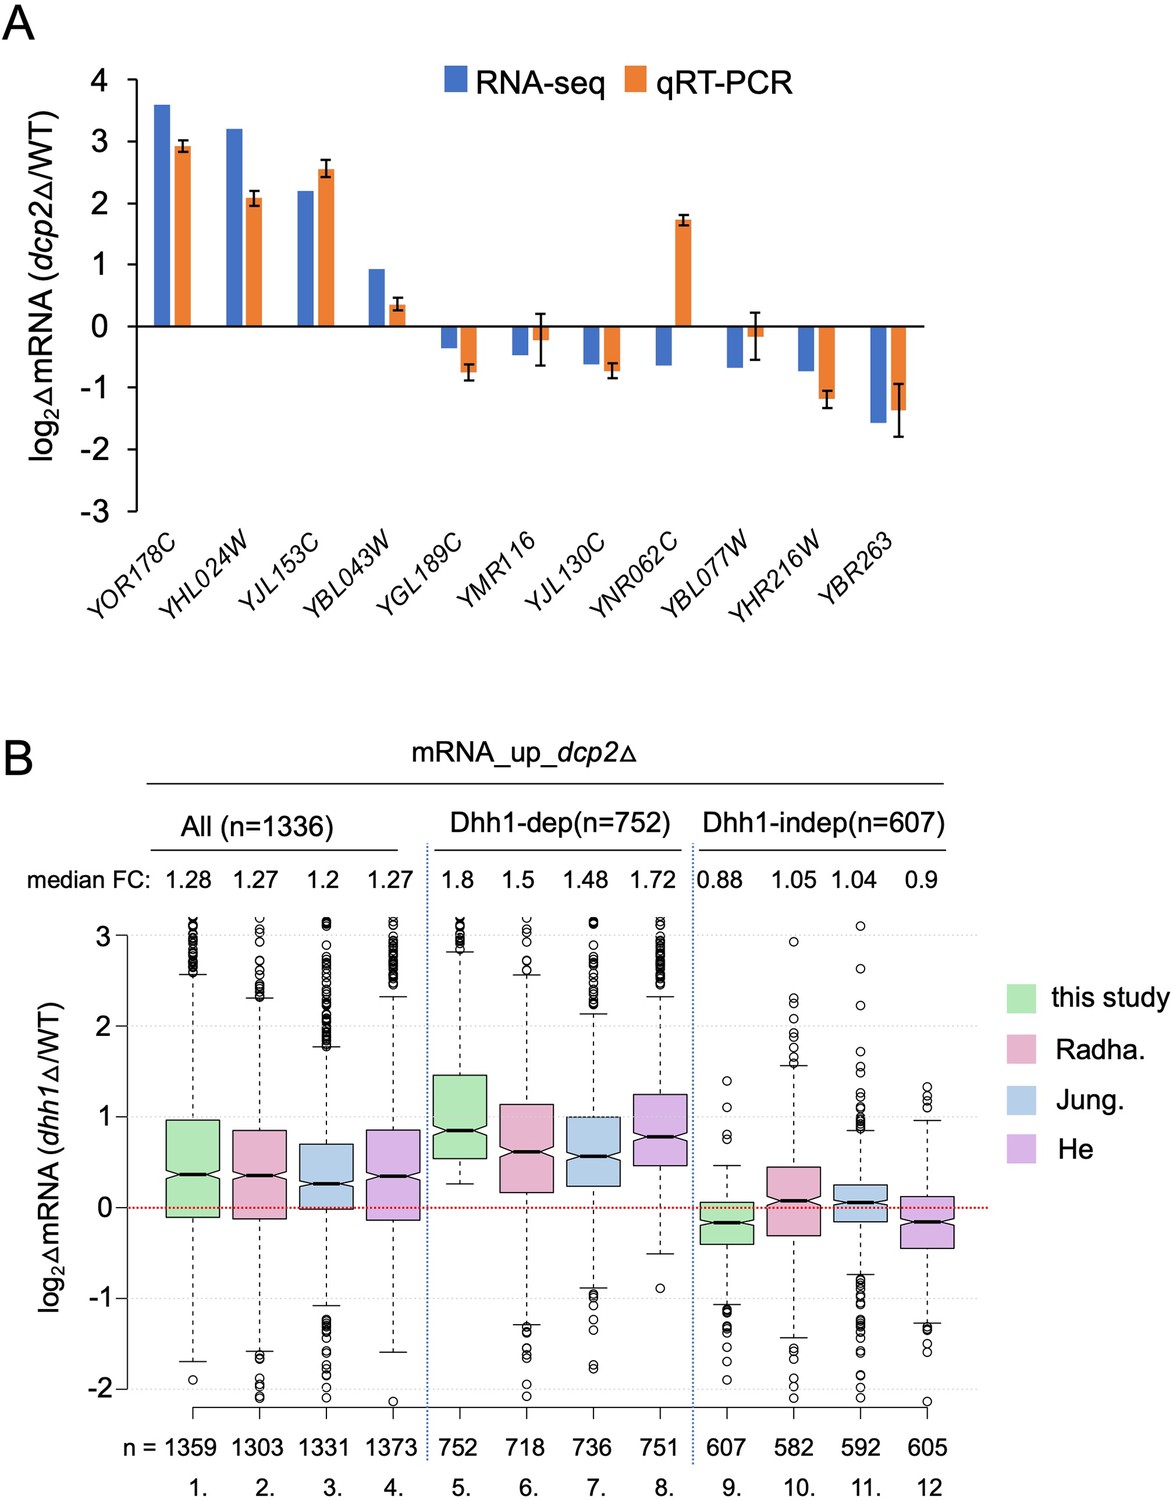
(A) log2 fold-changes in mRNA abundance conferred by dcp2∆ vs. WT for 11 different genes determined by RNA-Seq (blue) or qRT-PCR (orange). Expression of each transcript measured by qRT-PCR was normalized to a luciferase RNA spike-in added to the total RNA. The results represent average values with standard deviations (SD) derived from at least three independent RNA preparations. (B) Notched box-plot as in Figure 1B showing log2 fold-changes in mRNA abundance in dhh1∆ vs. WT for all mRNA_up_dcp2∆ transcripts or for the Dhh1-dependent or -independent subsets of these mRNAs calculated from data obtained here (this study), in Jungfleisch et al., 2017 (Jung.), Radhakrishnan et al., 2016 (Radha.), or He et al., 2018 (He). The numbers of mRNAs for which data were obtained in each study are indicated at the bottom.
-
Figure 1—figure supplement 1—source data 1
log2 fold-changes in mRNA observed by RNA-Seq analysis in dhh1Δ vs. WT cells for all transcripts from three published datasets (Figure 1—figure supplement 1B).
- https://cdn.elifesciences.org/articles/85545/elife-85545-fig1-figsupp1-data1-v2.zip
Figure 1—figure supplement 2
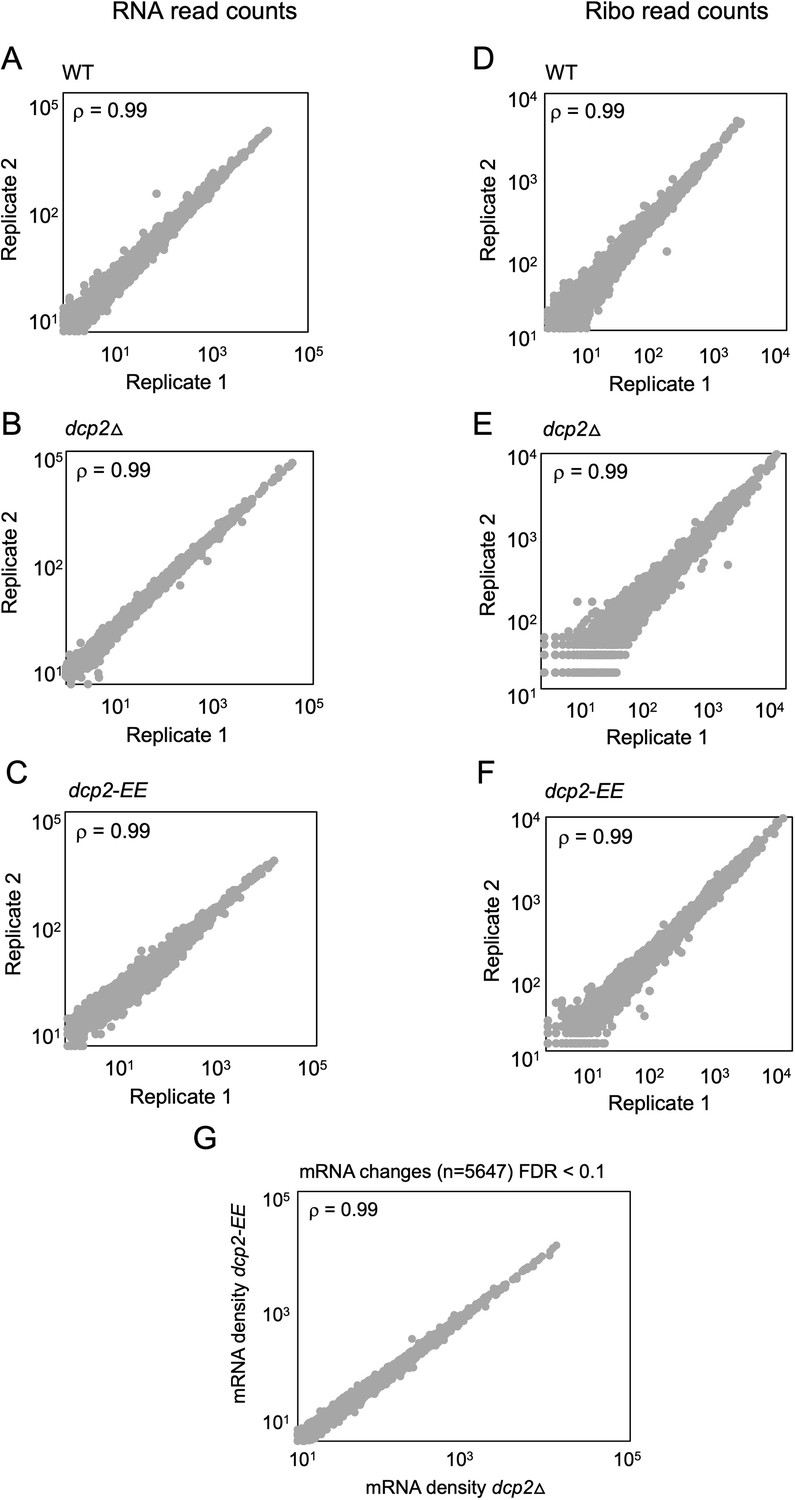
Reproducibility between biological replicates of ribosome footprint profiling and RNA-Seq analyses for WT, dcp2∆, and dcp2-EE strains.
Scatterplots of RPKM-normalized RNA-Seq (A–C) and Ribo-Seq (D–F) read densities for all expressed mRNAs for biological replicates of the WT (A, D), dcp2∆ (B, E), and dcp2-EE (C, F) strains. Spearman’s correlation coefficients (ρ) for the plotted genes are indicated in each plot. (G) No significant changes in mRNA abundance between dcp2∆ and dcp2-EE mutants. Scatterplot of normalized mRNA densities as in Figure 1A for dcp2∆ vs. dcp2-E149Q,E153Q (dcp2-EE) cells, showing a Spearman correlation coefficient of 0.99.
-
Figure 1—figure supplement 2—source data 1
RPKM-normalized reads from RNA-Seq and Ribo-Seq for biological replicates of WT, dcp2∆, and dcp2-EE cells (Figure 1—figure supplement 2A–F); normalized mRNA densities for all transcripts in dcp2∆ vs. dcp2-EE cells (Figure 1—figure supplement 2G).
- https://cdn.elifesciences.org/articles/85545/elife-85545-fig1-figsupp2-data1-v2.zip
Figure 2 with 1 supplement
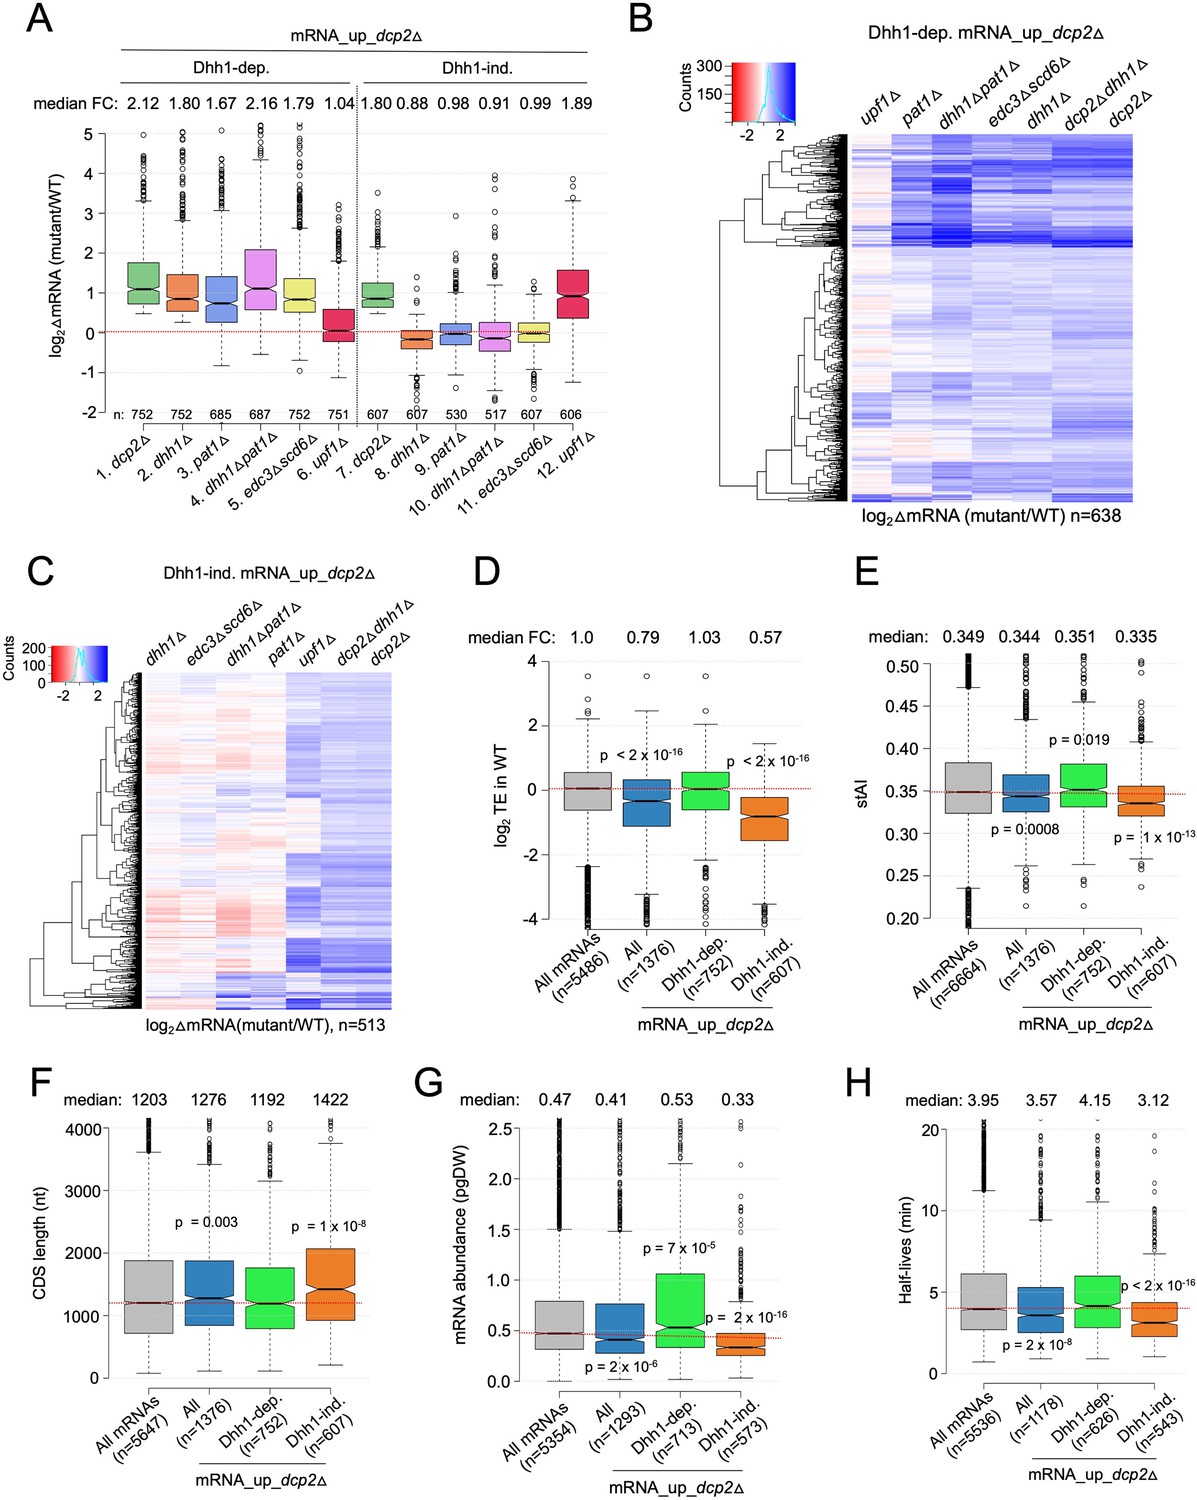
Multiple decapping activators function in unison to down-regulate a subset of Dcp2-repressed mRNAs.
(A) Notched box-plot as in Figure 1B showing log2fold-changes in mRNA abundance in the mutants indicated at the bottom vs. WT for the Dhh1-dependent (cols. 1–6) or Dhh1-independent (cols. 7–12) subsets of the mRNA_up_dcp2Δ set of transcripts. (B, C) Hierarchical clustering analyses as in Figure 1E of the log2 fold-changes in mRNA abundance conferred by the mutations listed across the top vs. WT for the Dhh1-dependent (panel B, n = 638) or Dhh1-independent (panel C, n = 513) subset of the mRNA_up_dcp2∆ transcripts (excluding a few outliers [n = 36] with log2∆mRNA values >4 or <−4). Notched box-plot as in Figure 1B showing the log2TE in WT cells (D), species-specific tRNA adaptation index (stAI) values (E), coding sequence (CDS) length (F), mRNA abundance expressed as pg per dry cellular weight (G) and half-lives (H) for All mRNAs, all mRNA_up_dcp2∆ transcripts, or the Dhh1-dependent or -independent subsets of mRNA_up_dcp2∆ transcripts. p-values calculated using the Mann–Whitney U test for the differences between all mRNAs and the indicated groups are shown. For (D), WT translational efficiency (TE) values were calculated as the ratio of mRNA reads protected from RNAse digestion by association with translating 80S ribosomes (RPFs) to the total mRNA reads measured by RNA-Seq for the same transcript in WT cells.
-
Figure 2—source data 1
log2 fold-changes in mRNA abundance observed by RNA-Seq analysis in pat1Δ, dhh1Δpat1Δ, edc3scd6Δ, and upf1Δ cells relative to WT for all transcripts (Figure 2A–C).
- https://cdn.elifesciences.org/articles/85545/elife-85545-fig2-data1-v2.zip
-
Figure 2—source data 2
mRNA properties for all transcripts including TE in WT cells, species-specific tRNA adaptation index (stAI), CDS lengths, half-lives, and mRNA abundance (Figure 2D–H).
- https://cdn.elifesciences.org/articles/85545/elife-85545-fig2-data2-v2.zip
Figure 2—figure supplement 1

All three deletion strains lacking a Upf factor exhibit similar changes in mRNA abundances for the two groups of transcripts regulated by Dcp2.
Notched box-plot as in Figure 1B showing log2 fold-changes in mRNA abundance in dcp2∆, upf1∆, upf2∆, and upf3∆ vs. WT for the Dhh1-dependent or -independent subsets of these mRNAs. Data for upf1∆, upf2∆, and upf3∆ vs. WT were taken from Celik et al., 2017.
-
Figure 2—figure supplement 1—source data 1
log2 fold-changes in mRNA abundance observed by RNA-Seq analysis in upf1Δ, upf2Δ, and upf3Δ cells vs. WT for all transcripts (Figure 2—figure supplement 1).
- https://cdn.elifesciences.org/articles/85545/elife-85545-fig2-figsupp1-data1-v2.zip
Figure 3 with 4 supplements
Evidence that Dhh1-independent changes in mRNA abundance conferred by dcp2Δ do not result from altered transcription.
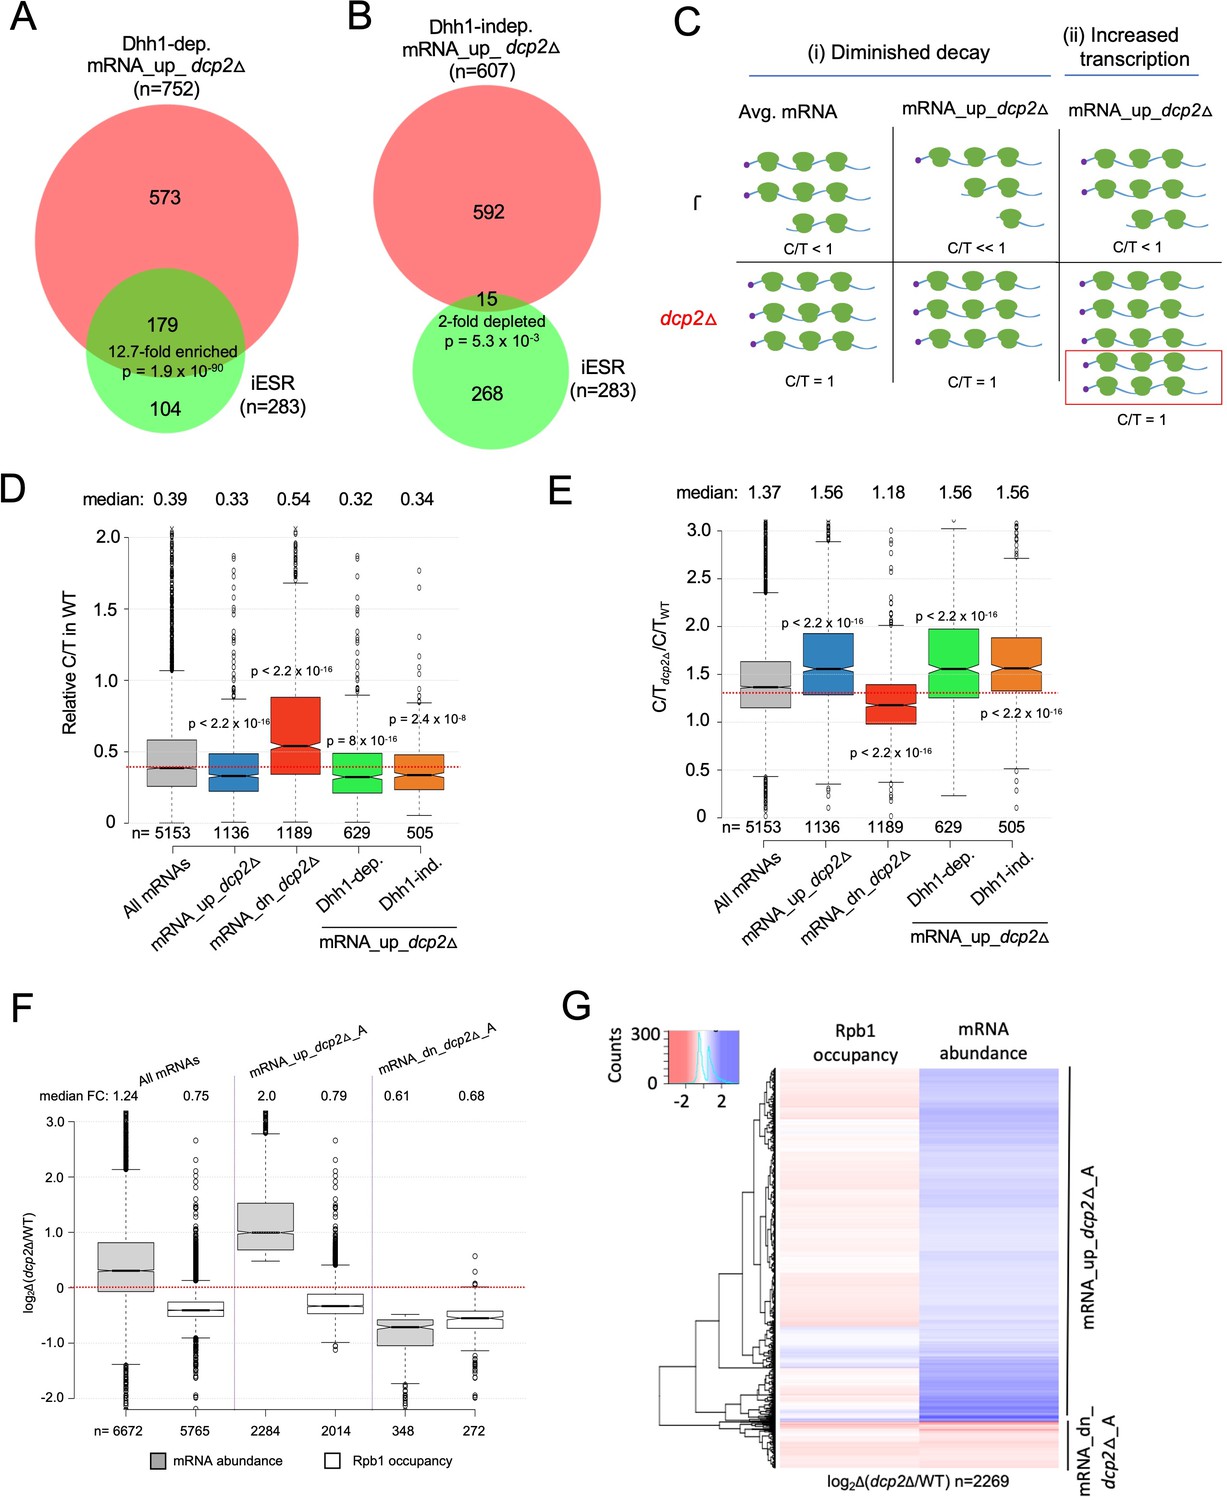
(A, B) The Dhh1-independent subset of Dcp2-repressed mRNAs are not enriched for iESR transcripts. Proportional Venn diagrams showing overlap between the Dhh1-dependent (A) and -independent (B) subsets of mRNA_up_dcp2Δ transcripts with induced ESR (iESR) mRNAs. Hypergeometric distribution p-values are displayed for significant changes. (C) Schematics depicting the predicted effects of dcp2∆ on levels of the capped proportion of mRNAs for the mRNAs preferentially repressed by Dcp2 compared to the average mRNA, according to the two different derepression mechanisms of (i) diminished decapping/degradation, and (ii) increased transcription. Mechanism (i). In WT cells (upper panel), mRNAs preferentially targeted by Dcp2 for decapping and degradation (mRNA_up_dcp2∆) have a smaller proportion of capped transcripts (C/T<<1) compared to mRNAs with average susceptibility to Dcp2 (Avg. mRNA, C/T<1). In dcp2∆ cells (lower panel, red), the C/T ratios for both groups of mRNAs increase to unity, which confers a relatively larger increase in C/T ratio in dcp2∆ vs. WT cells for the mRNA_up_dcp2∆ group. Mechanism (ii). The mRNA_up_dcp2∆ group is preferentially induced at the transcriptional level and thus resembles the average mRNA both in C/T ratio in WT cells and the increase in C/T ratio in dcp2∆ vs. WT cells. The red box depicts the increase in number of transcripts in dcp2∆ by this mechanism. (D, E) Dcp2-repressed mRNAs exhibit greater than average decapping in WT cells that is reversed by dcp2∆. Notched box-plots of ratios of capped mRNA transcripts per million (TPMs) to total mRNA TPMs (C/T) in WT cells (D) or in dcp2∆ relative to WT cells (E) for all mRNAs (gray) or the following sets of mRNAs: mRNA_up_dcp2Δ (blue), mRNA_dn_dcp2Δ (red), Dhh1-dependent mRNA_up_dcp2Δ (green), and Dhh1-independent mRNA_up_dcp2Δ (orange). (F, G) Quantification of absolute Rpb1 occupancies and mRNA abundance by spike-in normalization reveals reduced Pol II occupancies of most genes showing mRNA derepression in dcp2Δ cells. (F) Notched box-plot analysis of changes in Rpb1 occupancies or mRNA abundance in dcp2∆ vs. WT cells for the mRNA_up_dcp2∆_A and mRNA_dn_dcp2∆_A groups identified by ERCC-normalized RNA-Seq for all mRNAs (cols. 1–2), mRNA_up_dcp2∆_A (cols. 3–4), and mRNA_dn_dcp2∆_A (cols. 5–6). (G) Hierarchical clustering analysis of the same data from (F) (excluding a few outliers [n = 16] with log2∆ values >+4 or <−4).
-
Figure 3—source data 1
List of iESR and rESR transcripts (Figure 3A, B).
- https://cdn.elifesciences.org/articles/85545/elife-85545-fig3-data1-v2.zip
-
Figure 3—source data 2
Relative capped to total mRNA ratios (C/T) for all mRNAs in WT, dcp2Δ, xrn1Δ, dcp2Δ cells vs. WT and in xrn1Δ vs. WT (Figure 3D, E).
- https://cdn.elifesciences.org/articles/85545/elife-85545-fig3-data2-v2.zip
-
Figure 3—source data 3
Calculation of size factors from S. pombe Rpb1 reads, and spike-in normalized S. cerevisiae Rpb1 reads obtained from Rpb1 ChIP-Seq.
Pearson correlations for aligned reads were calculated between biological replicates. The log2 fold-changes in spike-in normalized Rpb1 occupancies (ChIP-Seq) and ERCC spike-in normalized mRNA levels from RNA-Seq data are shown for all transcripts in dcp2Δ vs. WT cells.
- https://cdn.elifesciences.org/articles/85545/elife-85545-fig3-data3-v2.zip
Figure 3—figure supplement 1
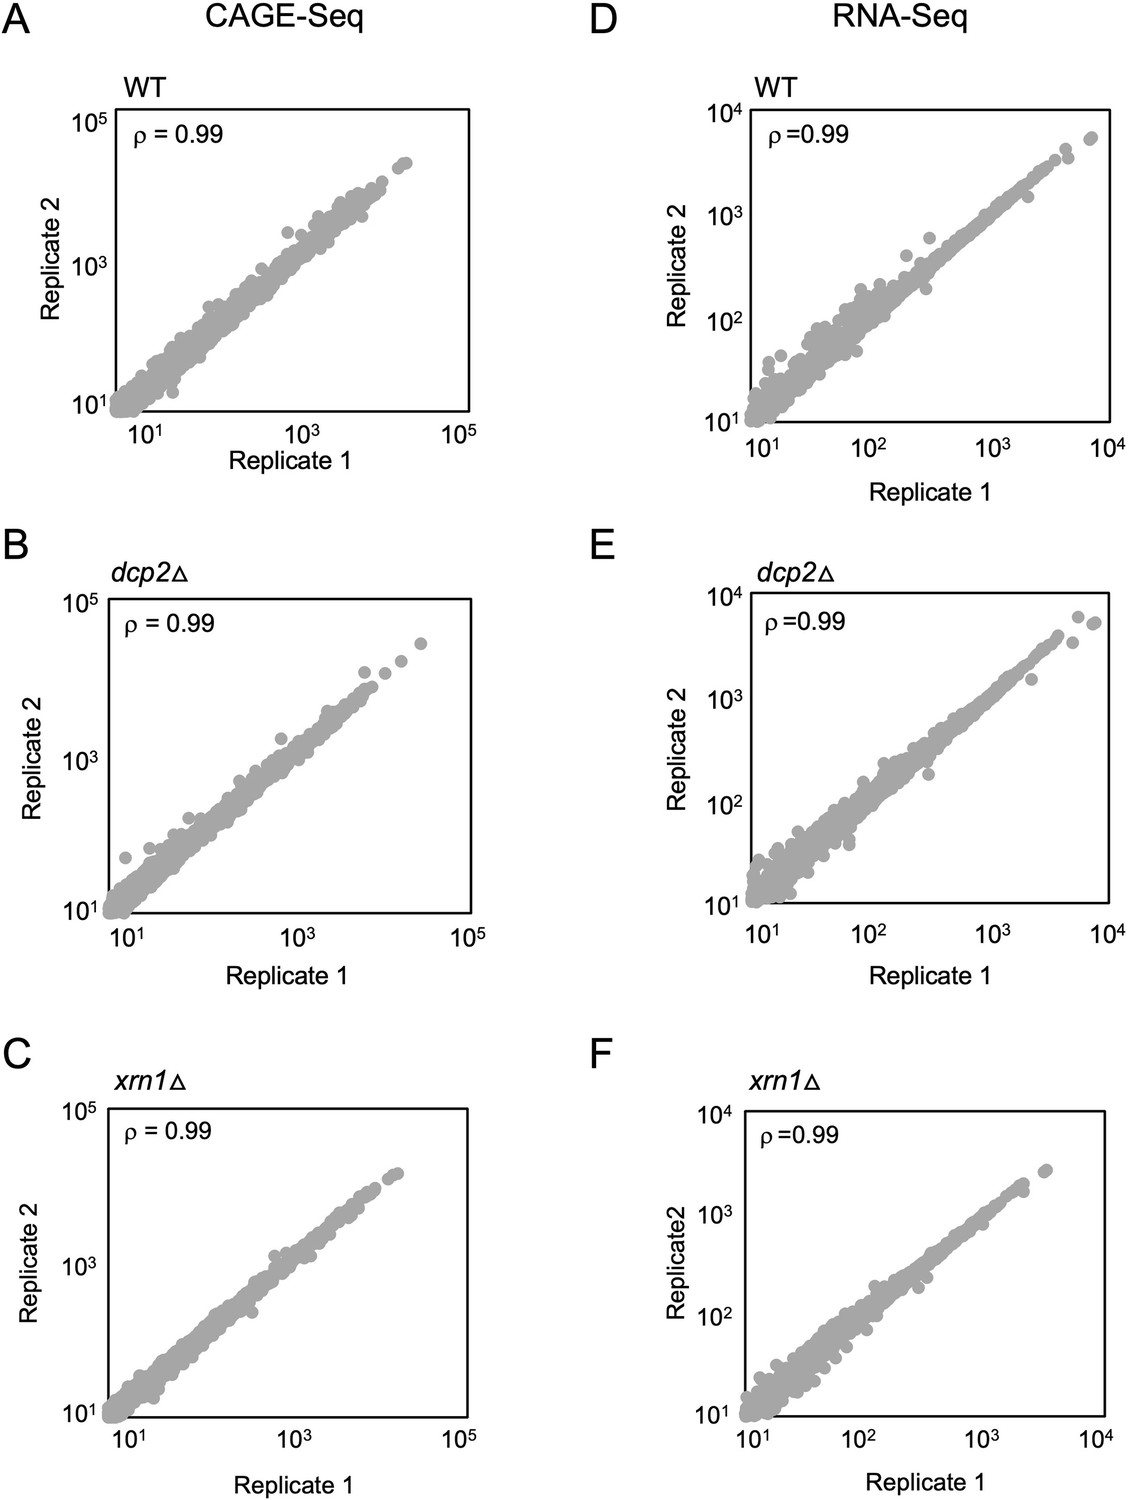
Reproducibility between biological replicates of CAGE-Seq and parallel RNA-Seq analyses for WT, dcp2∆, and xrn1∆ strains.
Scatterplots of TPM-normalized CAGE reads (A–C) or TPM-normalized RNA-Seq (D–F) reads for all expressed mRNAs between biological replicates of the WT (A, D), dcp2∆ (B, E), and xrn1∆ (C, F) strains. The Spearman correlation coefficient (ρ) is indicated in each plot.
-
Figure 3—figure supplement 1—source data 1
Statistics for CAGE-Seq and parallel RNA-Seq data analysis.
Data reproducibility between biological replicates for CAGE-Seq and RNA-Seq in WT, dcp2Δ, and xrn1Δ cells (Figure 3—figure supplement 1A–F).
- https://cdn.elifesciences.org/articles/85545/elife-85545-fig3-figsupp1-data1-v2.zip
Figure 3—figure supplement 2
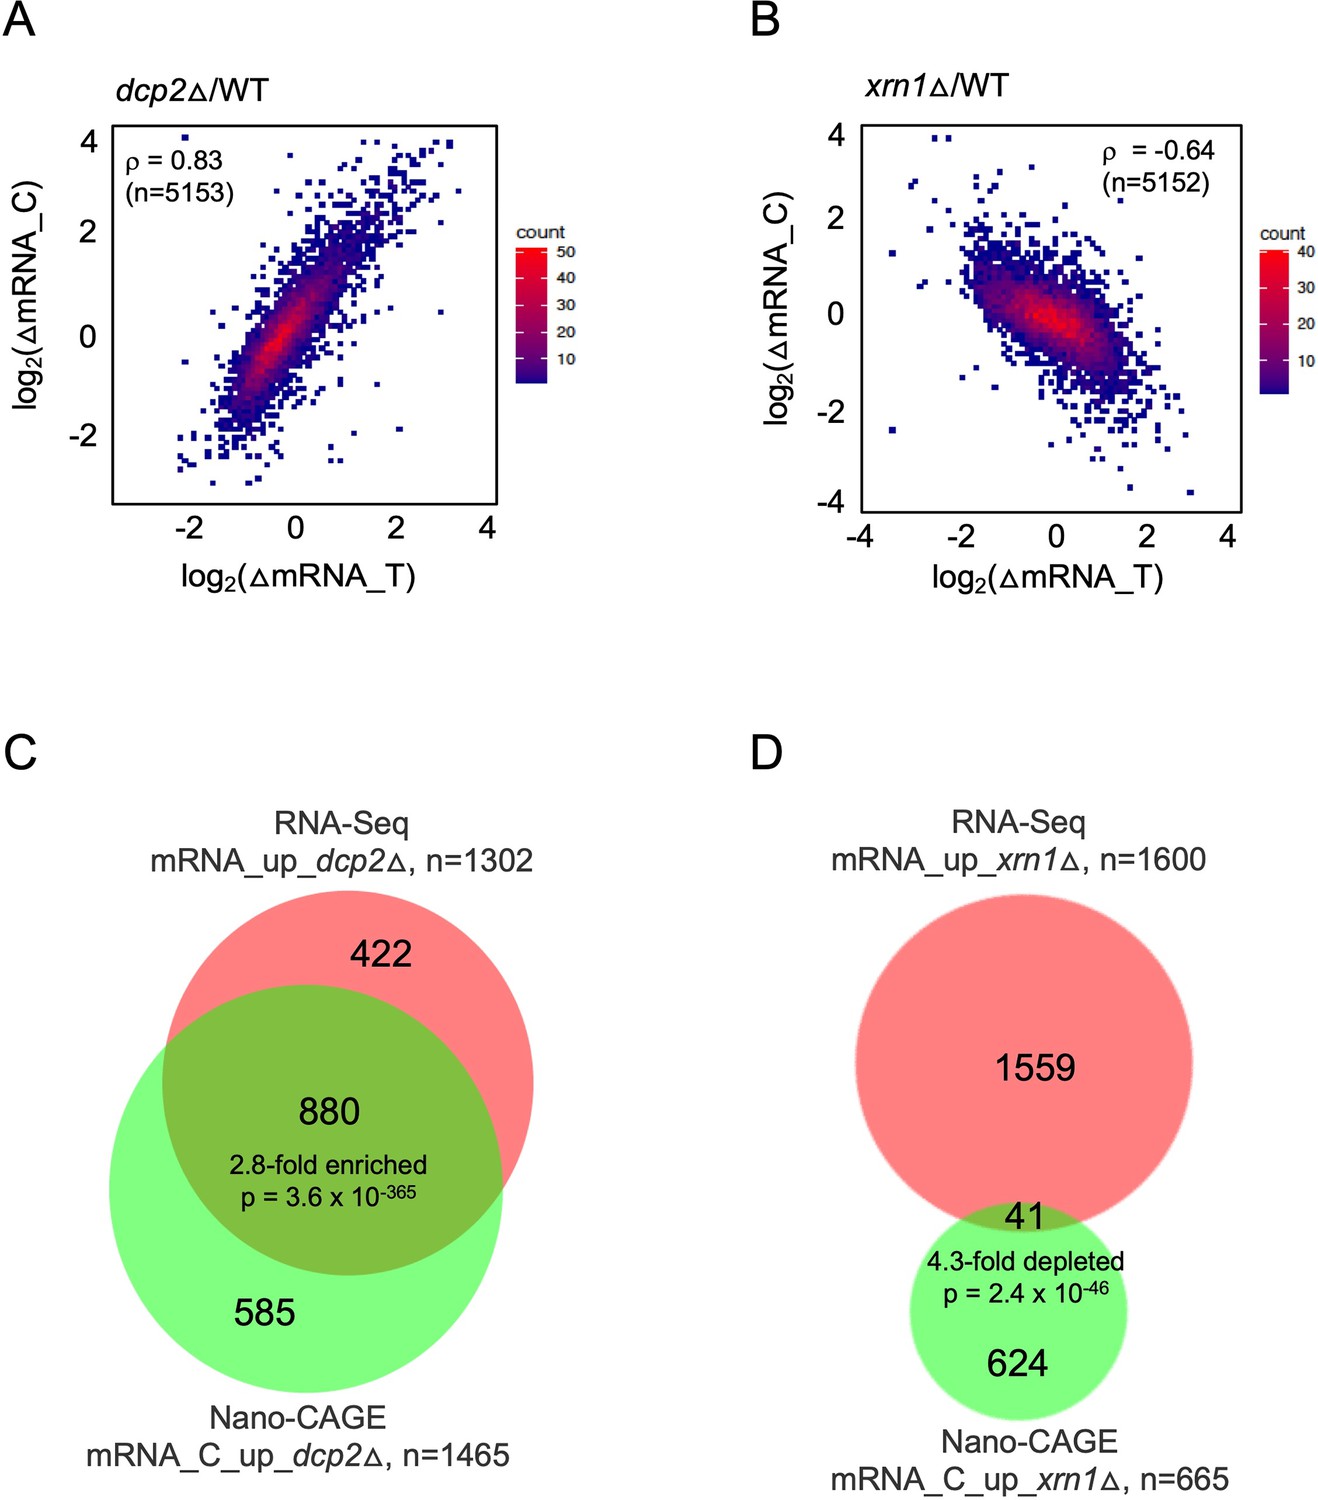
mRNAs increased in abundance by dcp2∆ or xrn1∆ differ in accumulating as capped (dcp2∆) or uncapped (xrn1∆) species.
Density scatterplots of log2 fold-changes in abundance of capped mRNA (from CAGE-Seq) vs. total mRNA (from RNA-Seq) in mutant vs. WT for (A) dcp2∆ or (B) xrn1∆ cells. Red and blue color represents higher and lower density of points, respectively. Proportional venn diagrams showing overlaps between total and capped mRNAs that are significantly increased in abundance in mutant vs. WT for dcp2∆ (C) or xrn1∆ (D) cells.
-
Figure 3—figure supplement 2—source data 1
log2 fold-changes in capped mRNAs (CAGE-Seq) and total mRNA (RNA-Seq) for all transcripts in dcp2Δ vs. WT and xrn1Δ vs. WT cells (Figure 3—figure supplement 2A, B).
List of transcripts (total and capped) significantly increased in abundance by dcp2Δ and xrn1Δ (Figure 3—figure supplement 2C, D).
- https://cdn.elifesciences.org/articles/85545/elife-85545-fig3-figsupp2-data1-v2.zip
Figure 3—figure supplement 3
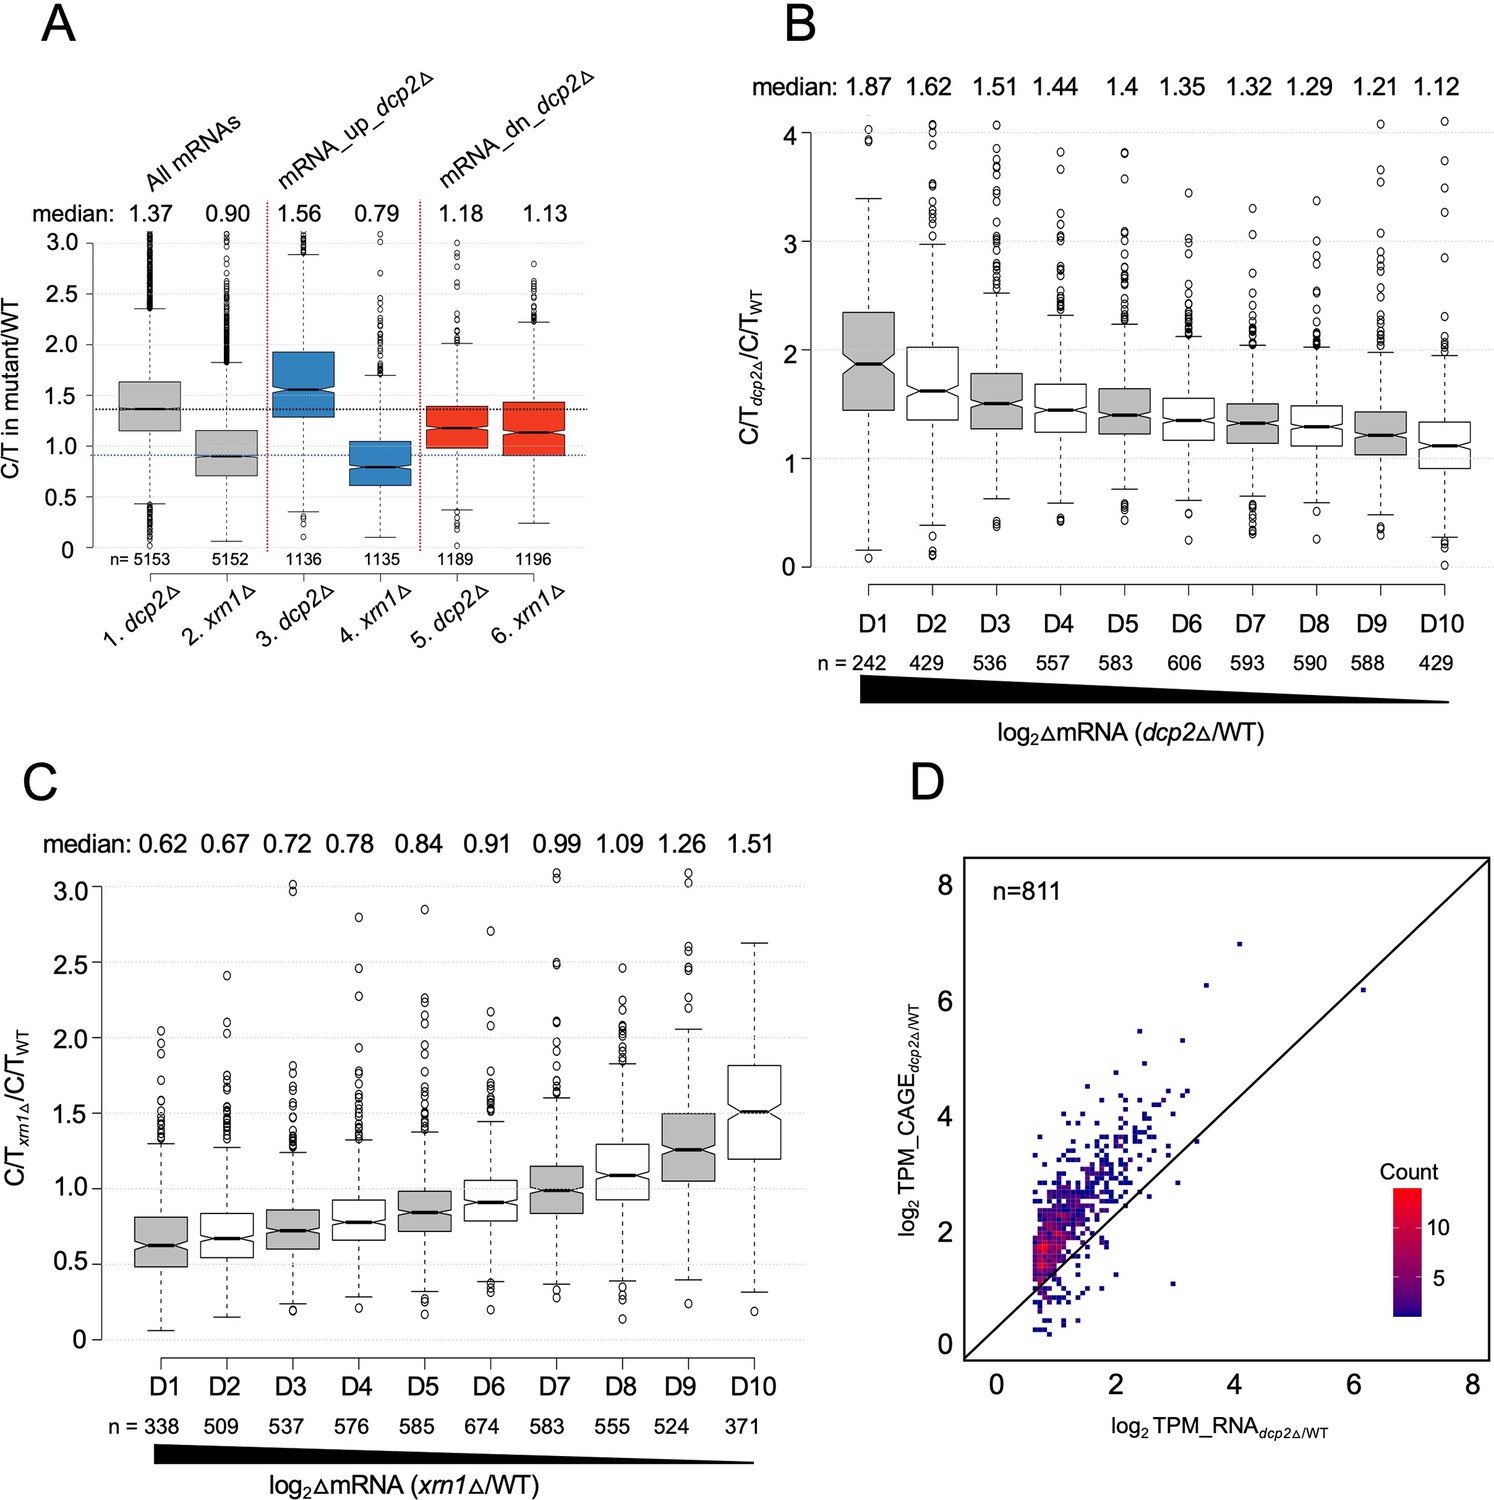
Supporting evidence that mRNAs increased in abundance by dcp2∆ exhibit greater than average levels of both decapping and degradation of uncapped intermediates by Xrn1.
(A) Notched box-plot showing relative proportions of capped mRNAs (C/T ratio) in dcp2∆ or xrn1∆ vs. WT cells for all mRNAs and for the two sets of mRNA_up_dcp2∆ or mRNA_dn_dcp2∆ transcripts. Notched box-plots of C/T ratios in dcp2∆ vs. WT (B) or xrn1∆ vs. WT (C) across 10 deciles of transcripts binned according to their increased abundance in the corresponding mutant relative to WT, progressing left to right from highest to lowest derepression ratios. (D) Density scatterplot showing log2 ratios of TPMs from CAGE analysis (y-axis) vs. TPMs from RNA-Seq (x-axis) in dcp2∆ vs. WT for the 811 of 1302 mRNA_up_dcp2∆ transcripts from Figure 3—figure supplement 2C for which CAGE data was obtained.
Figure 3—figure supplement 4
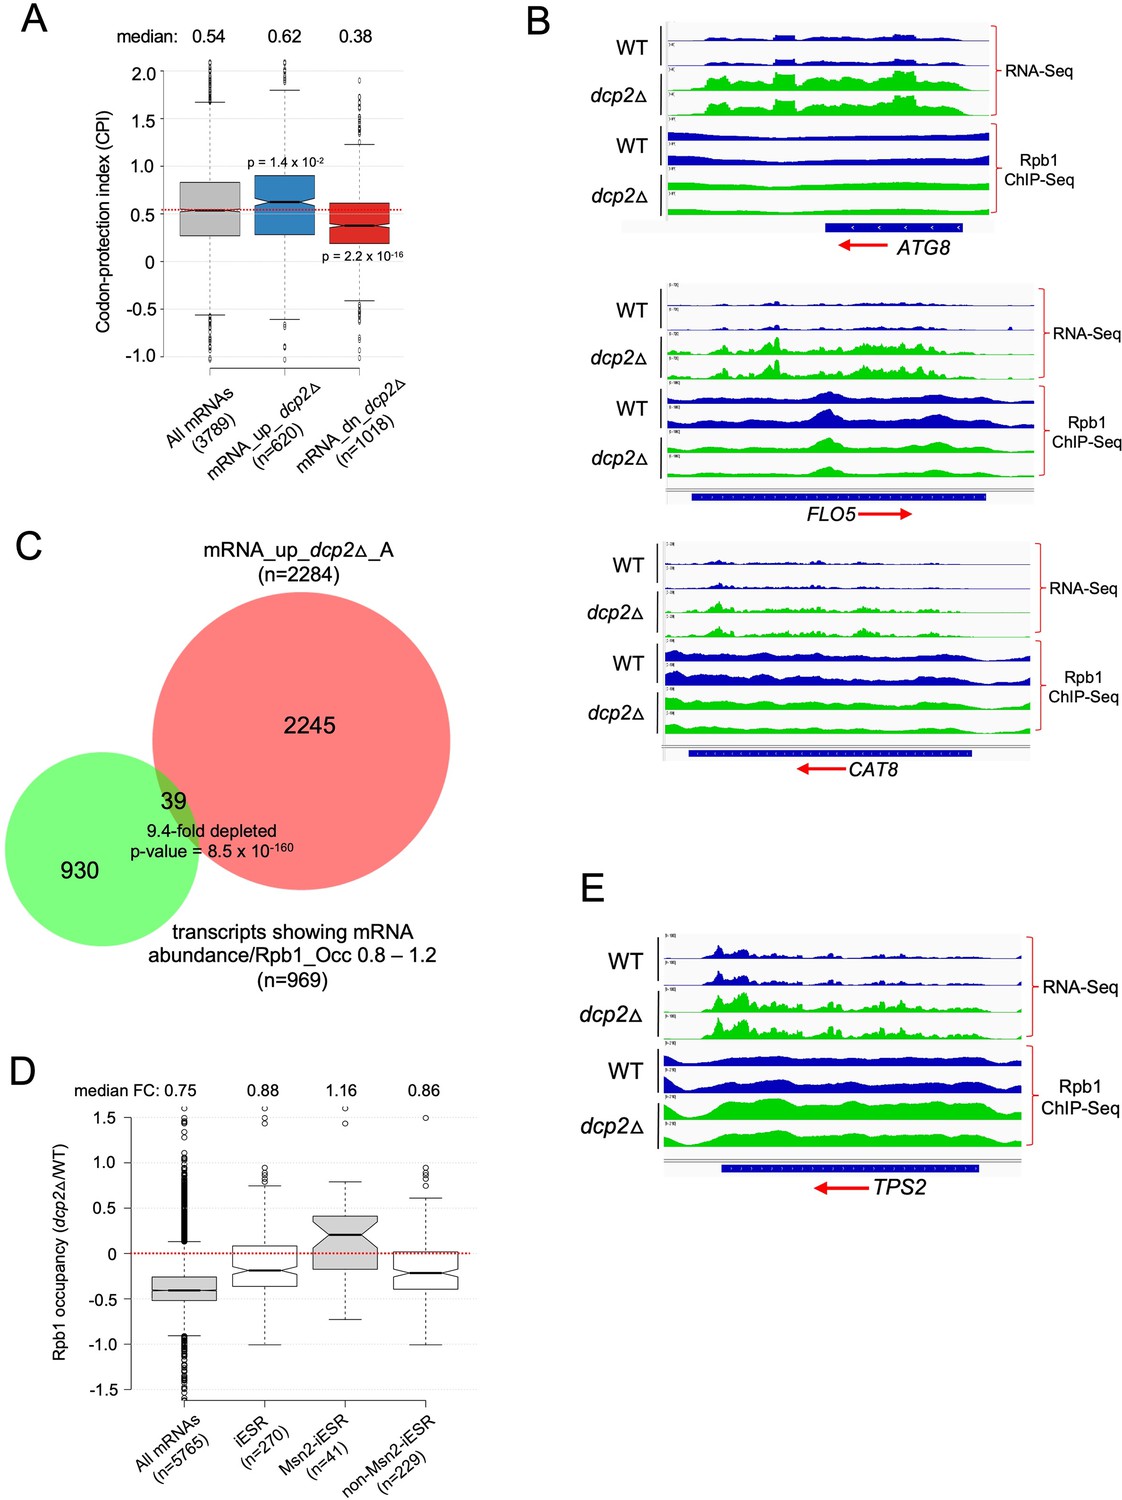
Analyses of codon-protection index (CPI) values and Rpb1 occupancies determined by ChIP-Seq indicate that mRNA derepression by dcp2Δ results primarily from loss of decapping-mediated cotranslational mRNA decay not increased transcription.
(A) Dcp2-repressed mRNAs exhibit greater than average co-translational decay. Notched box-plot of the CPI values for all mRNAs or the sets of mRNA_up_dcp2Δ or mRNA_dn_dcp2Δ transcripts. (B) IGV depictions of absolute mRNA abundance (RNA-Seq) or absolute Pol II occupancies over the CDS (Rpb1 ChIP-Seq) for the indicated three genes in dcp2Δ vs. WT cells, showing two biological replicates for each. (C) Overlap between the 2284 mRNAs up-regulated by dcp2∆ (RNA-Seq) from Figure 3F and the transcripts showing similar absolute changes in mRNA abundance and Rpb1 occupancy in dcp2∆ vs. WT, with ratios of mRNA abundance vs. Rpb1 occupancy of 0.8–1.2. (D) Notched box-plots showing changes in absolute Rpb1 occupancies averaged over the CDSs in dcp2∆ vs. WT cells for all mRNAs, the 270 iESR genes, the 41 iESR genes found to bind Msn2 in their promoter regions following a shift from glucose to glycerol as carbon source (Elfving et al., 2014), and the remaining iESR genes lacking detectable Msn2 binding. (E) IGV depictions presented as in (B) for the TPS2 gene.
-
Figure 3—figure supplement 4—source data 1
CPI values for all mRNAs (Figure 3—figure supplement 4A).
- https://cdn.elifesciences.org/articles/85545/elife-85545-fig3-figsupp4-data1-v2.zip
-
Figure 3—figure supplement 4—source data 2
List of transcripts showing ratios of absolute mRNA abundance to absolute Rpb1 occupancy of 0.8–1.2 (Figure 3—figure supplement 4C).
- https://cdn.elifesciences.org/articles/85545/elife-85545-fig3-figsupp4-data2-v2.zip
Figure 4 with 2 supplements
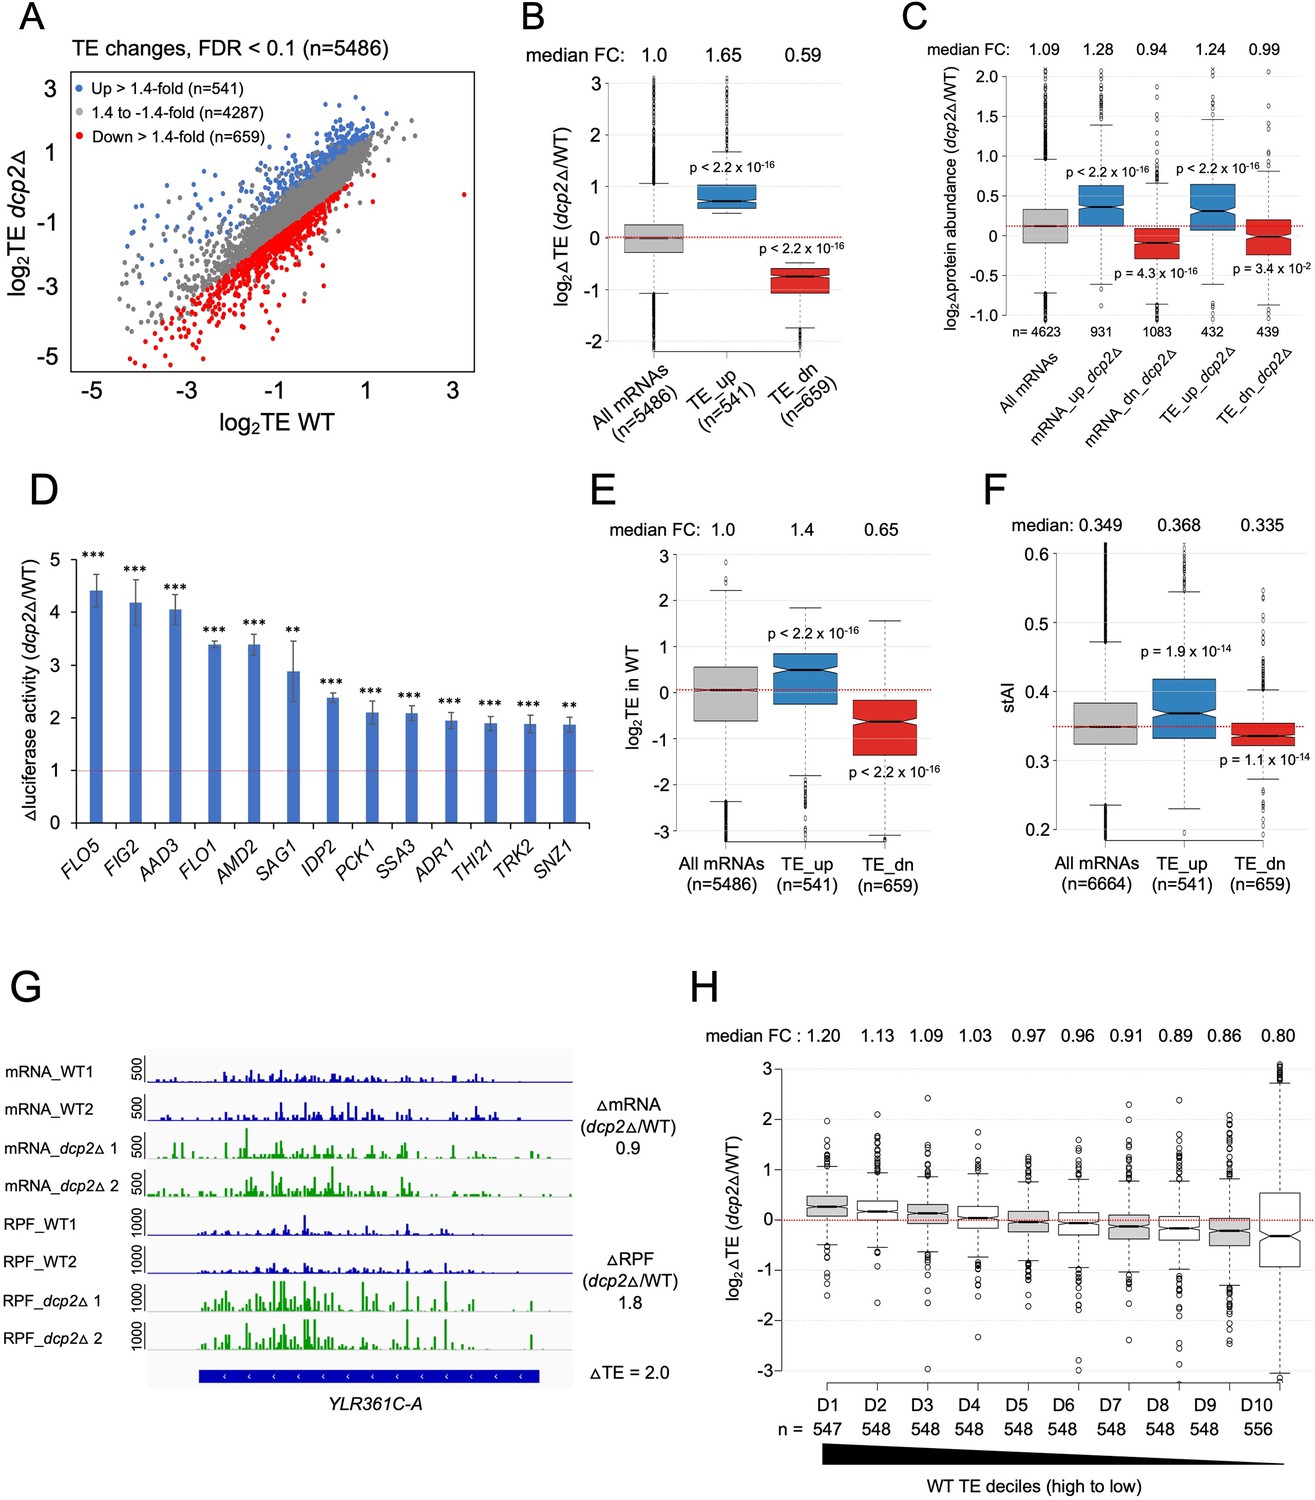
Dcp2 regulates the TEs of hundreds of transcripts.
(A) Scatterplot as in Figure 1A except displaying significant log2 fold-changes in TE in dcp2Δ vs. WT cells, determined by ribosome profiling. (B) Notched box-plot of log2 fold-changes in TE (from ribosome profiling) in dcp2Δ vs. WT cells for all mRNAs (with median FC of 1.0) and for the two sets of TE_up_dcp2Δ or TE_dn_dcp2Δ transcripts showing translational repression or stimulation, respectively, by Dcp2. (C) Notched box-plot of log2 fold-changes in protein abundance determined by TMT-MS/MS in dcp2Δ vs. WT cells for all mRNAs or for the four indicated groups showing Dcp2-mediated repression or stimulation of mRNA abundance or TE. (D) Changes in Nano-luciferase activity in dcp2Δ vs. WT cells expressed from the indicated 13 nLUC reporters. Average values (± standard error of the mean [SEM]) from at least three biological replicates are shown. Results of t-tests are indicated as: ***p < 0.001, **p < 0.01. Notched box-plot of log2TE in WT (E) and species-specific tRNA adaptation index (stAI) values (F) for all mRNAs or for the two groups showing repression or stimulation of translation by Dcp2. (G) Representative gene exhibiting increased TE in dcp2Δ vs. WT cells. Integrated Genomics Viewer (IGV, Broad Institute) display of mRNA and RPF reads across the YLR361C-A gene from two biological replicates each for WT, and dcp2Δ strains, shown in units of RPKM (reads per 1000 million mapped reads). Position of the CDS (blue) is at the bottom with the scale in bp; scales of RPKM for each track are on the left, and calculated ΔmRNA, ΔRPF and ΔTE values between each mutant and WT are on the right. (F) Notched box-plots of log2 fold-changes in TE in dcp2Δ vs. WT across ten deciles of transcripts binned according to TE in WT cells, progressing left to right from highest to lowest TEs.
-
Figure 4—source data 1
log2 fold-changes in TE measured by Ribo-Seq and parallel RNA-Seq analyses of dcp2Δ vs. WT cells for all transcripts and for the TE_up_dcp2Δ and TE_dn_dcp2Δ groups of mRNAs (Figure 4A, B).
- https://cdn.elifesciences.org/articles/85545/elife-85545-fig4-data1-v2.zip
-
Figure 4—source data 2
log2 fold-changes in protein abundance measured by TMT-MS/MS analysis of dcp2Δ vs. WT cells for all genes (Figure 4C).
- https://cdn.elifesciences.org/articles/85545/elife-85545-fig4-data2-v2.zip
-
Figure 4—source data 3
Specific activity of luciferase expressed from nLUC reporters in WT and dcp2Δ cells for three biological replicates, and changes in luciferase activity calculated for dcp2Δ vs. WT with SEM values (Figure 4D).
- https://cdn.elifesciences.org/articles/85545/elife-85545-fig4-data3-v2.zip
Figure 4—figure supplement 1
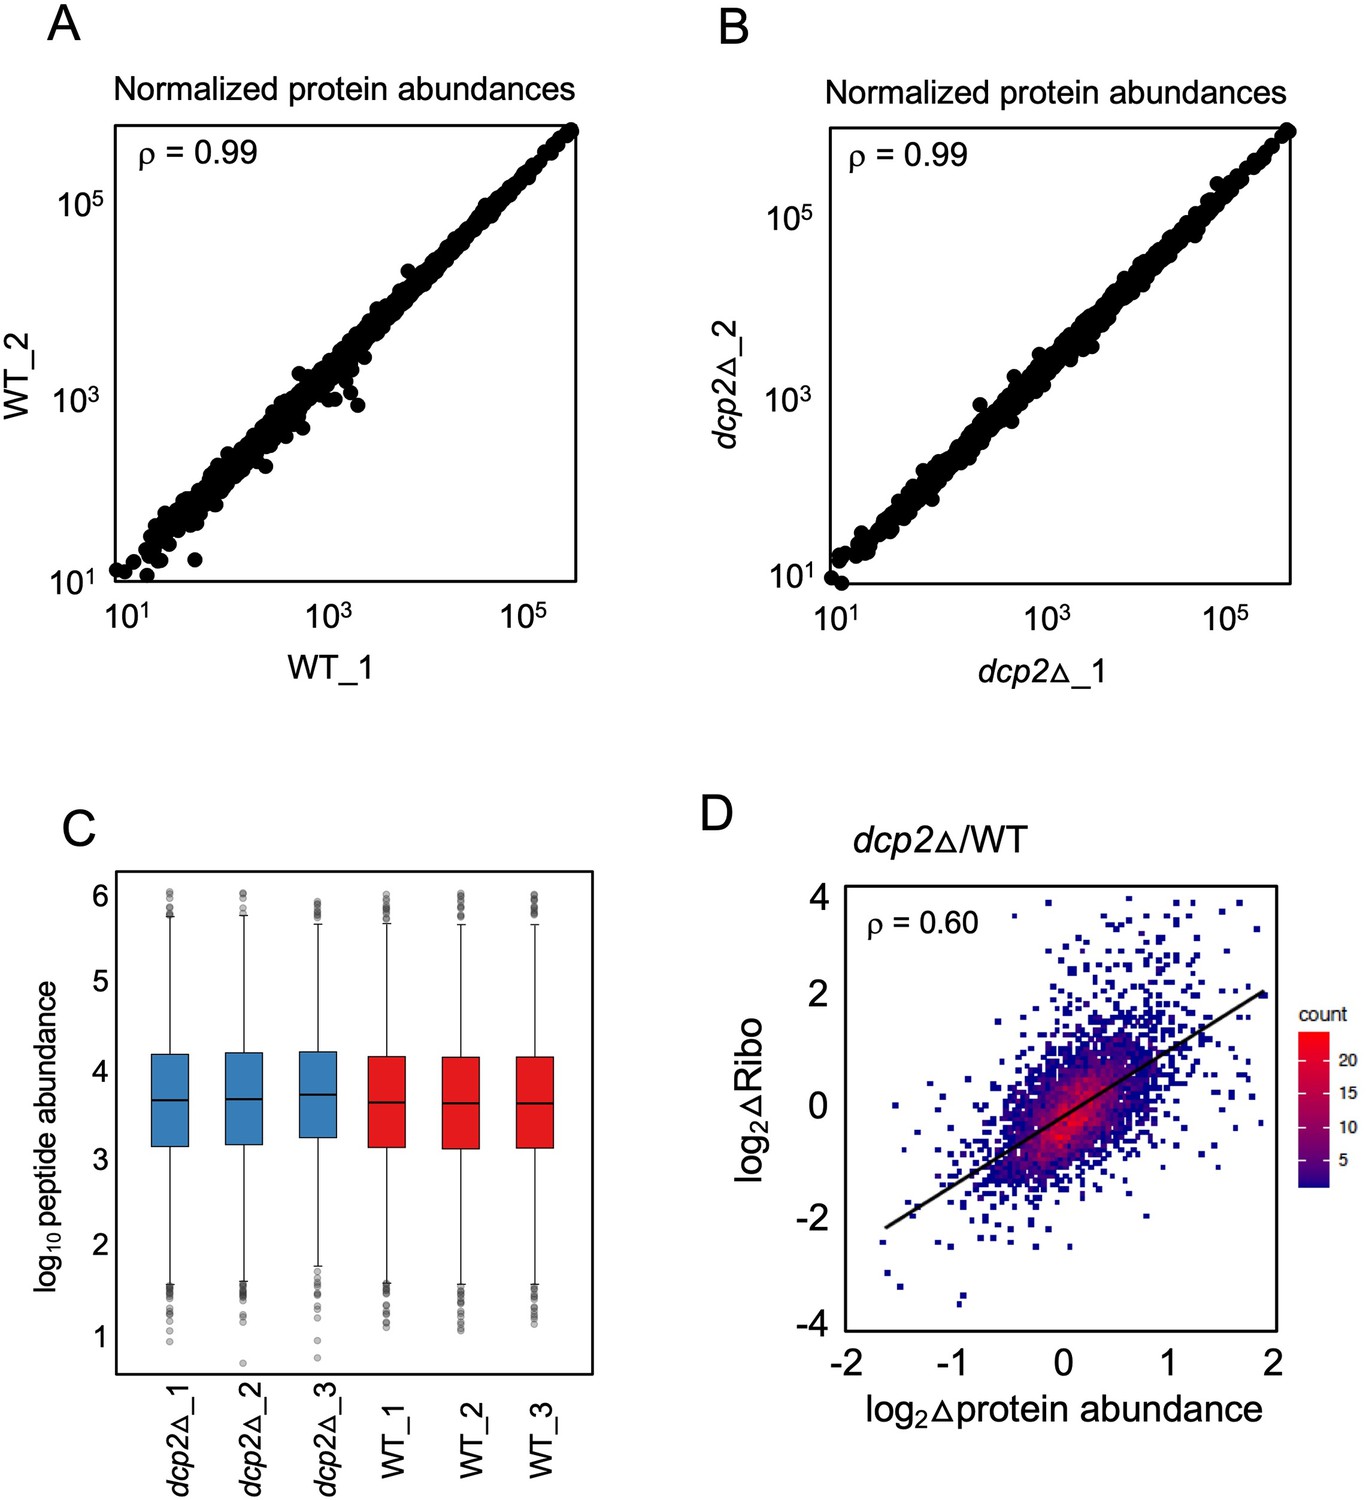
Marked correlation between RPF changes (from ribosome profiling) and protein abundance changes (from TMT-MS/MS) conferred by dcp2Δ.
(A, B) Scatterplot displaying normalized protein abundances determined by TMT-MS/MS for biological replicates, with Spearman’s correlation coefficients indicated in each plot. (C) Box-plots showing the distribution of normalized peptide abundances for three biological replicates each for dcp2∆ and WT strains. (D) Density-scatterplot of log2 fold-changes of RPFs vs. protein abundance for all genes detected in both ribosome profiling and TMT-MS/MS experiments, respectively. Red and blue color represents higher and lower density of points, respectively, and the linear regression line is in black. Spearman’s correlation coefficient (ρ) is displayed in each plot.
-
Figure 4—figure supplement 1—source data 1
Normalized protein abundances determined by TMT-MS/MS for biological replicates in WT and dcp2Δ cells (Figure 4—figure supplement 1A–C).
- https://cdn.elifesciences.org/articles/85545/elife-85545-fig4-figsupp1-data1-v2.zip
-
Figure 4—figure supplement 1—source data 2
log2 fold-changes in protein abundance measured by TMT-MS/MS and RPFs measured by ribosome profiling for dcp2Δ vs. WT cells for all genes/transcripts (Figure 4—figure supplement 1D).
- https://cdn.elifesciences.org/articles/85545/elife-85545-fig4-figsupp1-data2-v2.zip
Figure 4—figure supplement 2
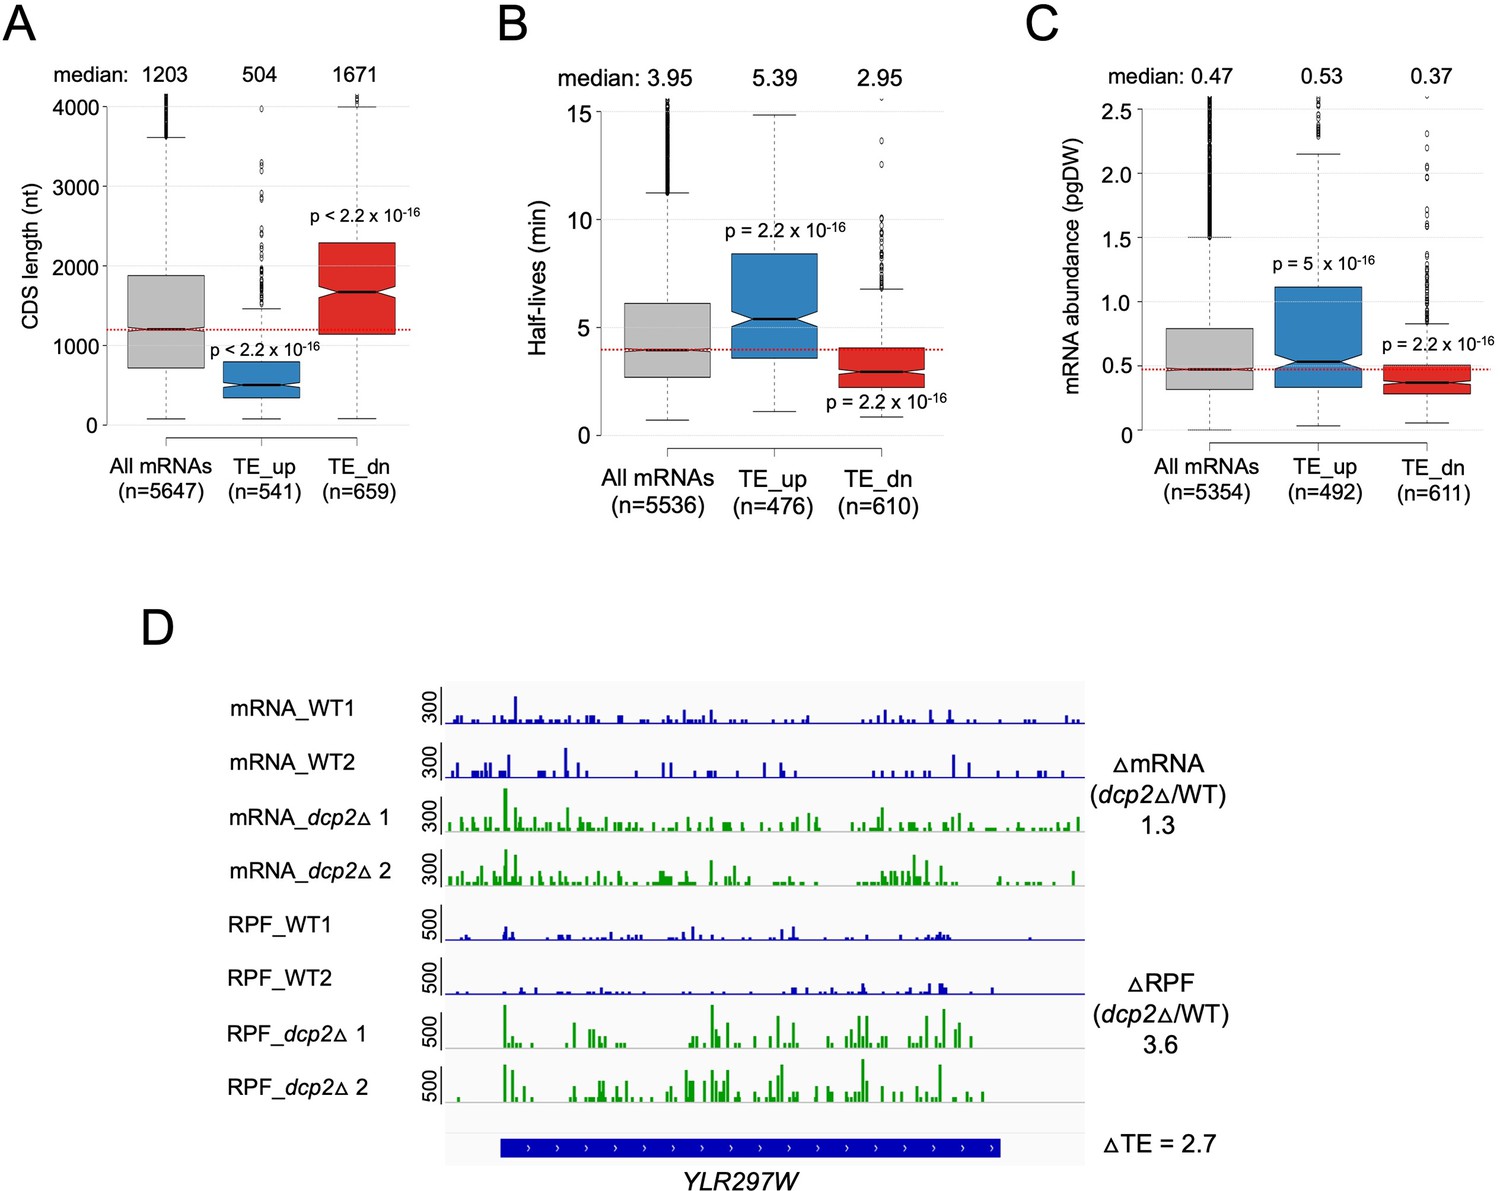
Dcp2 translationally repressed transcripts have properties associated with well-translated mRNAs.
Notched box-plots of CDS lengths (A), mRNA half-lives (B), mRNA abundances (C) for all mRNAs and the two sets of mRNAs translationally repressed or stimulated by Dcp2. (D) IGV depiction of a representative gene exhibiting increased TE in dcp2Δ vs. WT cells, presented as in Figure 4G.
Figure 5 with 1 supplement
Evidence that the majority of TE changes conferred by dcp2Δ result from increased competition for limiting PICs owing to diminished ribosome production and elevated mRNA levels.
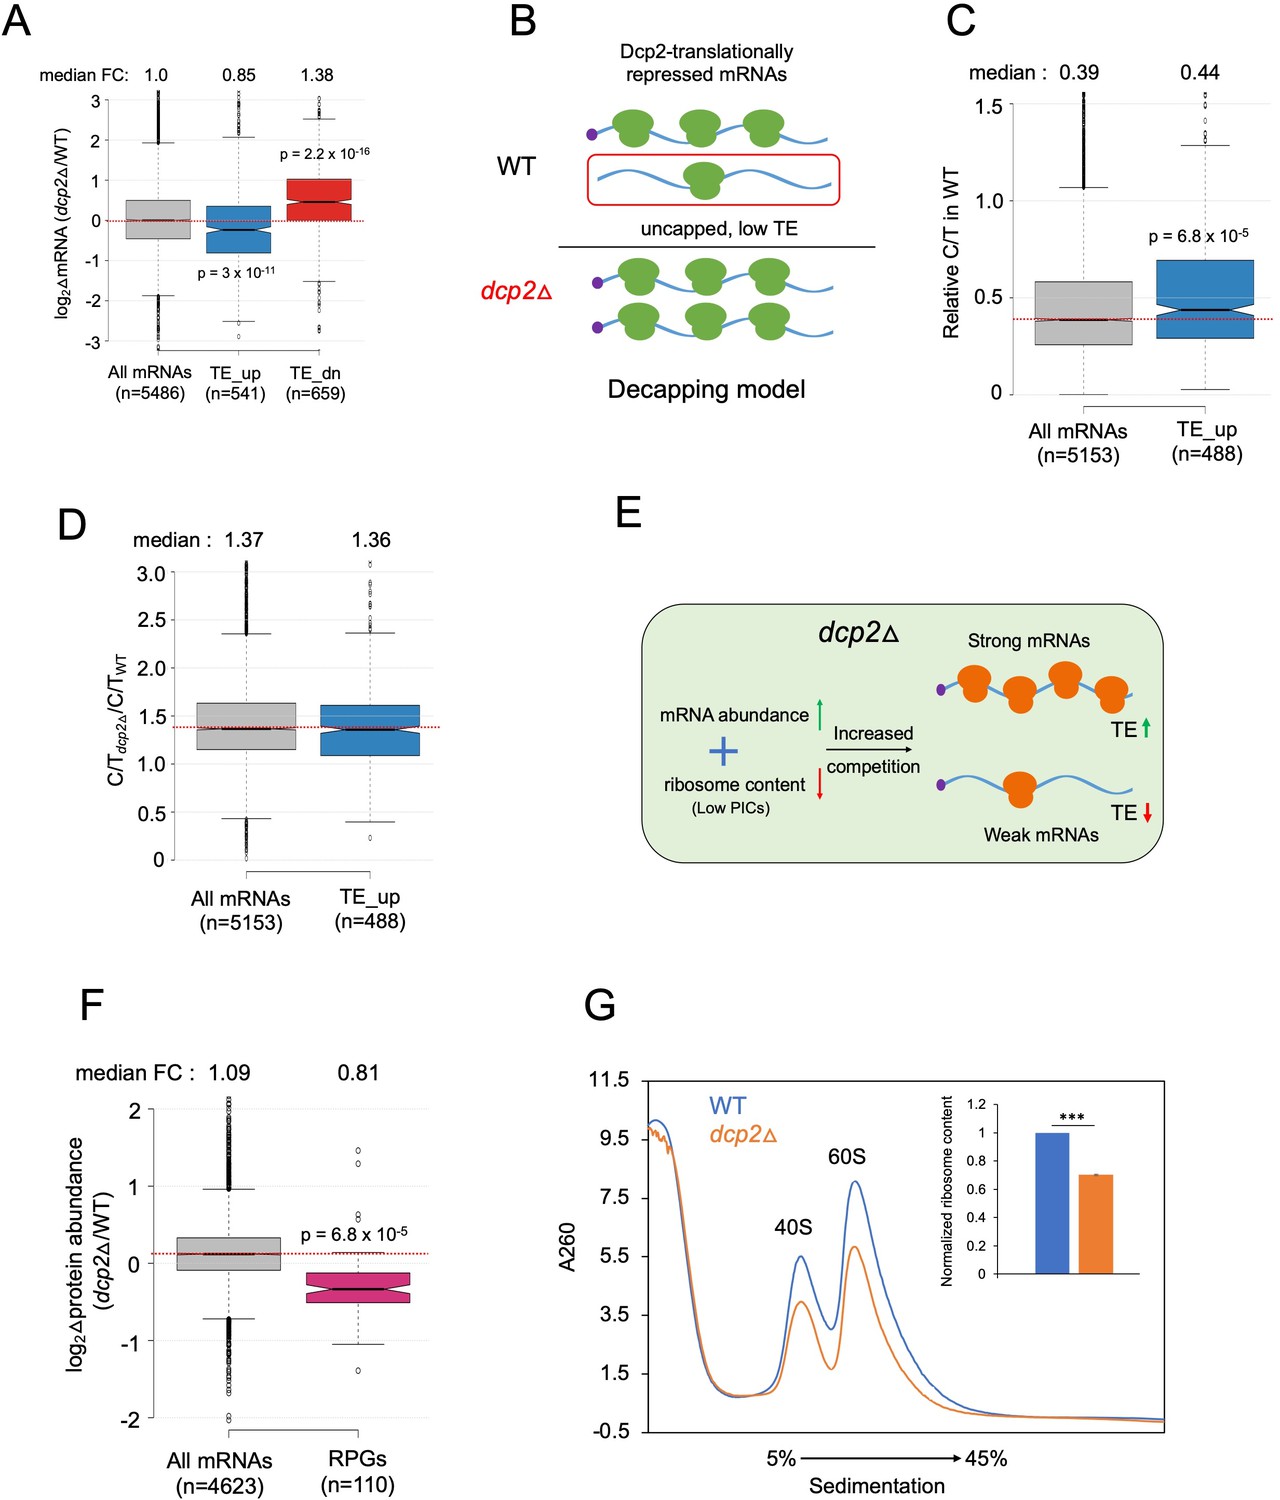
(A) Notched box-plot showing log2 fold-changes in mRNA abundance in dcp2Δ relative to WT cells for all mRNAs, or the mRNAs translationally repressed (blue) or stimulated (red) by Dcp2 in WT cells. (B) Hypothetical schematic model to explain TE increases conferred by dcp2Δ resulting from the persistence of translationally inert, decapped intermediates in WT cells. In WT (upper), the TE_up_dcp2Δ group of mRNAs is preferentially targeted by Dcp2 for decapping and these uncapped species cannot bind eIF4F and thus exhibit low TEs. In dcp2∆ cells (lower), decapping is eliminated and the low-TE, decapped fraction no longer exists, which increases the overall TE of the transcript pool. Notched box-plots of ratios of capped mRNA TPMs to total mRNA TPMs (C/T) (C) and C/T ratios in dcp2Δ vs. WT cells (D) for all mRNAs and the group translationally repressed by Dcp2. (E) Schematic of the preinitiation complex (PIC) competition model proposed to explain the broad reprogramming of TEs conferred by dcp2Δ. A combination of diminished ribosome production resulting from down-regulation of rESR transcripts and elevated bulk capped mRNAs resulting from loss of decapping-mediated mRNA turnover evokes increased competition among all mRNAs for limiting PICs, producing relatively greater translation of efficiently translated mRNAs in WT cells (strong mRNAs) at the expense of poorly translated mRNAs in WT (weak mRNAs). (F) Notched box-plot showing log2 fold-changes in protein abundance determined by TMT-MS/MS in dcp2Δ vs. WT cells for all mRNAs or those from 110 genes encoding ribosomal proteins (RPGs). (G) Quantification of total 40S and 60S ribosomal subunits in dcp2Δ vs. WT cells. Representative A260 profiles of equal proportions of cell extracts obtained from WT (blue) and dcp2Δ (orange) cultures are shown. The inset summarizes the combined areas under the 40S and 60S peaks normalized to the OD600 of the cell cultures calculated from three biological replicates of dcp2∆ and WT cells, setting the mean WT value to unity. An unpaired Student’s t-test indicates a highly significant difference in the means calculated from the biological replicates of the two different strains (***p < 0.001).
-
Figure 5—source data 1
Quantification of ribosome content relative to OD600 in dcp2Δ vs. WT cells (Figure 5G).
- https://cdn.elifesciences.org/articles/85545/elife-85545-fig5-data1-v2.zip
Figure 5—figure supplement 1
Supporting evidence that dcp2Δ evokes translational reprogramming by increasing competition for limiting preinitiation complexes (PICs).
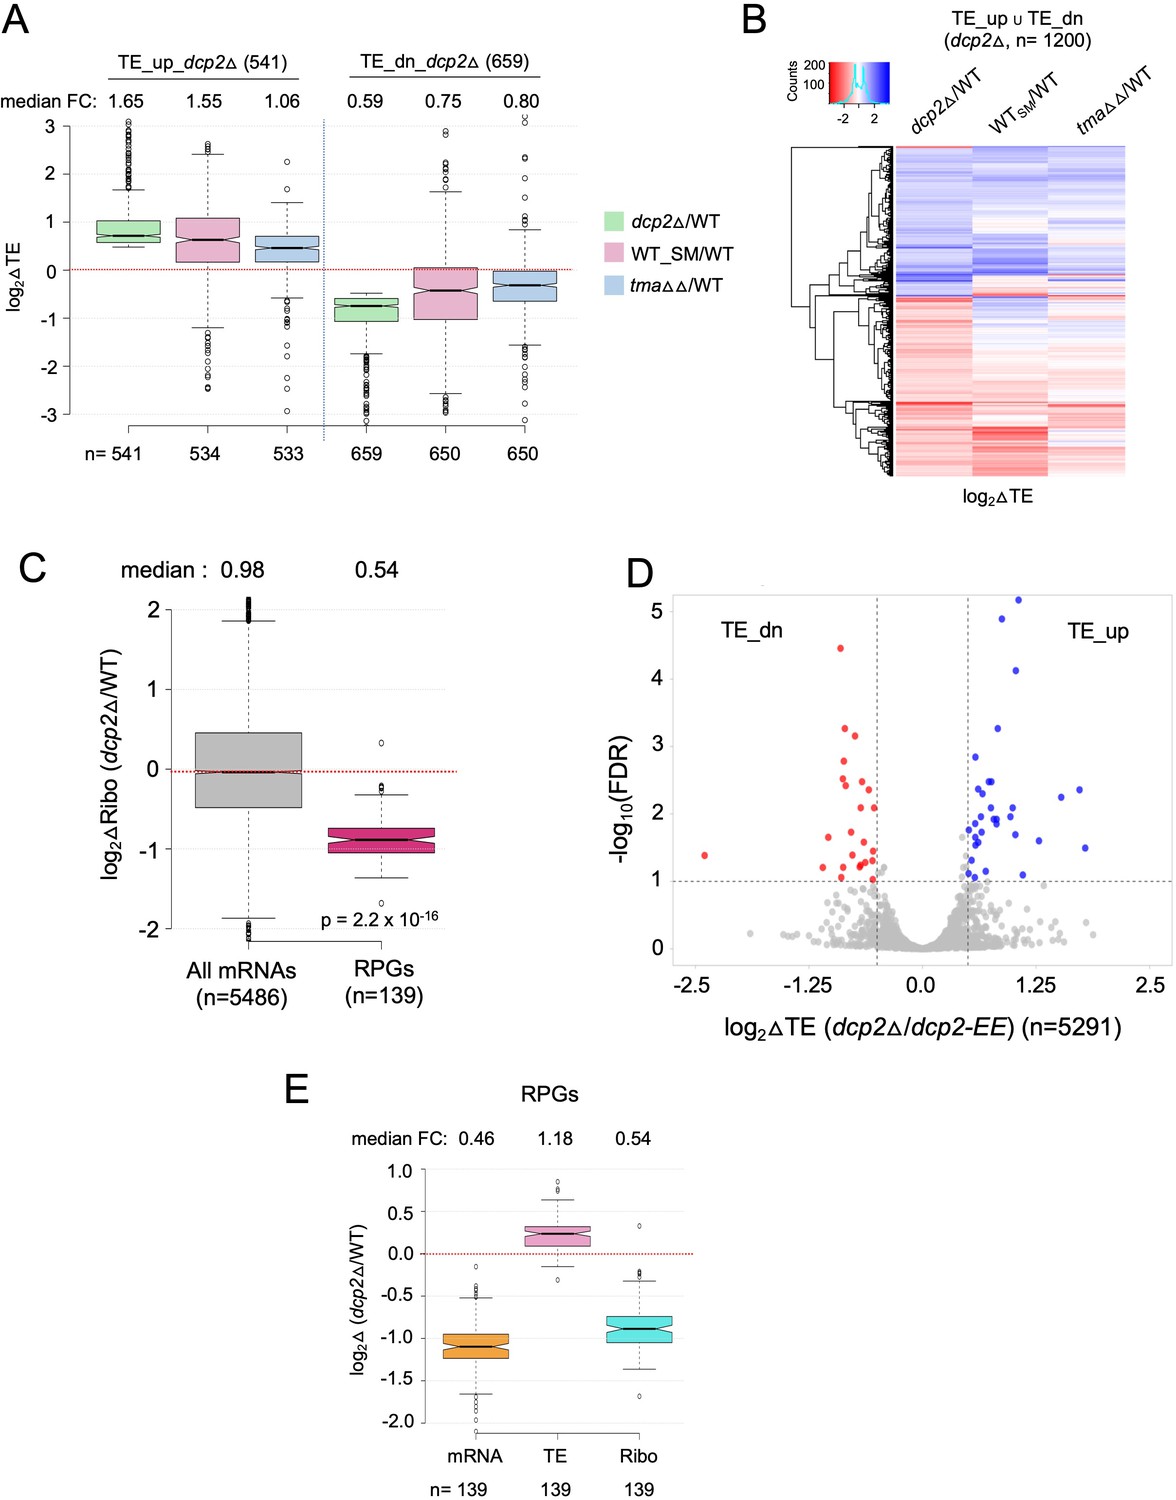
(A) Notched box-plot of log2 fold-changes in TE conferred by dcp2∆, SM treatment of WT cells, or the tma64Δ/tma20Δ double mutation, all determined by ribosome profiling, for the two groups of mRNAs that are translationally repressed (cols. 1–3) or translationally stimulated (cols. 4–6) by Dcp2. (B) Hierarchical clustering analysis of log2 fold-changes in TE conferred by dcp2∆ (col. 1), SM treatment of WT cells (col. 2), or the tma64Δ/tma20Δ double mutation (col. 3) for the 1200 mRNAs belonging to the same two groups analyzed in (B) for which data were available in all three analyses (excluding a few outliers with log2∆TE values >+4 or <−4). In panels A and B, ribosome profiling data from Gaikwad et al., 2021 were interrogated. (C) Notched box-plot of log2 fold-changes in RPFs measured by ribosome profiling in dcp2Δ vs. WT cells for all mRNAs or RPG mRNAs. (D) Evidence that the majority of the TE changes conferred by dcp2Δ result from loss of Dcp2 catalytic activity. A Volcano plot showing log2 fold-changes in TE in dcp2Δ vs. dcp2-EE cells (x-axis) vs. the −log10FDR values for the TE changes (y-axis) for all mRNAs. The dotted lines demarcate TE fold-changes of >1.4 at FDR <0.1, such that 41 mRNAs (blue dots) and 30 mRNAs (red dots) display significant TE increases or decreases, respectively. (E) Notched box-plot showing log2 fold-changes in mRNA, TE, or RPFs (Ribo) in dcp2Δ vs. WT cells for all RPGs. In accordance with the PIC competition model, the efficiently translated RPG mRNAs show increased TEs in dcp2Δ vs. WT cells despite strong reductions in abundance, (attributable to the rESR), for a net decrease in ribosome occupancies (RPFs/Ribo levels).
-
Figure 5—figure supplement 1—source data 1
log2 fold-changes in TE for all transcripts conferred by SM treatment of WT cells, or the tma64Δ/tma20Δ double mutation (Figure 5—figure supplement 1A, B).
- https://cdn.elifesciences.org/articles/85545/elife-85545-fig5-figsupp1-data1-v2.zip
-
Figure 5—figure supplement 1—source data 2
log2 fold-changes in TE in dcp2Δ vs. dcp2-EE cells for all mRNAs measured by ribosome profiling (Figure 5—figure supplement 1D).
- https://cdn.elifesciences.org/articles/85545/elife-85545-fig5-figsupp1-data2-v2.zip
Figure 6 with 1 supplement
mRNAs exhibiting Dhh1-dependent translational repression by Dcp2 are poorly translated mRNAs preferentially targeted for decapping by Dcp2 and Dhh1.
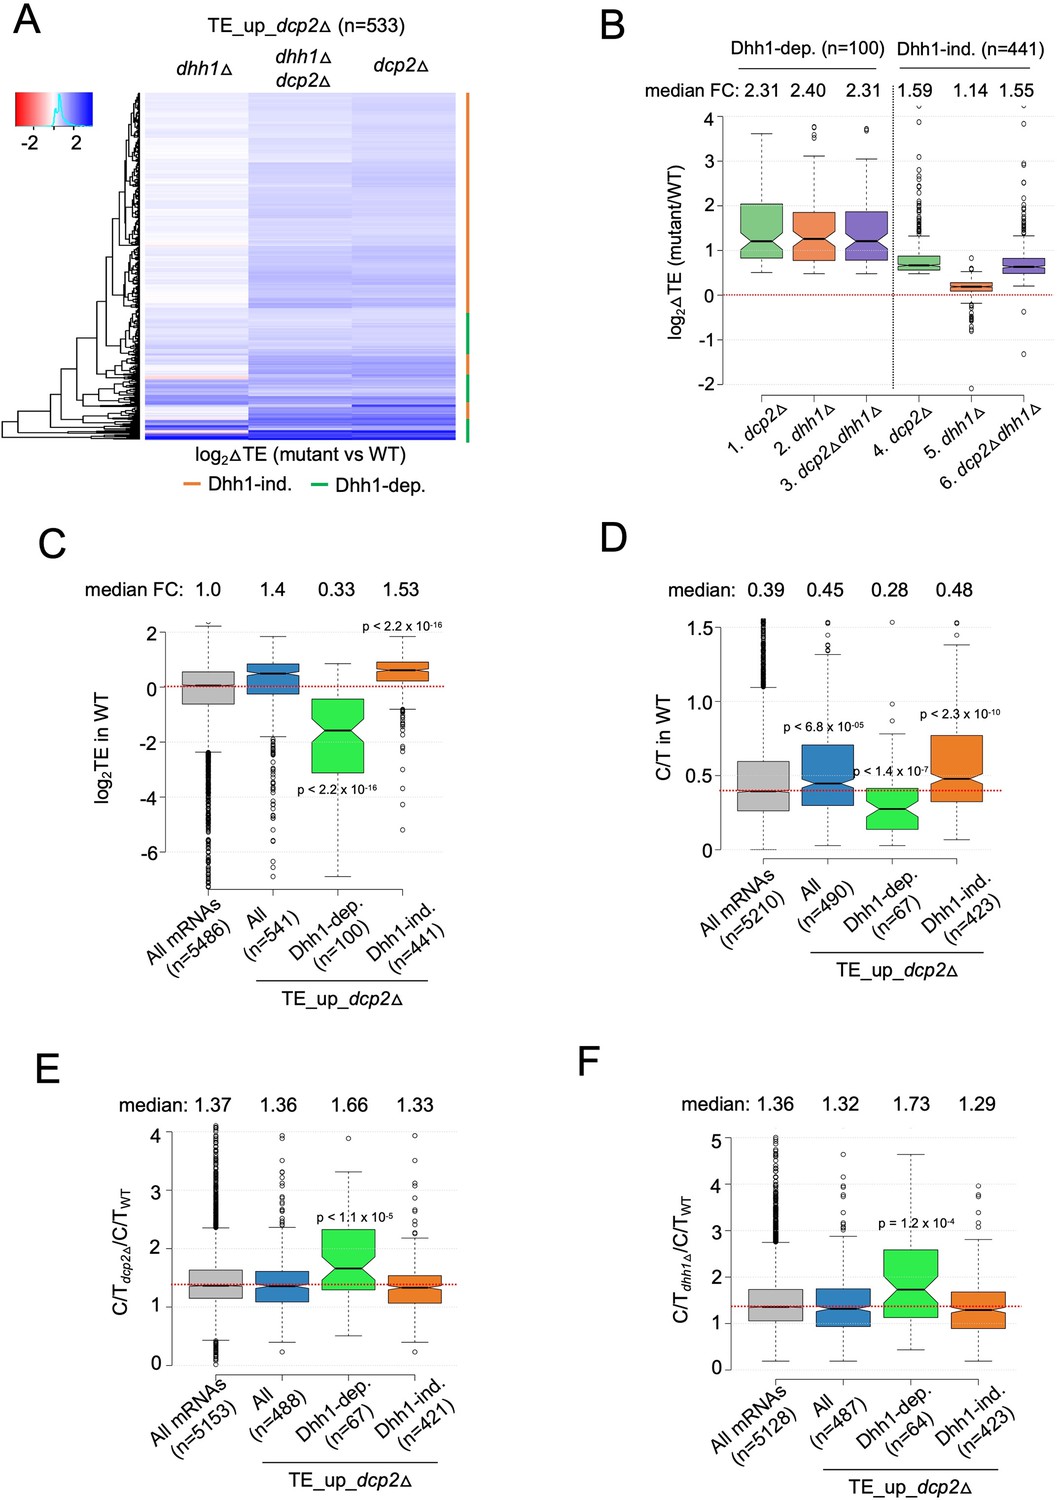
(A) Hierarchical clustering analysis of log2 fold-changes in TE conferred by the mutations listed across the top vs. WT for the TE_up_dcp2Δ mRNAs (excluding a few outliers [n = 7] with log2∆TE values >+4 or <−4). Dhh1 dependence or Dhh1 independence for the TE changes is indicated on the right with green or red bars, respectively. (B) Notched box-lot of log2 fold-changes in TE conferred by the mutations listed across the bottom vs. WT for the Dhh1-dependent TE_up_dcp2Δ (col. 1–3) or Dhh1-independent TE_up_dcp2Δ (col. 4–6) groups of mRNAs. Notched box-plot of log2 TE in WT (C), C/T ratios in WT (D), C/T ratios in dcp2∆ vs. WT (E), and C/T ratios in dhh1∆ vs. WT (F) for all mRNAs, all TE_up_dcp2Δ mRNAs, or the Dhh1-dependent or -independent subsets of the TE_up_dcp2Δ mRNAs.
-
Figure 6—source data 1
log2 fold-changes in TE observed in dcp2Δ, dhh1Δ, and dcp2Δdhh1Δ cells vs. WT cells for all transcripts, Dhh1-dependent TE_up_dcp2Δ, and Dhh1-independent TE_up_dcp2Δ transcript groups (Figure 6A, B).
- https://cdn.elifesciences.org/articles/85545/elife-85545-fig6-data1-v2.zip
Figure 6—figure supplement 1
Additional evidence that mRNAs exhibiting Dhh1-dependent translational repression by Dcp2 are preferentially targeted for decapping by Dcp2 and Dhh1.
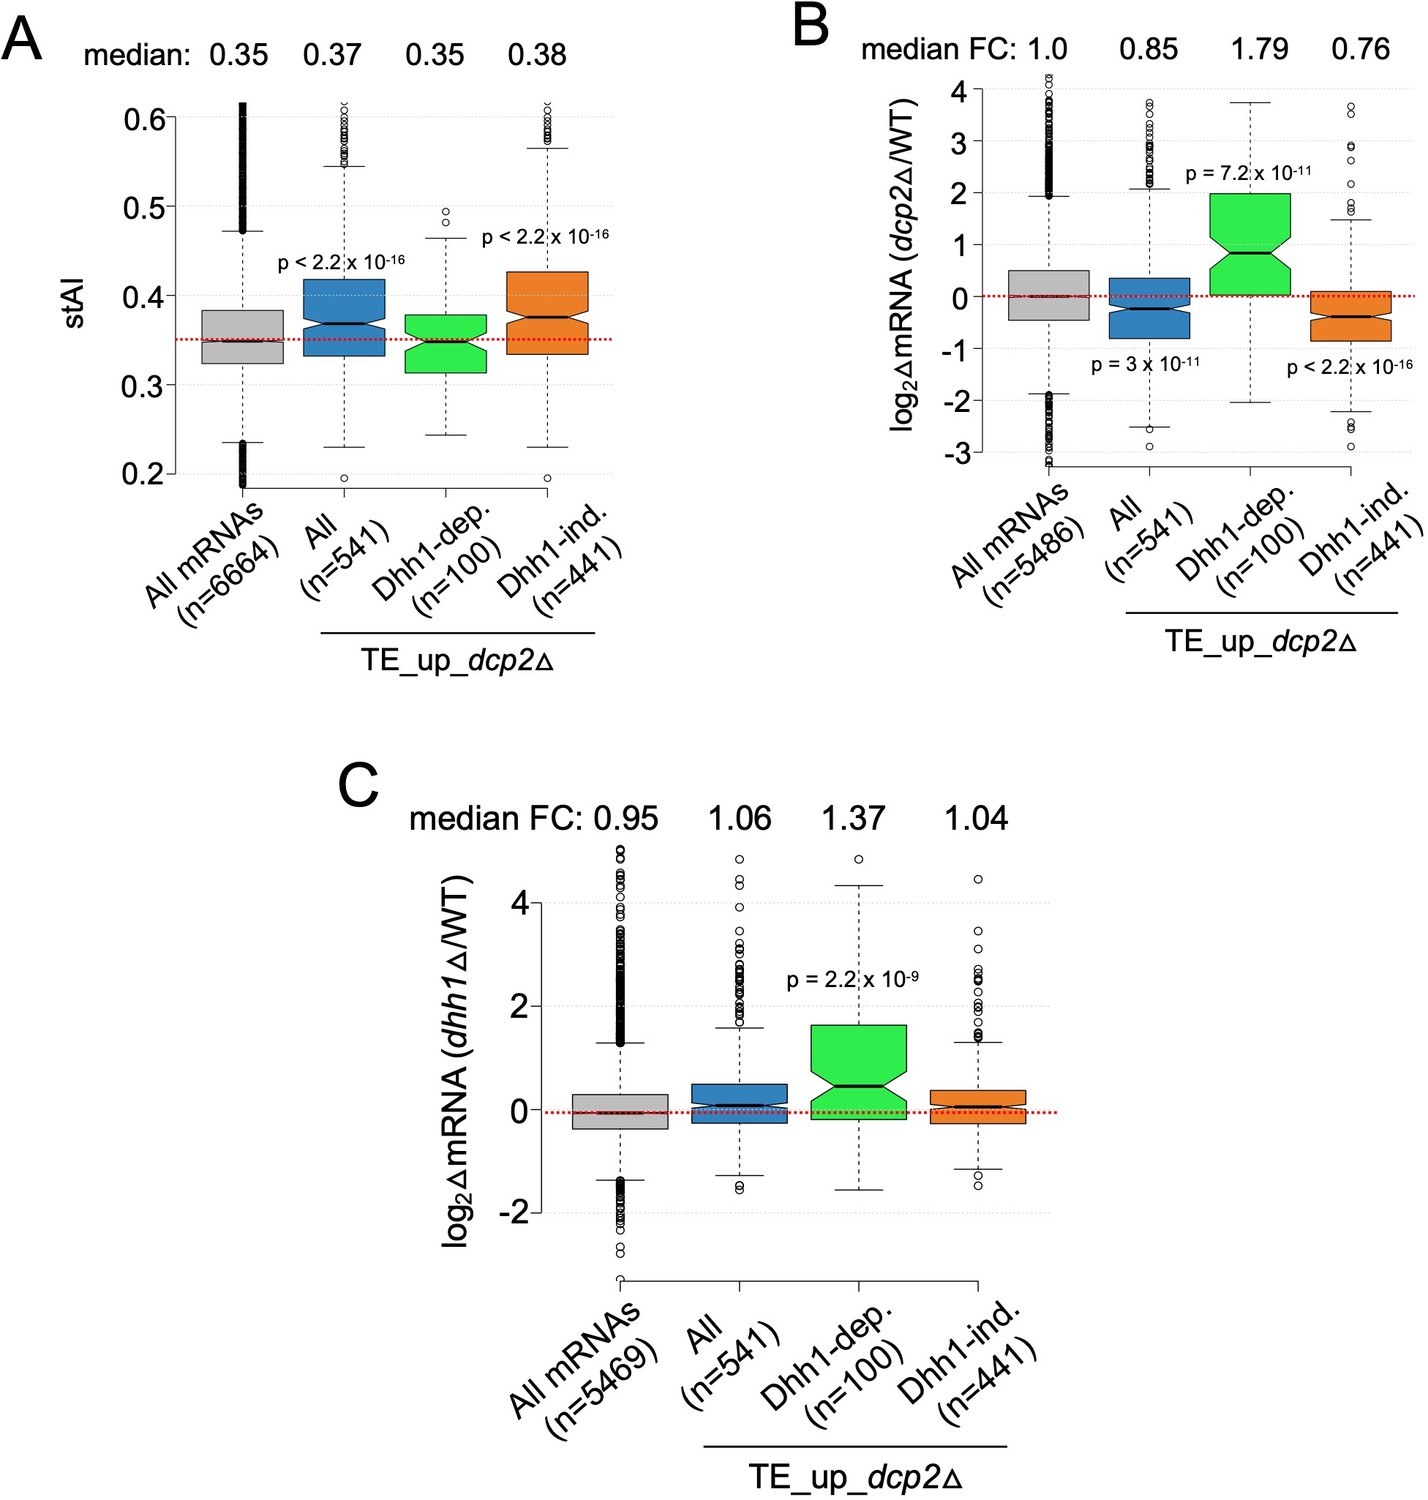
Notched box-plot of species-specific tRNA adaptation index (stAI) values (A), log2 fold-changes in mRNA abundance in dcp2Δ vs. WT (B), and log2 fold-changes in mRNA abundance in dhh1Δ vs. WT (C) for all mRNAs, all TE_up_dcp2Δ mRNAs, or the Dhh1-dependent or -independent subsets of the TE_up_dcp2Δ mRNAs.
Figure 7 with 3 supplements
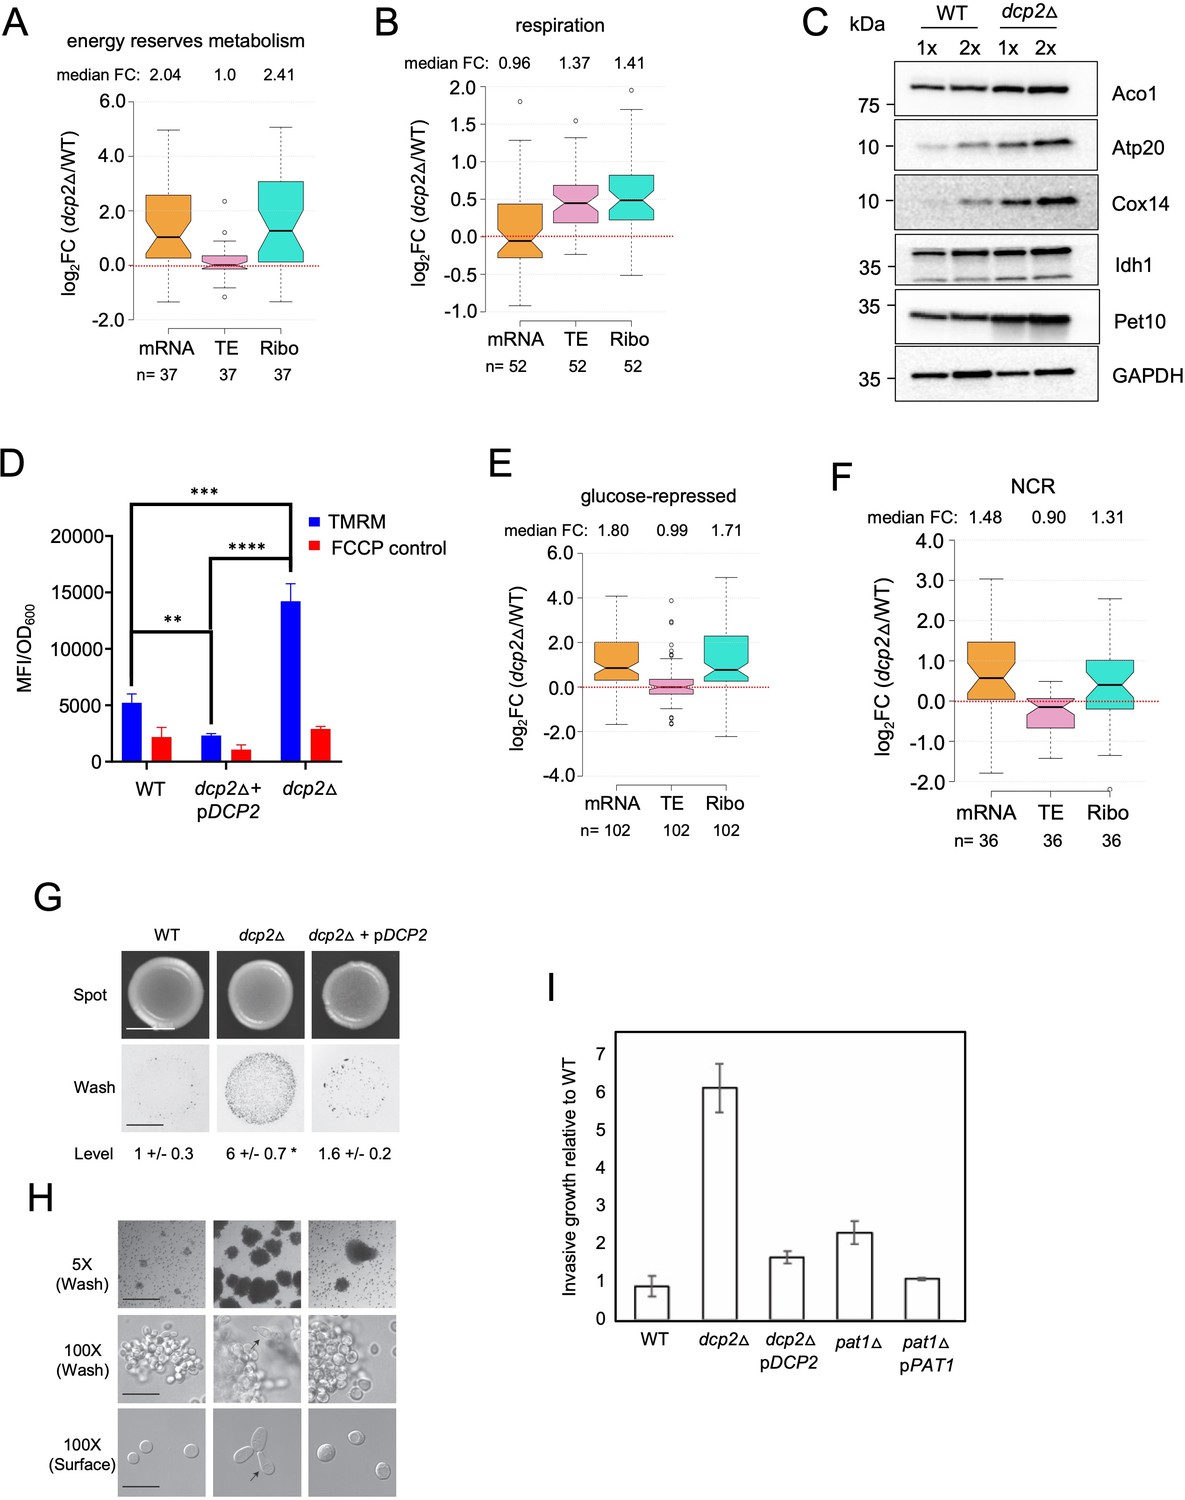
Dcp2 represses genes involved in respiration, catabolism of non-preferred carbon or nitrogen sources, or invasive growth, on rich medium (A, B, and E–H).
Notched box-plot showing log2 fold-changes in mRNA abundance, TE, or RPFs (Ribo) in dcp2Δ vs. WT cells for 37 genes involved in metabolism of energy reserves (identified by Kyto Encyclopedia of Genes and Genomes (KEGG) pathway analysis) (A), 52 genes encoding mitochondrial proteins with direct roles in OXPHOS (B), 102 genes subject to glucose repression or induced by Adr1 or Cat8 in low glucose (Young et al., 2003; Tachibana et al., 2005) (E), and 36 genes subject to nitrogen-catabolite repression (Godard et al., 2007) (F). (C) Western blot analyses of five mitochondrial proteins indicated on the right involved in respiration (and GAPDH examined as a loading control) in whole-cell extracts (WCEs) from WT or dcp2∆ cells, with adjacent lanes differing twofold in amount of extract. The postions of molecular weight markers are indicated to the left with masses in kilodaltons (kDa). Immune complexes were visualized using enhanced chemiluminescence. The results shown here are representative of three biological replicates that gave highly similar results, presented in the Figure 7—source data 3. (D) dcp2Δ confers increased mitochondrial ∆Ψm. Cells were cultured to mid-log phase. Tetramethylrhodamine (TMRM) (500 nM) was added and incubated for 30 min before samples were collected and washed once with deionized water. ∆Ψm was determined by measuring TMRM fluorescence intensity using flow cytometry. Data are presented in arbitrary fluorescence intensity units per OD600. Two-way analysis of variance (ANOVA) was used for statistical analysis and data are given as mean values ± standard deviation (SD; n = 3; **p < 0.01, ***p < 0.001, ****p < 0.0001). (G, H) dcp2Δ confers increased invasive growth. (E) The top and bottom panels show cells spotted on YPD agar medium and grown to confluence before or after washing under water, respectively, revealing increased invasive growth in the agar for the dcp2∆ strain compared to WT or the dcp2∆ strain complemented with WT DCP2 on a plasmid (pDCP2). The levels of invasive growth were quantified and indicated below the images. (F) The three panels show colony or cell morphology at 5× (after wash; Bar, 100 microns), 100× (after wash; Bar, 30 microns), and 100× (surface; Bar, 20 microns) magnification, respectively, for the strains analyzed in (E). (I) Fold-change in invasive growth in dcp2Δ, pat1Δ and respective complemented strains with WT copy of gene relative to WT cells. Error represents the SD. Significance was determined by Student’s t-test, p-value <0.05, n = 3.
-
Figure 7—source data 1
Gene ontology analysis conducted on the indicated sets of mRNAs showing increased or decreased mRNA abundance (A - D), TE (E - F), or RPF abundance (G - H) in dcp2∆ vs. WT cells.
Each panel lists the MIPS functional categories enriched among the genes encoding each group of transcripts, the p-value indicating the statistical significance of enrichment, the number of genes represented by the mRNAs in the set belonging to the functional category (k), and the total number of genes present in the functional group (f). The Bonferroni correction and a minimum p-value of 0.05 were applied.
- https://cdn.elifesciences.org/articles/85545/elife-85545-fig7-data1-v2.zip
-
Figure 7—source data 2
List of genes in each functional group analyzed.
Including glucose-repressed (119), NCR (41), metabolism of energy reserves (37), OXPHOS (60), glycosylation (56), sulfur metabolism (16), unfolded protein response (94), agglutinin (16), autophagy-related (26), and ribosomal protein (148) genes, with gene numbers in parenthesis (Figure 7A, B, E, F; Figure 7—figure supplement 1G-H; Figure 7—figure supplement 3A, C, D).
- https://cdn.elifesciences.org/articles/85545/elife-85545-fig7-data2-v2.zip
-
Figure 7—source data 3
Source data of western blot analyses of the expression of mitochondrial proteins, with GAPDH analyzed as loading control, for three biological replicates of dcp2Δ and WT strains (Figure 7C).
- https://cdn.elifesciences.org/articles/85545/elife-85545-fig7-data3-v2.zip
-
Figure 7—source data 4
Mitochondria membrane potential in WT vs. dcp2Δ cells measured for three biological replicates using flow cytometry of cells stained with tetramethylrhodamine (Figure 7D).
- https://cdn.elifesciences.org/articles/85545/elife-85545-fig7-data4-v2.zip
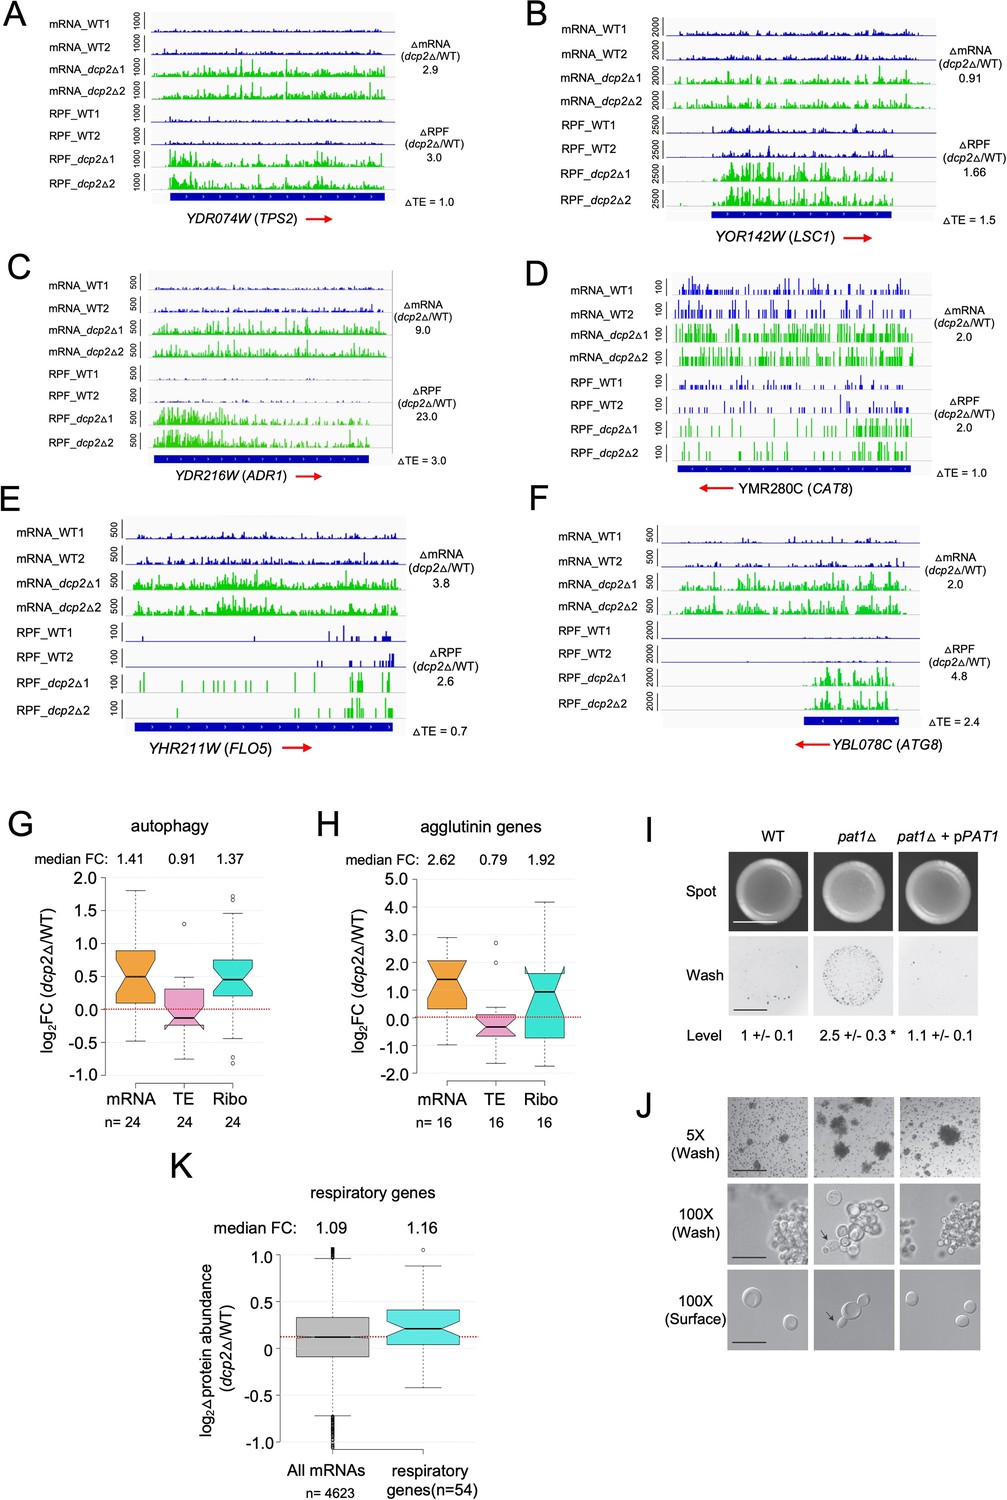
Figure 7—figure supplement 1
Supporting evidence that Dcp2 represses mRNA abundance, TE, or both properties of genes involved in different pathways not required for growth on rich medium.
IGV depictions of TPS2 (A), LSC1 (B), ADR1 (C), CAT8 (D), FLO5 (E), and ATG8 (F) showing increased mRNA and RPF abundance in dcp2Δ vs. WT cells, as described in Figure 4G. Notched box-plots showing log2 fold-changes in mRNA, TE or RPFs (Ribo) in dcp2Δ vs. WT cells for 24 autophagy-related genes (ATG) involved in autophagy (G) or 16 agglutinins that function in cell adhesion (H). (I, J) Increased invasive growth observed for pat1Δ vs. WT cells, as described in Figure 7G, H. (K) Notched box-plot of log2 fold-changes in protein abundance determined by TMT-MS/MS in dcp2Δ vs. WT cells for all genes or 54 genes encoding mitochondrial proteins with direct roles in oxidative phosphorylation.
Figure 7—figure supplement 2
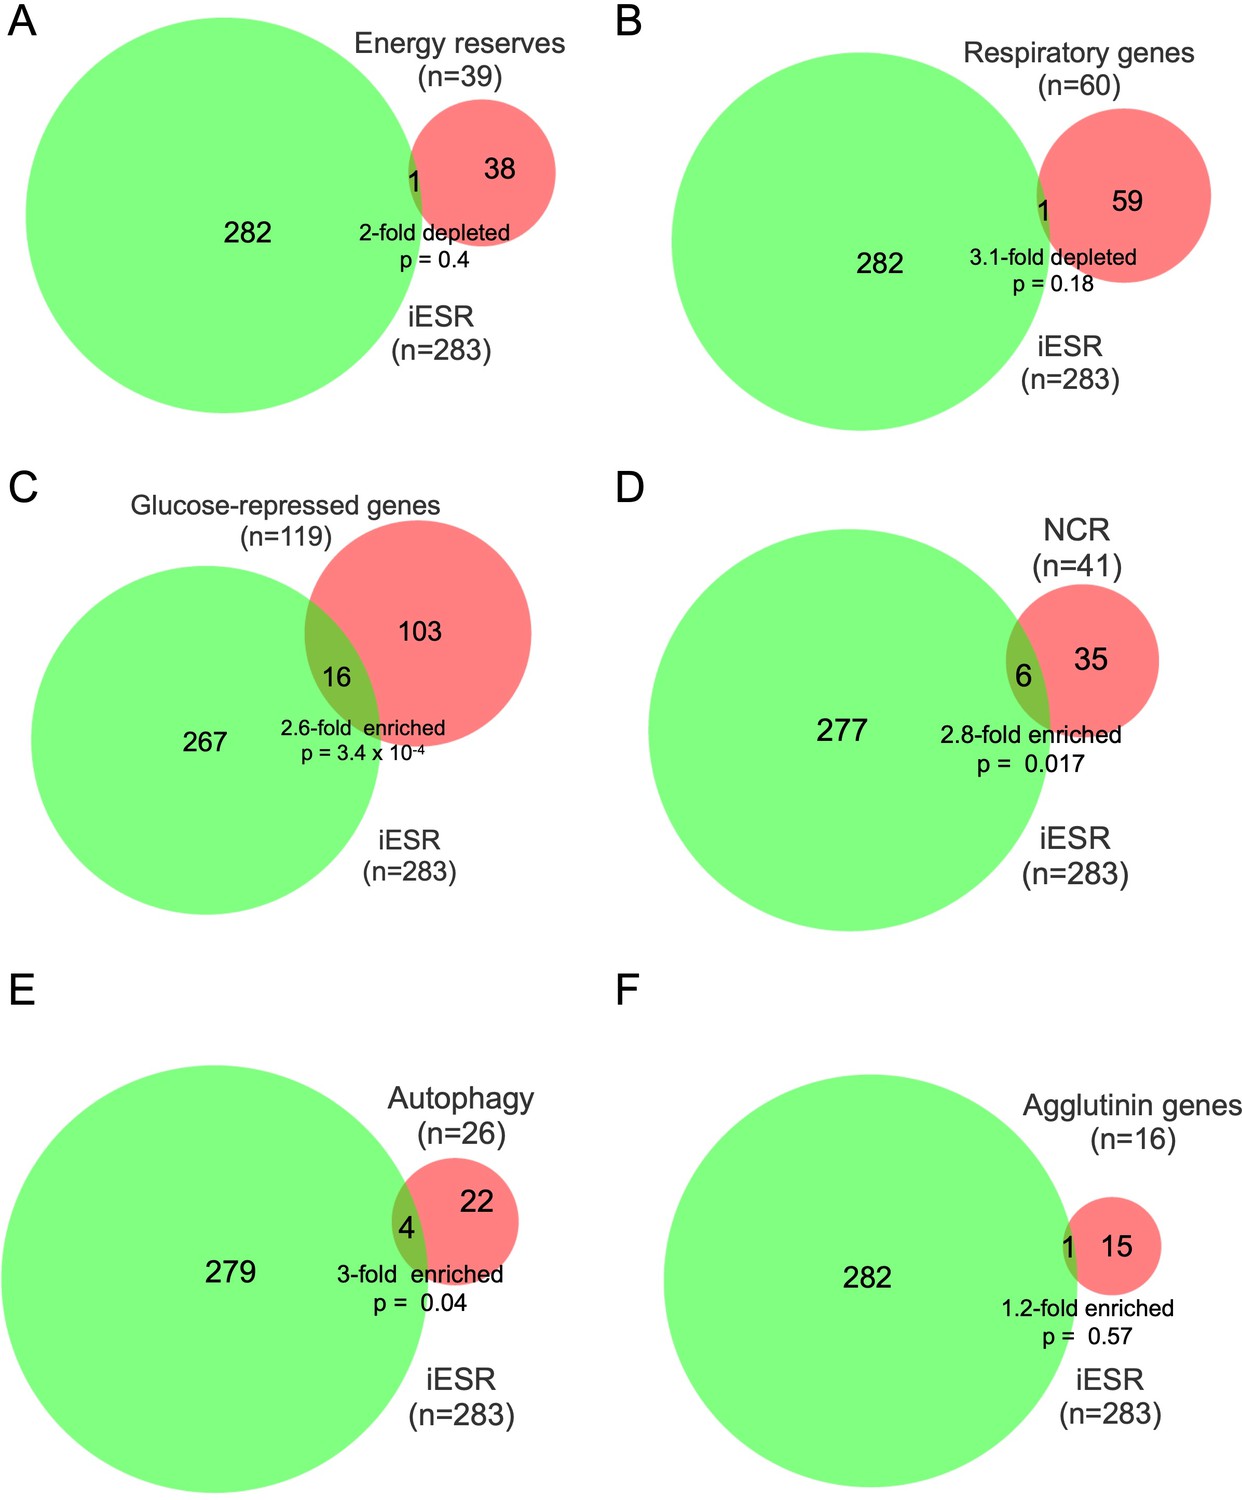
Overlap between iESR genes and genes in various pathways exhibiting up-regulation of mRNA abundance or TE in dcp2∆ vs. WT cells on YPD medium.
Overlap between the 283 iESR genes and the indicated groups comprised of all genes involved in metabolism of energy reserves (A), encoding mitochondrial proteins with direct roles in oxidative phosphorylation (B), glucose-repressed or induced by Adr1 or Cat8 (C), nitrogen-catabolite repressed (D), encoding proteins with direct roles in autophagy (E), or encoding agglutinins that function in cell adhesion (F). The number of genes in each group is indicated (n) as is the p-value of the overlap from the hypergeometric distribution.
Figure 7—figure supplement 3
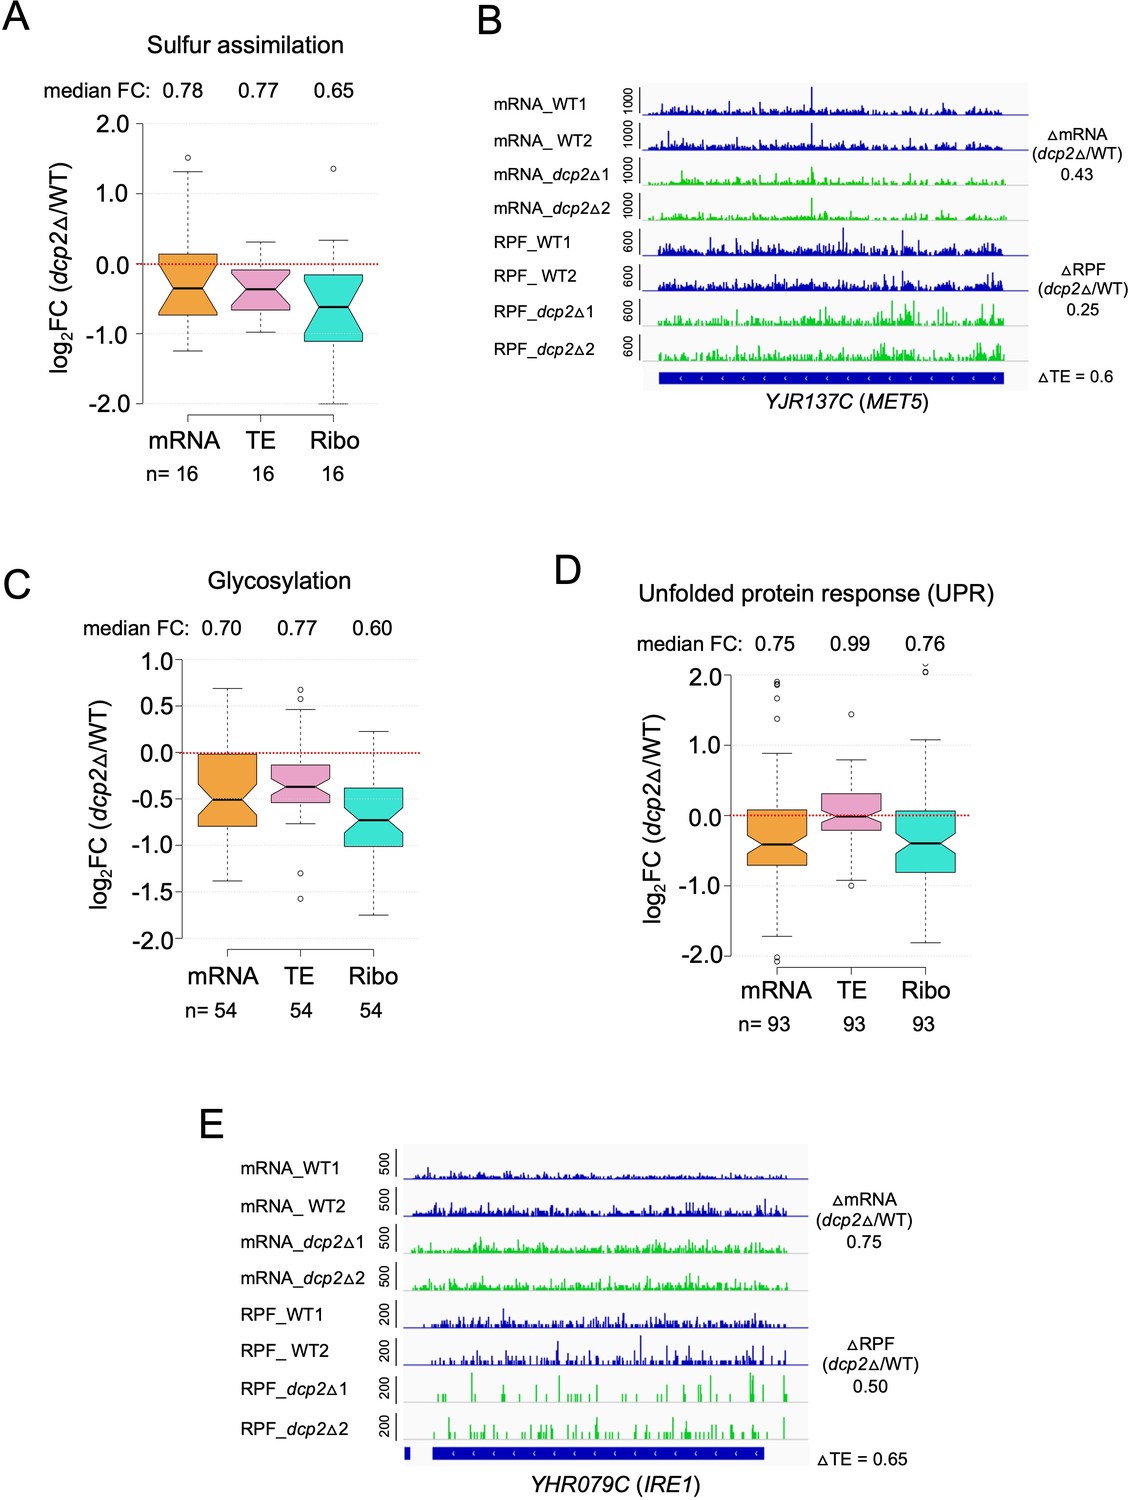
Evidence that dcp2∆ reduces mRNA abundance or TE of genes involved in protein glycosylation, sulfur assimilation, or the unfolded protein response on rich medium (A, C, D).
Notched box-plots showing log2 fold-changes in mRNA abundance, TE or RPFs (Ribo) in dcp2Δ vs.WT cells for genes involved in protein sulphur assimilation (A), glycosylation (C), or unfolded protein response (D). The total genes for each functional groups were obtained from KEGG pathway maps for Saccharomyces cerevisiae. (B, E) IGV tracks for exemplar genes MET5 and IRE1 showing decreased mRNA or RPF abundance in dcp2Δ vs. WT cells.
Figure 8 with 3 supplements
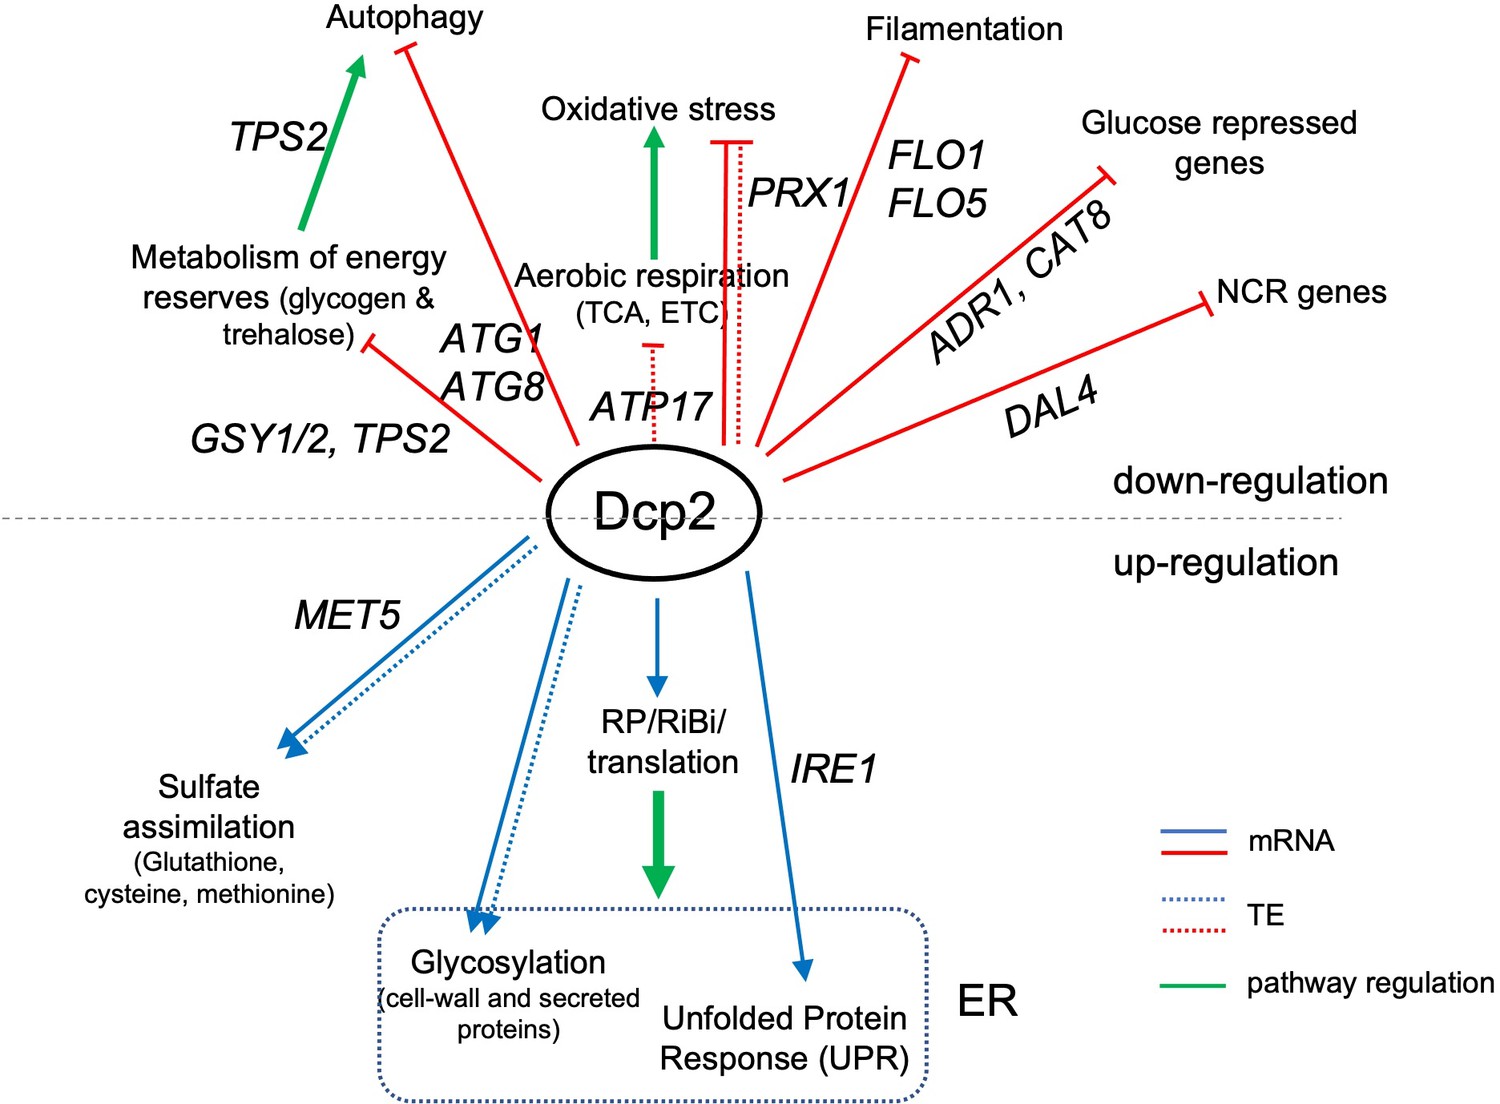
Summary of genes and pathways regulated directly or indirectly by Dcp2.
Categories above the black dotted line are genes or pathways down-regulated by Dcp2 while those at the bottom are up-regulated in WT cells grown on rich medium. Straight and dotted lines represent changes in mRNA abundance and TE, respectively. Green arrows indicate pathway regulation. Important genes in each functional category are shown. ER, endoplasmic reticulum.
Figure 8—figure supplement 1
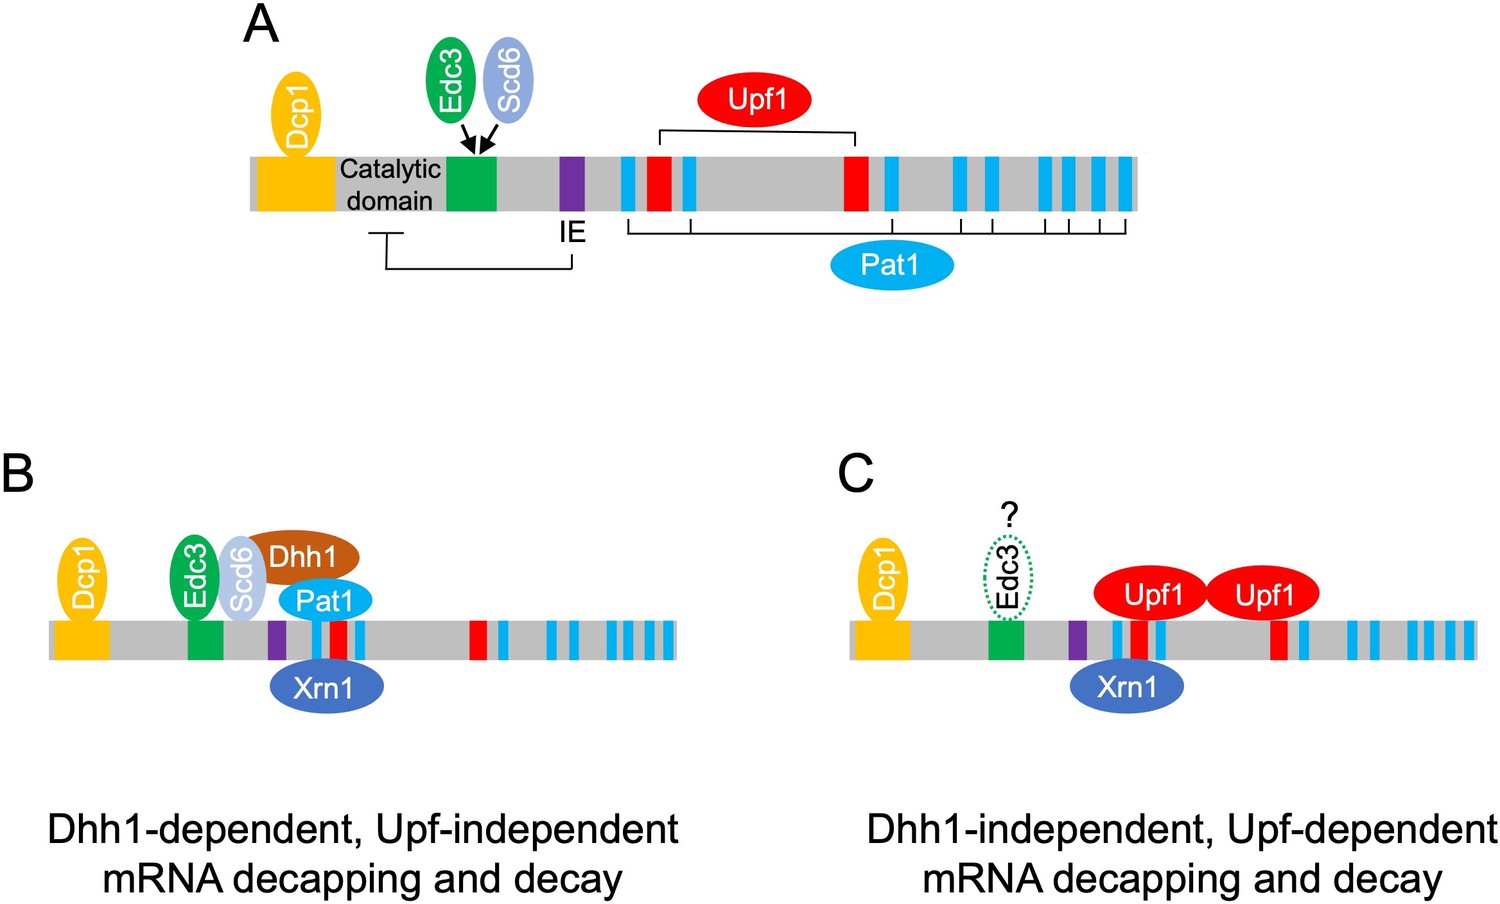
Model depicting different decapping complexes targeting the Dhh1-dependent and -independent subsets of mRNAs repressed in abundance by Dcp1/Dcp2.
(A) Schematic showing distinct regulatory modules in Dcp2 adapted from He et al., 2022: yellow, Dcp1-binding site; green, Edc3/Scd6-binding site; IE/purple, autoinhibitory element; blue, Pat1-binding motifs; red, Upf1-binding sites. (B) Dhh1, Pat1, Scd6, and Edc3 form a complex with Dcp1/Dcp2 and Xrn1 to mediate decapping and 5′ to 3′ decay of Dhh1-dependent transcripts. Some of these mRNAs might be targeted by complexes containing Pat1 but lacking Dhh1 as suggested by He et al., 2022. (C) Upf1 forms a complex with Dcp1:Dcp2 and Xrn1 to mediate decapping and 5′ to 3′ decay of the NMD substrates that comprise most of the Dhh1-independent transcripts. Edc3 might be bound to these complexes, as suggested by He et al., 2022, but generally appears to be dispensable for degradation of the Dhh1-independent Dcp2-targeted transcripts.
Figure 8—figure supplement 2
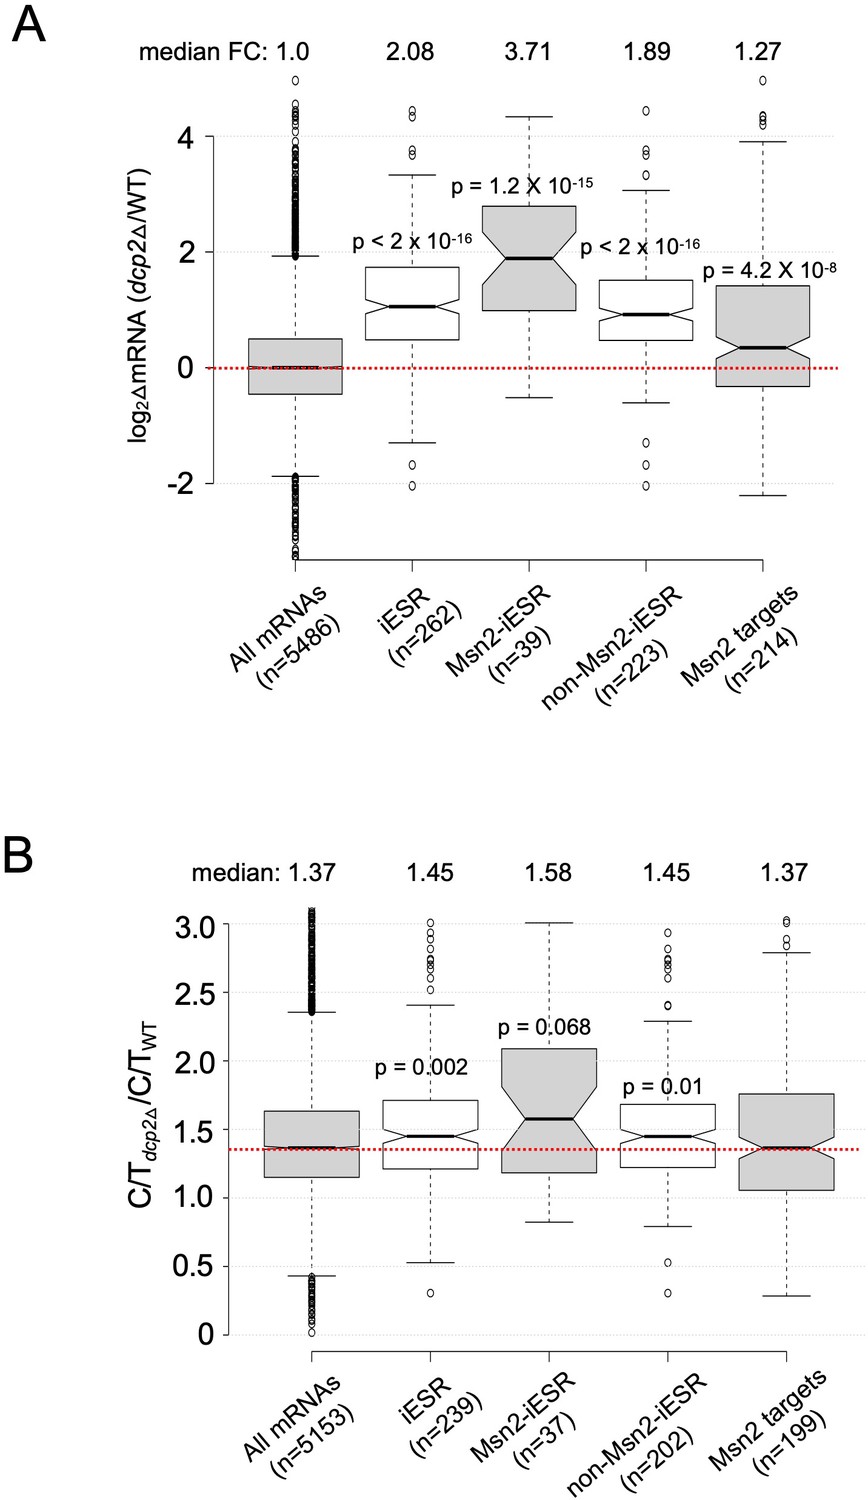
Evidence that decapping by Dcp2 contributes to the iESR.
Notched box-plots showing log2 fold-changes in relative mRNA abundance (A) and the change in C/T ratios (B) in dcp2∆ vs. WT cells for all mRNAs, iESR transcripts, iESR mRNAs found to bind Msn2 in their promoter regions by ChIP-Seq analysis following a shift from glucose to glycerol as carbon source (Elfving et al., 2014), the remaining iESR genes lacking detectable Msn2 binding, and all genes shown by ChIP-Seq to bind Msn2.
-
Figure 8—figure supplement 2—source data 1
Lists of transcripts for iESR, Msn2-iESR, non-Msn2-iESR, and Msn2-target genes (Figure 8—figure supplement 1A, B).
- https://cdn.elifesciences.org/articles/85545/elife-85545-fig8-figsupp2-data1-v2.zip
Figure 8—figure supplement 3

Dcp2 primarily represses the translation but not abundance of a group of high-confidence Puf3-repressed mRNAs highly enriched for mitochondrial proteins.
Notched box-plots showing log2 fold-changes in mRNA abundance, TE, RPFs (Ribo), or steady-state protein levels (determined by TMT-MS) in dcp2Δ vs. WT cells for a group of 91 mRNAs that bind Puf3 and show increased protein expression in puf3∆ vs. WT cells, of which 86 function in mitochondria, dubbed Puf3 ‘cis’ targets by Lapointe et al., 2018.
-
Figure 8—figure supplement 3—source data 1
Mitochondrial protein mRNAs that bind to Puf3 and also exhibit increased expression of the encoded proteins in puf3∆ cells (Puf3 ‘cis’ targets) (Figure 8—figure supplement 3).
- https://cdn.elifesciences.org/articles/85545/elife-85545-fig8-figsupp3-data1-v2.zip
Tables
Key resources table
| Reagent type (species) or resource | Designation | Source or reference | Identifiers | Additional information |
|---|---|---|---|---|
| Chemical compound, drug | Cycloheximide | Sigma | Cat # C7698 | |
| Chemical compound, drug | 5-Fluoro-orotic acid | USBiological | Cat # F5050 | |
| Commercial assay or kit | NEBuilder HiFi DNA assembly | New England Biolabs | Cat # E2621S | |
| Commercial assay or kit | RNase I | Ambion | Cat # AM2294 | |
| Commercial assay or kit | RNA Clean and Concentrator kit | Zymo | Cat # R1018 | |
| Commercial assay or kit | T4 Polynucleotide kinase | New England Biolabs | Cat # M0201L | |
| Commercial assay or kit | T4 Rnl2(tr) K227Q | New England Biolabs | Cat # M0351S | |
| Commercial assay or kit | 5′ deadenylase/RecJ exonuclease | Epicentre | Cat # RJ411250 | |
| Commercial assay or kit | Oligo Clean and Concentrator column | Zymo Research | Cat # D4060 | |
| Commercial assay or kit | Protoscript II | New England Biolabs | Cat # M0368L | |
| Commercial assay or kit | CircLigase ssDNA Ligase | Epicenter | Cat # CL4111K | |
| Commercial assay or kit | Phusion polymerase | New England Biolabs | Cat # M0530S | |
| Commercial assay or kit | High Sensitivity DNA Kit | Agilent | Cat # 5067-4626 | |
| Commercial assay or kit | Fragmentation Reagent | Ambion | Cat # AM8740 | |
| Commercial assay or kit | Stop Solution | Ambion | Cat # AM8740 | |
| Commercial assay or kit | Ribo-Zero Gold rRNA Removal Kit | Illumina | Cat # MRZ11124C | |
| Commercial assay or kit | RNA 6000 Nano kit | Agilent | Cat # 5067-1511 | |
| Commercial assay or kit | ERCC ExFold RNA spike-In Mixes | Ambion | Cat # 4456739 | |
| Commercial assay or kit | DNA Library Prep Kit | New England Biolabs | Cat # E7370L | |
| Commercial assay or kit | DNase I | Roche | Cat # 4716728001 | |
| Commercial assay or kit | Luciferase Control RNA | Promega | Cat # L4561 | |
| Commercial assay or kit | Superscript III First-Strand synthesis kit | Invitrogen | Cat # 18080051 | |
| Commercial assay or kit | Brilliant II SYBR Green qPCR Master Mix | Agilent | Cat # 600828 | |
| Commercial assay or kit | 25 mM triethylammonium-bicarbonate | Thermo Scientific | Cat # 90114 | |
| Commercial assay or kit | GelCode Blue Stain | Thermo Scientific | Cat # 24592 | |
| Commercial assay or kit | Pierce BCA Protein Assay Kit | Thermo Scientific | Cat # 23225 | |
| Commercial assay or kit | Protease inhibitor cocktail | Roche | Cat # 5056489001 | |
| Commercial assay or kit | Enhanced chemiluminescence (ECL) | Cytiva | Cat # RPN2109 | |
| Commercial assay or kit | Nano-Glo substrate | Promega | Cat # N1120 | |
| Commercial assay or kit | Bradford reagent | Bio-Rad | Cat # 5000006 | |
| Antibody | anti-Idh1 (Goat polyclonal) | Abnova | Cat # PAB19472 | Dilution: 1:500 (WB) |
| Antibody | anti-GAPDH (Mouse monoclonal) | Proteintech | Cat # 60004 | Dilution: 1:30,000 (WB) |
| Antibody | anti-rabbit IgG (HRP-conjugated, donkey polyclonal) | GE | Cat # NA9340V | Dilution: 1:10,000 (WB) |
| Antibody | anti-mouse IgG (HRP-conjugated, sheep polyclonal) | GE | Cat # NA931V | Dilution: 1:10,000 (WB) |
| Antibody | anti-goat IgG (HRP-conjugated, chicken polyclonal) | Abnova | Cat # PAB29101 | Dilution: 1:10,000 (WB) |
| Antibody | anti-Rpb1 (Mouse monoclonal) | 8WG16, Biolegend | Cat # 664906 | 4 µl used in Rpb1-ChIP |
| Strain, strain background (Saccharomyces cerevisiae) | Supplementary file 1a | This paper | Strains used | |
| Genetic reagent (plasmid) | Supplementary file 1b | This paper | Plasmids used | |
| Sequence-based reagent | Supplementary file 1c | This paper | Primers used | |
| Sequence-based reagent | Supplementary file 1d | This paper | nLUC reporter genes | |
| Sequence-based reagent | Supplementary file 1e | This paper | nLUC CDS | |
| Software, algorithm | Notched box-plots | http://shiny.chemgrid.org/boxplotr/ | ||
| Software, algorithm | Venn diagrams | https://www.biovenn.nl/ | ||
| Software, algorithm | Hypergeometric distribution | https://systems.crump.ucla.edu/hypergeometric/index.php | ||
| Software, algorithm | Volcano plots | https://huygens.science.uva.nl/VolcaNoseR/ | ||
| Software, algorithm | Gene ontology (GO) | http://funspec.med.utoronto.ca/ | ||
| Software, algorithm | DESeq2 | https://github.com/hzhanghenry/RiboProR | ||
| Software, algorithm | Integrative Genomics Viewer | IGV 2.4.14, http://software.broadinstitute.org/software/igv/ | ||
| Software, algorithm | Genome-wide occupancy profiles for Rpb1 (ChIP) | https://github.com/hzhanghenry/OccProR | ||
| Software, algorithm | Image Lab 6.0.1 program | https://www.bio-rad.com/en-us/product/image-lab-software?ID=KRE6P5E8Z | ||
| Software, algorithm | SwissProt Yeast database | https://www.uniprot.org/proteomes/UP000002311 | ||
| Software, algorithm | Proteome Discoverer 2.4 | Thermo Scientific |
Additional files
-
Supplementary file 1
The yeast strains, plasmids, and primers employed in this study are listed in files 1a, 1b, and 1c, respectively.
File 1d contains details of the nLUC reporter genes. File 1d contains the nLUC CDS codon optimized for S. cerevisiae.
- https://cdn.elifesciences.org/articles/85545/elife-85545-supp1-v2.docx
-
MDAR checklist
- https://cdn.elifesciences.org/articles/85545/elife-85545-mdarchecklist1-v2.pdf
Download links
A two-part list of links to download the article, or parts of the article, in various formats.
Downloads (link to download the article as PDF)
Open citations (links to open the citations from this article in various online reference manager services)
Cite this article (links to download the citations from this article in formats compatible with various reference manager tools)
Decapping factor Dcp2 controls mRNA abundance and translation to adjust metabolism and filamentation to nutrient availability
eLife 12:e85545.
https://doi.org/10.7554/eLife.85545


