Medullary tachykinin precursor 1 neurons promote rhythmic breathing
- Keenan Research Centre for Biomedical Sciences. St. Michael’s Hospital, Unity Health Toronto, Canada
- Department of Physiology, Faculty of Medicine, University of Toronto, Canada
- Department of Medicine, Faculty of Medicine, University of Toronto, Canada
Figures
Figure 1 with 2 supplements
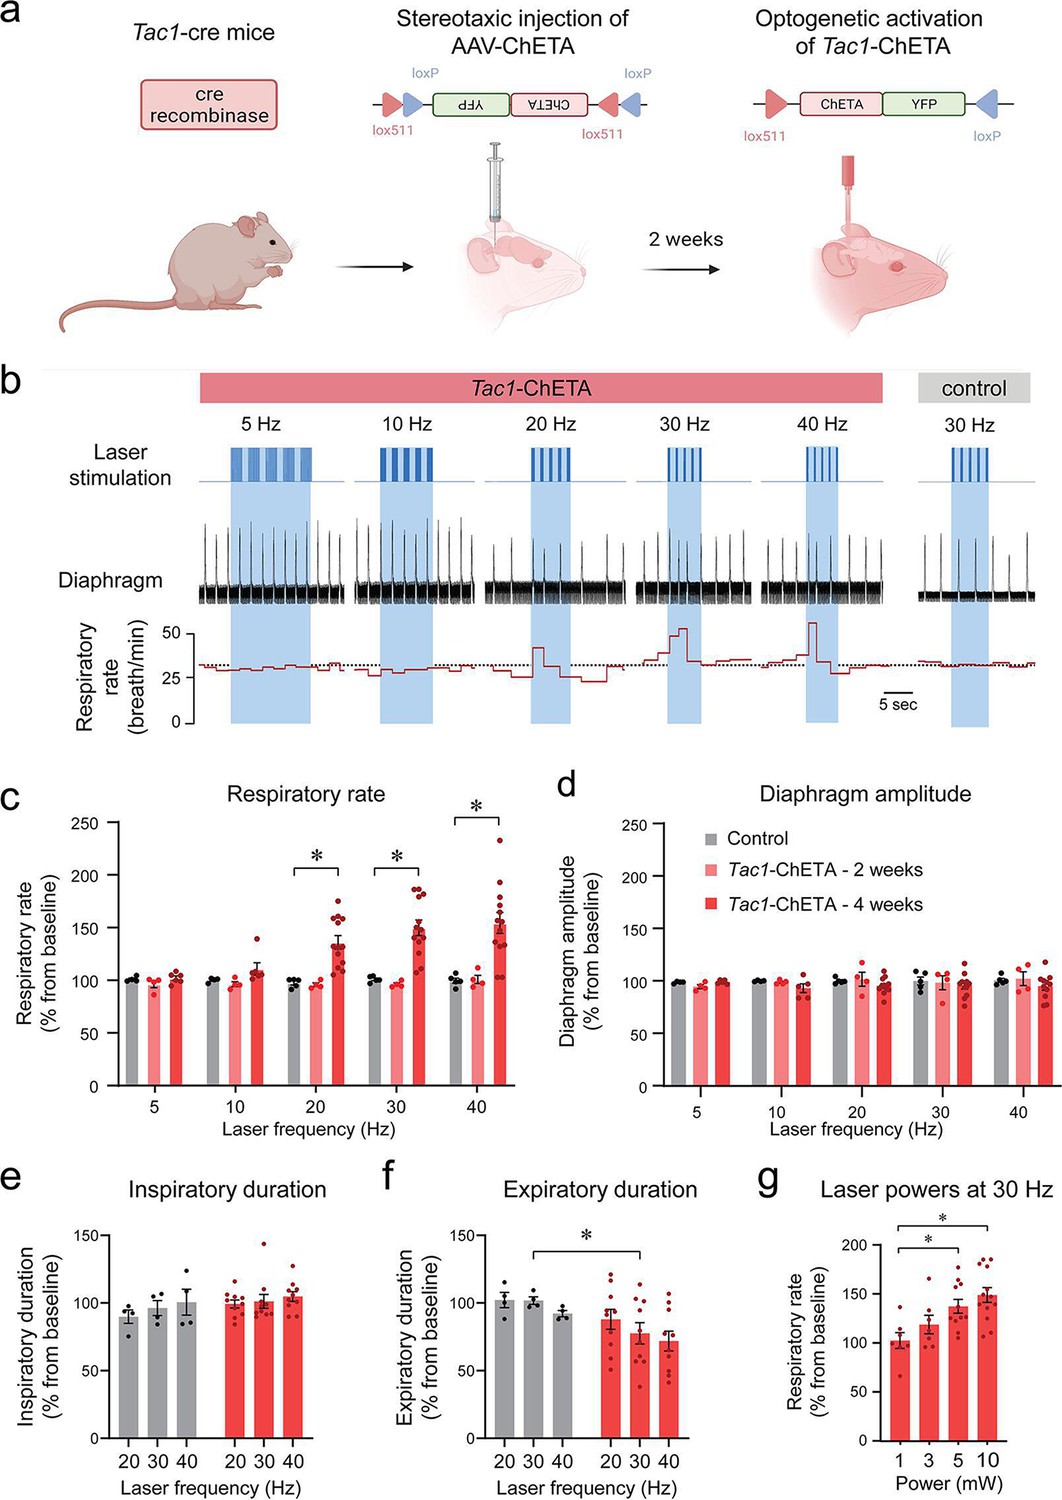
Photostimulation of tachykinin precursor 1 (Tac1) preBötzinger Complex (preBötC) cells increases the respiratory rate in anesthetized mice.
(a) ChETA was expressed in Tac1 preBötC cells by injecting the AAV-ChETAfl/fl virus in Tac1 cre-expressing mice. (b) After 2 or 4 weeks of incubation, laser stimulations were performed at various frequencies in control and Tac1-ChETA anesthetized mice. (c) Laser stimulation increased respiratory rate at 20, 30, and 40 Hz. Increased rate following photostimulation of Tac1 cells was only observed after 4 weeks of incubation, but not 2 weeks (n=25). (d) No effect was observed on diaphragm amplitude (n=25). (e) Laser stimulation had no effect on inspiratory duration, but (f) significantly decreased expiratory duration at 30 Hz (n=14). (g) Laser powers stimulated respiratory rate at 5 and 10 mW (n=38). Data are presented as means ± SEM, with individual data points. * indicate means significantly different from corresponding controls or laser powers with p<0.05. Panel (a) was created using Biorender.com.
-
Figure 1—source data 1
Raw data of respiratory rate in Tac1-ChETA 2 weeks post-injection.
- https://cdn.elifesciences.org/articles/85575/elife-85575-fig1-data1-v2.xlsx
Figure 1—figure supplement 1
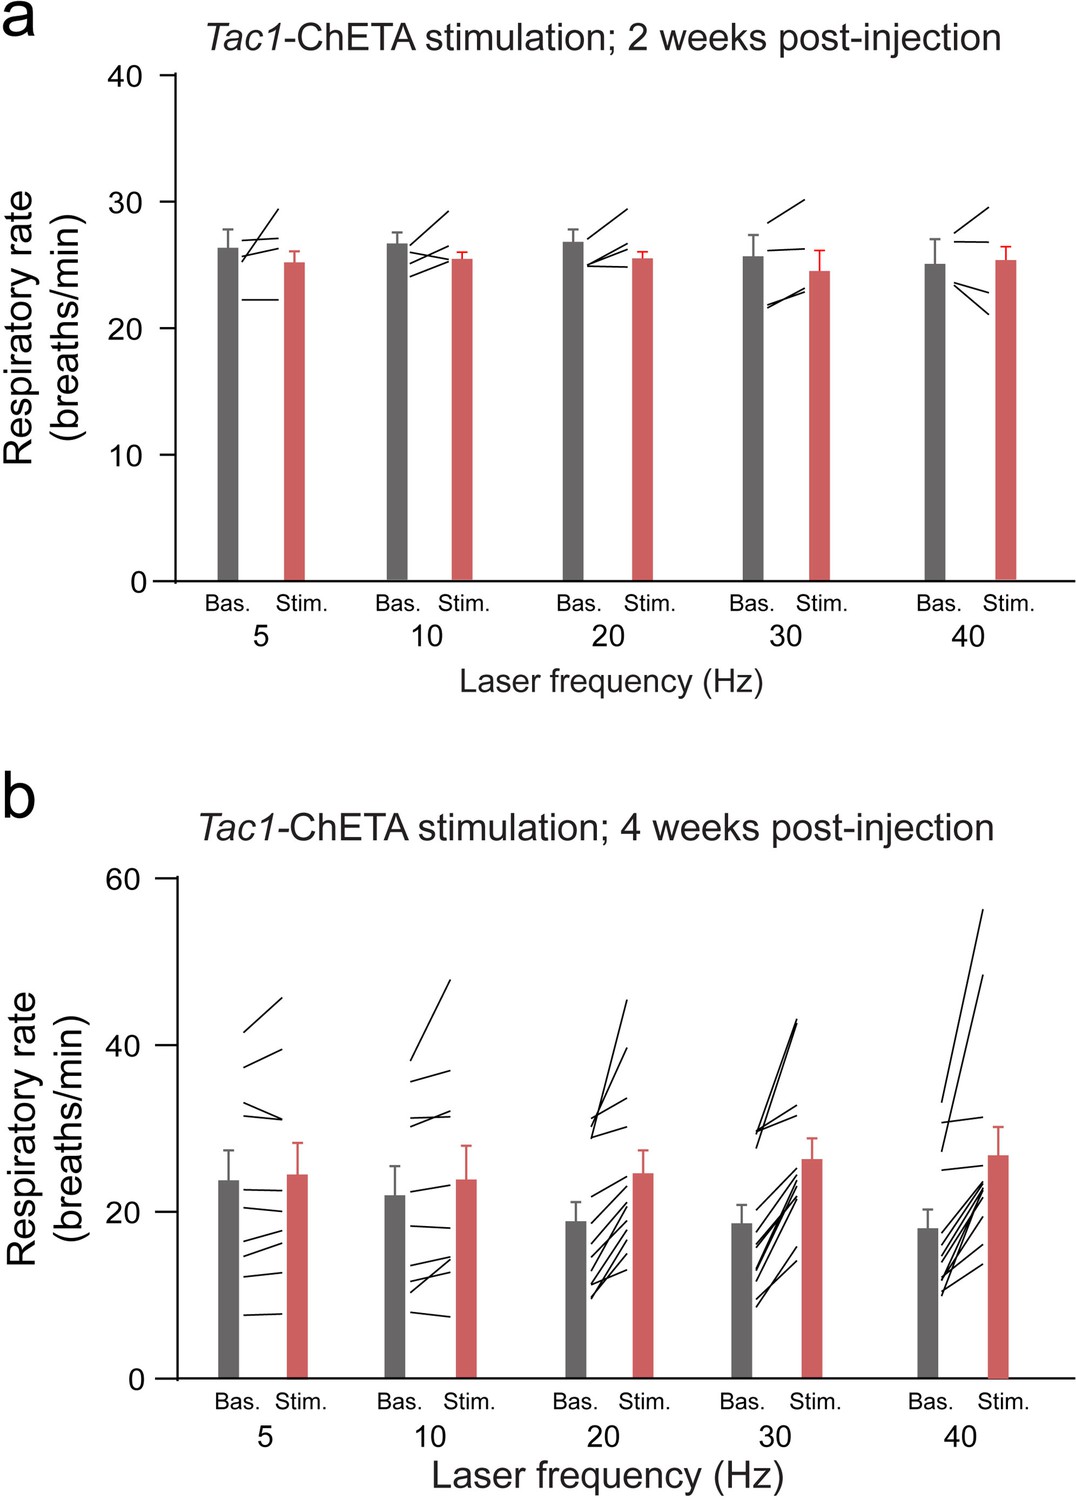
Optogenetic stimulation of tachykinin precursor 1 (Tac1) preBötzinger Complex (preBötC) cells in anesthetized mice at 2- and 4 week post-injection.
(a) Mean respiratory rate (breaths/min) before (Baseline) and during laser Stimulation in Tac1-ChETA mice 2 weeks following virus injection (laser stimulation effect: p=0.4403, n=8; F(1, 6)=0.6825). Laser stimulations were performed at 5, 10, 20, 30, and 40 Hz. (b) Respiratory rate were also measured 4 weeks following virus injection in Tac1-ChETA mice (laser stimulation effect: p = 0.1497, n=30; F(1, 28)=2.194). Laser stimulations were performed at 5, 10, 20, 30, and 40 Hz. Bars represent means ± SEM, with individual data values indicated as lines.
-
Figure 1—figure supplement 1—source data 1
- https://cdn.elifesciences.org/articles/85575/elife-85575-fig1-figsupp1-data1-v2.xlsx
Figure 1—figure supplement 2
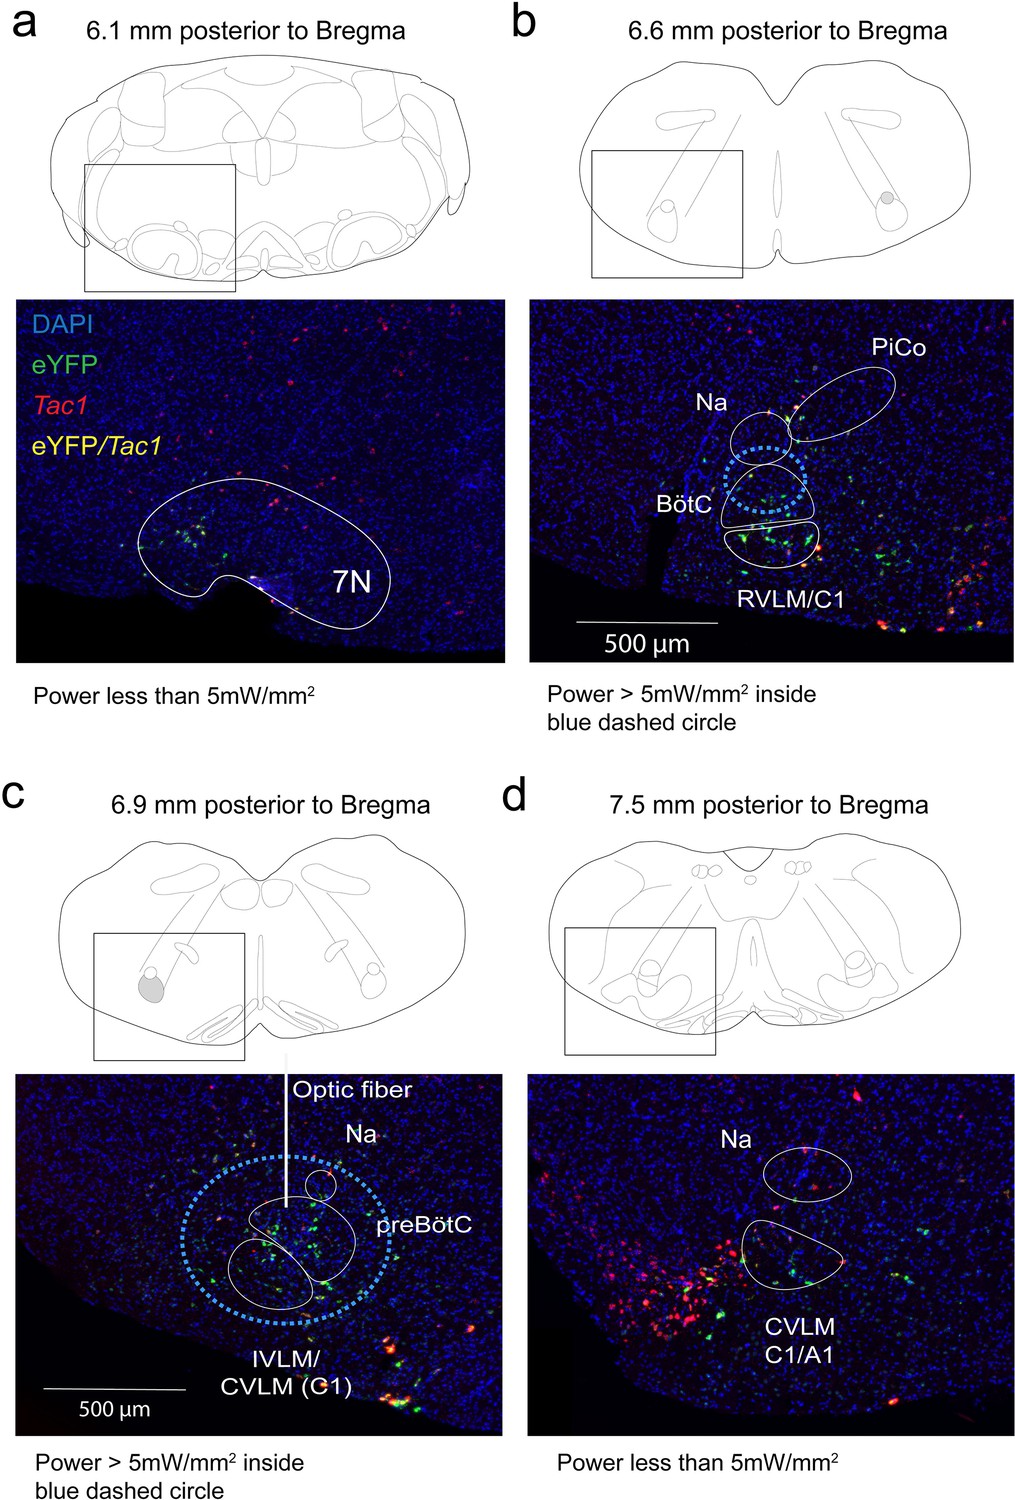
Rostrocaudal distribution of the virally transduced expression of ChETA-eYFP in tachykinin precursor 1 (Tac1) neurons in the respiratory network.
Illustrations of the mouse brainstem including approximative position of optic fiber and depiction of the light spread across tissue. Using a 3D Monte Carlo simulation platform designed by Liu and colleagues (Liu et al., 2015), we identified blue circle regions of the brain where power is >5 mW/mm2 when the power at the tip of the optical fiber is 5 mW. Power is >5 mW/mm2 inside a sphere centered at the tip of the optical fiber with the following dimensions ventral = 470 µm, dorsal = 230 µm, lateral = 400 µm, caudal = 470 µm, and rostral = 470 µm. (a) Rostral section including the facial nucleus (7 n). In the 7 n, expression of ChETA-eYFP can be found, but these transfected cells are out of reach of the laser. (b) Rostral medullary sections of the brainstem with eYFP (ChETA, green) and Tac1 neurons (red) including the Bötzinger Complex and the rostral ventrolateral medulla (RVLM). Some Tac1 neurons of the Bötzinger Complex contain ChETA and are located within the circle of power 1 mW/mm2. (c) In a section located in the region of the preBötC, Tac1-ChETA co-expression was observed in the preBötC and the CVLM. (d) In caudal section, Tac1-ChETA co-expression was found in the CVLM but outside the effective range of the laser. DAPI (blue) was used to define the brain structures as reference. 7 N: facial nucleus, preBötC: preBötzinger Complex, Na: nucleus ambiguus, RVLM; rostro-ventral lateral medulla. CVLM, caudal-ventro-lateral medulla. C1A1, area C1A1.
Figure 2 with 1 supplement
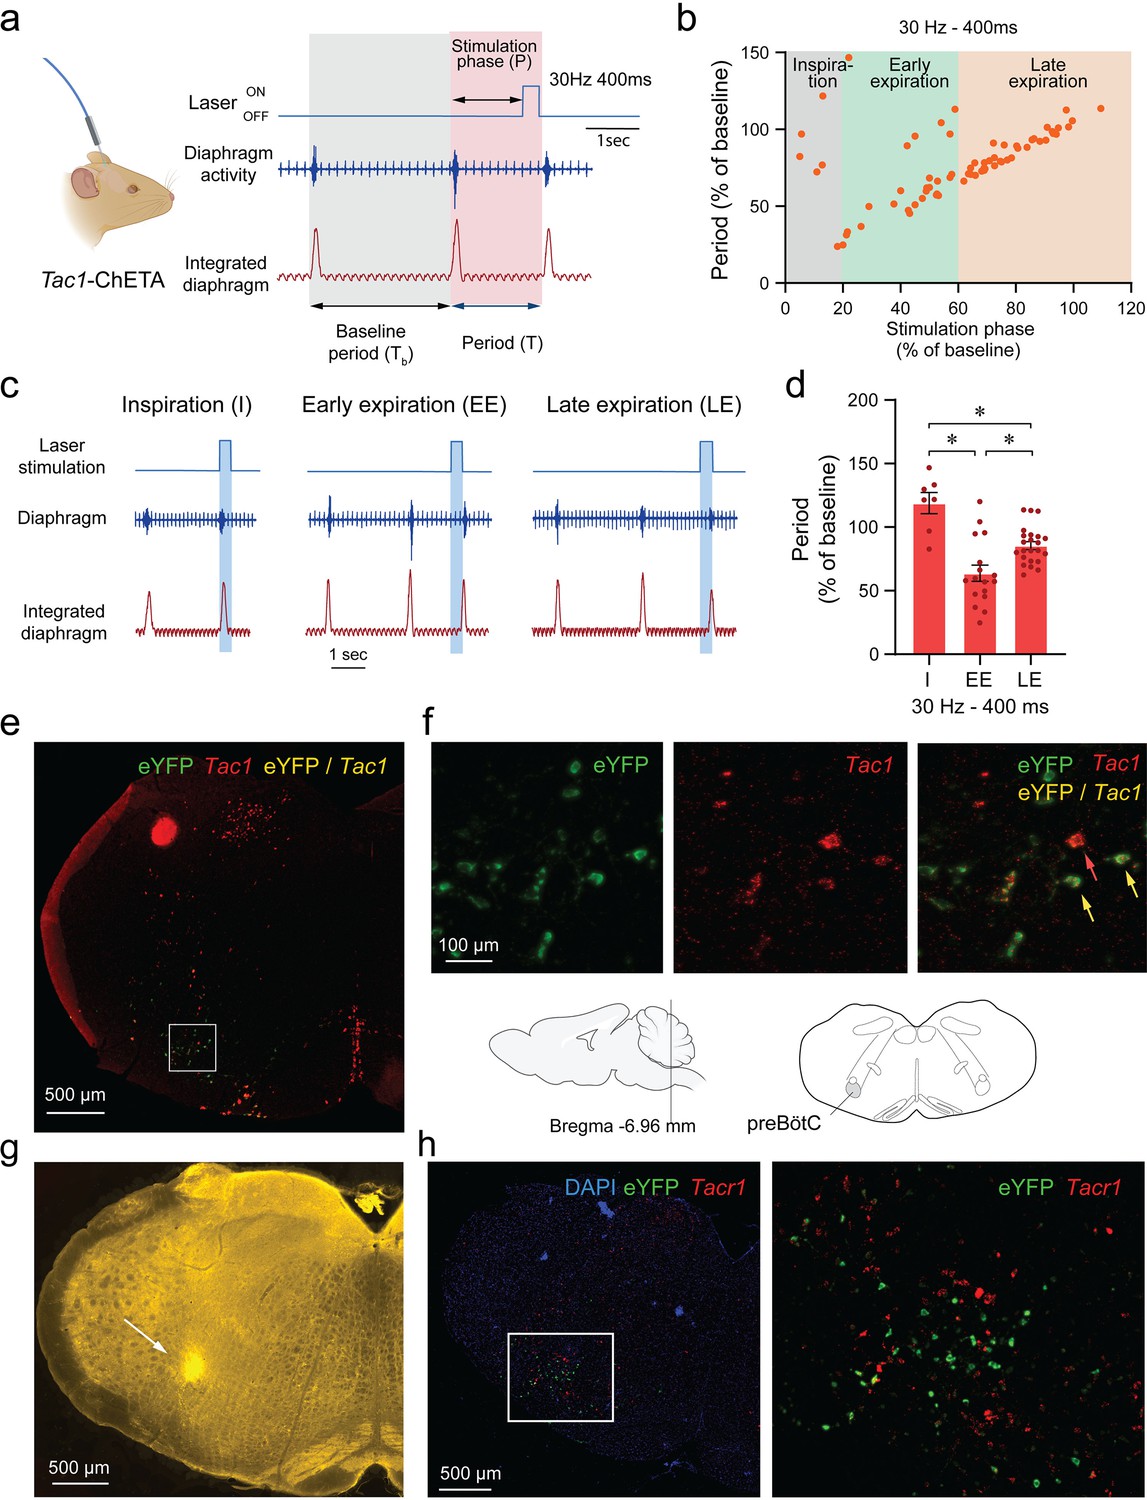
Phase-dependent photostimulation of tachykinin precursor 1 (Tac1) preBötzinger Complex (preBötC) cells.
(a) For each laser stimulation, the stimulation phase (i.e. the duration between the beginning of inspiration and the onset of the laser), the induced period (T), and the baseline period (Tb) were measured. All stimulation phases and induced periods were normalized to the preceding unstimulated respiratory cycle (Tb) and presented as a percentage of Tb. (b) The changes in periods were represented against the stimulation phase at 30 Hz. When stimulation of Tac1 cells was performed during inspiration, the period was not changed. The respiratory period was substantially reduced when stimulation occurred early in expiration and to a lesser degree late during expiration. (c) Laser stimulations were categorized according to their occurrences during inspiration (I), early (EE), and late expiration (LE). (d) Tac1 stimulations occurring during early and late expirations significantly reduced the respiratory period (n=47). (e) Viral injection in the preBötC and opsin channel ChETA expression in Tac1 cells was confirmed using in-situ hybridization. (f) Tac1 (red) and eYFP (green) mRNA were found in the preBötC area with co-expression of both mRNAs (yellow). (g) The locations of the optical fiber placement above the preBötC were confirmed with post-mortem histology. Red blood cells accumulate around the optic fiber and have autofluorescence properties allowing visualization under fluorescence microscopy (Alpert et al., 1980). (h) eYFP (green) was expressed in a region rich in Tacr1 (red) mRNA consistent with the preBötC. Data are presented as means ± SEM, with individual data points. * indicate means significantly different from stimulation phases with p<0.05. Panel a was created using Biorender.com. DAPI was shown in blue.
-
Figure 2—source data 1
In-situ hybridization for Tac1 and eYFP in a DAPI stained medullary slice.
- https://cdn.elifesciences.org/articles/85575/elife-85575-fig2-data1-v2.xlsx
Figure 2—figure supplement 1
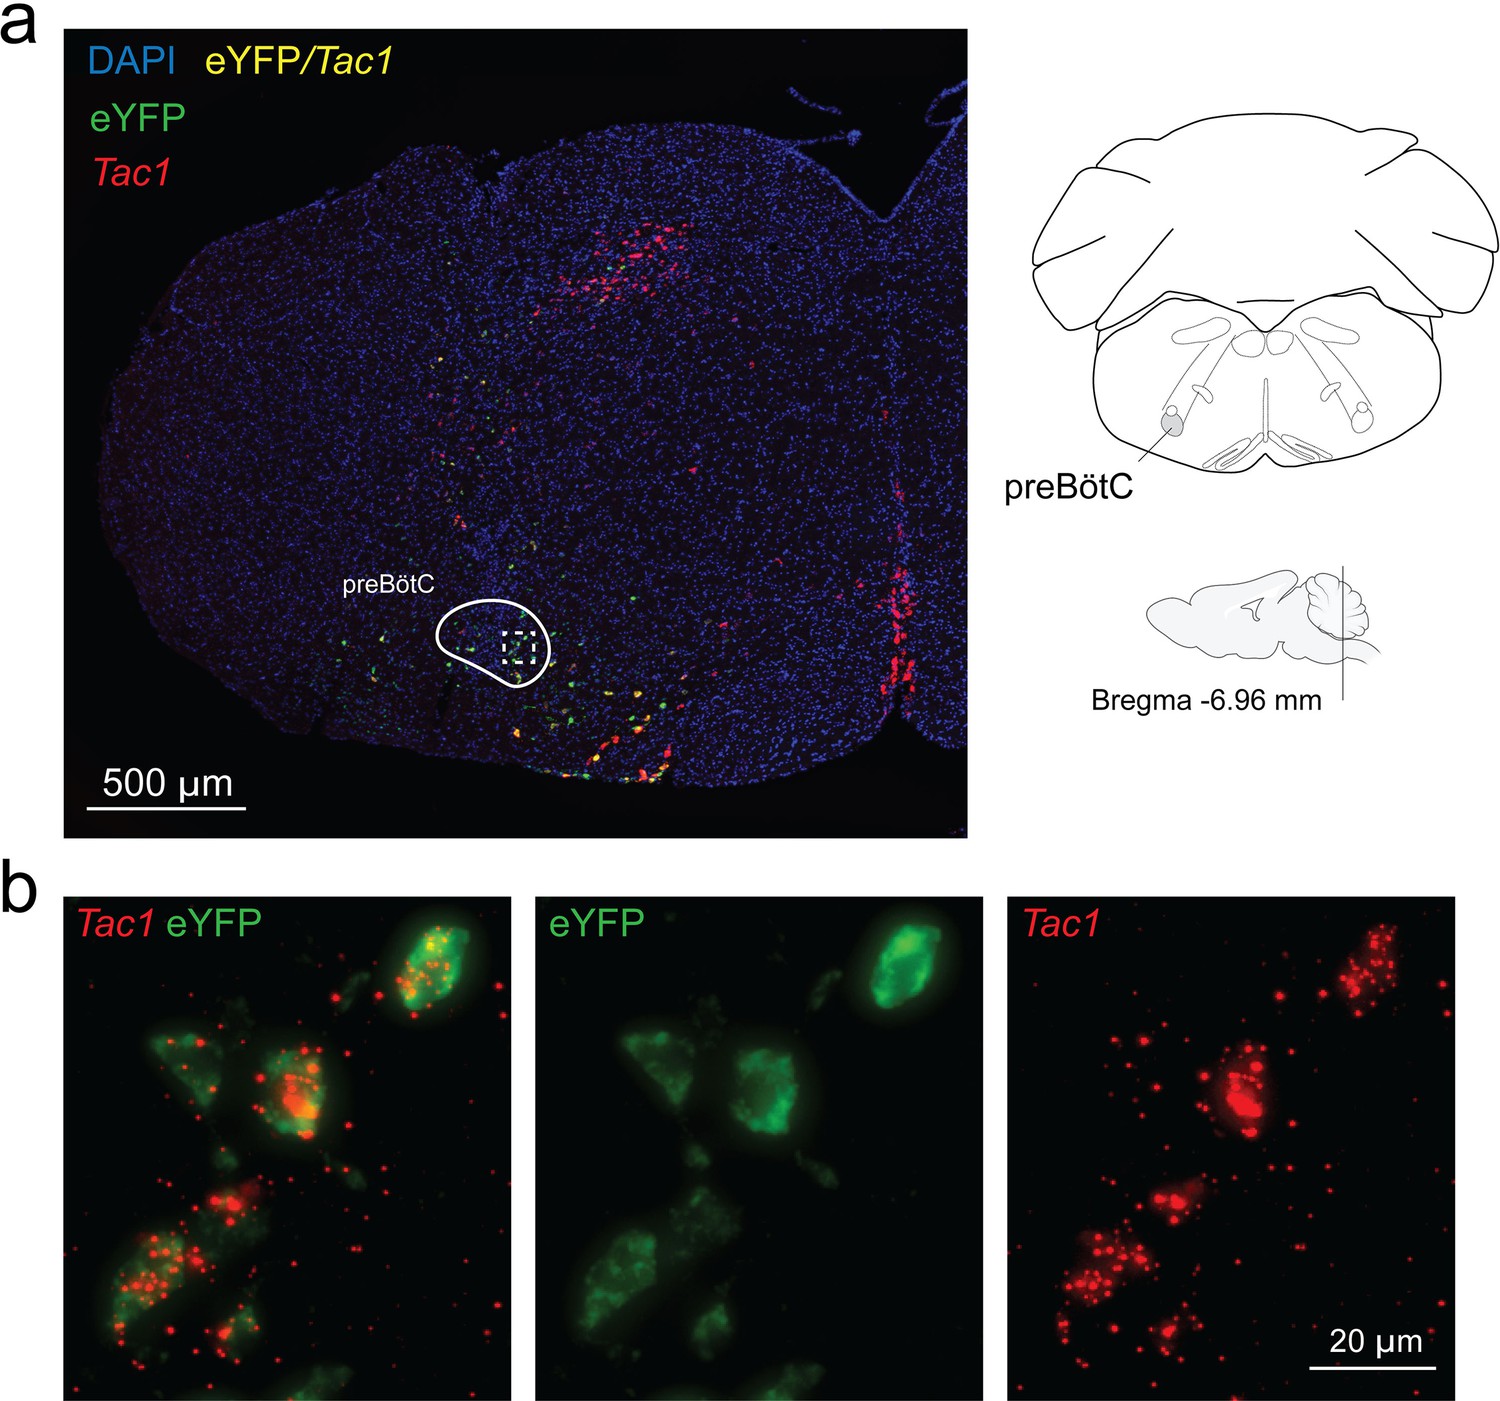
In-situ hybridization showing magnified image of preBötzinger Complex (preBötC) region with co-expression of eYFP (ChETA) and tachykinin precursor 1 (Tac1) mRNA.
(a) Injection of the adeno-associated virus carrying ChETA shown by eYFP (green) mRNA expression is confirmed in the preBötC region using in-situ hybridization. (b) Magnified image of Tac1 cells located in the preBötC region (dashed square). mRNA expression of eYFP (for ChETA, green) is always co-located with mRNA expression of Tac1 (red) confirming specific transduction of Tac1 cells by the adeno-associated virus. DAPI is shown in blue.
Figure 3
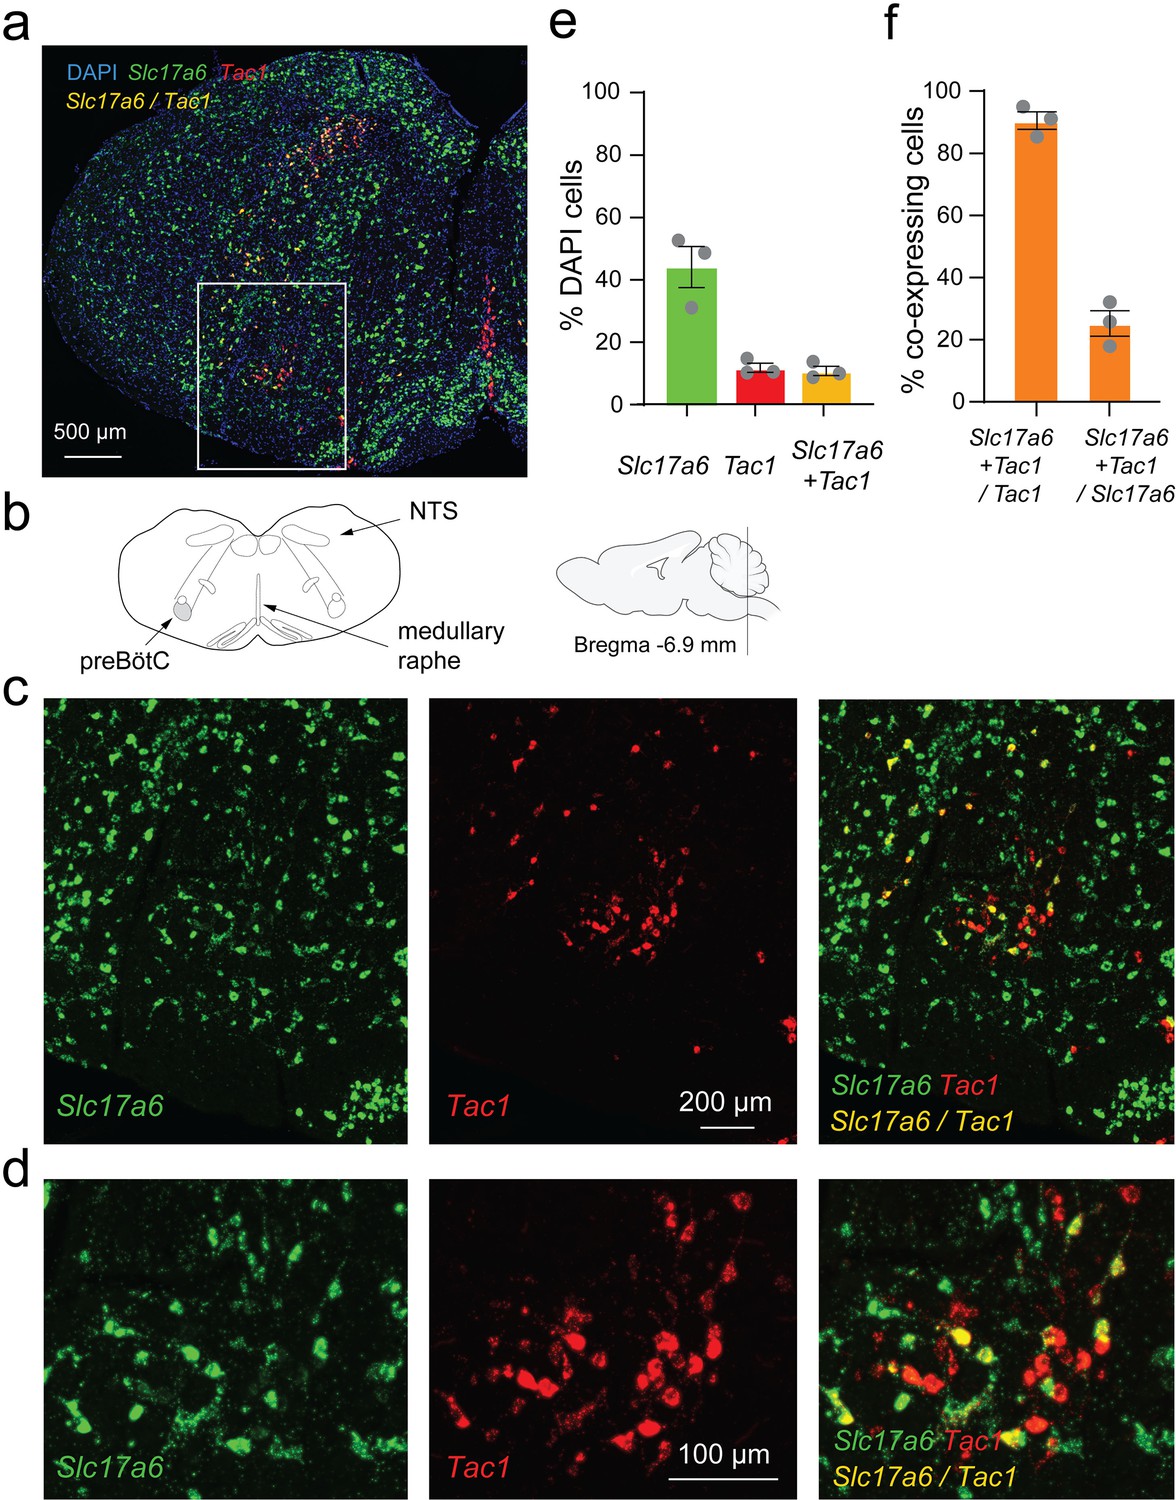
Slc17a6 (or Vglut2) and tachykinin precursor 1 (Tac1) mRNA expressions in the medulla.
(a) Slc17a6 (green) and Tac1 (red) mRNAs were expressed in the region of the preBötzinger Complex (preBötC) as shown by in-situ hybridization in wild-type mice. (b) Substantial expression of Slc17a6 mRNA was observed in the medulla with a cluster of Tac1 in the preBötzinger Complex (preBötC). (c) In the preBötC, part of the cells expressing Tac1 also expressed Slc17a6 (co-expression shown by yellow). (d) Magnified views of the central part of panel c. (e) In the preBötC, about 44% of the cells (shown with DAPI) expressed Slc17a6, 11% Tac1 alone, and 11% co-expressed Tac1 and Slc17a6. A total of threemice were used. (f) The majority of Tac1 cells co-expressed Slc17a6 (93%), whereas only 24% of Slc17a6 cells co-expressed Tac1. DAPI was shown in blue.
-
Figure 3—source data 1
Raw data of respiratory rate.
- https://cdn.elifesciences.org/articles/85575/elife-85575-fig3-data1-v2.xlsx
Figure 4 with 1 supplement
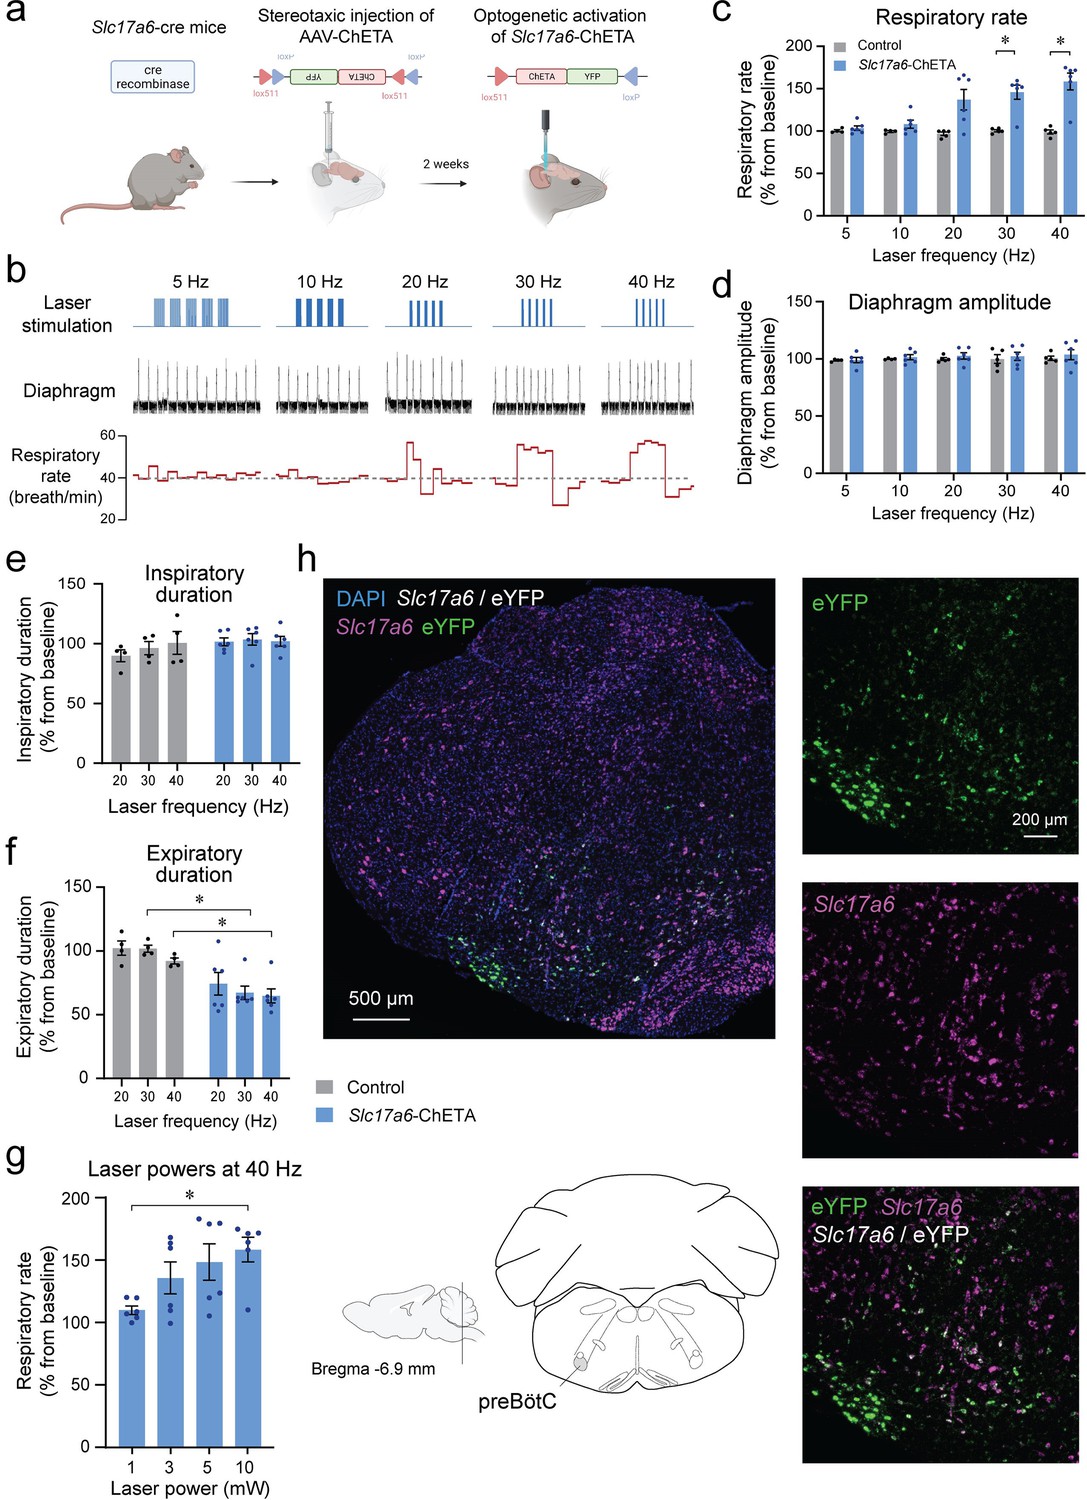
Photostimulation of Slc17a6 (Vglut2) preBötzinger Complex cells increases the respiratory rate in anesthetized mice.
(a) The adeno-associated virus AAV-ChETAfl/fl was injected into the preBötzinger Complex (preBötC) of Slc17a6 cre-expressing mice. After 2 weeks of incubation with AAV-ChETA, Slc17a6 cells expressed ChETA and eYFP. (b) In anesthetized mice, diaphragm muscle activity was recorded and laser stimulations at various frequencies were performed in the preBötC. (c) Respiratory rate was significantly increased by laser stimulation at 30 and 40 Hz and (d) no effect was observed on diaphragm amplitude (n=11). Increased respiratory rate was not due to a decrease in (e) inspiratory duration, but rather decreased (f) expiratory duration (n=11). (g) Respiratory rate was increased by laser stimulation at 10 mW (n=24). (h) In situ hybridization was performed in animals injected with AAV-ChETA and showed that ChETA (marked with eYFP mRNA) was expressed in the region of the preBötC and co-expressed with Slc17a6. Data are presented as means ± SEM, with individual data points. * indicate means significantly different from corresponding controls or laser power with p<0.05. Panel (a) was created using Biorender.com.
-
Figure 4—source data 1
Respiratory rate in response to stimulation of Slc17a6-ChETA in mice.
- https://cdn.elifesciences.org/articles/85575/elife-85575-fig4-data1-v2.xlsx
Figure 4—figure supplement 1

Optogenetic stimulation of Slc17a6 preBötzinger Complex (preBötC) cells in anesthetized animals.
Respiratory rate before (Baseline) and during laser stimulation in Slc17a6-ChETA mice (laser stimulation effect: p=0.0007, n=12; F(1, 10)=23.64). Laser stimulations were performed at 5, 10, 20, 30, and 40 Hz. Data are presented as means ± SEM, with individual data points. * indicate means significantly different from corresponding baseline value with p<0.05.
-
Figure 4—figure supplement 1—source data 1
- https://cdn.elifesciences.org/articles/85575/elife-85575-fig4-figsupp1-data1-v2.xlsx
Figure 5 with 1 supplement

State-dependent respiratory changes by photostimulation of tachykinin precursor 1 (Tac1) preBötzinger Complex (preBötC) cells in freely-behaving mice.
(a) Using viral injection, ChETA was expressed in Tac1 preBötC cells and respiratory activity was measured using whole-body plethysmography. (b) Photostimulation of ChETA at 40 Hz increased respiratory rate in calm, but not in active state, with this effect reversed when the laser was turned off. (c) According to video recordings, calm state was determined when the animal was not moving, whereas the active state was when activity was higher than 0.4% of pixel changes in the recording area. (d) Stimulation of Tac1 neurons strongly increased absolute respiratory rate in calm state whereas in active states it had no significant effect. (e) To determine the state-dependent effects of photostimulation, respiratory rate changes were expressed as a function of the baseline respiratory rate (before laser stimulation). Photostimulation of Tac1 cells substantially increased respiratory rate in calm, but not in active, state. (f) In calm state, Tac1 cell stimulations at 30, 40, and 60 Hz increased rate due to a combination of decreased inspiratory and expiratory durations (n=12). Data are presented as means ± SEM, with individual data points. * indicate means significantly different from corresponding controls with p<0.05. Panel (a) was created using Biorender.com.
-
Figure 5—source data 1
Raw data for expiratory duration in response to photostimulation.
- https://cdn.elifesciences.org/articles/85575/elife-85575-fig5-data1-v2.xlsx
Figure 5—figure supplement 1
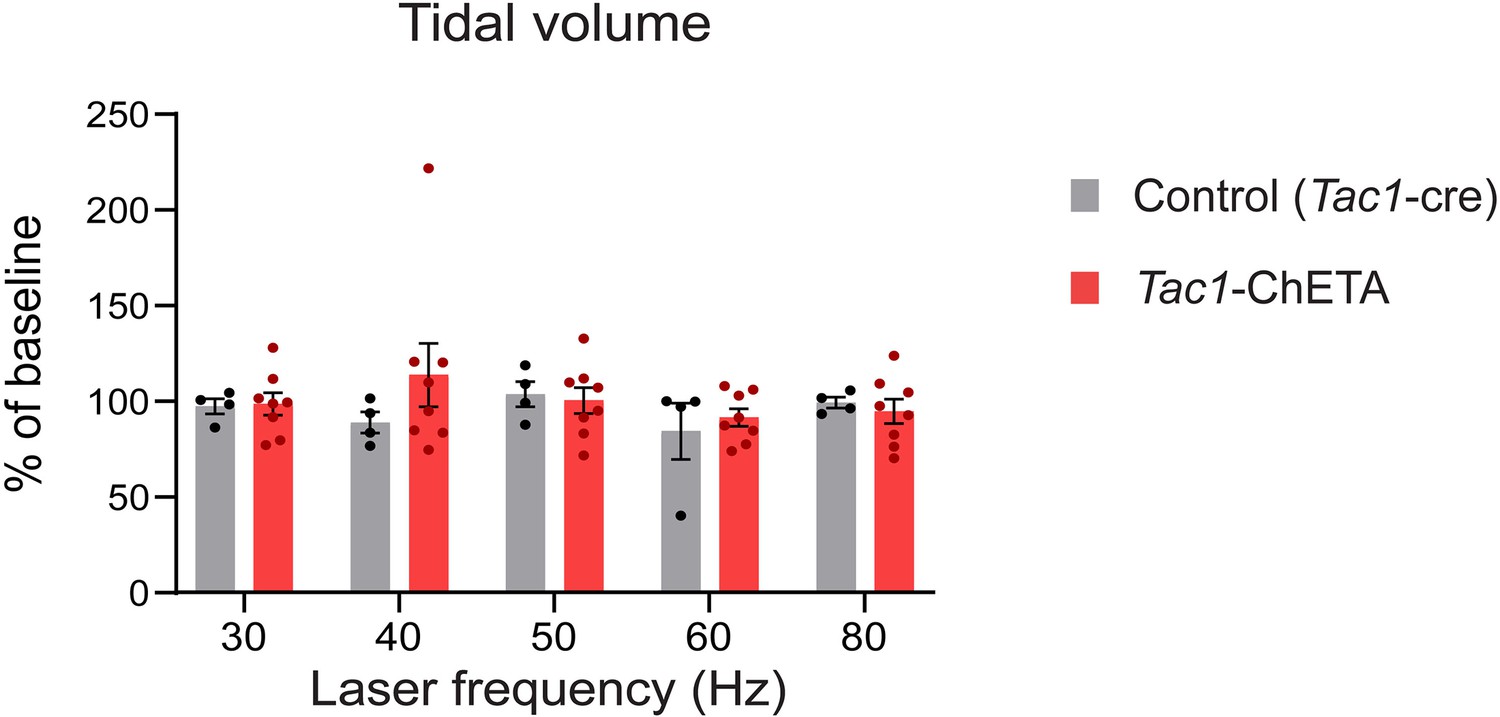
Tidal volume following optogenetic stimulation of tachykinin precursor 1 (Tac1) preBötzinger Complex (preBötC) cells in freely-behaving mice.
Laser stimulations were performed at 40 Hz. No changes were observed following Tac1 preBötC stimulation. Tidal volume was normalized according to the tidal volume of the breaths preceding photostimulation. Bars represent means ± SEM, with individual data points.
-
Figure 5—figure supplement 1—source data 1
Tidal volume in response to Tac1 stimulation.
- https://cdn.elifesciences.org/articles/85575/elife-85575-fig5-figsupp1-data1-v2.xlsx
Figure 6 with 1 supplement
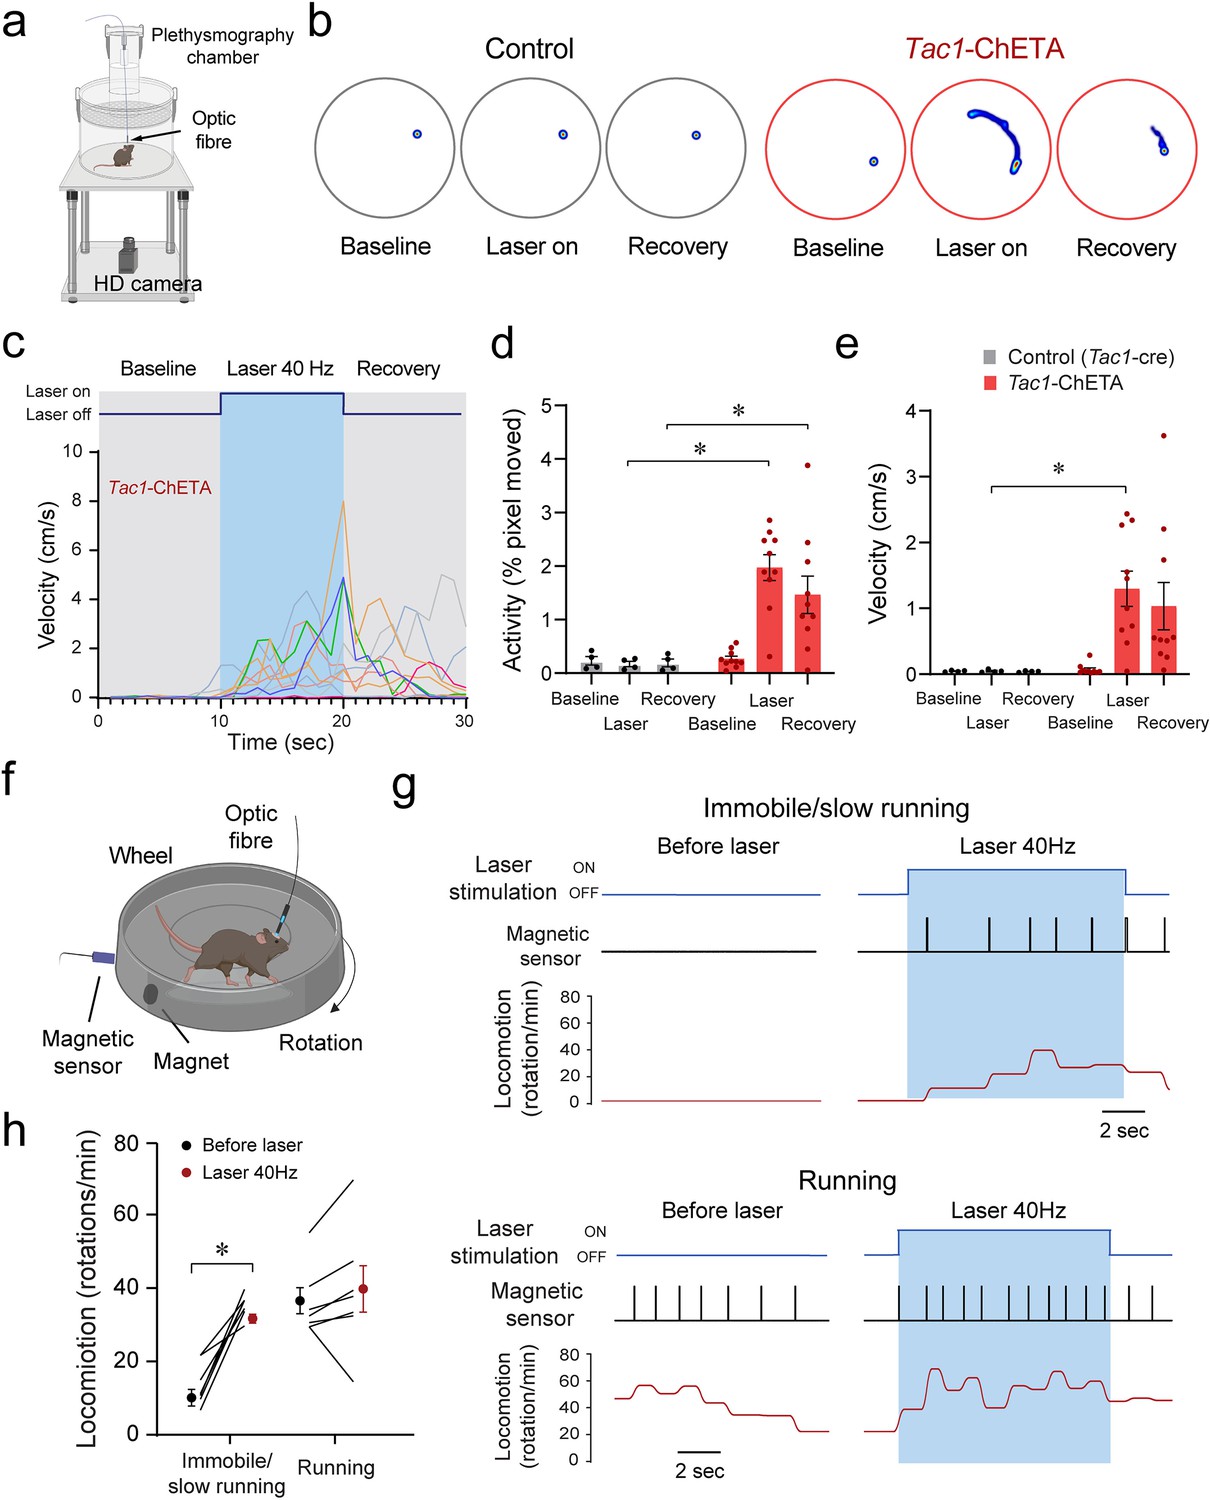
Optogenetic stimulation of tachykinin precursor 1 (Tac1) preBötzinger Complex (preBötC) cells promotes locomotion in freely-behaving mice.
(a) Locomotor activity in freely behaving Tac1-cre mice expressing ChETA was assessed with a high-definition camera. (b) Heat maps showing locomotion in control and Tac1-ChETA mice in three different conditions; before stimulation (baseline), during stimulation (laser ON), and following stimulation (recovery). Each circle represents 10 s locomotion under the corresponding condition. (c) The velocity (cm/s) for each Tac1-ChETA animal strongly increased during stimulation at 40 Hz followed by a reduction in velocity after photostimulation was stopped. (d) Activity (pixel changes inside the recording circle) also significantly increased with laser stimulation in Tac1-ChETA, but not control, mice (n=14). (e) Similarly, photostimulation substantially increased velocity in Tac1-ChETA compared to control mice, with this effect sustained for a few seconds during recovery (n=14). (f) Using a running wheel, locomotion was measured as rotation speed while Tac1 preBötC cells were stimulated. (g) When the animal was immobile with a rotation speed inferior to 20 rotations/min, photostimulation of Tac1 preBötC cells increased substantially rotation speed. When the animal was already running, photostimulation did not change rotation speed. (h) Photostimulation of Tac1 neurons significantly increased rotation speed in immobile mice, but not in running mice (n=14). Data are presented as means ± SEM, with individual data points. * indicate means significantly different from corresponding controls with p<0.05. Panels (a) and (f) were created using Biorender.com.
-
Figure 6—source data 1
Locomotion in response to Tac1 photostimulation.
- https://cdn.elifesciences.org/articles/85575/elife-85575-fig6-data1-v2.xlsx
Figure 6—figure supplement 1
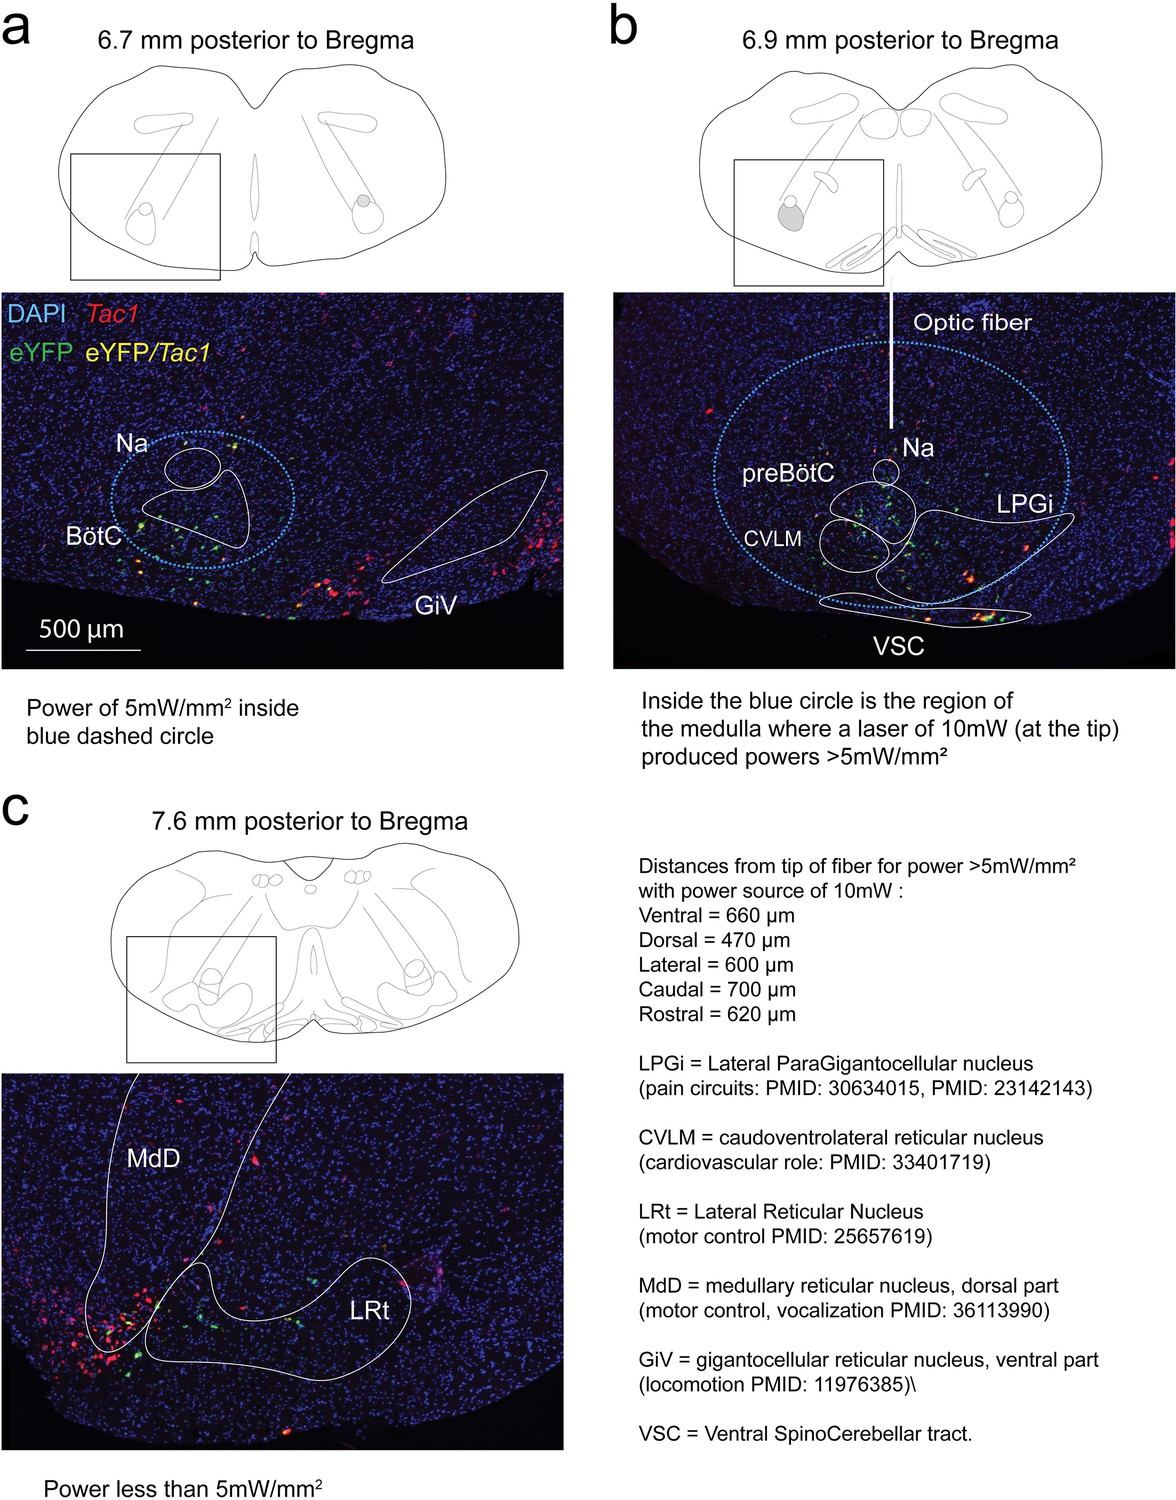
mRNA expressions of eYFP (for ChETA) and tachykinin precursor 1 (Tac1) (for substance P) in the preBötzinger Complex region and adjacent motor nuclei.
DAPI (blue) was used to define brain markers while Tac1 (red) and eYFP (green) mRNAs are identified using in-situ hybridization. Blue circles indicate regions of the medulla where laser power was >5 mW/mm2. (a) Rostral section containing the Bötzinger complex (BötC), the ventral part of the gigantocellular reticular nucleus (GiV). GiV shows no co-expression of eYFP or Tac1. Na = nucleus ambiguus. (b) Ventral to the preBötC is located the caudoventrolateral reticular nucleus (CVLM). Medial to the preBötC is located the Lateral ParaGigantocellular nucleus (LPGi). Ventral to the LPGi is located in the Ventral SpinoCerebellar tract (VSC). While most of the eYFP expression was found in the preBötC, eYFP, and Tac1 expressions were also found in the CVLM, the LPGi, and the VSC. (c) Caudal to the preBötC is the dorsal part of the medullary reticular nucleus (MdD) and the lateral reticular nucleus (LRt). MdD and LRt have minor Tac1 expression with some eYFP expression. In this region, the light power was lower than 5 mW/mm2.
Figure 7
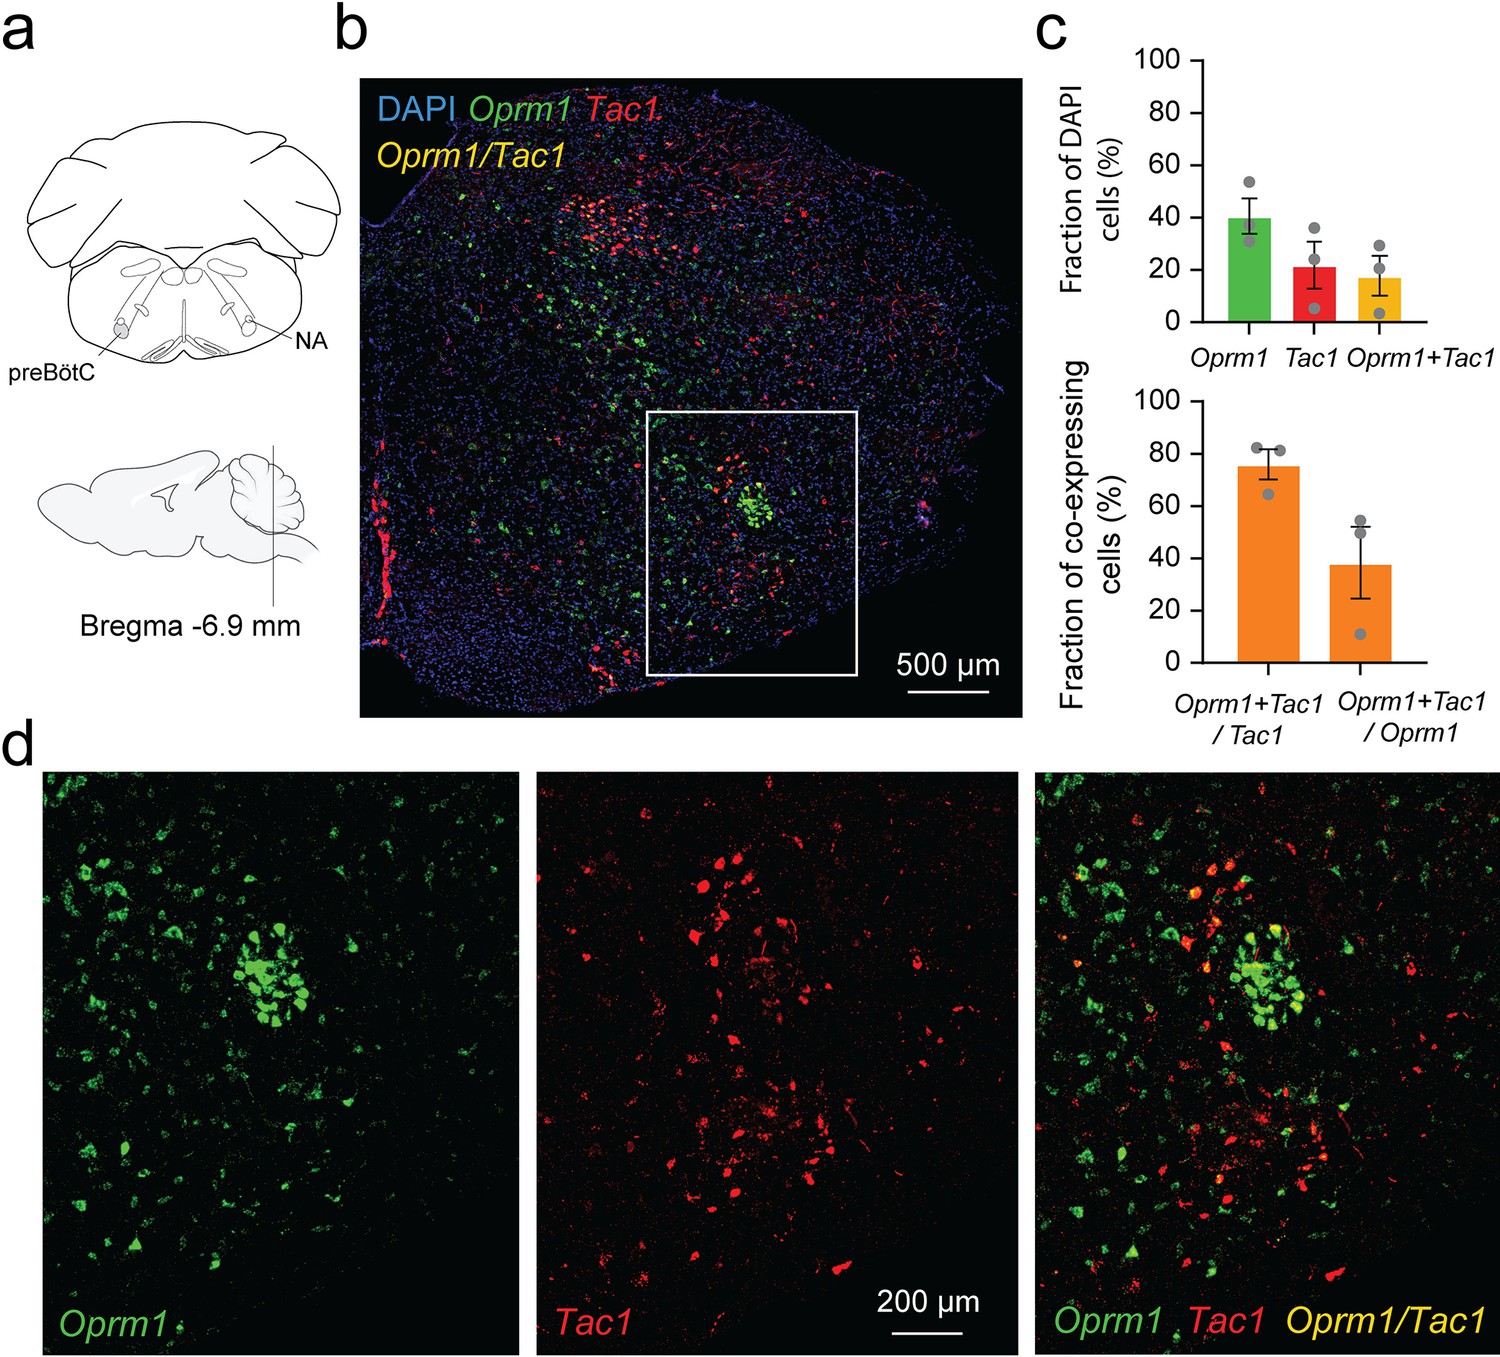
Co-expression of Oprm1 and tachykinin precursor 1 (Tac1) mRNAs in preBötzinger Complex (preBötC) cells.
(a). In-situ hybridization was performed on sections containing the preBötC about 6.9 mm caudal to Bregma. (b) In the medulla, Oprm1 (the gene encoding for MOR shown in green), Tac1 (the gene for Substance P in red), and DAPI (in blue) were widely expressed in the preBötC. (c) Cell counting in the preBötC shows that about 40.5% of the cells contained Oprm1 and 21.8% contained Tac1 (n=3). In the preBötC, 75.9% of cells expressing Tac1 also co-expressed Oprm1 (n=3). Conversely, about 38% of cells expressing Oprm1 also co-expressed Tac1 (n=3). (d) In a magnified view of the preBötC, Oprm1 mRNAs formed a cell cluster in the ventral part of the medulla and co-expressed Tac1. Na: nucleus ambiguus.
-
Figure 7—source data 1
Expression of Tac1 and Oprm1 mRNAs.
- https://cdn.elifesciences.org/articles/85575/elife-85575-fig7-data1-v2.xlsx
Figure 8 with 1 supplement
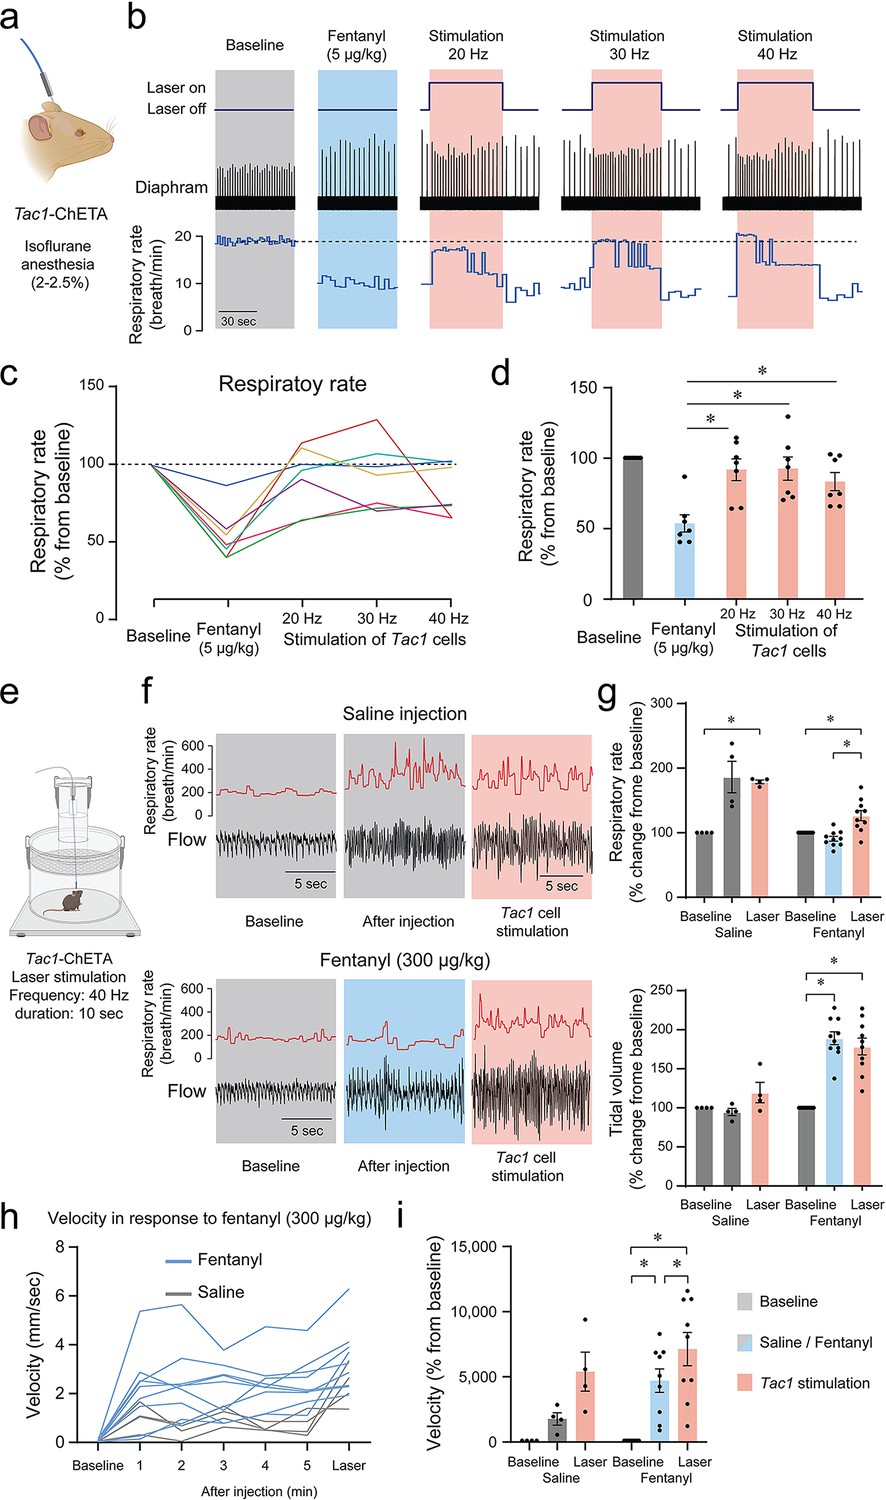
Photostimulation of tachykinin precursor 1 (Tac1) preBötzinger Complex (preBötC) cells reverses respiratory depression by the opioid fentanyl.
(a) Injection of fentanyl (5 µg/kg) performed in anesthetized Tac1-ChETA mice. (b) Injection of fentanyl depressed breathing, with this effect reversed by photostimulation of Tac1 preBötC cells at 20, 30, and 40 Hz. (c) All seven animals receiving fentanyl showed respiratory rate depression by fentanyl reversed by Tac1 photostimulation (each color represents a separate tracing for each animal). Once the laser was turned off, the breathing rate returned to low breathing rates due to fentanyl. (d) Mean data showed that stimulation of Tac1 cells reversed respiratory depression at each laser frequency used (20, 30, 40 Hz, n=35). (e) In freely-moving, non-anesthetized, Tac1-ChETA mice, respiratory responses to the opioid fentanyl (300 µg/kg, intraperitoneal) were assessed using whole-body plethysmography. (f) Representative tracings of diaphragm activity and respiratory rate showed that fentanyl depressed respiratory rate compared to saline and that Tac1 stimulation reversed respiratory depression. (g) Mean data show how fentanyl significantly reduced respiratory rate observed with saline injection, an effect reversed by Tac1 stimulation in fentanyl conditions only (n=14). Tidal volume was increased by fentanyl injection but unaffected by photostimulation. (h, i) Locomotor activity was assessed and showed an increase in velocity following injection and stimulation at 40 Hz (n=13). All absolute values (not normalized according to baseline) of respiratory rate and tidal volume can be found in Figure 8—figure supplement 1 and are consistent with normalized results. Data are presented as means ± SEM, with individual data points. * indicate means significantly different from corresponding controls with p<0.05. Panel (a) and (e) were created using Biorender.com.
-
Figure 8—source data 1
Raw data for respiratory rate in response to fentanyl and photostimulation of Tac1 cells.
- https://cdn.elifesciences.org/articles/85575/elife-85575-fig8-data1-v2.xlsx
Figure 8—figure supplement 1

Fentanyl depression and optogenetic stimulation of tachykinin precursor 1 (Tac1) preBötzinger Complex (preBötC) cells.
(a) Respiratory rate following intramuscular injection of fentanyl (5 µg/kg) and different laser stimulations (20, 30, 40 Hz) in anesthetized Tac1-ChETA mice 4 weeks post virus injection. (laser stimulation effect: p=0.0008, n=7; F(4, 24)=6,851). (b) Respiratory rate (group x laser stimulation effect: p<0.0001, n=14; F(2, 24)=18.42) and (c) tidal volume (group x laser stimulation effect: p=0.0281, n=14; F(2,24)=4.161) assessed using whole-body plethysmography, following intraperitoneal injection of fentanyl (0.3 mg/Kg) or saline and laser stimulation (40 Hz) in freely-moving, non-anesthetized, Tac1-ChETA mice 4 weeks post virus injection. Data are presented as means ± SEM, with individual data points. * indicate means significantly different from corresponding fentanyl value with p<0.05.
-
Figure 8—figure supplement 1—source data 1
Tidal volume in animals receiving saline or fentanyl.
- https://cdn.elifesciences.org/articles/85575/elife-85575-fig8-figsupp1-data1-v2.xlsx
Tables
Key resources table
| Reagent type (species) or resource | Designation | Source or reference | Identifiers | Additional information |
|---|---|---|---|---|
| Strain, strain background (M. musculus) | C57BL/6 J | The Jackson Laboratory | # 000664 | |
| Genetic reagent (M. musculus) | Slc17a6-ires-cre Slc17a6tm2(cre)Lowl/J | The Jackson Laboratory | # 016963 | |
| Genetic reagent (M. musculus) | Tac1-IRES2-Cre-D B6;129S-Tac1tm1.1(cre)Hze/J | The Jackson Laboratory | # 021877 | |
| Biological sample (M. musculus) | Mouse isolated brainstem | St. Michael’s hospital/Animal care facility | Isolated from mouse and fixed in formalin | |
| Recombinant DNA reagent | AAV5-EF1a-DIO-ChETA-eYFP | UNC vector core | AV4322c | |
| Recombinant DNA reagent | AAV-EF1a-DIO-eYFP-WPRE-pA | UNC vector core | AV4310L | |
| Commercial assay or kit | RNAscope Multiplex Fluorescent Reagent v2 Assay | Advanced Cell Diagnostics | # 323270 | |
| Commercial assay or kit | Mm-Tac1 | Advanced Cell Diagnostics | Cat No. 410351-C2 | Probe targeting Tac1 gene mRNA |
| Commercial assay or kit | Mm-Slc17a6 | Advanced Cell Diagnostics | Cat No. 319171-C2 | Probe targeting Slc17a6 gene mRNA |
| Commercial assay or kit | Mm-Oprm1 | Advanced Cell Diagnostics | Cat No. 315841 | Probe targeting Oprm1 gene mRNA |
| Commercial assay or kit | Mm-Tacr1 | Advanced Cell Diagnostics | Cat No. 428781 | Probe targeting NK1 receptor gene mRNA |
| Commercial assay or kit | Mm-eYFP | Advanced Cell Diagnostics | Cat No. 551621-C3 | Probe targeting eYFP gene mRNA |
| Chemical compound, drug | Fentanyl citrate | Sandoz | St. Michael’s Hospital Pharmacy | |
| Software, algorithm | Labchart | ADInstruments | Version 8 | |
| Software, algorithm | GraphPad Prism 9 | Graphpad Software | Version 9.3.1 | |
| Software, algorithm | Adobe Illustrator | Creative Suite 5, Adobe | ||
| Software, algorithm | OptogenSim | Liu et al., 2015 | DOI:10.1364/BOE.6.004859 | 3D Monte Carlo simulation platform for optogenetic applications |
| Software, algorithm | Fiji (ImageJ) | Schindelin et al., 2012 | doi:10.1038/nmeth.2019 | |
| Software, algorithm | Zen 2.6 Lite | Zeiss | (Blue edition) | |
| Software, algorithm | Pinnacle Studio 24 MultiCam Capture software | Corel | ||
| Software, algorithm | EthoVision XT | Noldus | Version 14 | |
| Other | DAPI | Biotium | #40011 | 4′,6-diamidino-2-phenylindole (fluorescent marker binding to DNA) |
| Other | Needle | P1 technologies | C315I-SPC Internal 33GA | Virus injection in brain |
| Other | custom-made ferule/ optical fiber | Thor Labs | Ferule: CF230-10 Optical fiber: FP200ERT | Specifications: 200 μm, 0.5 NA |
| Other | Optical fiber | Thor Labs | CFMC52L10 | Specifications: 200 μm, 0.5 NA |
Additional files
Download links
A two-part list of links to download the article, or parts of the article, in various formats.
Downloads (link to download the article as PDF)
Open citations (links to open the citations from this article in various online reference manager services)
Cite this article (links to download the citations from this article in formats compatible with various reference manager tools)
Medullary tachykinin precursor 1 neurons promote rhythmic breathing
eLife 12:e85575.
https://doi.org/10.7554/eLife.85575


