Sex-dependent noradrenergic modulation of premotor cortex during decision-making
- Neuroscience and Behavior Program and Department of Biology, University of Massachusetts Amherst, United States
Figures
Figure 1
Propranolol decreased goal-directed task participation, particularly in females.
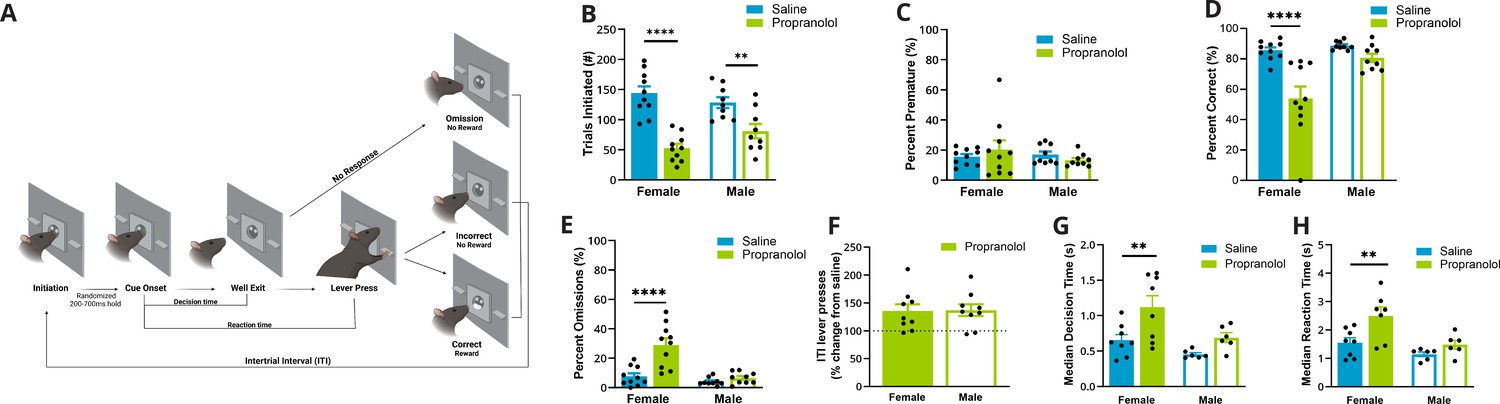
(A) Schematic of events in the two-alternative forced-choice (2AFC) task (L–R). (1) Rats self-initiated trials by breaking an IR beam in the central well. (2) After a variable length (200–700 ms) IR beam hold, one of two randomly selected cues are illuminated that signals which lever would be rewarded when pressed. (3) Cues maintained illumination until rats left the well, ‘Well Exit.’ The time from cue onset (2) to well exit (3) was identified as the decision time. (4) Animals had 5 s from cue onset to execute a decision via lever pressing, ‘Lever Press.’ The time from cue presentation (2) to lever press (4) was identified as the reaction time. (5) Possible trial outcomes were correct (sucrose reward given), incorrect, omission (no lever press within 5 s), or premature (well exit prior to cue presentation). After each trial, there was an intertrial interval where the house light was illuminated, and new trials could not be initiated (incorrect and omissions: 10 s; correct: 5 s). Created with BioRender.com. (B) Propranolol (green) decreased the number of trials initiated during a 2AFC task in females (p<0.0001, solid bars) and males (p=0.0066, open bars) compared to saline (blue). (C) Propranolol did not alter the percent of trials that animals left the well during the variable hold prior to cue presentation (premature) in females or males. (D) Propranolol decreased overall accuracy in females (p<0.001) but not males (p=0.3336). (E) The percent of trials that a response was omitted significantly increased only in females after propranolol (p<0.0001). (F) Altered task performance was not a result of decreased arousal – motor output or lever pressing ability. The ratio of lever presses made during the intertrial interval (ITI) to the total lever presses (lever press index) increased in both sexes by 150% after propranolol. (G) Decision time, or the latency to behaviorally discriminate cues and select an action, measured from cue onset to well exit, differed by sex and propranolol. Propranolol significantly increased the median decision times in females (p=0.0071) but not males (p=0.3086). (H) Behaviorally, median reaction times, from cue onset to lever press, were significantly altered by propranolol and sex. Propranolol significantly increased median reaction times in females (p=0.0101) but not males (p=0.4922). * Indicates a significant effect compared to saline *p<0.05; **p<0.01; ***p<0.001; ****p<0.0001. Behavioral data (n=19; female n=10, male n=9) is presented as mean ± SEM after confirming normality (Shapiro-Wilk). Comparisons between groups were made with REML ANOVA and Sidaks post hoc tests.
-
Figure 1—source data 1
Two-alternative forced-choice (2AFC) behavior.
- https://cdn.elifesciences.org/articles/85590/elife-85590-fig1-data1-v2.xlsx
Figure 2
Propranolol influences basal properties of female anterior M2 neurons.
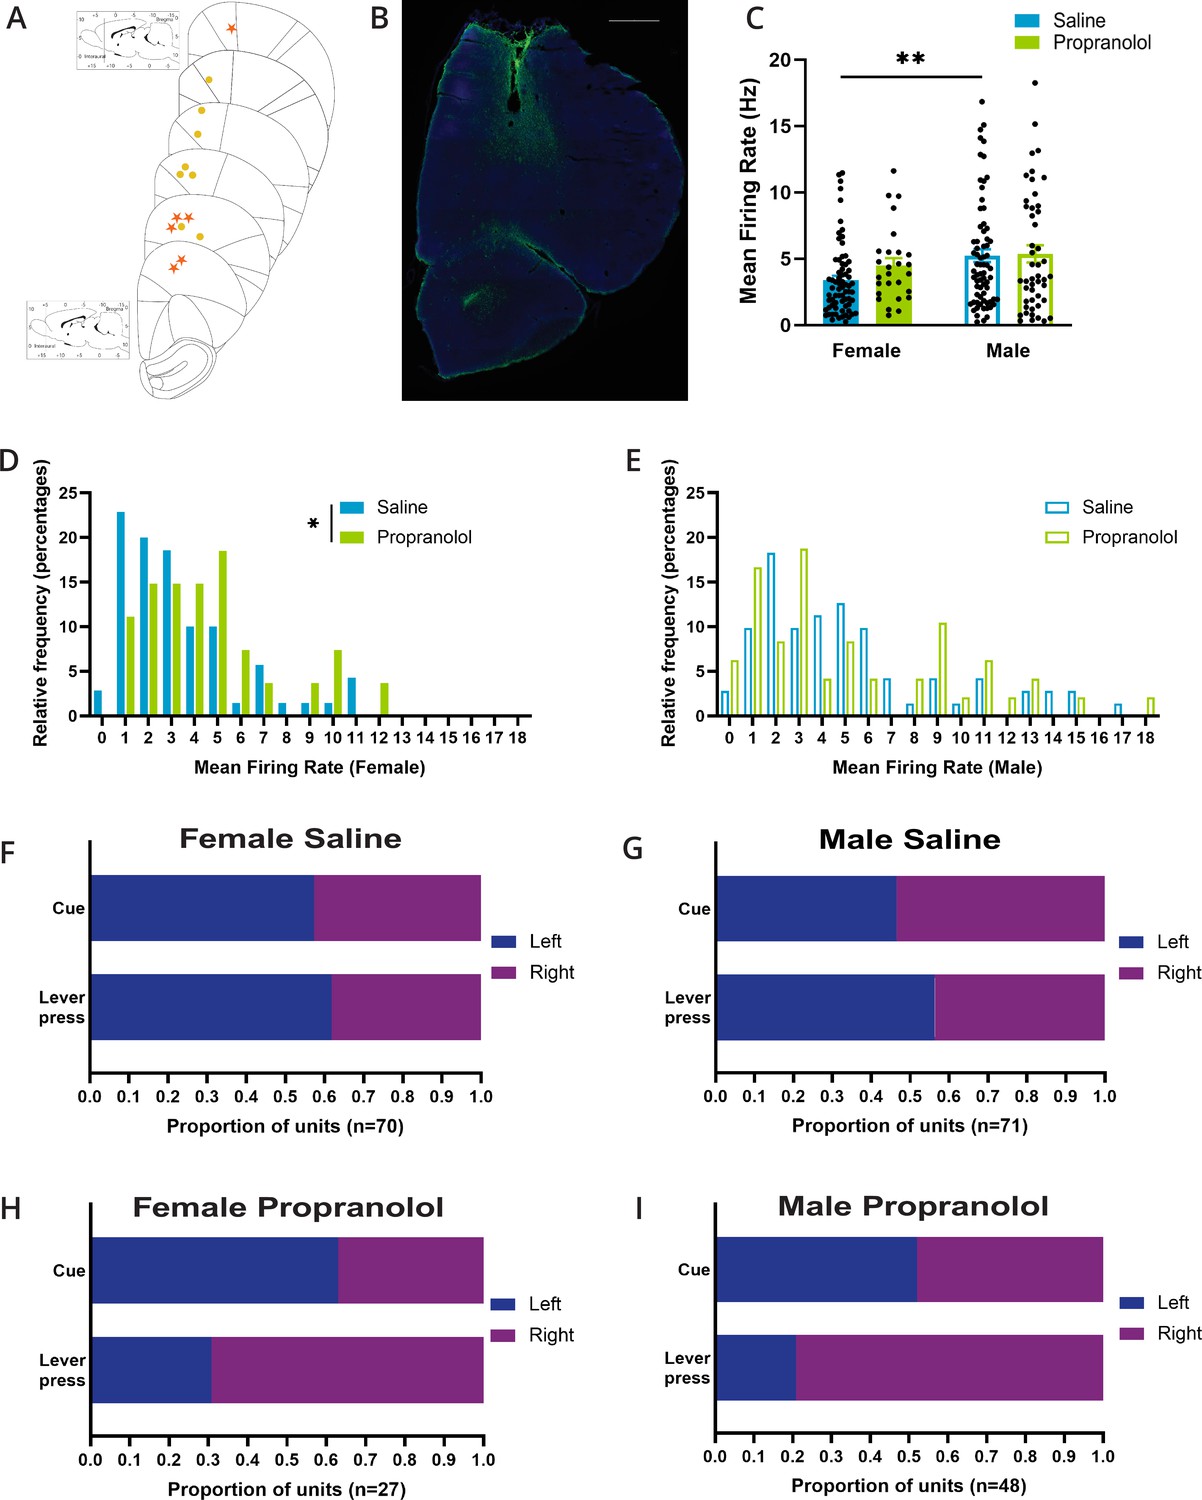
(A) Placements of the center of electrode array in M2 in females (yellow circle) and males (orange star). (B) Representative figure of histological placement of microelectrode array in M2. Tissue is stained with DAPI (blue) and GFAP (green) to identify glial scarring after electrolytic lesions. Scale bar indicates 1000 μm. (C) Basal mean firing rates of anterior M2 neurons differed by sex (p=0.0061; Sidak’s multiple comparison test). Propranolol did not alter mean firing rate in females or males (p=0.544; Sidak’s multiple comparison test). Mean firing rate (Hz) of each unit included in electrophysiology is represented as individual points. Bar graphs represent the mean ± SEM of units from females and males after saline (blue; n=141, female n=70, male n=71) and propranolol (green; n=75, female n=27, male n=48). (D) The distribution of single-unit firing rate (Hz) in females was rightward shifted after propranolol (p=0.0271; Mann–Whitney test). Histograms show the distributions of firing rates in females after saline (blue) and propranolol (green) in 1 s bins where the value of the x-axis is the minimum value in each bin. (E) The distribution of single-unit median firing rate (Hz) in males was not significantly different after propranolol (p=0.8228; Mann–Whitney test). Histograms show the distributions of firing rates in males after saline (blue) and propranolol (green) in 1 s bins where the value of the x-axis is the minimum value in each bin. (F-I) Propranolol does not change side preference displayed in M2 neural activity around cue onset but does change the side preference for lever presses in females (p=0.0105; Fisher’s exact test) and males (p=0.0001; Fisher’s exact test). Proportions of units that display a left (blue) or right (purple) side preference around cue onset (top) and lever press (bottom) during the two-alternative forced-choice (2AFC) task separated by sex and treatment (F: female saline; G: male saline; H: female propranolol; I: male propranolol). Side preference was identified via a side preference index using the firing rate of neurons for 1 s after cue onset and 1 s prior to lever press (see ‘Materials and methods’). Total number of units per treatment and sex is identified at the bottom of the graphs.
-
Figure 2—source data 1
M2 basal neural activity.
- https://cdn.elifesciences.org/articles/85590/elife-85590-fig2-data1-v2.xlsx
Figure 3
Propranolol decreases active inhibition of nonpreferred action plans.
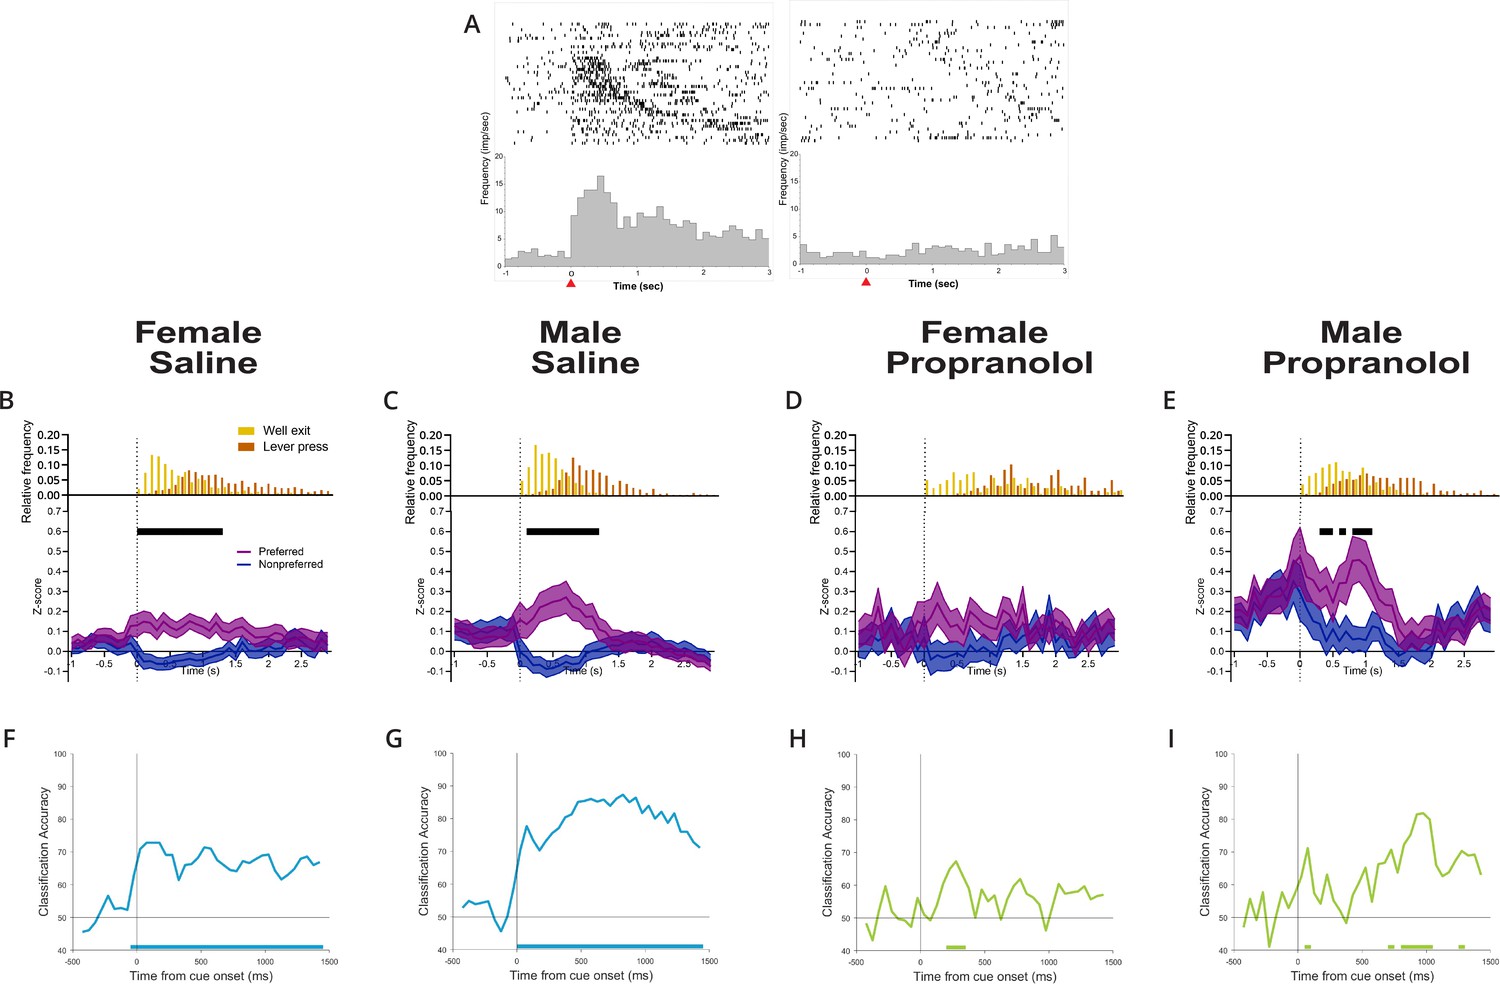
(A) Anterior M2 neurons show differential responses to opposing cue presentations. Raster (above) and perievent histogram of a single representative neuron aligned to cue onset (t = 0 s, 100 ms bins) from 1 s prior cue onset until 3 s after cue onset. The leftmost graph shows a single-unit response to left cue presentation, and the rightmost graph shows the same unit response to right cue presentation. This representative neuron was classified as left cue preferring, exemplified by a sharp and sustained increase in neural activity at left cue presentation but not right cue presentation. Red arrow on the x-axis identified cue onset at time = 0 s. (B–E) Propranolol decreases the inhibition of action plans for nonpreferred/irrelevant cues in females and males. Population neural data split by preferred (purple) and nonpreferred (blue) activity aligned to cue onset separated by sex and treatment (B: saline female, n=70; C: male saline, n=71; D: propranolol female, n=27; E: propranolol male, n=48). (B, C) Both sexes show task-related activity began shortly after cue onset that was sustained beyond cue offset at well exit (represented in histograms above Z-scored graphs, yellow) after saline. Neural activity on preferred (purple) and nonpreferred (blue) trials shows sharp and sustained increases and decreases, respectively, from cue onset until lever press. (D) Propranolol collapsed the separation of action plans between preferred and nonpreferred activity in females by decreasing task-related activity in both populations. (E) Propranolol blocked the active inhibition of nonpreferred action plans in males, increasing the noise represented in task-related activity. Graphs show mean ± SEM of z-scored activity on preferred (purple) and nonpreferred (blue) trials. Black bars above the graphs indicate significantly different population activity corrected for multiple comparisons (paired t-test with Holm-Sidak correction). Histograms above the z-scored population activity show the distribution of timepoints for well exit (yellow) and lever press (orange) relative to cue onset. (F–I) Propranolol reduced the performance of a linear classifier trained to predict cue identity (right/left) from M2 neural activity in males and females. Graphs show classification accuracy of decoding model trained with equal number of neurons (10) and trials (10/cue type) in 150 ms bins aligned to cue onset for each group (F: female saline; G: male saline; H: female propranolol; I: male propranolol). Classification accuracy for male and female saline (blue) groups was significantly above chance starting at cue onset and persisting for the remaining 1.5 s. Classification accuracy decreased in both female and male groups after propranolol (green) with almost no performance above chance. Bars on the bottom of each graph show the onset of time bins where the classification accuracy was significantly above chance.
-
Figure 3—source data 1
Cue-evoked M2 activity.
- https://cdn.elifesciences.org/articles/85590/elife-85590-fig3-data1-v2.xlsx
Figure 4
Propranolol decreases action plan representation prior to lever press.
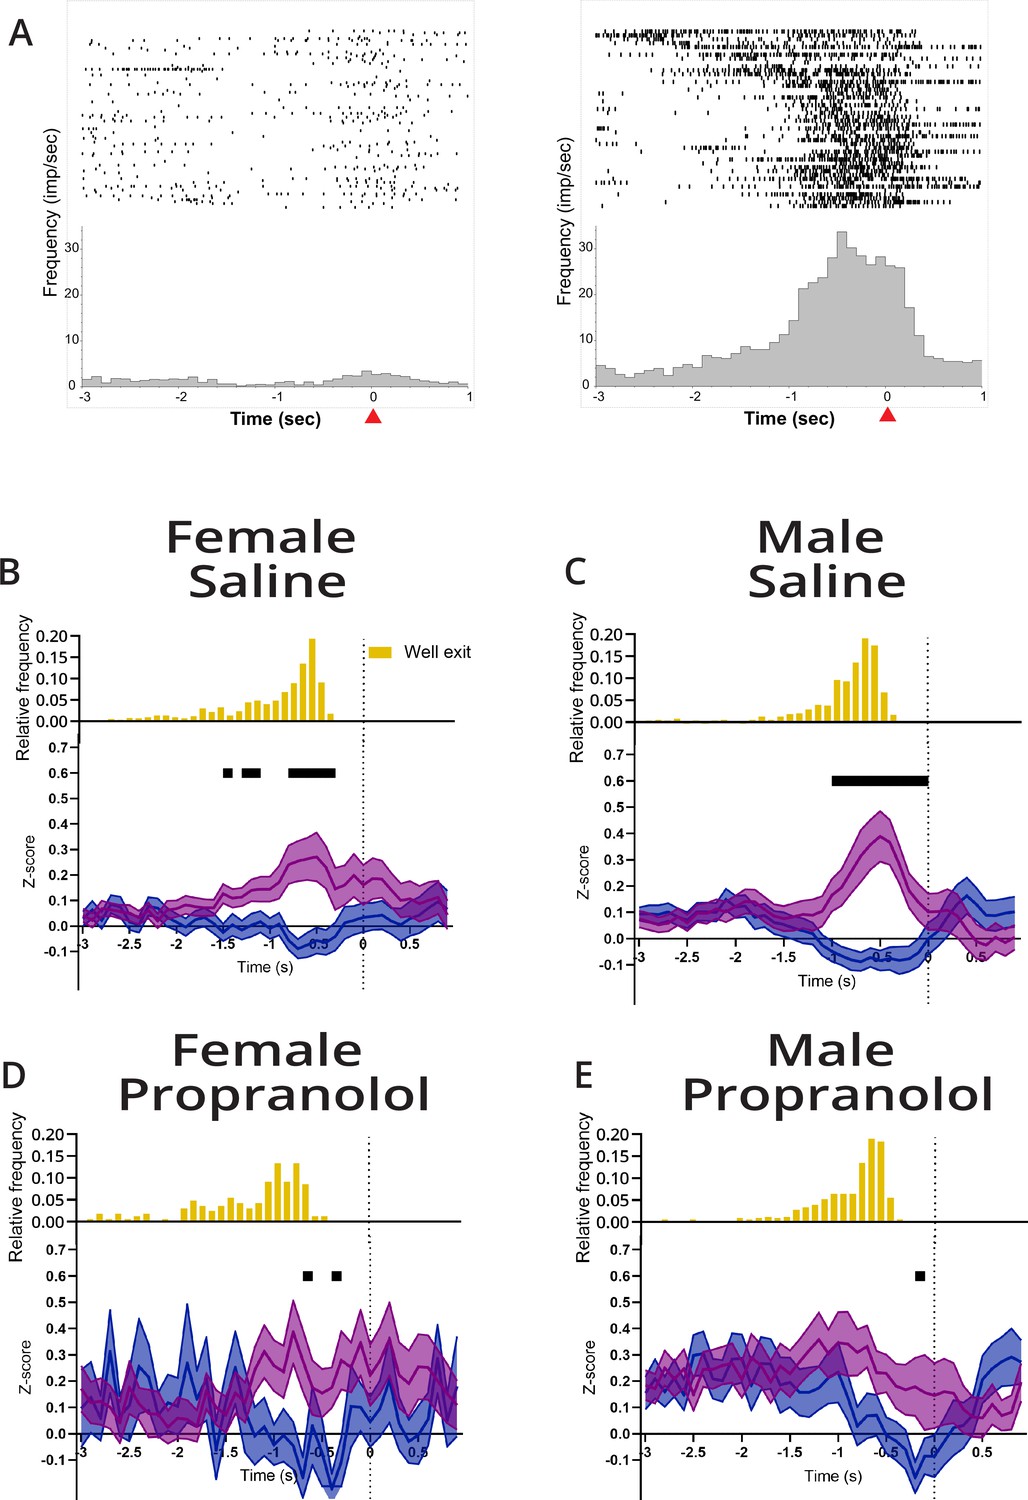
(A) Example differential responses to preferred and nonpreferred lever press. Raster (above) and perievent histogram aligned to lever press response (at t = 0 s,100 ms bins) from 3 s before lever press to 1 s after lever press. Leftmost graph shows a single-unit response to a left lever press, and the rightmost graph shows the same unit response to a right lever press. This neuron was classified as right lever press preferring, exemplified by a sustained increased in neural activity leading up to the right lever press but not left lever press. Red arrow on the x-axis identified lever press at time = 0 s. (B–E) M2 represents action plans beginning at well exit that are sustained through to action execution (lever press). Propranolol decreased M2 action planning via decreased inhibition for nonpreferred lever and decreased excitation for the target (preferred) lever in both sexes. Population neural data split by preferred (purple) and nonpreferred (blue) lever press trials separated by sex and treatment (B: saline female, n=70; C: male saline, n=71; D: propranolol female, n=27; E: propranolol male, n=48). (B, C) Both sexes showed task-related activity began ~1 s prior to lever press and remained until action execution after saline. Neural activity on preferred and nonpreferred trials shows sharp and sustained increases and decreases, respectively, in activity prior to lever press execution. (D) Propranolol decreased the difference between preferred and nonpreferred activity in females. (E) Propranolol decreased the difference between preferred and nonpreferred activity in males. Graphs show mean ± SEM of z-scores, and black bars above the graphs show timepoints where the population activity of preferred and nonpreferred activity was significantly different (paired t-test with Holm-Sidak correction). Histograms above the z-scored population activity show the distribution of well exit times, respective to lever press (yellow).
-
Figure 4—source data 1
Lever press-aligned M2 activity.
- https://cdn.elifesciences.org/articles/85590/elife-85590-fig4-data1-v2.xlsx
Figure 5
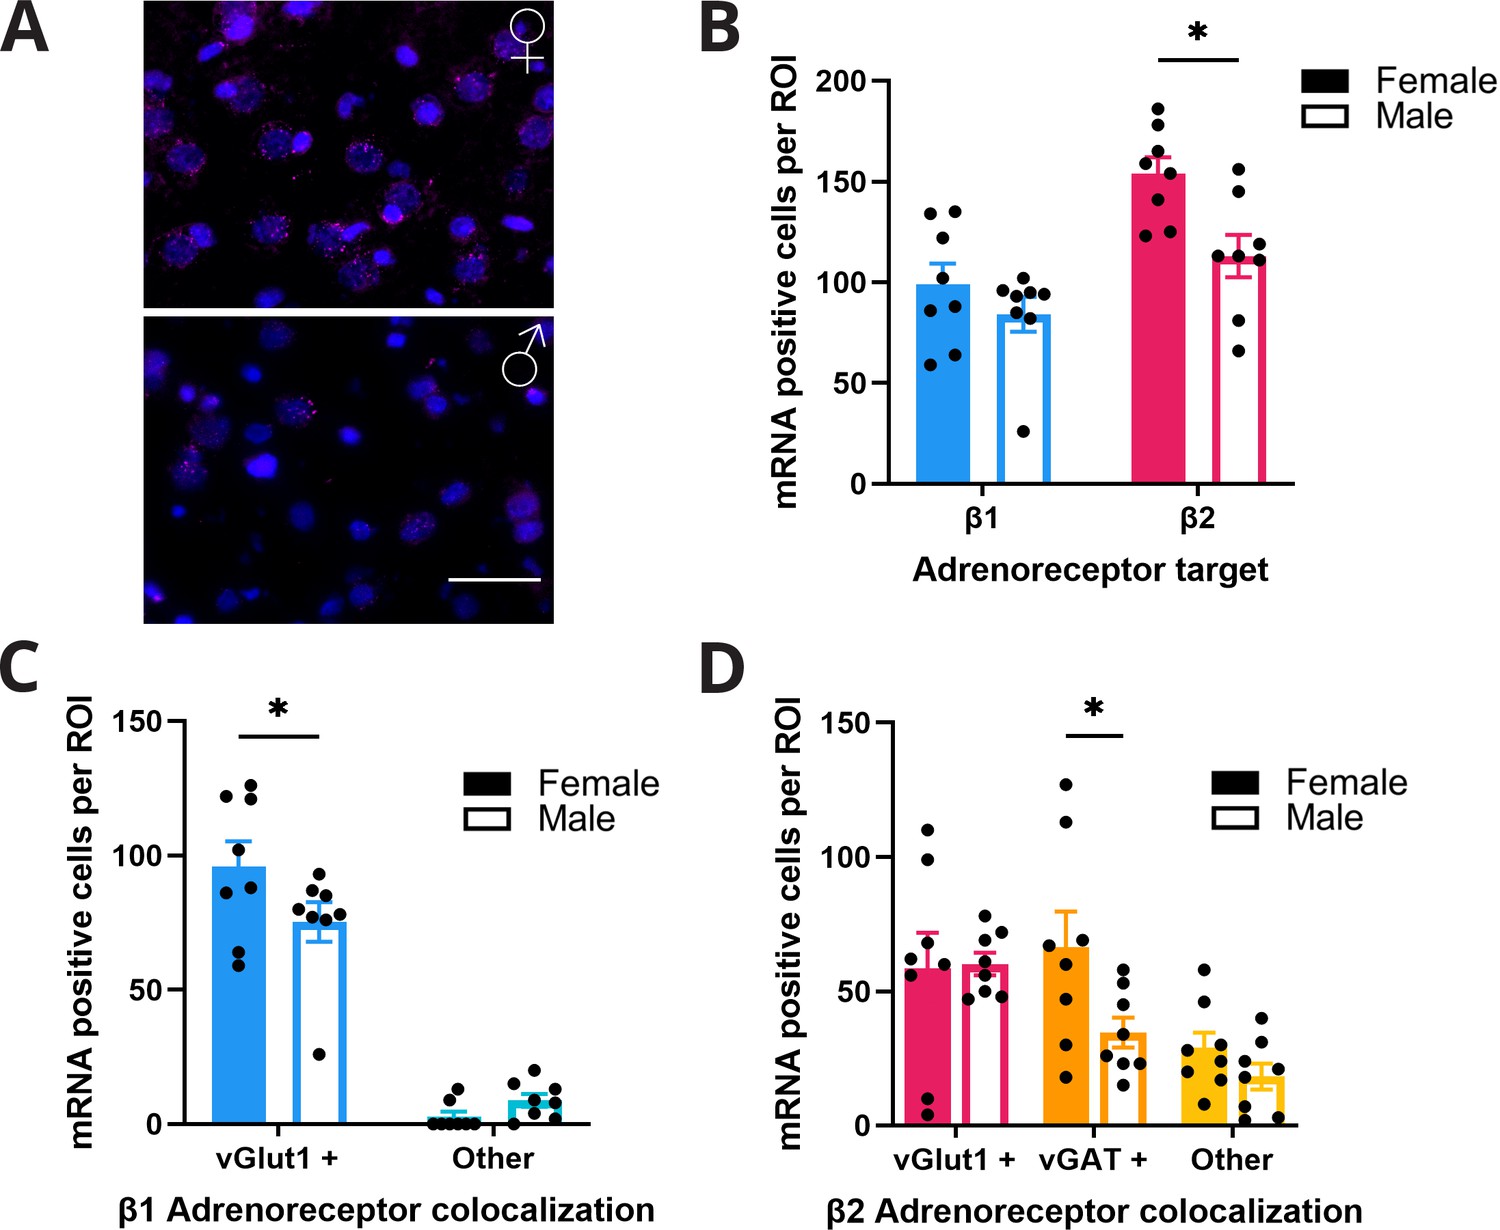
Females express higher levels of β-adrenoreceptor RNA in anterior M2.
(A) Representative figure of RNAscope labeling in anterior M2 (n=8 hemispheres, 4 animals per group) of female (top) and male (bottom) rodents. β2 RNA expression (magenta) in M2 with DAPI (blue) counterstain. Scale bar indicates 50 µm. (B) Females have higher expression of β2 receptor RNA (pink) in M2 compared to males (p=0.01; Sidak’s multiple comparisons test). There was no difference in β1 receptor RNA (blue) expression in females and males. (C) β1 receptor RNA expression was significantly higher on vGlut1+ cells (blue) in females compared to males (p=0.0453; Sidak’s multiple comparisons test). There was no sex difference in the amount of β1 receptor RNA on non-vGlut1+ cells (light blue). (D) β2 receptor RNA expression was significantly higher on vGAT+ (orange) but not vGlut1+ (pink) or other (yellow) cells in females compared to males (p=0.0401; Sidak’s multiple comparisons test).
-
Figure 5—source data 1
M2 RNAscope.
- https://cdn.elifesciences.org/articles/85590/elife-85590-fig5-data1-v2.xlsx
Author response image 1

Motivation, as measured by the number of self-initiated trials in the 2AFC task decreased over time after saline but neural representation of action plans did not.
Top: The number of self-initiated trials binned in 5-minute increments and plotted across the 40-minute session. Males (open circle) and females (closed circle) start with high rates of trial initiation, ~25trials/5min, after saline (left) which decreases over the session. This may reflect motivational changes as satiety increases over time. Trial initiations are consistent, ~10 trials/5min, throughout propranolol sessions (right) in males and females. Bottom: Although motivation to initiate trials decreased from the beginning to end of the session, the neural representations of action plans in anterior M2 did not change in females (left) or males (right). After preferred (pink) and nonpreferred (blue) cue onset, neurons show the same patterned activity during the first 10 trials (bright pink/blue) and the last 10 trials (dark pink/blue) suggesting the decreased motivation to initiate trials under saline (top figure) is not reflected in the M2 population activity.
Additional files
Download links
A two-part list of links to download the article, or parts of the article, in various formats.
Downloads (link to download the article as PDF)
Open citations (links to open the citations from this article in various online reference manager services)
Cite this article (links to download the citations from this article in formats compatible with various reference manager tools)
Sex-dependent noradrenergic modulation of premotor cortex during decision-making
eLife 12:e85590.
https://doi.org/10.7554/eLife.85590


