Gene editing and scalable functional genomic screening in Leishmania species using the CRISPR/Cas9 cytosine base editor toolbox LeishBASEedit
- Department of Cell and Developmental Biology, Biocentre, University of Würzburg, Germany
Figures
Figure 1
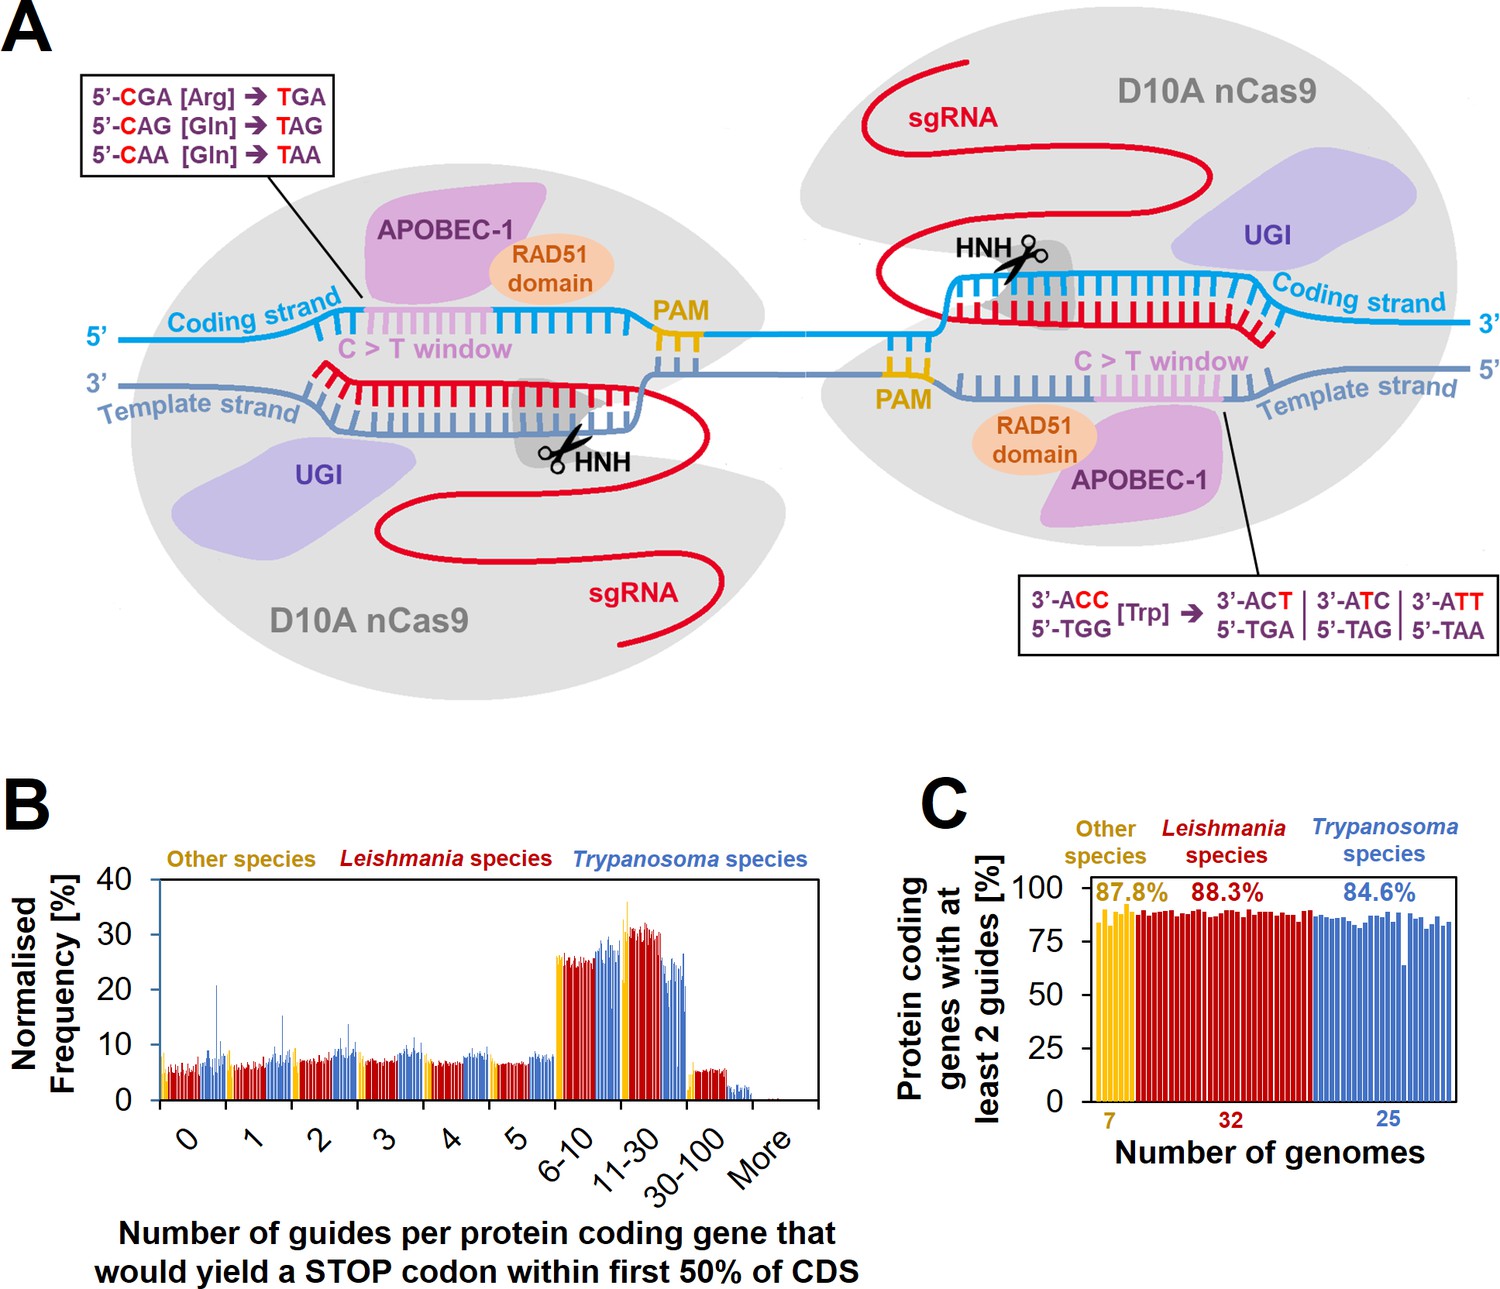
Cytosine base editing (CBE) in Leishmania and other kinetoplastids.
(A) Schematic of hyBE4max CBE, consisting of D10A nCas9 with an HNH endonuclease domain (grey), a deaminase domain (APOBEC-1 [Apolipoprotein B mRNA editing enzyme catalytic polypeptide 1], pink), two uracil glycosylase inhibitor (UGI) monomers (purple), and a RAD51 ssDBD (orange). The editing window is located on the PAM sequence containing strand (yellow) at positions 4–12 (purple). Codons for arginine, tryptophan, or glutamine, can be edited into STOP codons, as shown in the text boxes. While one arginine and two glutamine codons are edited on the coding strand (light blue) into one STOP codon each, the one tryptophan codon on the template strand (dark blue) can be edited into three STOP codons. Suitable single-guide RNAs (sgRNAs) that would convert these four codons into STOP codons were designed for 64 kinetoplastid species. (B) The number of guides per protein-coding gene that yield a STOP codon within the first 50% of the CDS. (C) The percentage of protein-coding genes that could be targeted by at least two guides.
Figure 2 with 3 supplements
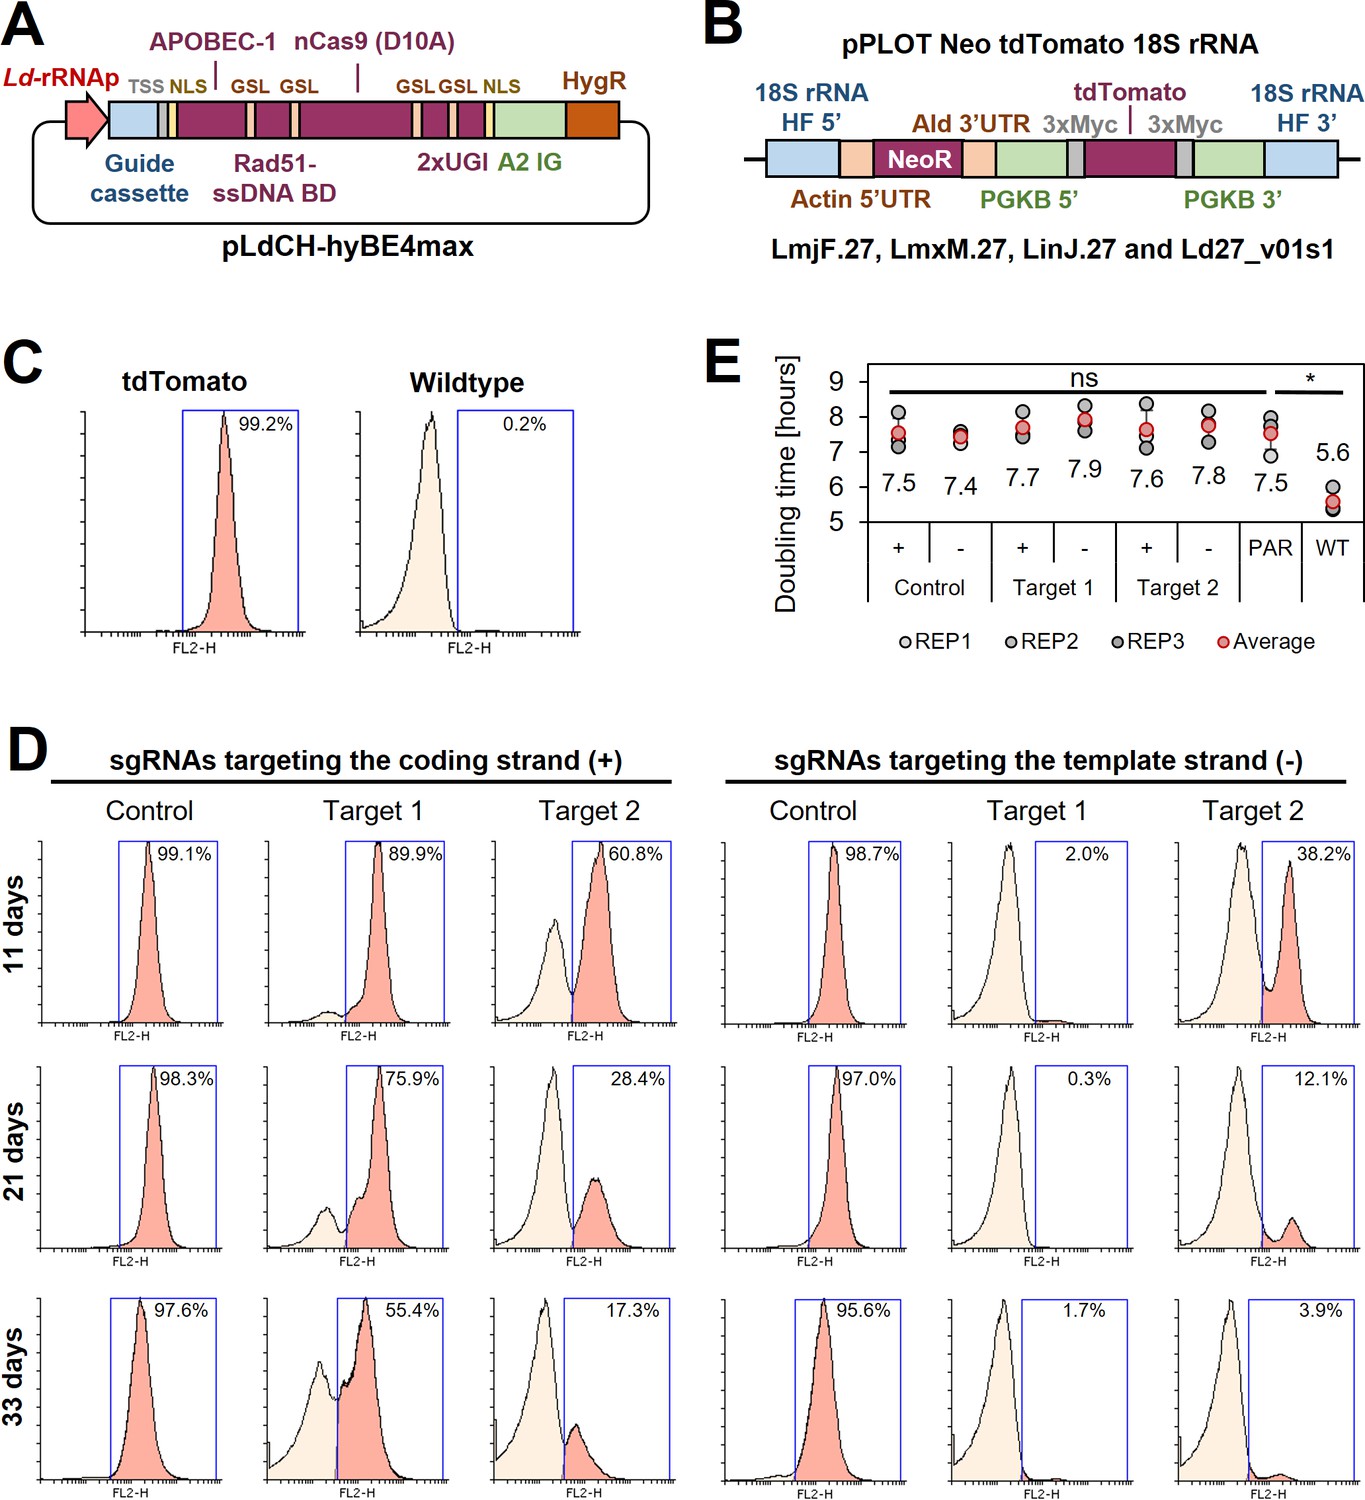
Cytosine base editing in L. major using an episomal hyBE4max expression constructs.
(A) Schematic of pLdCH-hyBE4max plasmid, containing (from left to right) a L. donovani-derived ribosomal RNA (rRNA) promoter, single-guide RNA (sgRNA) expression cassette, hepatitis delta virus (HDV) ribozyme containing transsplice sequence (TSS), SV40 NLS, APOBEC-1 domain (ssDNA-specific cytidine deaminase), RAD51 ssDBD surrounded by two glycine–serine linkers (GSL), nCas9 (D10A) protein, two uracil glycosylase inhibitor (UGI) monomers tethered via GSL, nucleoplasmin NLS, L. donovani-derived A2 intergenic sequence, and hygromycin resistance marker. (B) Schematic of a pPLOT expression construct as described in Beneke et al., 2017, fused to two homology flanks for integration into the 18S rRNA locus on chromosome 27 (TriTrypDB [Aslett et al., 2010] release 59 coordinates: LmjF.27:989,898–991,525, LmjF.27:1,001,798–1,003,425; LmjF.27:1,013,829–1,015,456; LmjF.27:1,028,462–1,030,089; LmjF.27:1,041,477–1,043,104; LmjF.27:1,052,607–1,054,234; LmxM.27:982,640–984,268; LinJ.27:1,068,199–1,069,826; LinJ.27:1,078,759–1,080,386; LinJ.27:1,093,368–1,094,995; Ld27_v01s1:1,021,892–1,020,265). (C) FACS (fluorescence-activated cell sorting) plot showing tdTomato-expressing and wildtype L. major parasites. (D) FACS plot of tdTomato-expressing L. major parasites, transfected with pLdCH-hyBE4max-tdTomato targeting plasmids (see description main text). Cells were analysed 11, 21, and 33 days post transfection. Percentages in (C) and (D) represent the remaining proportion of tdTomato-expressing cells. (E) Doubling times for analysed parasites in (C) and (D). Error bars show standard deviations of triplicates. PAR: tdTomato-expressing cells; WT: wildtype cells. Asterisks indicate Student’s t-test: *p > 0.05.
Figure 2—figure supplement 1
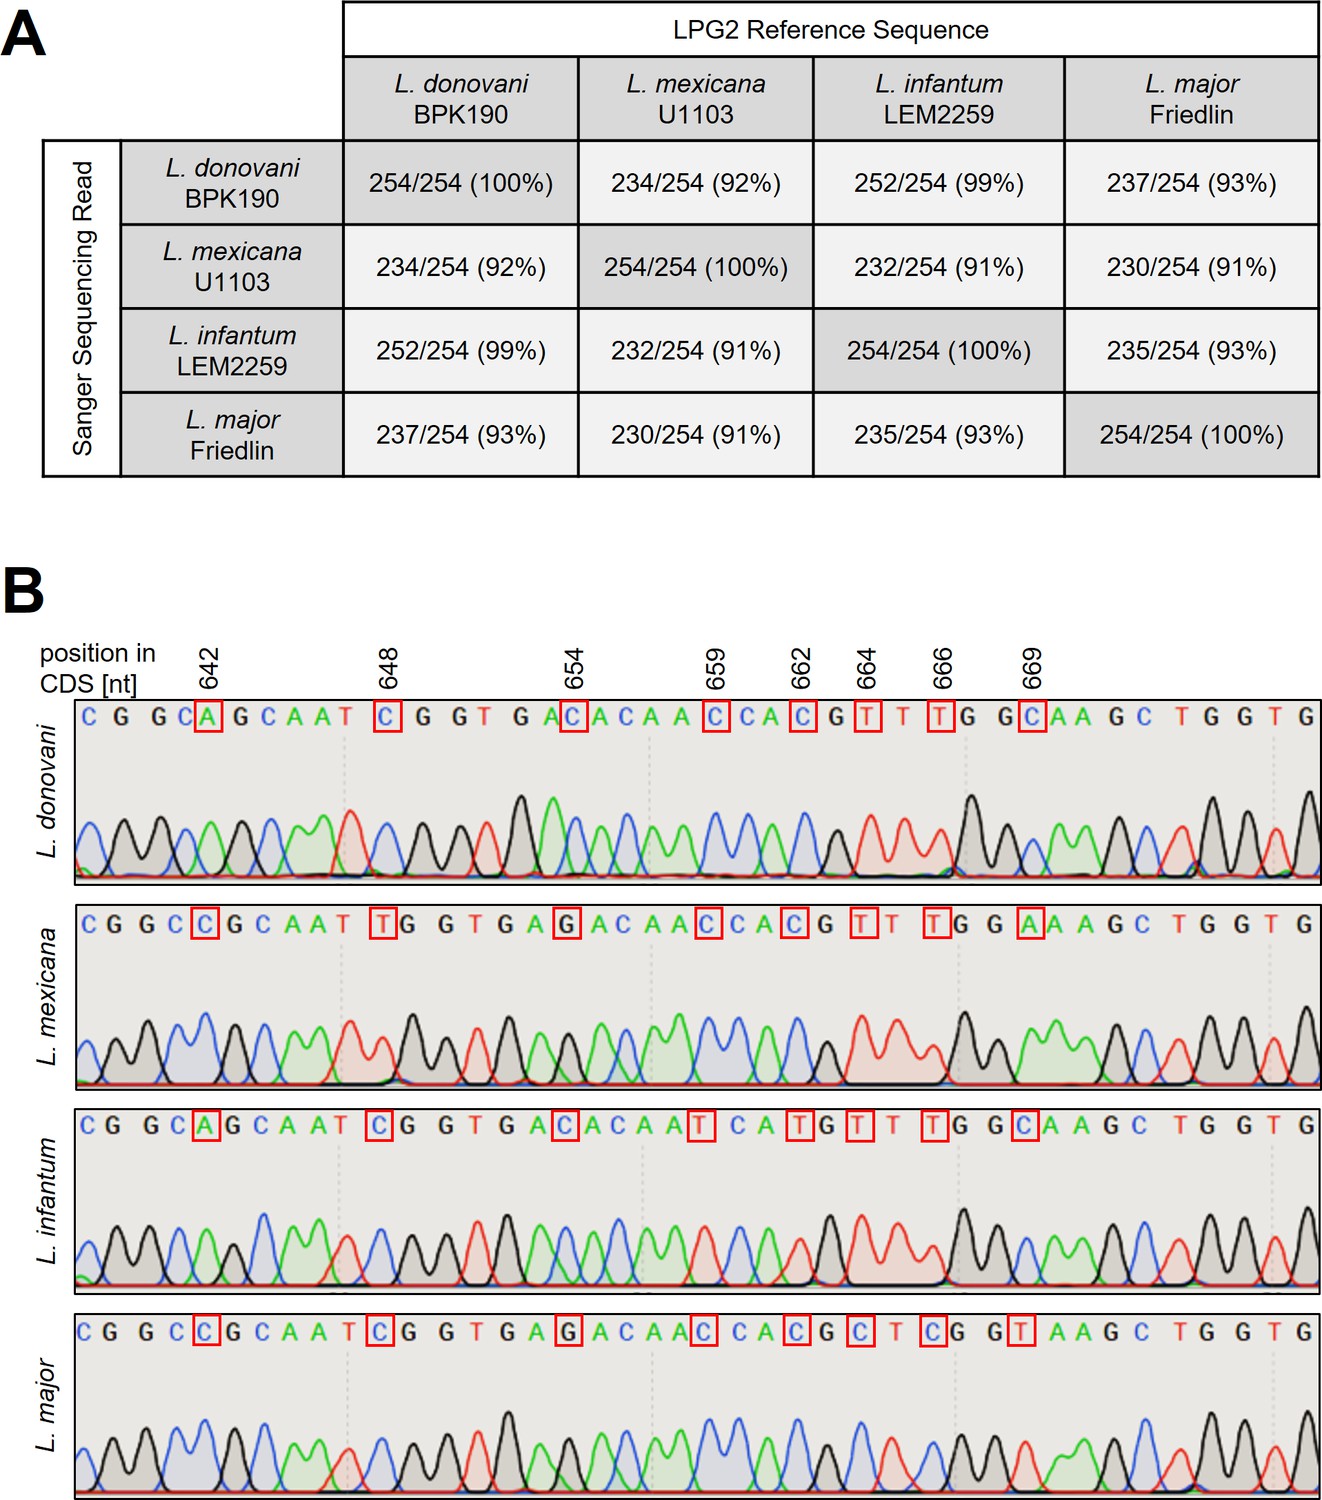
Confirming identity of Leishmania species used in this study.
LPG2 locus was amplified and Sanger sequenced. Sanger sequencing reads were then aligned to LPG2 reference sequences of each species. Shown are sequence identities (A) and an alignment across all four species (B), highlighting a species-dependent section of the LPG2 open reading frame (ORF).
-
Figure 2—figure supplement 1—source data 1
Data used for table shown in Figure 2—figure supplement 1.
As described in Figure 2—figure supplement 1, the LPG2 locus was amplified and Sanger sequenced. Sanger sequencing reads were then aligned to LPG2 reference sequences of each species. Shown are sequence identities.
- https://cdn.elifesciences.org/articles/85605/elife-85605-fig2-figsupp1-data1-v1.xlsx
Figure 2—figure supplement 2
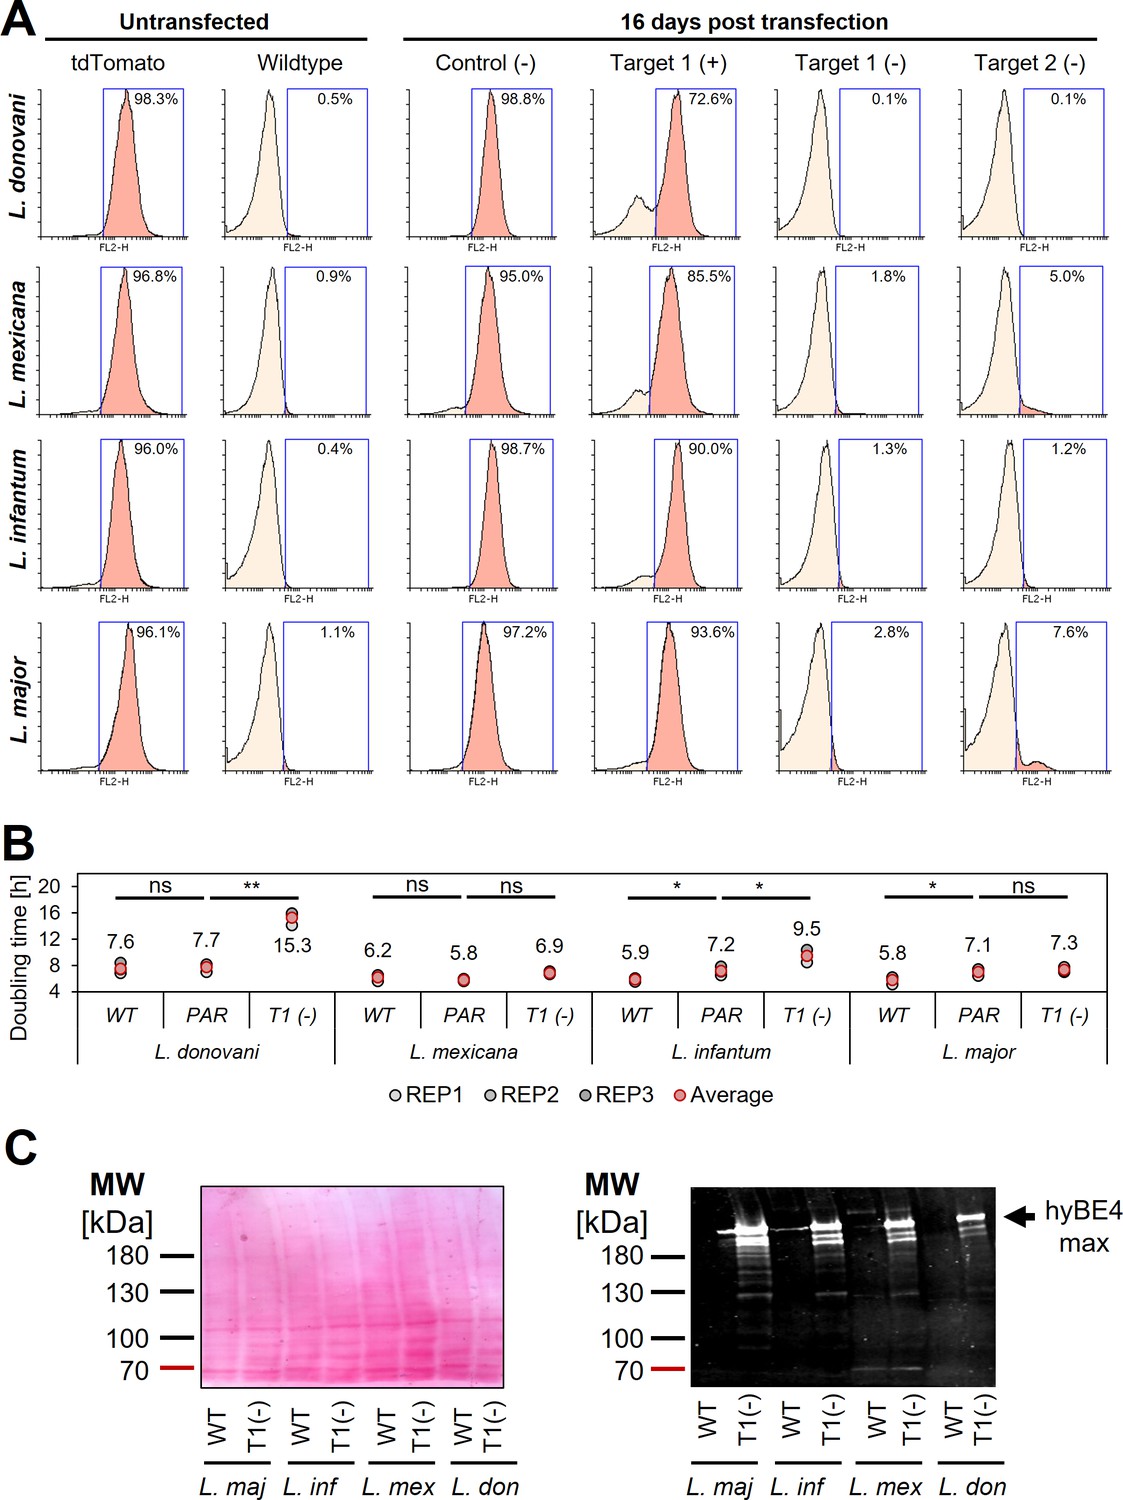
Cytosine base editing in L. donovani, L. mexicana, L. infantum, and L. major using episomal hyBE4max expression constructs.
(A) FACS plot showing tdTomato-expressing and wildtype Leishmania parasites (left panel, untransfected), as well as tdTomato-expressing Leishmania parasites, transfected with pLdCH-hyBE4max-tdTomato targeting plasmids (see description main text). Cells are analysed 16 days post transfection. Percentage represents remaining proportion of tdTomato-expressing cells. (B) Doubling times for analysed parasites in (A). Error bars show standard deviations of triplicates. PAR: tdTomato-expressing cells; WT: wildtype cells. T1(−): TdTomato-expressing cells transfected with pLdCH-hyBE4max-tdTomato targeting plasmid (Target 1 on template strand). Asterisks indicate Student’s t-test: *p > 0.05, **p > 0.005. (C) Left panel: Ponceau stain. Right panel: Cas9 detecting western blot, indicating the size of hyBE4max. MW: molecular weight in kDa. Protein samples from cell lines as indicated in (B).
Figure 2—figure supplement 3
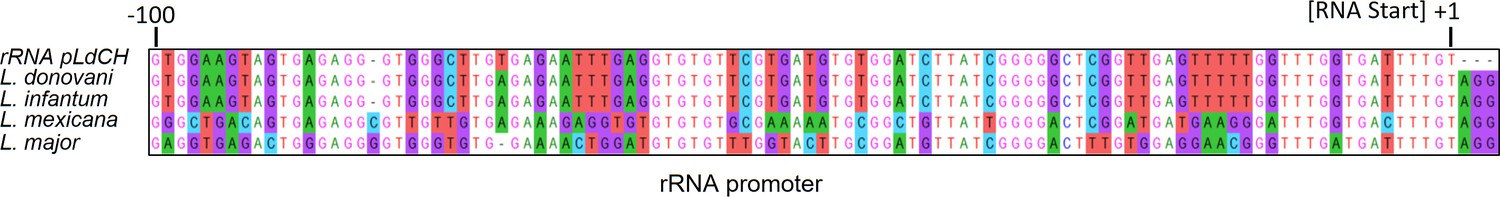
Alignment of Leishmania ribosomal RNA (rRNA) promoter.
The rRNA promoter derived from pLdCH (Zhang et al., 2017), which is used in pLdCH-hyBE4max, was aligned against the rRNA promoter from L. donovani, L. infantum, L. mexicana, and L. major. The first transcribed nucleotide (transcription start) is indicated as +1.
Figure 3 with 2 supplements
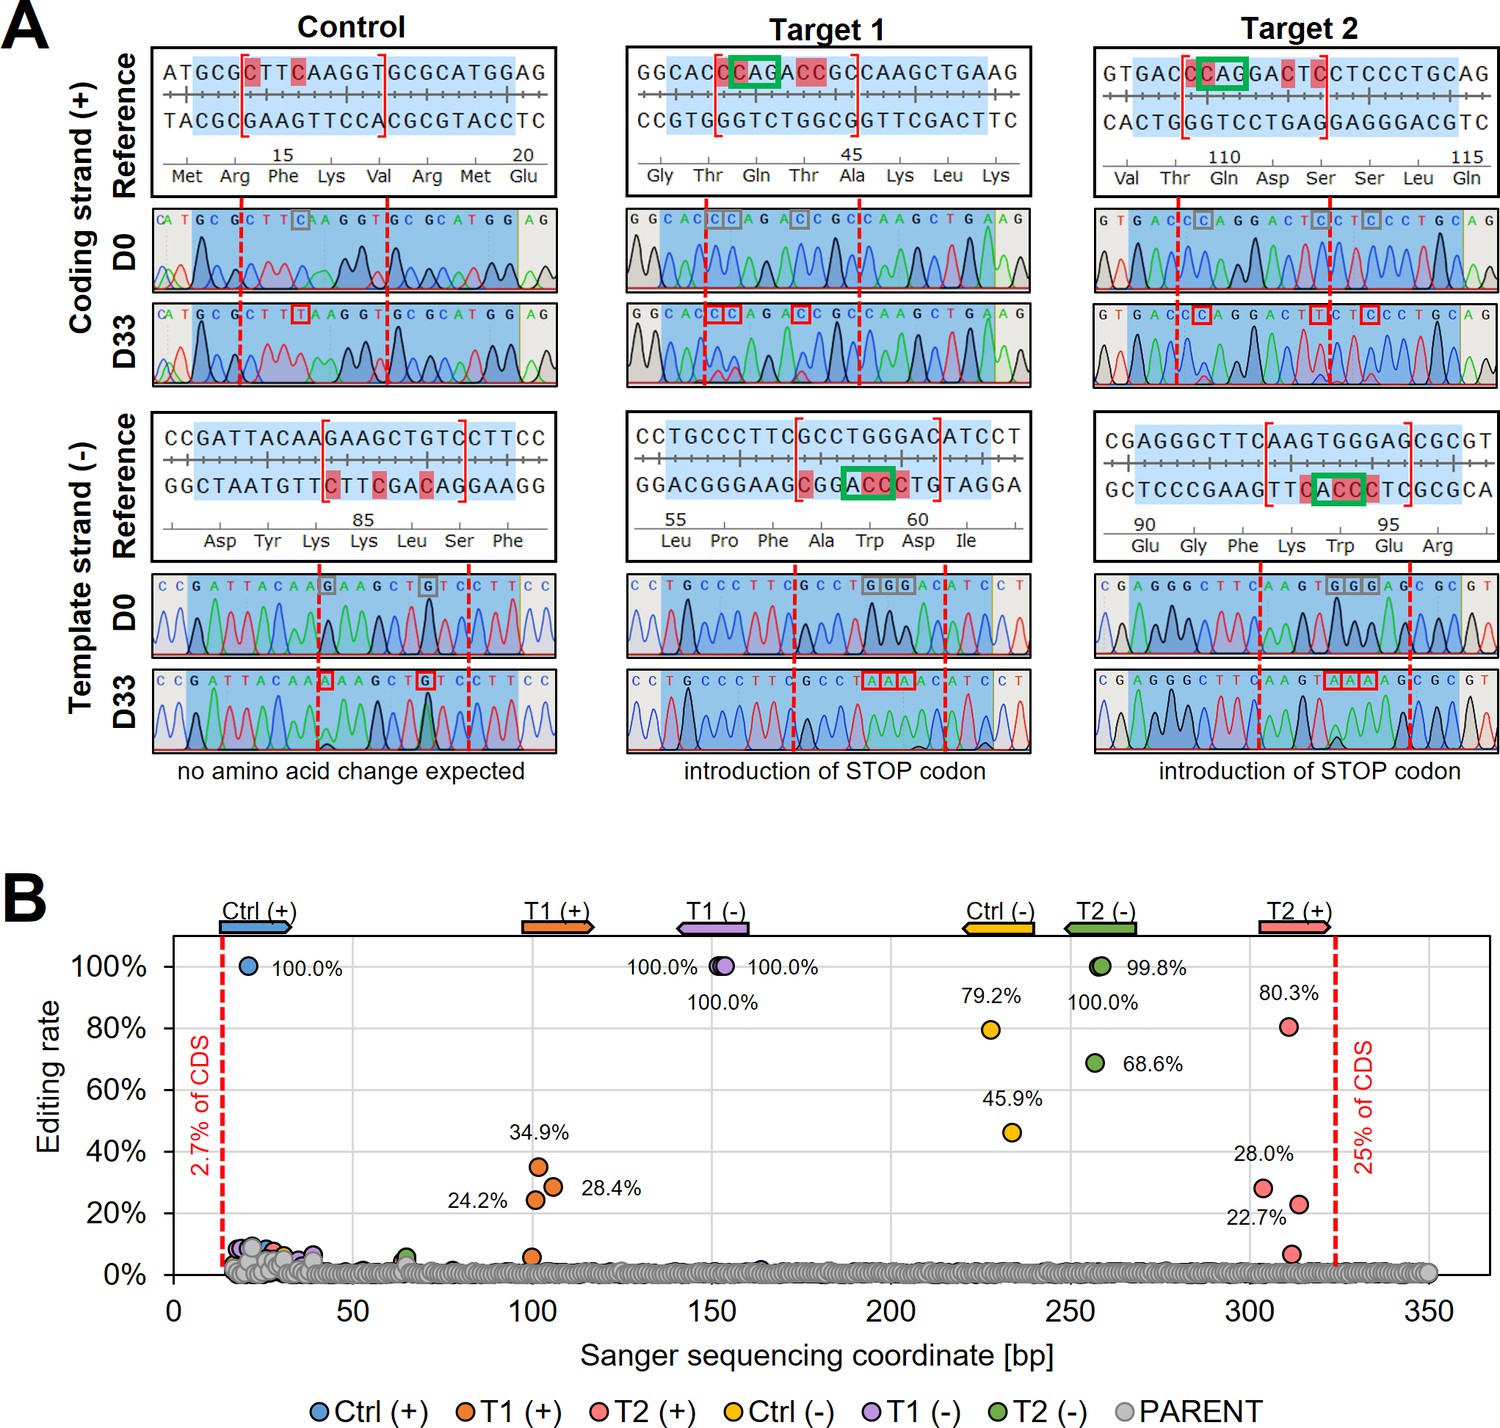
Sanger sequencing following cytosine base editing in L. major.
(A) Alignment of reference sequences (Reference) with Sanger sequencing trace plots before transfection of pLdCH-hyBE4max-tdTomato targeting plasmids (D0) and 33 days after transfection (D33). Six guide loci are shown as described in the main text. Blue shading: 20nt guide target sequence. Red dotted lines: 4–12 editing window. Red marked nucleotides: expected cytosine to thymine conversion. Red boxed nucleotides: edited nucleotides. (B) Discordance between D0 and D33 trace plots from (A) was measured and plotted as editing rate versus Sanger sequencing coordinates. Each data point represents one C to T conversion. The position and orientation of each guide are indicated above, with the first guide sequence starting after 2.7% of the CDS and the last guide sequence ending after 25% of the CDS.
Figure 3—figure supplement 1
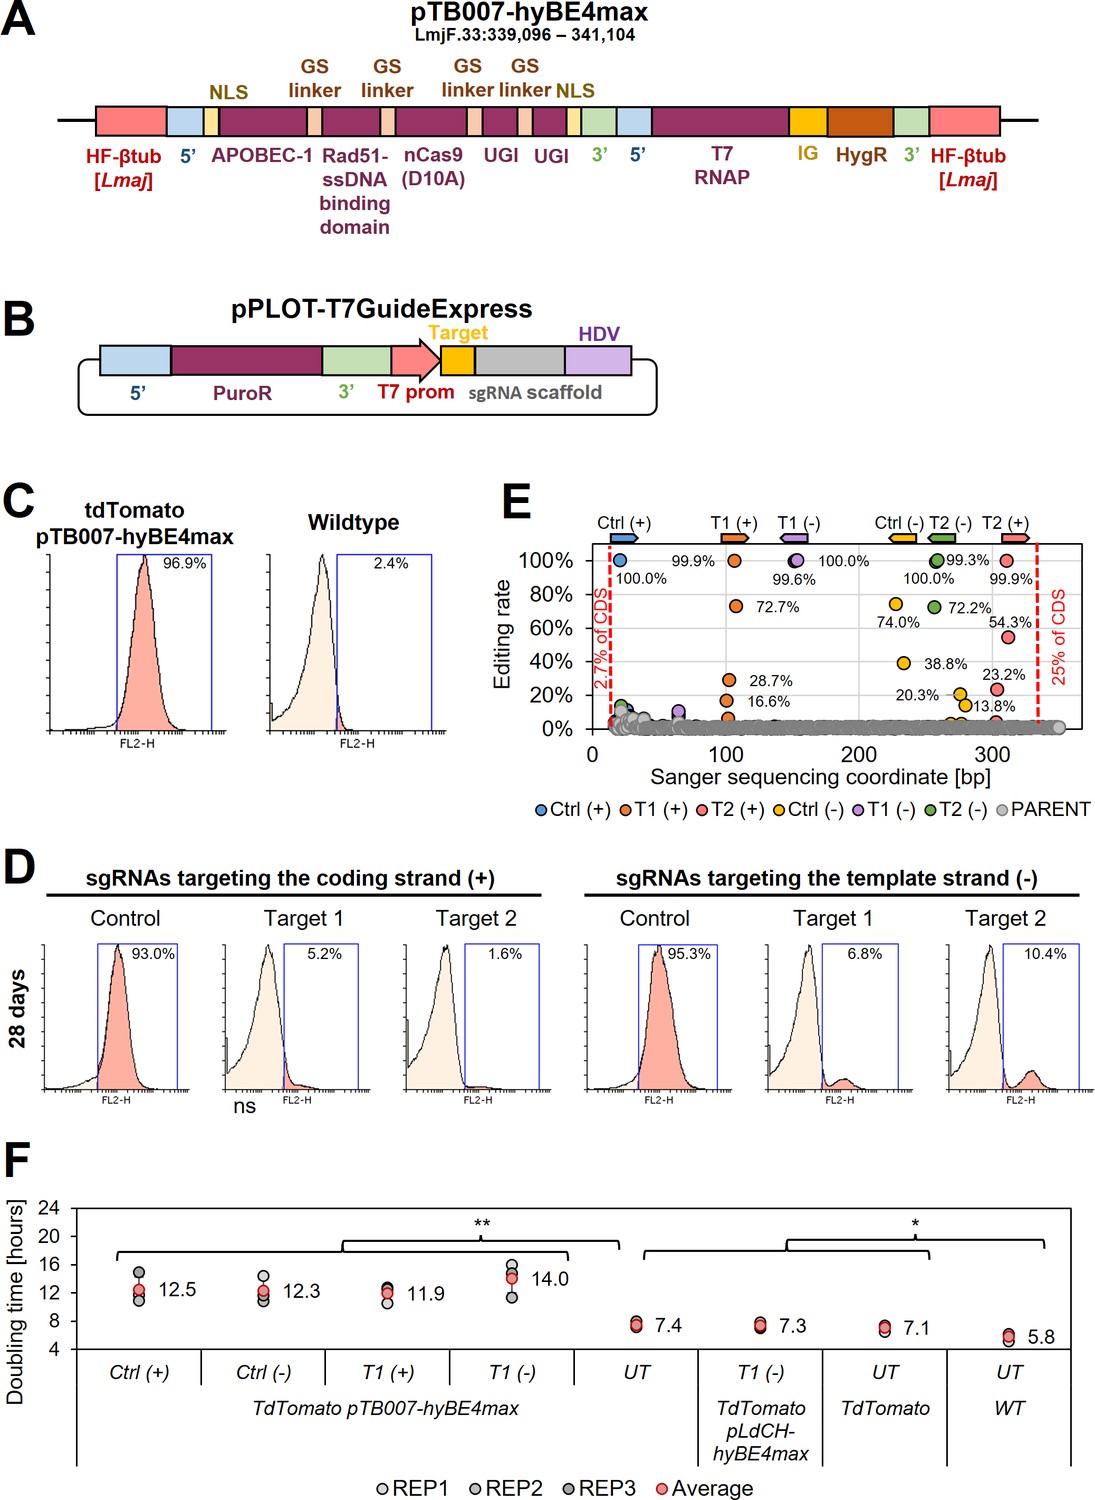
Cytosine base editing in L. major using stable hyBE4max and episomal single-guide RNA (sgRNA) expression.
(A) Schematic of pTB007-hyBE4max construct, containing (from left to right) a Cas9 and T7 RNAP expression cassette as described in Beneke et al., 2017. Cas9 has been exchanged with hyBE4max elements described in Figure 2A. The construct is integrated into the β-tubulin locus (LmjF.33:339,096–341,104). (B) Episomal sgRNA expression cassette (pPLOT-T7GuideExpress), containing a puromycin resistance marker cassette, a T7 RNAP promoter, 20nt guide target sequence, sgRNA Cas9 scaffold sequence, and hepatitis delta virus (HDV) ribozyme sequence. (C) FACS plot showing tdTomato and pTB007-hyBE4max-expressing L. major cells (left), as well as wildtype parasites (right). (D) FACS plot of tdTomato and pTB007-hyBE4max-expressing L. major parasites, transfected with pPLOT-T7GuideExpress-tdTomato targeting plasmids (see description main text). Cells are analysed 28 days post transfection. Percentage in (C) and (D) represents remaining proportion of tdTomato-expressing cells. (E) Discordance between trace plots before transfection and 28 days after transfection was measured using ICE (Synthego) and plotted as editing rate over Sanger sequencing coordinates. Each data point represents one C to T conversion. The position and orientation of each guide are indicated above, with the first guide sequence starting after 2.7% of the CDS and the last guide sequence ending after 25% of the CDS. (F) Doubling times for analysed parasites in (C) and (D). Error bars show standard deviations of triplicates. UT: cells not transfected with T7GuideExpress-tdTomato targeting plasmids; WT: wildtype cells. Asterisks indicate Student’s t-test: *p > 0.05, **p > 0.005.
Figure 3—figure supplement 2
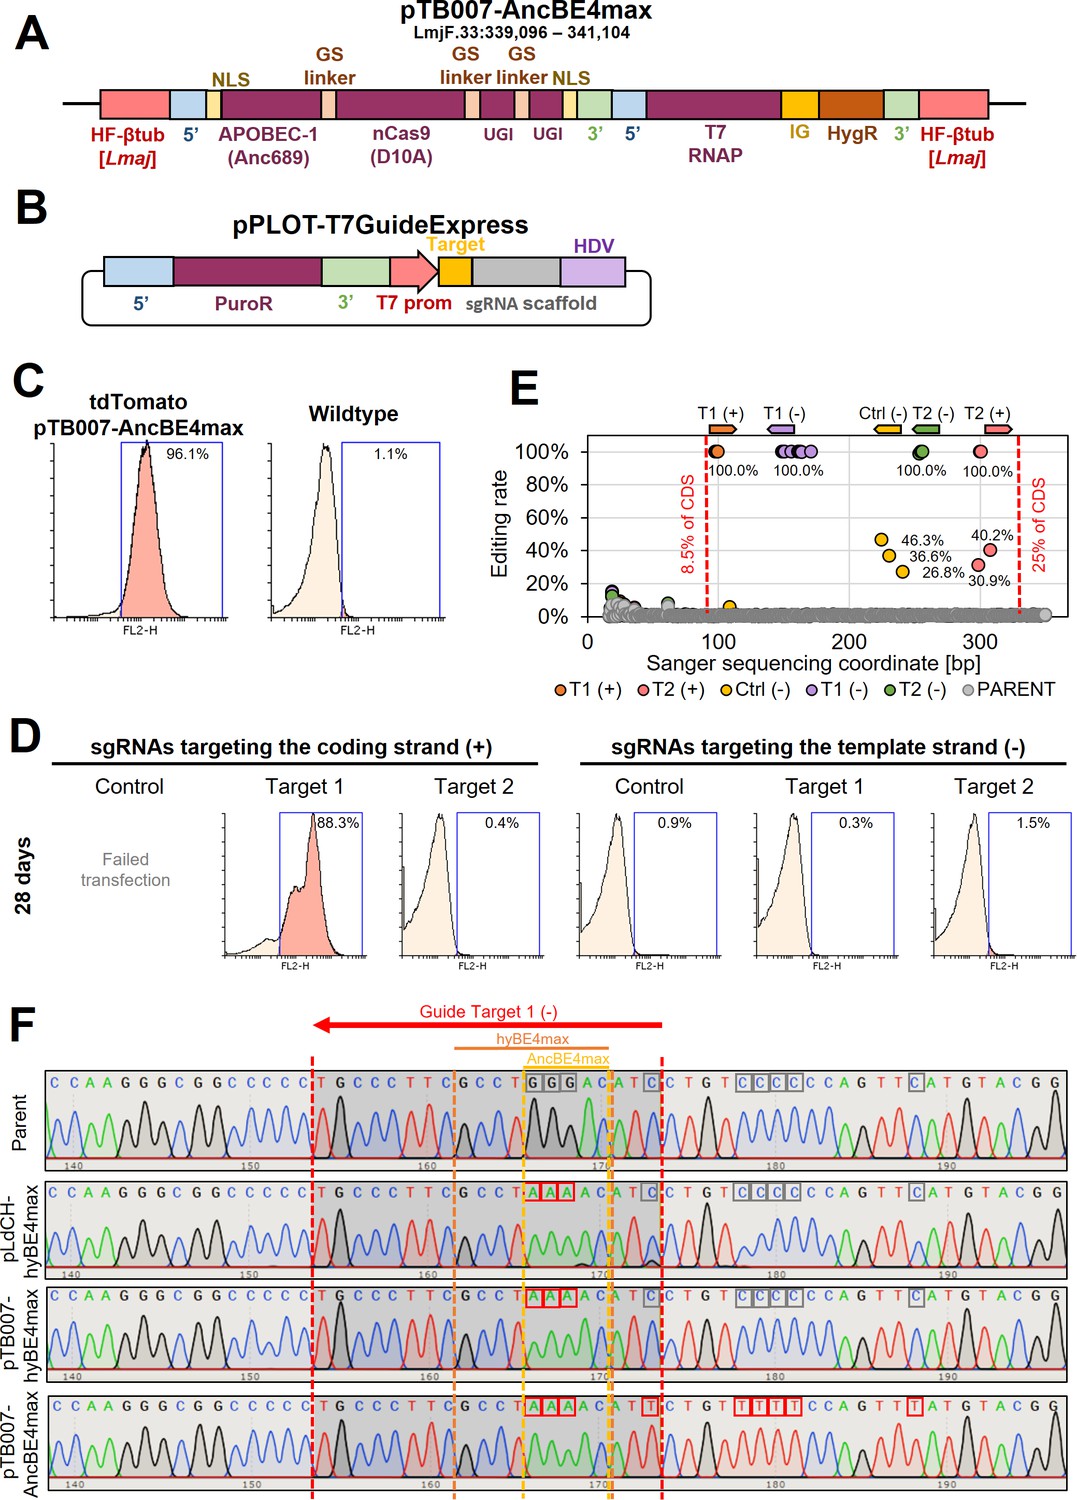
Cytosine base editing in L. major using stable AncBE4max and episomal single-guide RNA (sgRNA) expression.
(A) Schematic of pTB007-AncBE4max construct, containing (from left to right) a Cas9 and T7 RNAP expression cassette as described in Beneke et al., 2017. Cas9 has been exchanged with AncBE4max elements, containing a SV40 NLS, APOBEC-1 variant domain (Anc689), nCas9 (D10A) protein, two uracil glycosylase inhibitor (UGI) monomers tethered via GSL and nucleoplasmin NLS. The construct is integrated into the β-tubulin locus (LmjF.33:339,096–341,104). (B) Episomal sgRNA expression cassette as described in Figure 3—figure supplement 1B. (C) FACS plot showing tdTomato and pTB007-AncBE4max-expressing L. major cells (left), as well as wildtype parasites (right). (D) FACS plot of tdTomato and pTB007-AncBE4max-expressing L. major parasites, transfected with pPLOT-T7GuideExpress-tdTomato targeting plasmids. The transfection of the control guide targeting the coding strand failed. Cells are analysed 28 days post transfection. Percentage in (C) and (D) represents remaining proportion of tdTomato-expressing cells. (E) Editing rate plotted as described in Figure 3—figure supplement 1E. (F) Sanger sequencing trace plots for guide sequence locus of Target 1 (−) targeted with pLdCH-hyBE4max, pTB007-hyBE4max, and pTB007-AncBE4max. Red dotted lines: 20nt guide target sequence. Orange dotted lines: hyBE4max 4–12 editing window. Yellow dotted lines: AncBE4max 4–7 editing window. Red boxes: edited nucleotides. Grey boxes: not edited nucleotides.
Figure 4 with 4 supplements
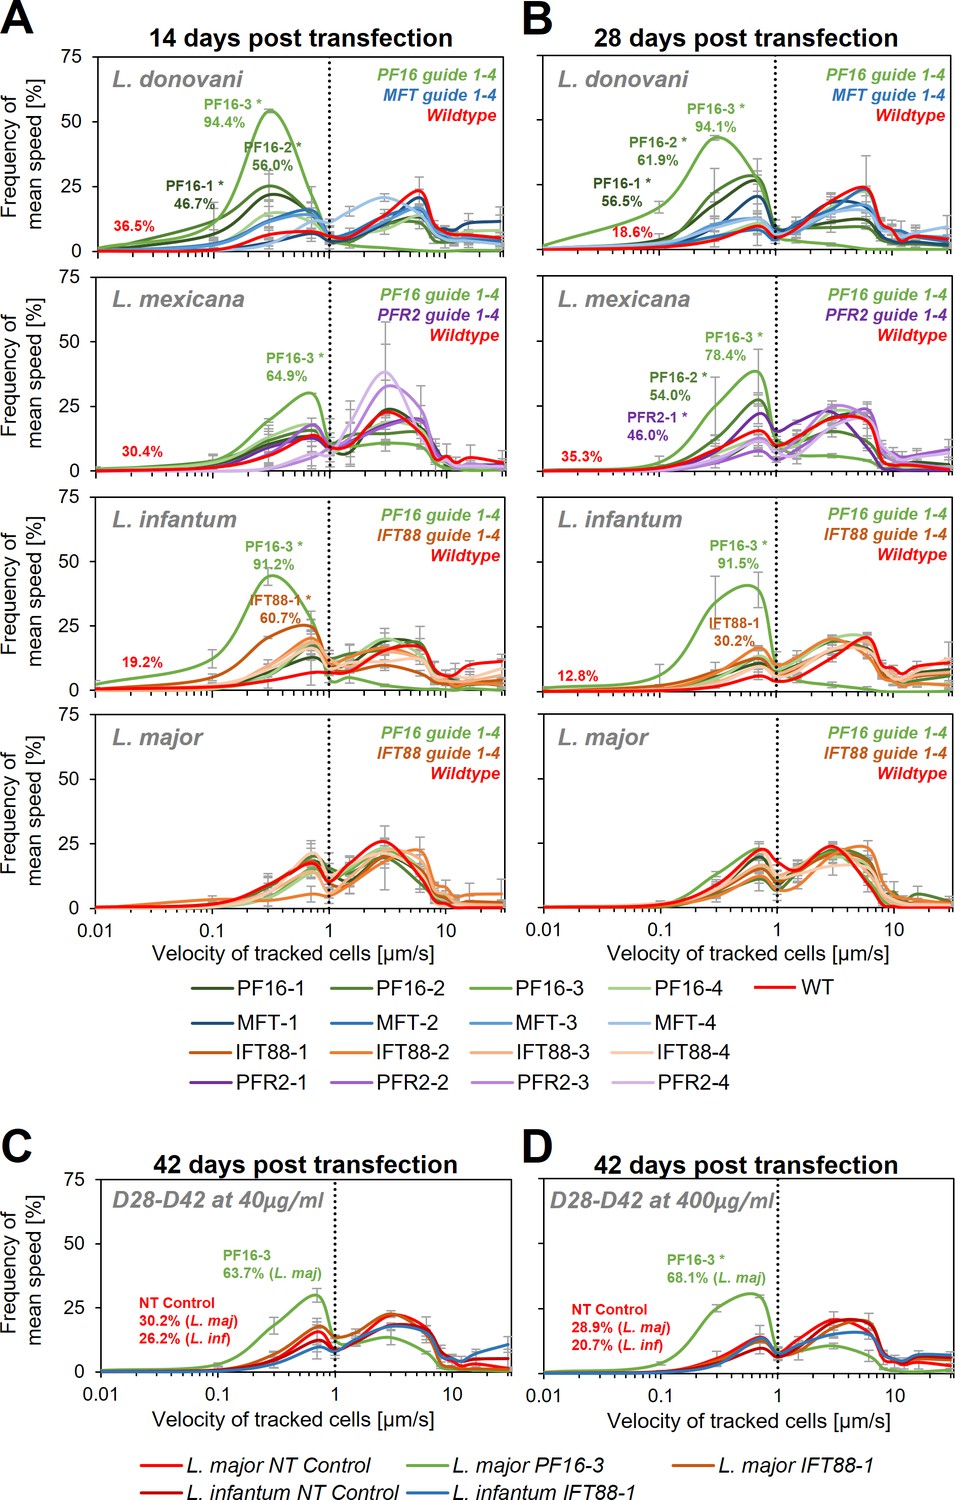
Motility analysis following hyBE4max-mediated cytosine base editing.
L. donovani, L. mexicana, L. infantum, and L. major wildtype parasites were transfected with pLdCH-hyBE4max-sgRNA expression plasmids, targeting PF16, MFT, PFR2, and IFT88 with four guides each (see main text description). Selected non-clonal populations were subjected to motility analysis and the frequency of the velocity of tracked cells was plotted (A) 14 days, (B) 28 days, and (C, D) 42 days post transfection. Cells were selected with 40 µg/ml hygromycin B until 28 days post transfection and then with both, (C) 40 and (D) 400 µg/ml. Each population was analysed using a Cramér-von Mises Test to detect any shift in the population distribution towards lower speed. Highlighted curves are marked with an asterisks when that shift was significant (for L. donovani, L. mexicana, and L. infantum: *p > 0.05, for L. major: *p > 0.01). For populations with a significant shift and for wildtype and NT controls, the overall percentage of tracked cells that have a velocity of less than 1 µm/s is highlighted. NT: non-targeting control, a wildtype transfected parasite, harbouring a pLdCH-hyBE4max-tdTomato-targeting-guide (Target 1 (−)) plasmid. Mean speed was measured in duplicates 14 days post transfection and in triplicates 28 and 42 days post transfection. Error bars show standard deviation between these replicates.
Figure 4—figure supplement 1
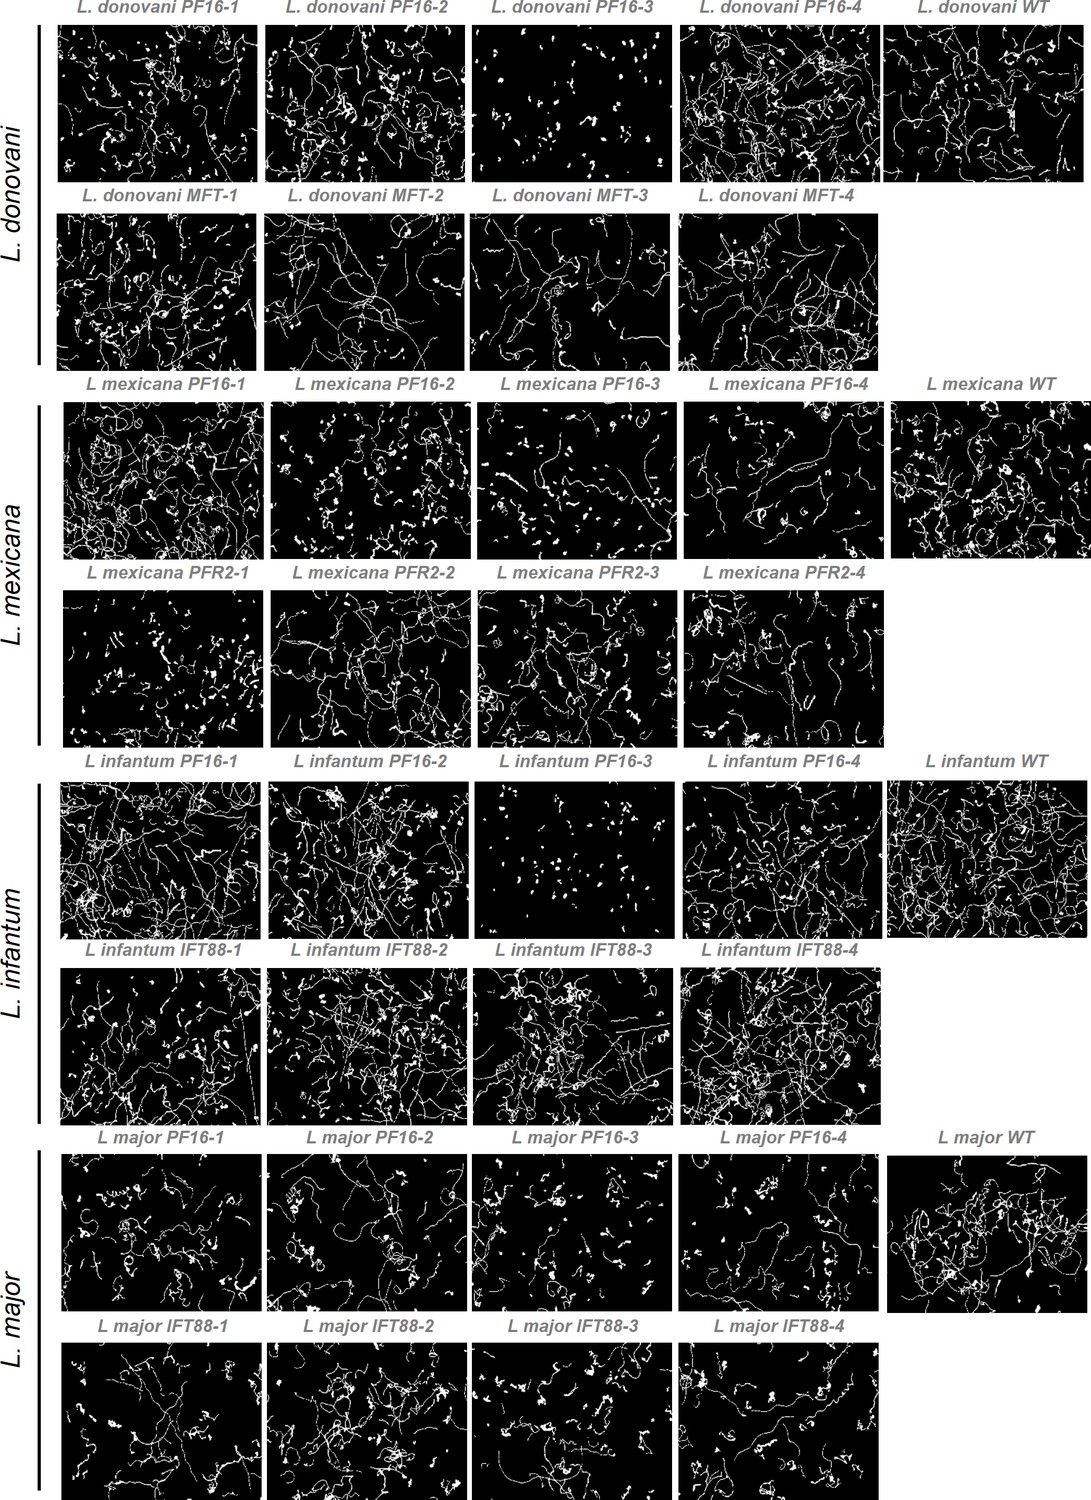
Motility tracks following hyBE4max-mediated cytosine base editing.
Motility tracks were generate from motility analysis in Figure 4, showing 100–200 tracks from cells analysed at 28 days post transfection. WT: wildtype. NT: non-targeting control, a wildtype transfected parasite, harbouring a pLdCH-hyBE4max-tdTomato-targeting-guide (Target 1 (−)) plasmid.
Figure 4—figure supplement 2
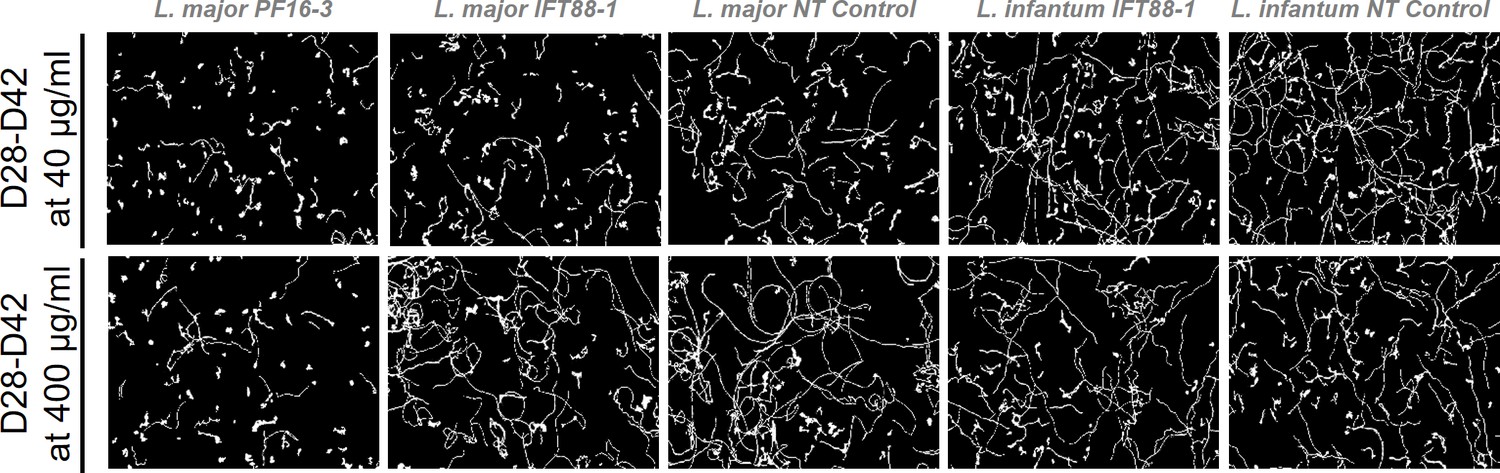
Motility tracks following hyBE4max-mediated cytosine base editing under different selection dosis.
Motility tracks were generate from motility analysis in Figure 4, showing 100–200 tracks from cells analysed at 42 days post transfection. Cells were selected with 40 µg/ml hygromycin B until 28 days post transfection and then with both, 40 and 400 µg/ml. WT: wildtype. NT: non-targeting control, a wildtype transfected parasite, harbouring a pLdCH-hyBE4max-tdTomato-targeting-guide (Target 1 (−)) plasmid.
Figure 4—figure supplement 3
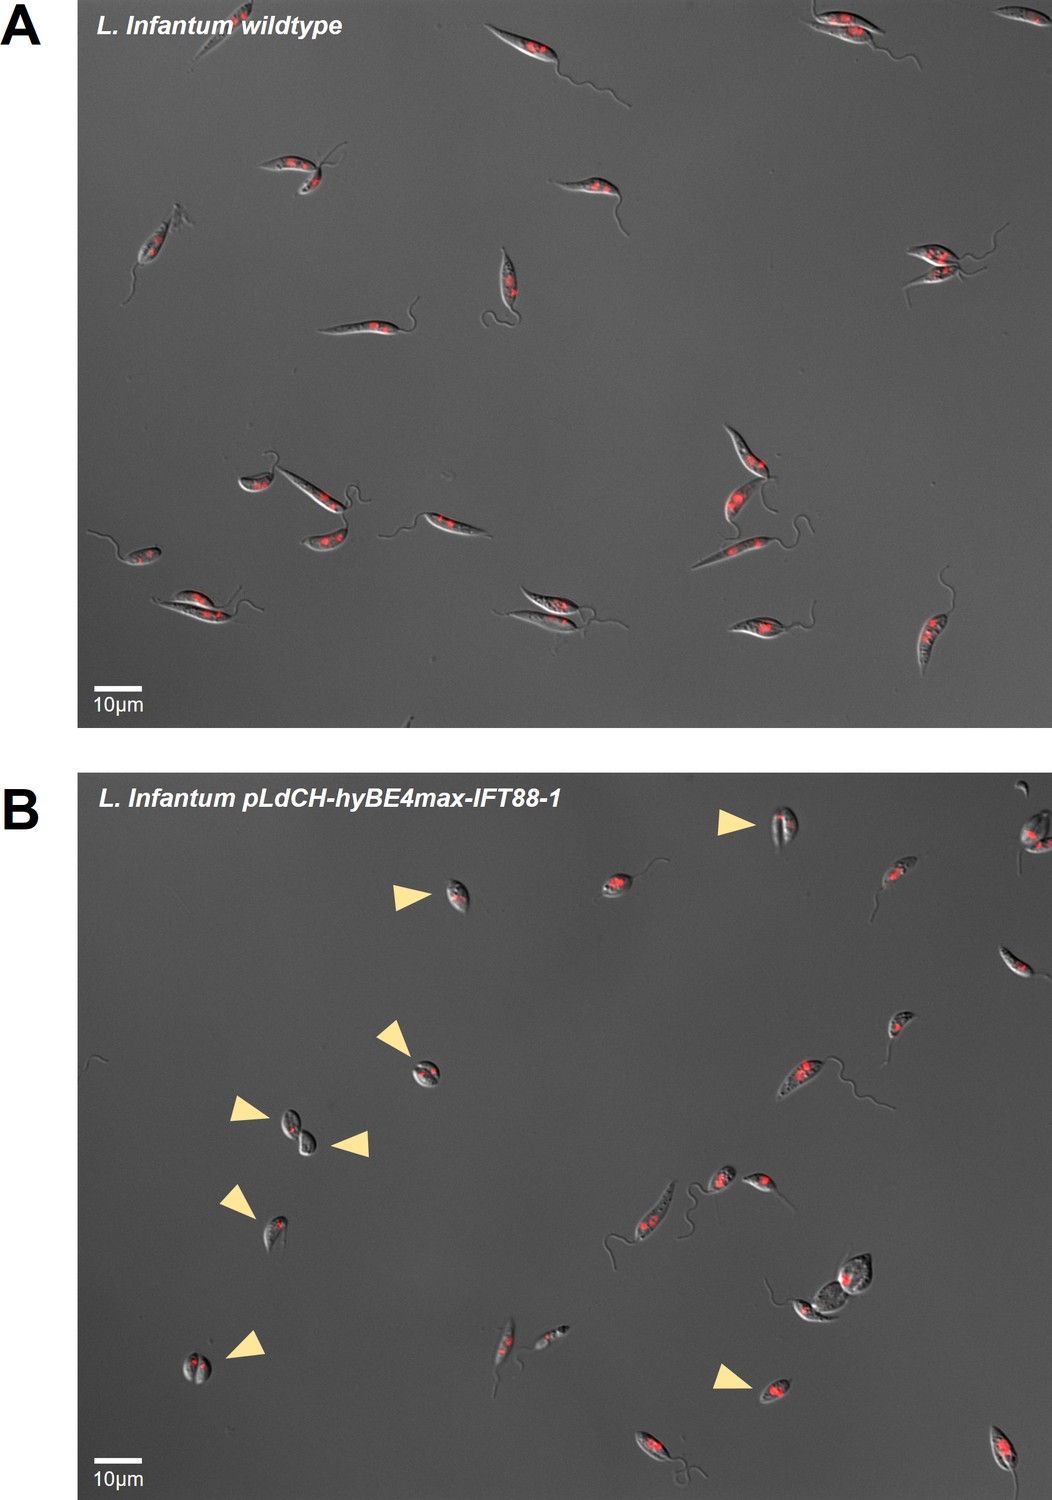
Flagellum assembly phenotype following hyBE4max IFT88 targeting.
L. infantum parasites were transfected with pLdCH-hyBE4max-sgRNA expression plasmids, targeting IFT88 (see main text description). Non-clonal transfected populations were imaged in DIC (differential interference contrast; grey) and A4 (for Hoechst DNA stain; red) channel, showing (A) L. infantum wildtype and (B) pLdCH-hyBE4max-IFT88-1 transfected parasites 14 days post transfection. Yellow arrows highlight parasites that do not possess a visible external flagellum.
Figure 4—figure supplement 4
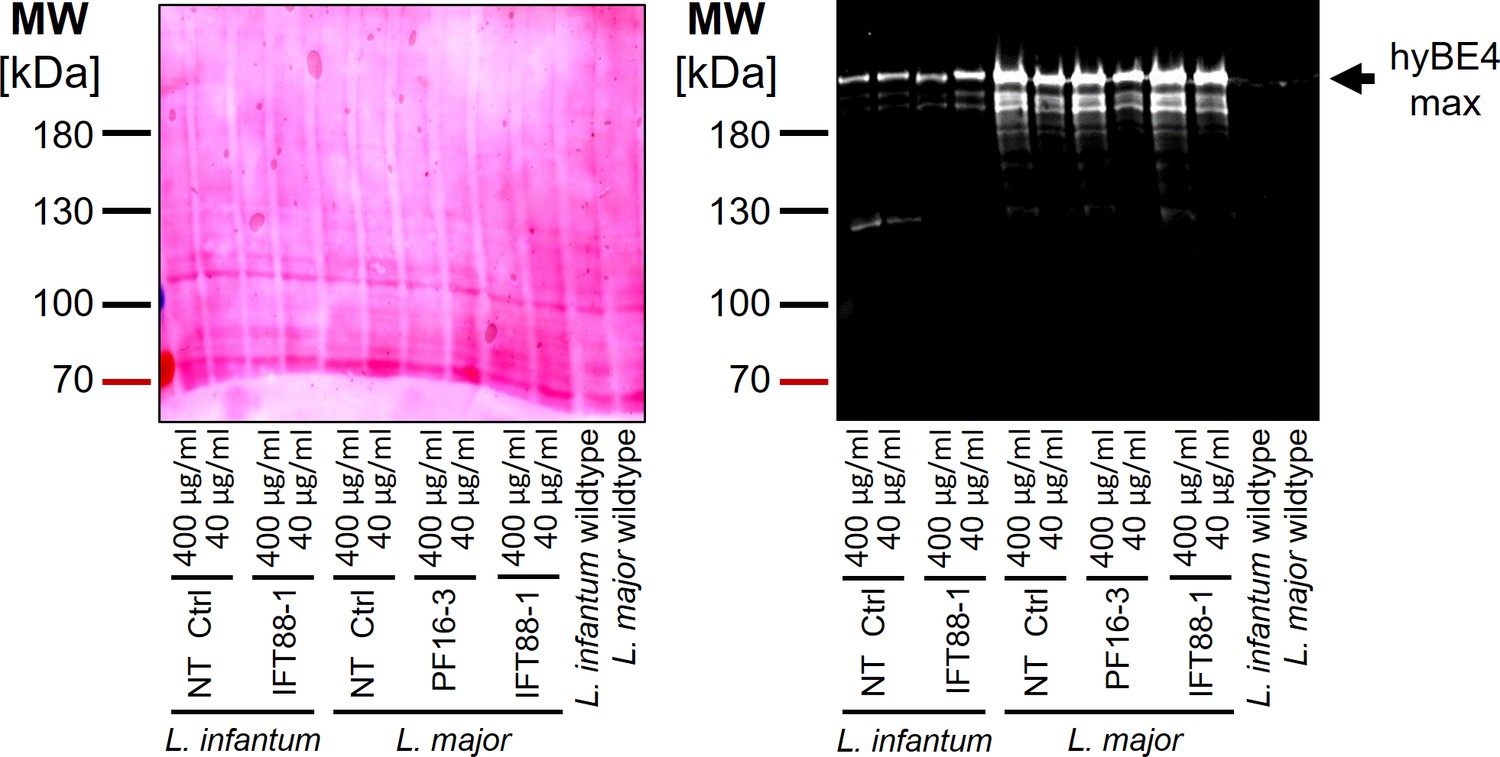
Increased drug selection concentration elevates the protein expression level of hyBE4max in L. major but not L. infantum.
Western blot with protein samples from cell lines indicated in Figure 4C, D. Left panel: Ponceau stain. Right panel: Cas9 detecting western blot, indicating the size of hyBE4max. MW: molecular weight in kDa.
Figure 5 with 1 supplement
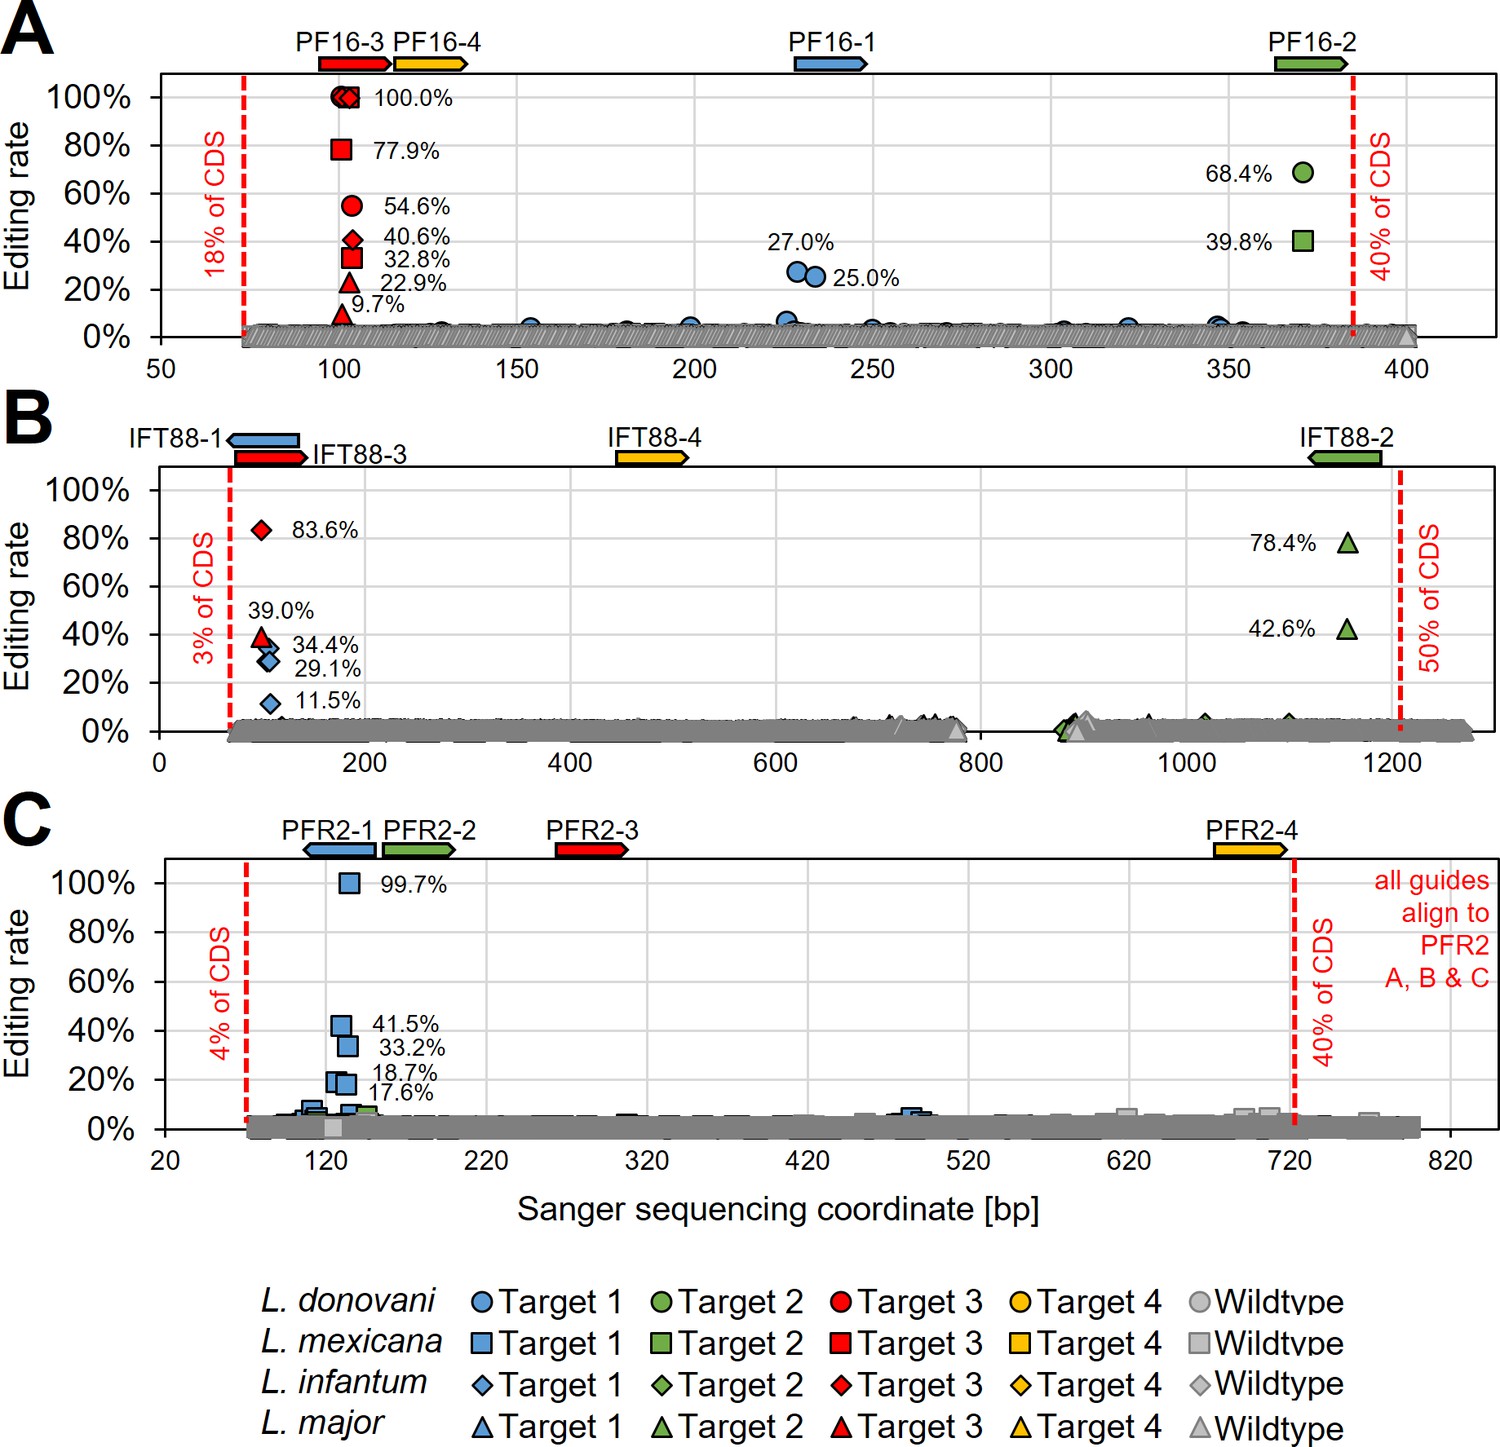
Determining hyBE4max editing rates following targeting of single- and multi-copy genes.
L. donovani, L. infantum, L. mexicana, and L. major wildtype parasites were transfected with pLdCH-hyBE4max-sgRNA expression plasmids, targeting (A) PF16, (B) IFT88, and (C) PFR2 with four guides each (see main text description). Discordance from Sanger sequencing traces before transfection (wildtype) and 28 days after transfection (Targets 1, 2, 3, and 4) was measured and plotted as described in Figure 3B. The position and orientation of each guide are indicated above.
Figure 5—figure supplement 1
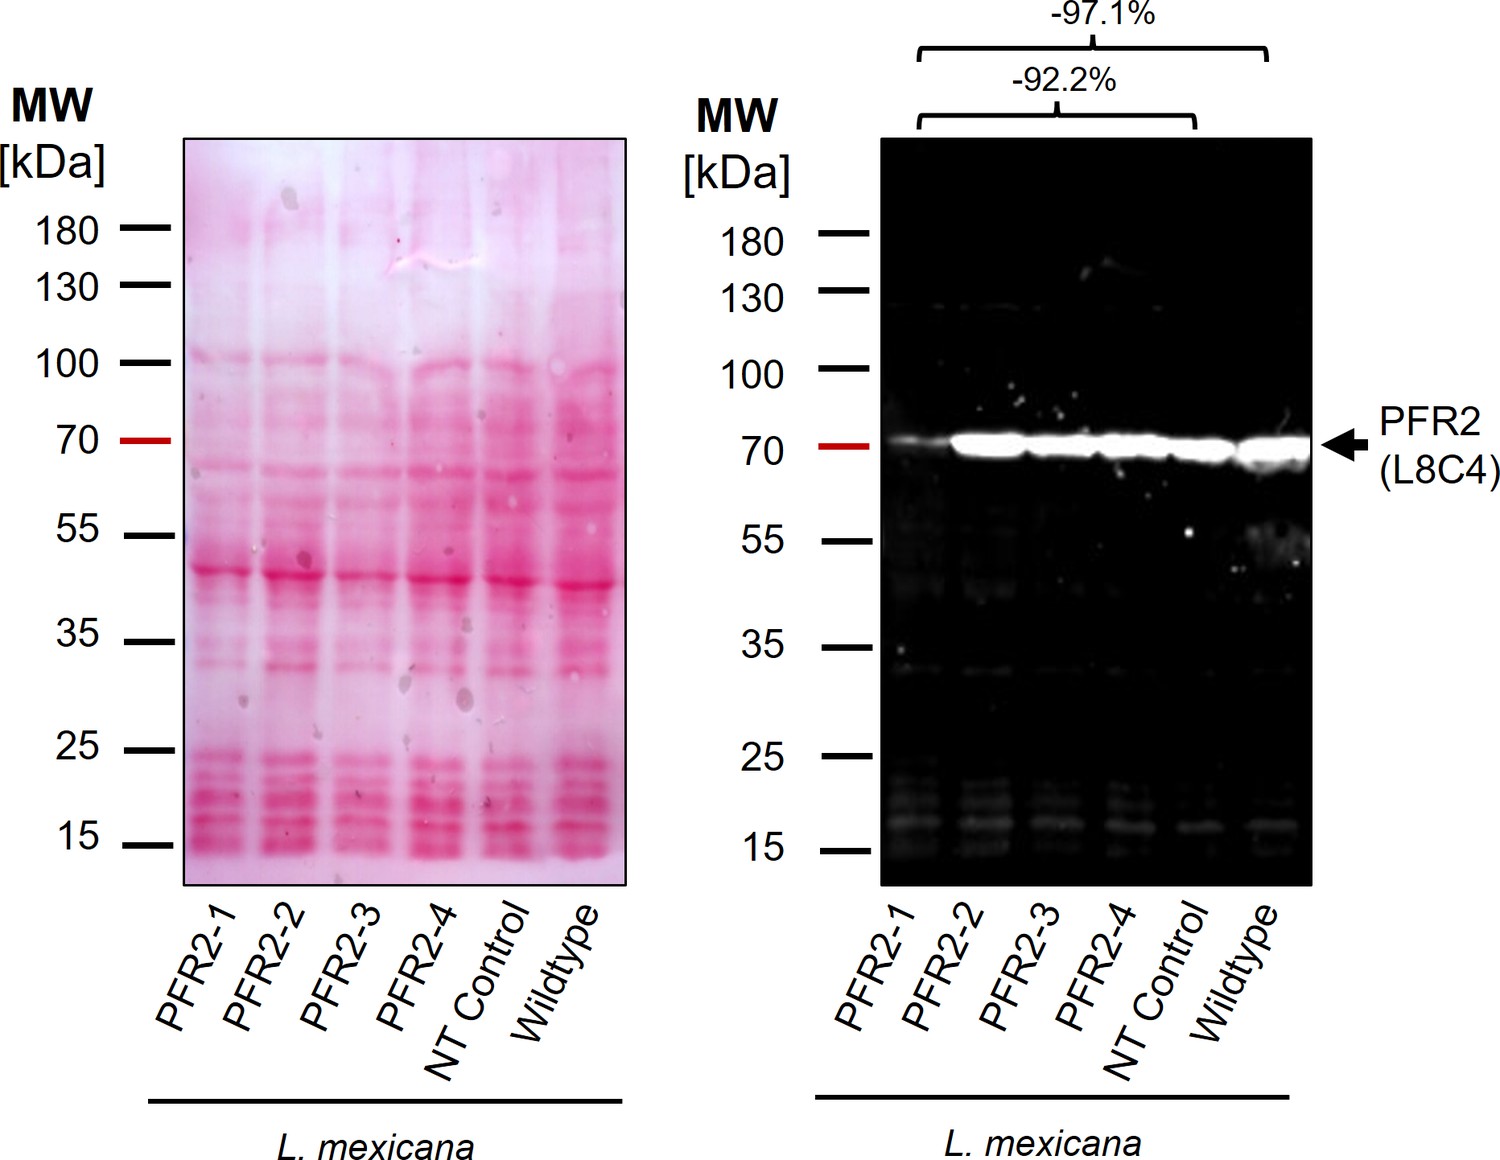
Effective PFR2 knockdown using hyBE4max for cytosine base editing.
Western blot with protein samples from L. mexicana promastigote parasites transfected with pLdCH-hyBE4max-sgRNA expression plasmids, targeting PFR2 with four guides each. A wildtype and NT control is provided as well (NT: non-targeting control, a wildtype transfected parasite, harbouring a pLdCH-hyBE4max-tdTomato-targeting-guide (Target 1 (−)) plasmid). Left panel: Ponceau stain. Right panel: PFR2 detecting western blot (using L8C4 antibody), indicating the size of PFR2. MW: molecular weight in kDa. Percentage above western blot indicates difference in band intensity, normalised to total visible protein in Ponceau stain.
Figure 6
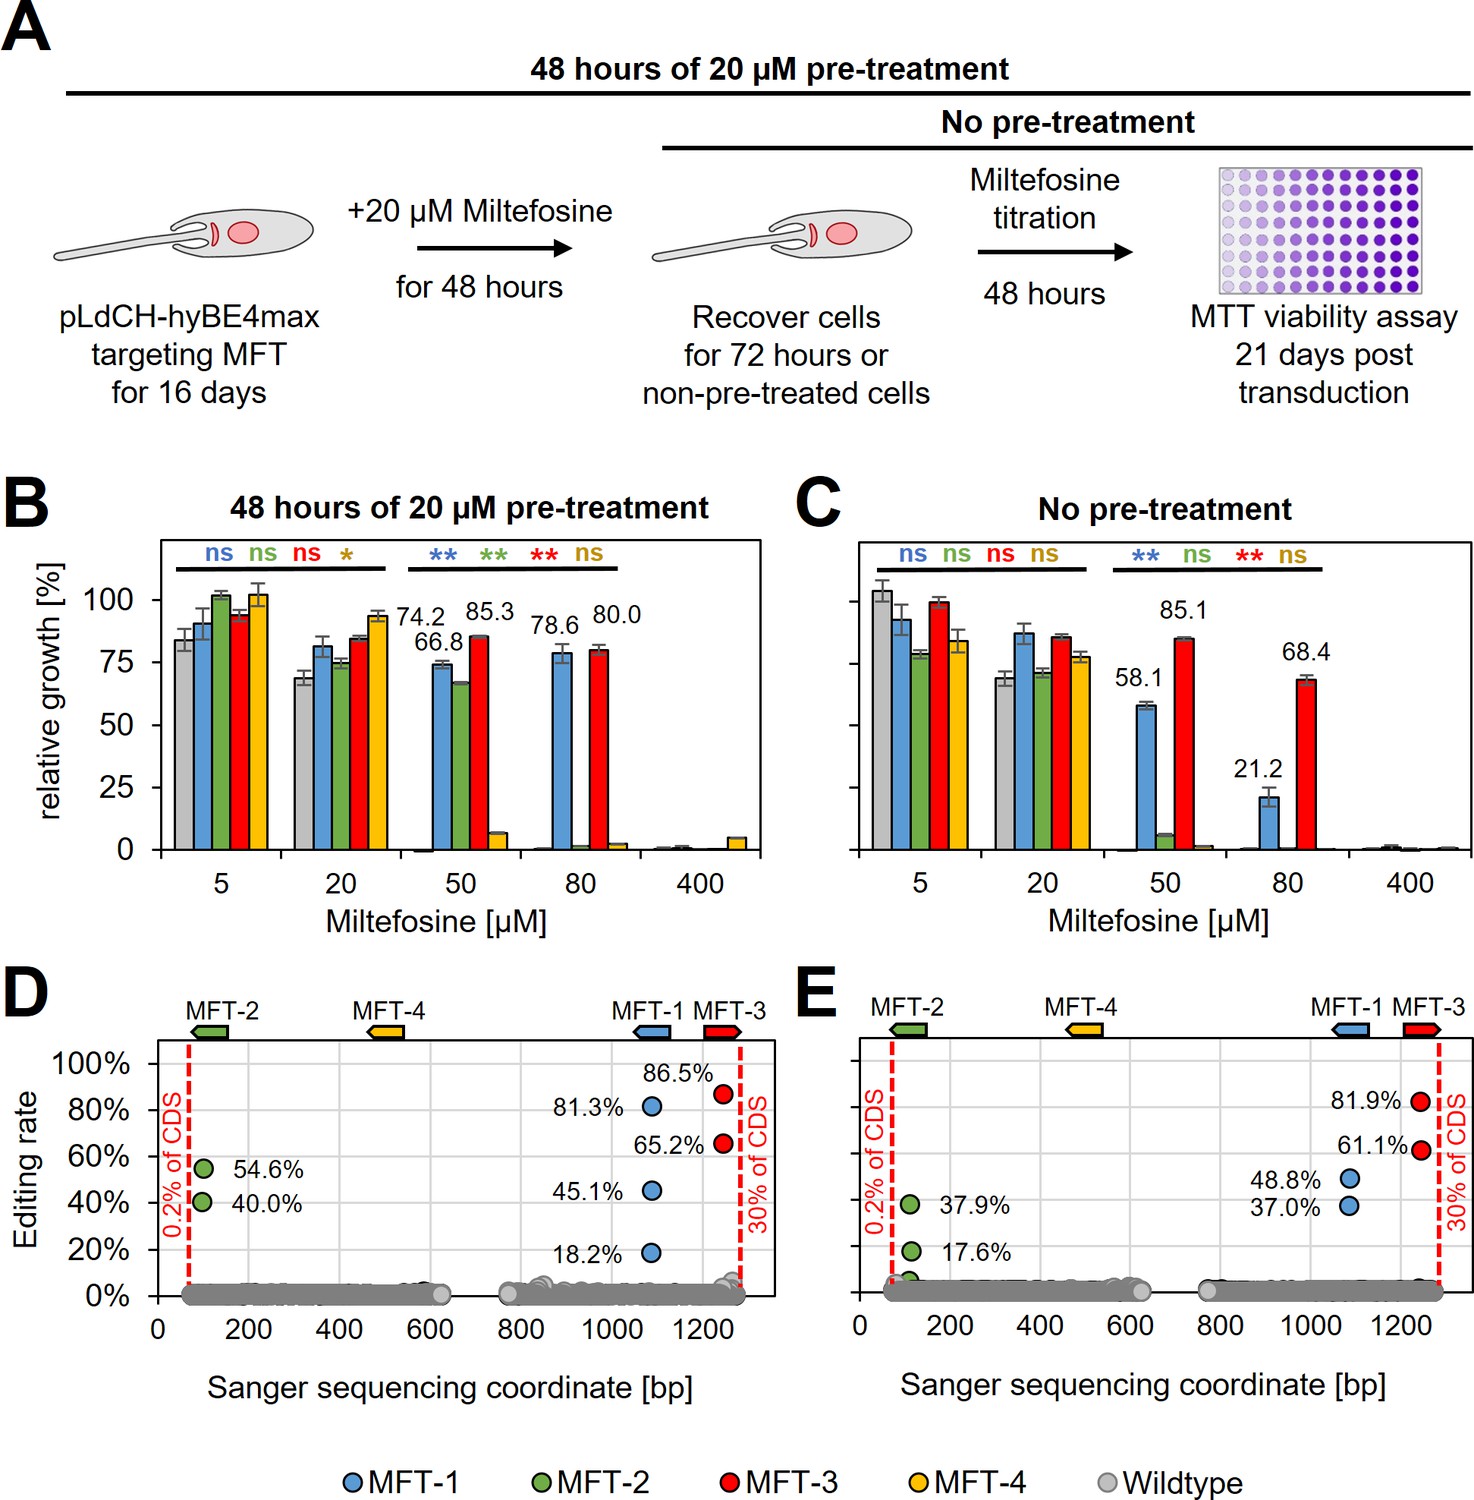
HyBE4max targeting of the L.donovani miltefosine transporter (MFT).
(A) L. donovani wildtype parasites were transfected with pLdCH-hyBE4max-sgRNA expression plasmids, targeting MFT with four guides each. Sixteeen days post transfection, transfected and non-transfected parasites were treated for 48 hr with 20 µM miltefosine, then washed and cultured for another 72 hr (pre-treated parasites). (B) Pre-treated and (C) non-pre-treated parasites were subjected to different doses of miltefosine (5, 20, 50, 80, and 400 µM) and relative growth between ‘no drug controls’ and each different dose was measured using an MTT cell viability assay. Asterisks indicate one-way analysis of variance (ANOVA) test with post hoc Tukey honestly significant difference (HSD), comparing each mutant and wildtype: *p > 0.05, **p > 0.01 (blue: MFT-1; green: MFT-2; red: MFT-3; yellow: MFT-4). Error bars show standard deviations of triplicates. Discordance from Sanger sequencing traces before transfection (wildtype) and 21 days after transfection (MFT-1, 2, 3, and 4), from either (D) pre-treated and (E) non-pre-treated populations, was measured and plotted as described in Figure 3B. The position and orientation of each guide are indicated above.
Figure 7 with 2 supplements
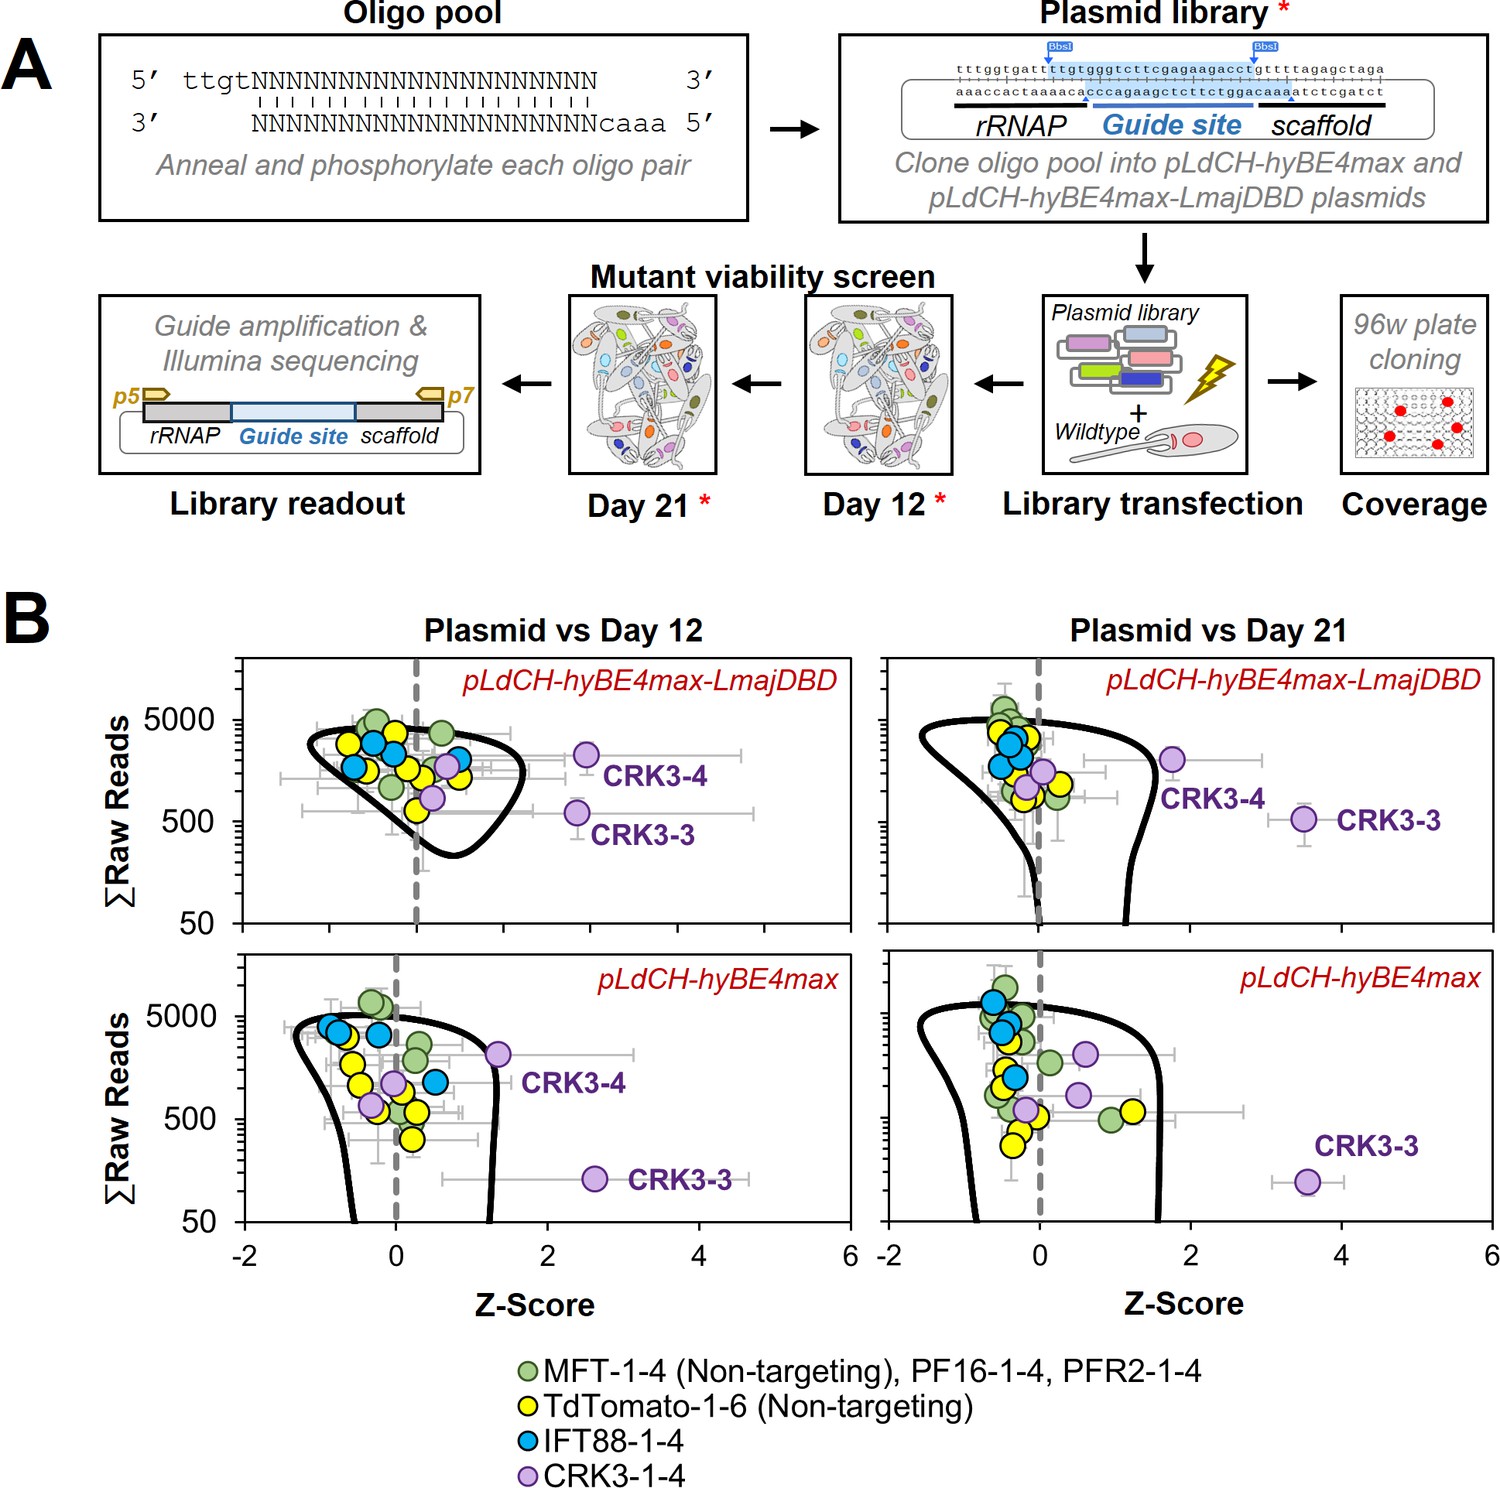
Targeting essential genes in a plasmid library delivered loss-of-function screen.
(A) Schematic of hyBE4max loss-of-function screen in Leishmania. Oligo pairs were annealed and phosphorylated, then pooled and cloned into pLdCH-hyBE4max and pLdCH-hyBE4max-LmajDBD plasmids. Plasmid libraries, in triplicate, were transfected into L. mexicana wildtype parasites. To determine the guide coverage (transfectants per guide), aliquots of replicates were subjected to 96-well plate cloning immediately after transfection. DNA was subsequently isolated 12 and 21 days after library transfection. Plasmid libraries and isolated DNA (all marked with red asterisks) were amplified and guide abundances in each sample and replicate were determined by Illumina sequencing. (B) Illumina sequencing data of both library screens (top panel: pLdCH-hyBE4max-LmajDBD; bottom panel: pLdCH-hyBE4max) was analysed by z-scoring the ratio between each plasmid, day 12 and 21 replicate sample. Z-scores were plotted against the total of raw reads from either: (1) plasmid and day 12 sample (left panel), or (2) plasmid and day 21 sample (right panel). To identify data points that were significant different, a 0.8 confidence ellipse was calculated (black line). Error bars show standard deviation between triplicates. Identities of data points, each representing a different guide sequence, are indicated in the legend below (see main text for further explanation).
Figure 7—figure supplement 1
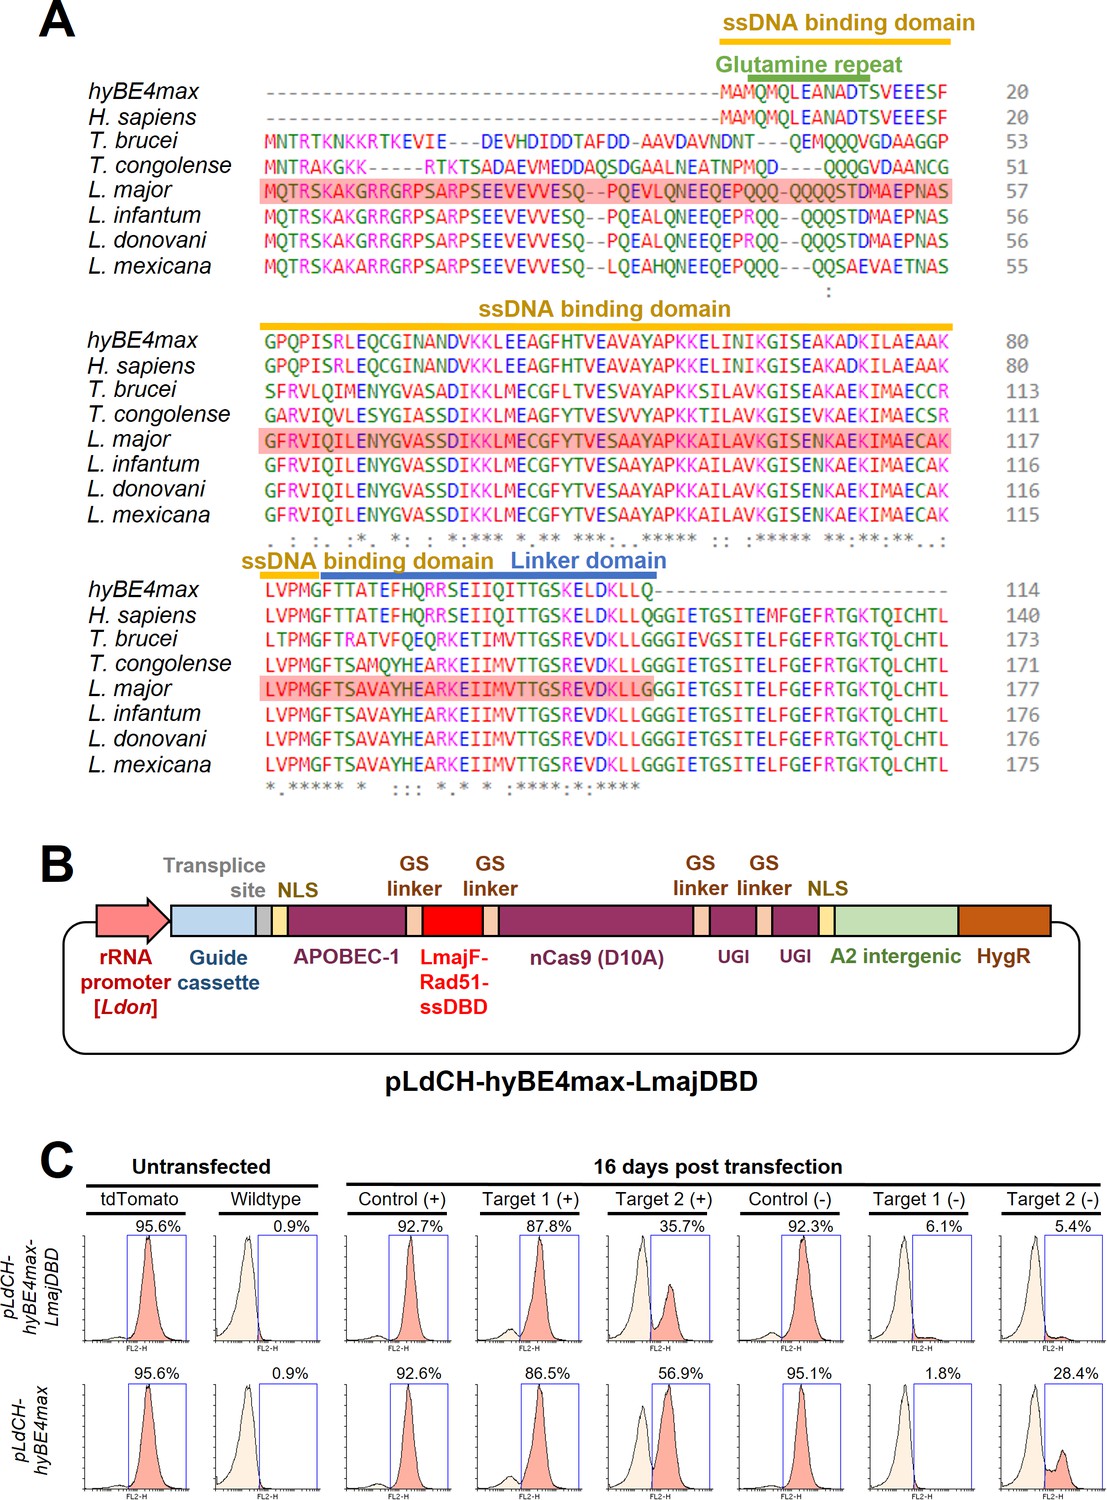
Conceptualisation and testing of a Leishmania-optimised hyBE4max version.
(A) Protein alignment of the Rad51 ssDBD between the hyBE4max-derived version (Zhang et al., 2020) and versions derived from Homo sapiens, T. brucei, T. congolense, L. major, L. infantum, L. donovani, and L. mexicana. Highlighted is the ssDBD domain (yellow), linker domain (blue), and trypanosomatid-specific glutamine repeat (green). The Rad51 ssDBD with the longest glutamine repeat (L. major version, amino acid sequence highlighted in red) was taken to replace the human version in hyBE4max, giving rise to (B) pLdCH-hyBE4max-LmajDBD with other elements remaining identical as described in Figure 2A. (C) FACS plot showing tdTomato-expressing and wildtype L. mexicana parasites (left panel, untransfected), as well as tdTomato-expressing L. mexicana parasites, transfected with either pLdCH-hyBE4max-tdTomato or pLdCH-hyBE4max-LmajDBD-tdTomato targeting plasmids. Cells are analysed 16 days post transfection. Percentage represents remaining proportion of tdTomato-expressing cells.
Figure 7—figure supplement 2
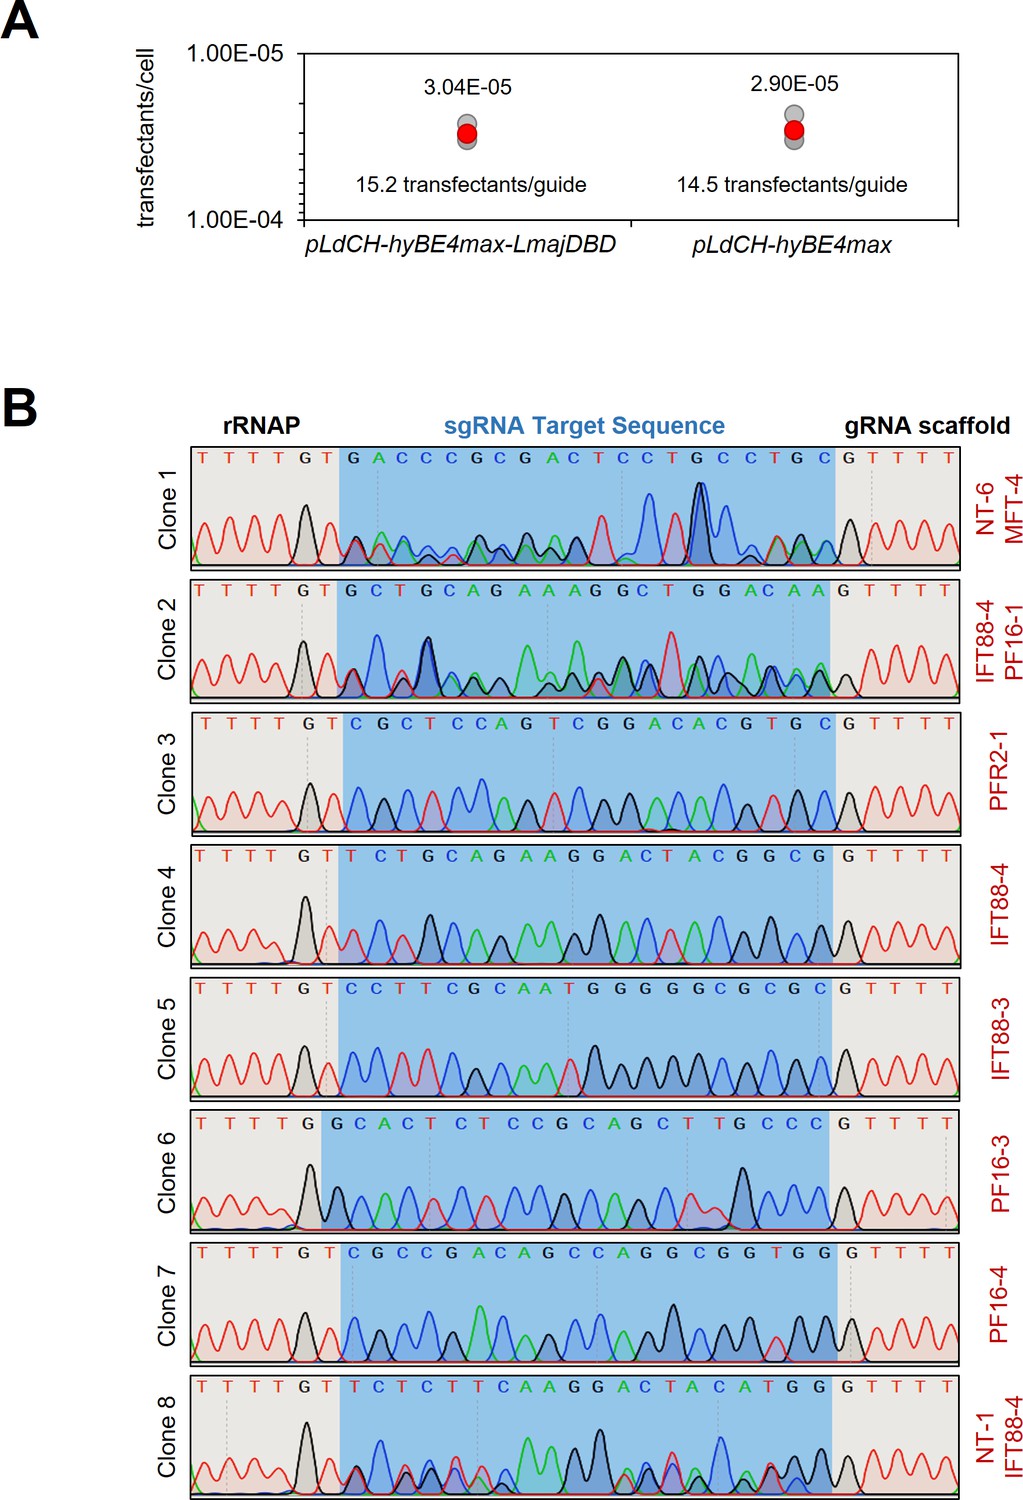
Guide representation in a plasmid library delivered loss-of-function screen.
(A) Following serial dilutions immediately after library transfection, the number of hygromycin B-resistant transfectants obtained per transfected cell and the representation of each guide within the library (transfectants per guide) was calculated by counting the number of clones 14 days post transfection in triplicates (red: average; grey: replicates). (B) DNA from isolated clones was extracted and the guide cassette within the pLdCH-hyBE4max and pLdCH-hyBE4max-LmajDBD plasmid was amplified. Sanger sequencing traces of amplicons show whether one or multiple guide plasmids were present in each clone.
Tables
Key resources table
| Reagent type (species) or resource | Designation | Source or reference | Identifiers | Additional information |
|---|---|---|---|---|
| Cell line (Leishmania mexicana) | L. mexicana wildtype | Eva Gluenz laboratory | WHO strain MNYC/BZ/62/M379 | Used TriTrypDB (release 59, Aslett et al., 2010) reference annotation: L. mexicana MHOMGT2001U1103 |
| Cell line (Leishmania major) | L. major wildtype | Eva Gluenz laboratory | Strain Friedlin | Used TriTrypDB (release 59, Aslett et al., 2010) reference annotation: L. major Friedlin |
| Cell line (Leishmania donovani) | L. donovani wildtype | Joachim Clos laboratory, Decuypere et al., 2005 | Strain BPK190 | Used TriTrypDB (release 59, Aslett et al., 2010) reference annotation: L. donovani BPK282A1 |
| Cell line (Leishmania infantum) | L. infantum wildtype | Joachim Clos laboratory, Sulahian et al., 1997 | Strain MHOM/FR/91/LEM2259 | Used TriTrypDB (release 59, Aslett et al., 2010) reference annotation: L. infantum JPCM5 |
| Recombinant DNA reagent | hyBE4max | Addgene, Zhang et al., 2020 | #157942 | |
| Recombinant DNA reagent | AncBE4max | Addgene, Koblan et al., 2018 | #112100 | |
| Recombinant DNA reagent | pTB007 | Beneke et al., 2017 | ||
| Recombinant DNA reagent | pPLOT Puro | Beneke et al., 2017 | ||
| Recombinant DNA reagent | pLdCH | Addgene, Zhang et al., 2017 | #84291 | |
| Recombinant DNA reagent | pTB007-hyBE4max | This study | See description under ‘Construction of CBE and sgRNA expression plasmids’ | |
| Recombinant DNA reagent | pTB007-AncBE4max | This study | See description under ‘Construction of CBE and sgRNA expression plasmids’ | |
| Recombinant DNA reagent | pLdCH-hyBE4max | This study | See description under ‘Construction of CBE and sgRNA expression plasmids’ | |
| Recombinant DNA reagent | pLdCH-hyBE4max-LmajDBD | This study | See description under ‘Construction of CBE and sgRNA expression plasmids’ | |
| Antibody | Guide-it Cas9 (rabbit polyclonal) | Takara | #632607 | Dilution for western blot 1:1000 |
| Antibody | PFR2 (mouse monoclonal) | Kohl et al., 1999 | L8C4 | Dilution for western blot 1:10 |
| Chemical compound, drug | Miltefosine | Sigma | M5571 | |
| Chemical compound | Thiazolyl Blue Tetrazolium Bromide (MTT) | Sigma | M2128 | |
| Software | ICE | Synthego | https://ice.synthego.com/#/ | |
| Software | TriTrypDB (release 59) | Aslett et al., 2010 | https://tritrypdb.org/tritrypdb/app | |
| Software | LeishBASEedit | This study | http://www.leishbaseedit.net/ | See description under ‘Automated CBE guide design using LeishBASEedit’ |
| Gene (L. donovani BPK282A1, L. infantum JPCM5, L. major Friedlin, L. mexicana MHOMGT2001U1103) | PF16 | TriTrypDB (release 59), Aslett et al., 2010 | LdBPK_201450.1, LmjF.20.1400, LmxM.20.1400, LINF_200019300 | |
| Gene (L. donovani BPK282A1, L. infantum JPCM5, L. major Friedlin, L. mexicana MHOMGT2001U1103) | IFT88 | TriTrypDB (release 59), Aslett et al., 2010 | LINF_270017700, LdBPK_271010.1, LmjF.27.1130, LmxM.27.1130 | |
| Gene (L. donovani BPK282A1) | MFT | TriTrypDB (release 59), Aslett et al., 2010 | LdBPK_131590.1.1 | |
| Gene (L. mexicana MHOMGT2001U1103) | PFR2A, B, and C | TriTrypDB (release 59), Aslett et al., 2010 | LmxM.16.1430.1 | |
| Gene (L. mexicana MHOMGT2001U1103) | CRK3 | TriTrypDB (release 59), Aslett et al., 2010 | LmxM.36.0550.1 |
Additional files
-
Supplementary file 1
Motility data.
Sheet contains histogram data of mean velocity of tracked cells (average values given). STDEV: standard deviation between duplicates (14 days post transfection) and triplicates (28 and 42 days post transfection).
- https://cdn.elifesciences.org/articles/85605/elife-85605-supp1-v1.xlsx
-
Supplementary file 2
Sanger sequencing trace plots alignments following ICE analysis.
L. donovani, L. infantum, L. mexicana, and L. major wildtype parasites were transfected with pLdCH-hyBE4max-sgRNA expression plasmids, targeting PF16, MFT, PFR2, and IFT88 with four guides each (see main text description). Trace plots before transfection (control sample) and 28 days after transfection (edited sample) were aligned using ICE (Syntheco). Horizontal black line: 20nt guide target sequence. Horizontal red dotted line: PAM sequence. Vertical grey dotted line: nCas9 (D10A) DNA single-strand break (nick) position.
- https://cdn.elifesciences.org/articles/85605/elife-85605-supp2-v1.pdf
-
Supplementary file 3
MTT cell viability data.
Sheet contains calculated ratios (relative growth) between ‘no drug control’ and different doses of miltefosine (average values given). STDEV: standard deviation between triplicates.
- https://cdn.elifesciences.org/articles/85605/elife-85605-supp3-v1.xlsx
-
Supplementary file 4
NGS (next generation sequencing) analysis of plasmid library delivered loss-of-function screen.
First sheet: total of raw guide sequence counts. Second sheet: normalised counts and z-scored ratios between plasmid and day 12 sample or plasmid and day 21 sample. Guide sequences of PF16-2 and MFT-2 were underrepresented in both plasmid libraries and are therefore greyed out.
- https://cdn.elifesciences.org/articles/85605/elife-85605-supp4-v1.xlsx
-
Supplementary file 5
Primers used in this study.
Primers are separated in multiple sheets, including primers for: (1) generation of tdTomato expression constructs, (2) construction of cytosine base editor (CBE) plasmids, (3) cloning sgRNA target sequences into expression vectors, (4) species typing, (5) plasmid validation, (6) measuring mutation rates following base editing, and (7) Illumina sequencing.
- https://cdn.elifesciences.org/articles/85605/elife-85605-supp5-v1.xlsx
-
Supplementary file 6
Guide cloning protocol.
A step-by-step protocol to anneal oligos and clone sgRNAs into pLdCH-hyBE4max and pLdCH-hyBE4max-LmajDBD.
- https://cdn.elifesciences.org/articles/85605/elife-85605-supp6-v1.pdf
-
Supplementary file 7
Plasmid maps.
Genbank files of cytosine base editor (CBE) plasmids produced in this study, including: pLdCH_AncBE4max, pLdCH-hyBE4max, pLdCH-hyBE4max-LmajDBD, and pTB007-hyBE4max
- https://cdn.elifesciences.org/articles/85605/elife-85605-supp7-v1.zip
-
Supplementary file 8
Base editor guide plasmid transfection protocol.
A step-by-step protocol to transfect pLdCH-hyBE4max and pLdCH-hyBE4max-LmajDBD guide expression plasmids into Leishmania parasites.
- https://cdn.elifesciences.org/articles/85605/elife-85605-supp8-v1.pdf
-
MDAR checklist
- https://cdn.elifesciences.org/articles/85605/elife-85605-mdarchecklist1-v1.pdf
-
Source code 1
LeishBASEedit primer design script.
‘LeishBASEedit_v1.sh’ is a bash script that allows to design and score cytosine base editor (CBE) guides to introduce STOP codons within the first 50% of any given open reading frame (ORF). The ‘hyBE4max_specifics.csv’ file is required to define the base editing window. Reference and CDS test files are also provided for setting up LeishBASEedit locally. Instructions and dependencies can be found in the README part of the script. The LeishBASEedit primer design output for 64 different kinetoplastids (TriTrypDB release 59) was deposited on http://www.leishbaseedit.net/ (open source).
- https://cdn.elifesciences.org/articles/85605/elife-85605-code1-v1.zip
-
Source data 1
Raw Ponceau stain TIF images.
Leishmania promastigote protein samples were loaded and subjected to electrophoresis on SDS-polyacrylamide gels and then transferred to nitrocellulose membranes. Membranes were then stained with Ponceau and scanned. This is the raw TIF file of this scan. File “Source data 1 (labels)” is the same file but with identities of protein samples highlighted. Details for samples can be found in legends of Figure 2—figure supplement 2 (top panel), Figure 4-figure supplement 4 (middle panel) and Figure 5-figure supplement 1 (bottom panel).
- https://cdn.elifesciences.org/articles/85605/elife-85605-data1-v1.zip
-
Source data 2
Raw LI-COR Odyssey CLx TIF images.
Nitrocellulose membranes with Leishmania promastigote protein samples were subject to western blots and imaged using a LI-COR Odyssey CLx. This is the raw TIF file of this scan. File “Source data 2 (labels)” is the same file but with identities of protein samples highlighted. Details for samples can be found in legends of Figure 2-figure supplement 2 (bottom-left panel), Figure 4-figure supplement 4 (bottom-right panel) and Figure 5-figure supplement 1 (top panel).
- https://cdn.elifesciences.org/articles/85605/elife-85605-data2-v1.zip
Download links
A two-part list of links to download the article, or parts of the article, in various formats.
Downloads (link to download the article as PDF)
Open citations (links to open the citations from this article in various online reference manager services)
Cite this article (links to download the citations from this article in formats compatible with various reference manager tools)
Gene editing and scalable functional genomic screening in Leishmania species using the CRISPR/Cas9 cytosine base editor toolbox LeishBASEedit
eLife 12:e85605.
https://doi.org/10.7554/eLife.85605


