Regulation of different phases of AMPA receptor intracellular transport by 4.1N and SAP97
- University of Bordeaux, CNRS, Interdisciplinary Institute for Neuroscience, France
- Bordeaux Imaging Center, France
Figures
Figure 1 with 1 supplement
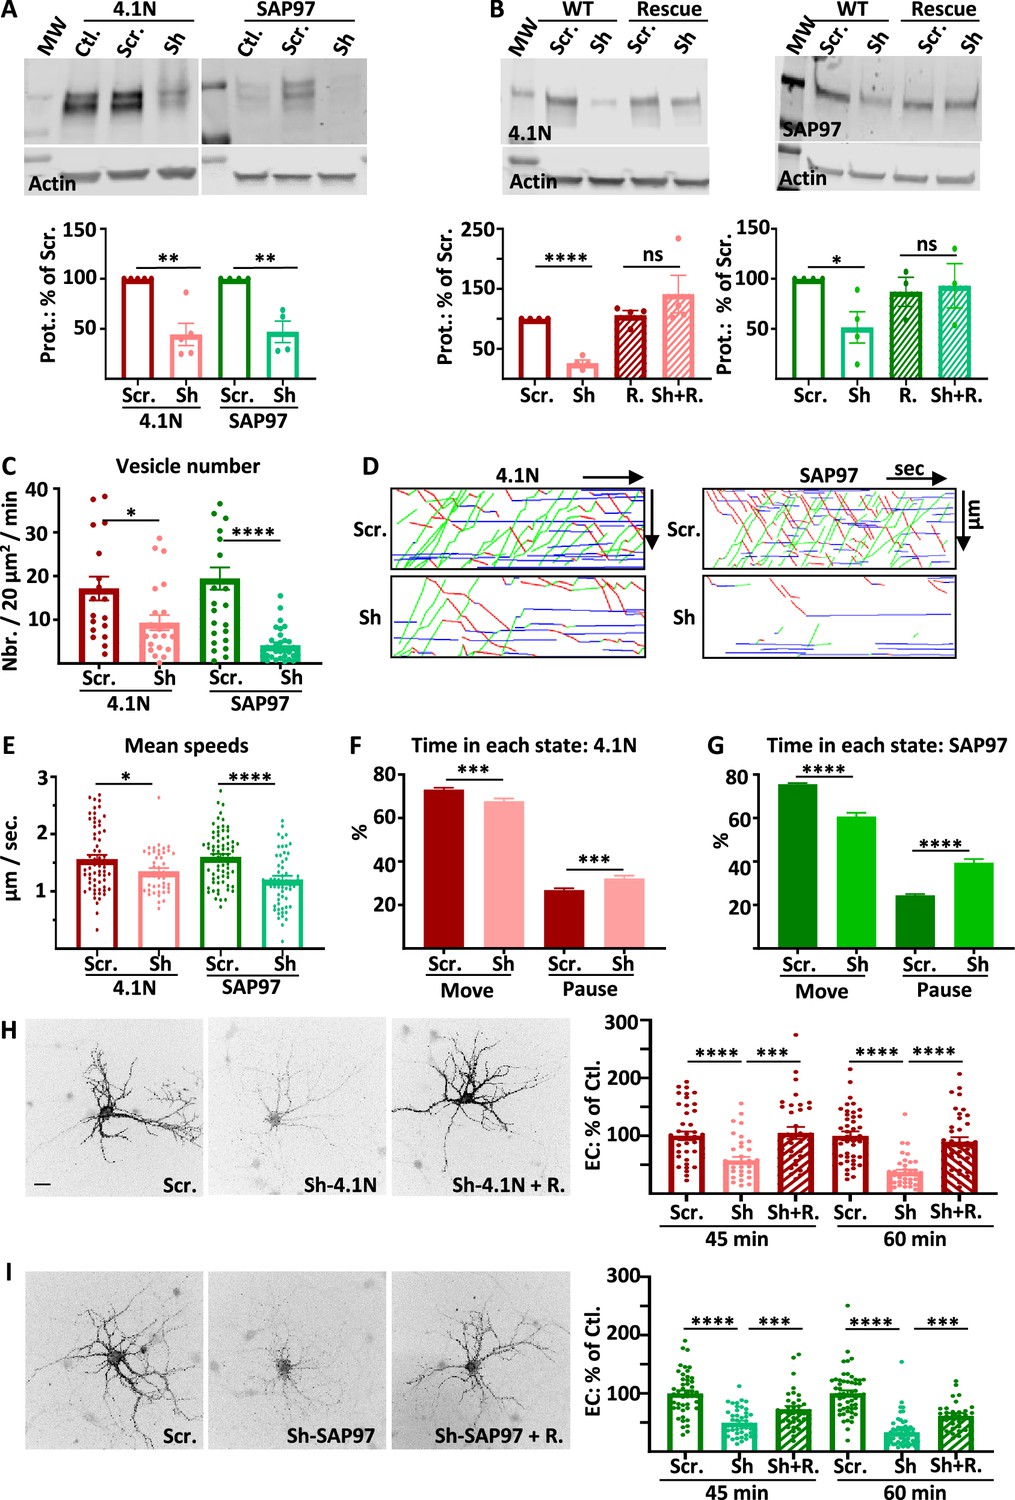
Intracellular transport and exocytosis of GluA1 are dependent on the expression of 4.1N and SAP97.
( A) Top: Western blots of 4.1N and SAP97 expression in cultured rat hippocampal neurons after virus infection with scramble-RNA (scr.) or sh-RNA against 4.1N and SAP97; bottom: quantification of proteins normalized with actin on the scr. condition (sh-4.1N: 44.4 +/−11.2%,n=5, sh-SAP97: 58.3 +/−7.3%, n=4). (B) Top: Western blots showing the expression of 4.1N and SAP97 WT and rescue after transfection of the proteins in COS-7 cells; bottom: quantifications normalized with actin on the scr. condition (sh-4.1N: 26.2 +/−10.1%, sh-SAP97: 47.1 +/−10.7%, n=4; for rescue proteins; scr.: 105.9 +/−7.9%, sh-4.1N: 141.2 +/−3.1%, scr.: 87.0 +/−1.5%, sh-SAP97: 93.0 +/−2.2%, n=4). (C to G) Parameters of intracellular transport of ARIAD-TdTom-GluA1 expressed with scramble-RNA (scr.) or sh-RNA against 4.1N and SAP97. (C) Vesicle number (vesicles/20 µm2/min; scr. 4.1 N: 17.2 +/−2.7, sh-4.1N: 9.3 +/−1.7, n=3 scr. SAP97: 19.5 +/−2.5; sh-SAP97: 4.2 +/−0.7, n=4), (D) Representative kymographs of the routes of the vesicles in the function of the time in the video. (E) Mean speeds of the vesicles in control (expression of scr.) and when 4.1 N or SAP97 are decreased (expression of sh) (µm/s; scr. 4.1 N: 1.56 +/−0.07, sh-4.1N: 1.35 +/−0.05, n=3; scr. SAP97: 1.60 +/- 0.05, sh-SAP97: 1.21 +/- 0.07, n=4), (F–G) Time spent by a vesicle in a moving state (Move) or in pausing state (Pause) (% Move: scr. 4.1N: 73.13 +/−0.83, sh-4.1N: 67.77 +/−1.25; % pause: scr. 4.1N: 26.87 +/−0.83, sh-4.1N: 32.22 +/−1.25) and (% Move: scr. SAP97: 75.57 +/−5.89, sh-SAP97: 60.68 +/−1.74; % pause: scr. SAP97: 24.43 +/−5.89, sh-SAP97: 39.32 +/−1.75) (n=3) (H) Representative image of live extracellular labeling of ARIAD-GFP-GluA1 after 45 and 60 min. of incubation with AL expressed with sh-RNA for 4.1N with or without the corresponding rescue proteins and quantifications (% of cle. 45 min. after AL; sh-4.1N: 57.36 +/- 6.27, sh-4.1N on rescue: 105.00 +/- 10.34; 60 min after AL; sh-4.1N: 37.29 +/−4.16, sh-4.1N on rescue: 89.73 +/−7.81) (n=3). (I) Representative image of live extracellular labeling of ARIAD -GFP-GluA1 after 45 and 60 min of incubation with AL expressed with sh-RNA for SAP97 with or without the corresponding rescue proteins and quantifications (% of cle. 45 min after AL; sh-SAP97: 49.64 +/−3.41, sh-SAP97 on rescue: 72.91+/−5.58, 60; 60 min after AL; sh-SAP97: 33.33 +/−3.29, sh-SAP97 on rescue: 61.69 +/−4.32) (n=3). The 100% values for H and I correspond to the extracellular labeling of the control (Scramble: Scr.) for the same times of incubation with AL. Scale bar: 25 µm.
-
Figure 1—source data 1
Individual data values for the bar graphs in panels A, B, C, E, F, H and I.
Raw images and summary of the western blots from panels A and B.
- https://cdn.elifesciences.org/articles/85609/elife-85609-fig1-data1-v1.zip
Figure 1—figure supplement 1
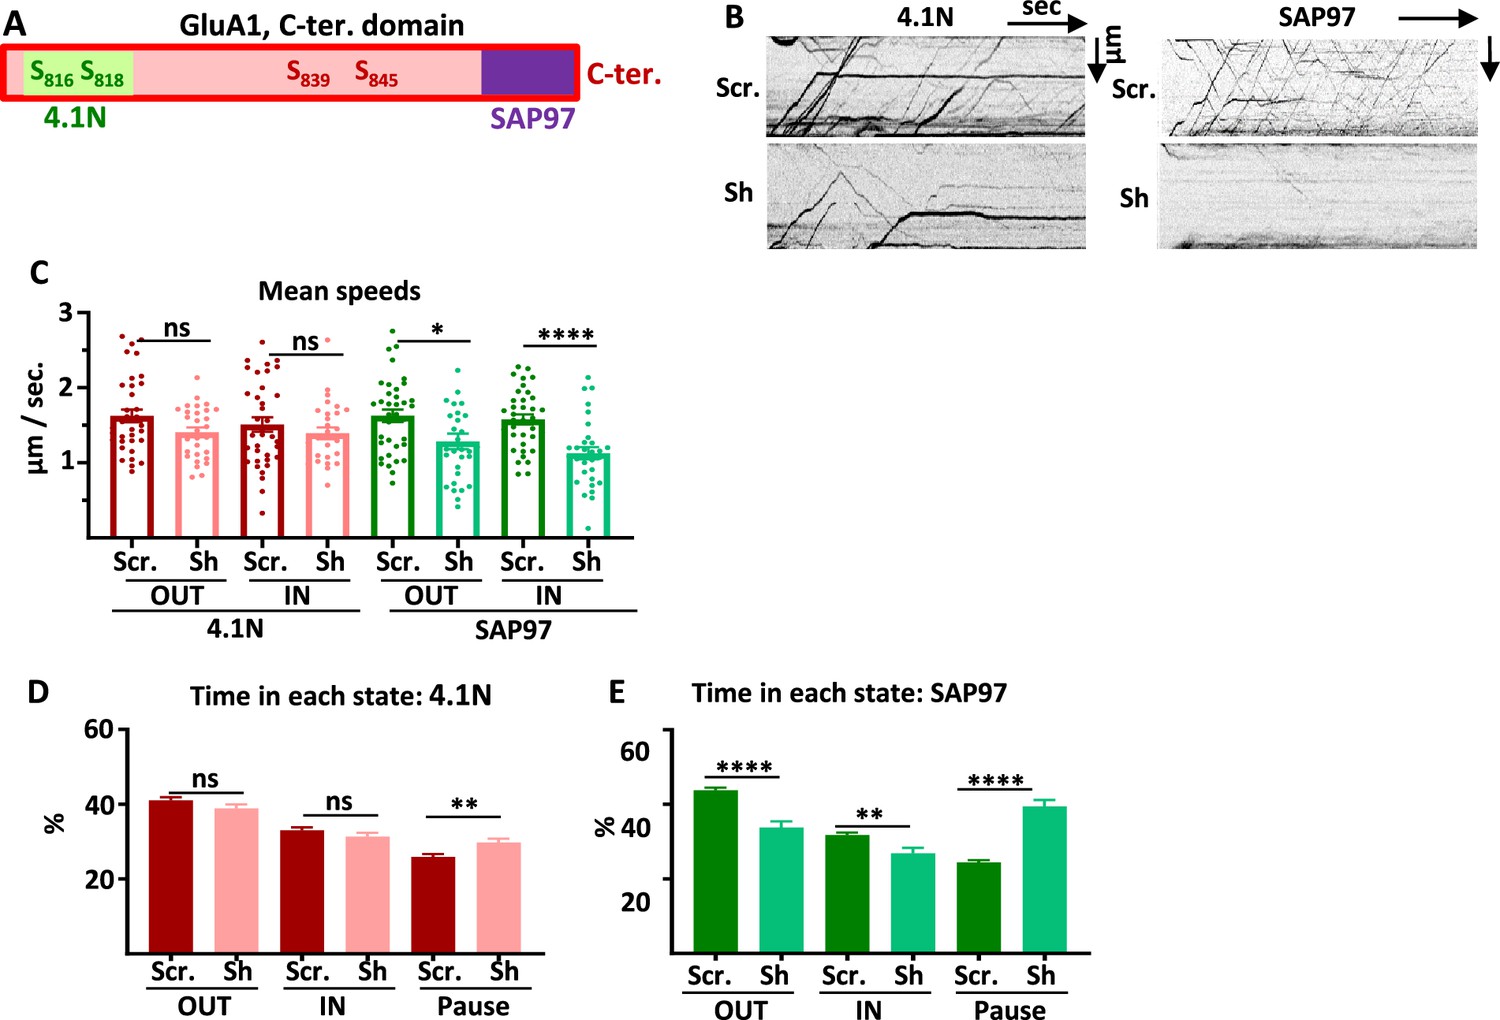
Intracellular transport and exocytosis of GluA1 are regulated by 4.1N and SAP97.
(A) Diagram of the C-terminal (C-ter.) domain of GluA1. (B) Raw kymographs corresponding to Figure 1D. (C) Mean speeds OUT and IN of TdTom-GluA1 when expressed with scramble RNA or the corresponding Sh for 4.1N and SAP97. (D–E) Time spent by a vesicle in each state corresponding to 4.1N (D) or to SAP97 (E).
-
Figure 1—figure supplement 1—source data 1
Individual data values for the bar graphs in panels C and D.
- https://cdn.elifesciences.org/articles/85609/elife-85609-fig1-figsupp1-data1-v1.zip
Figure 2 with 1 supplement
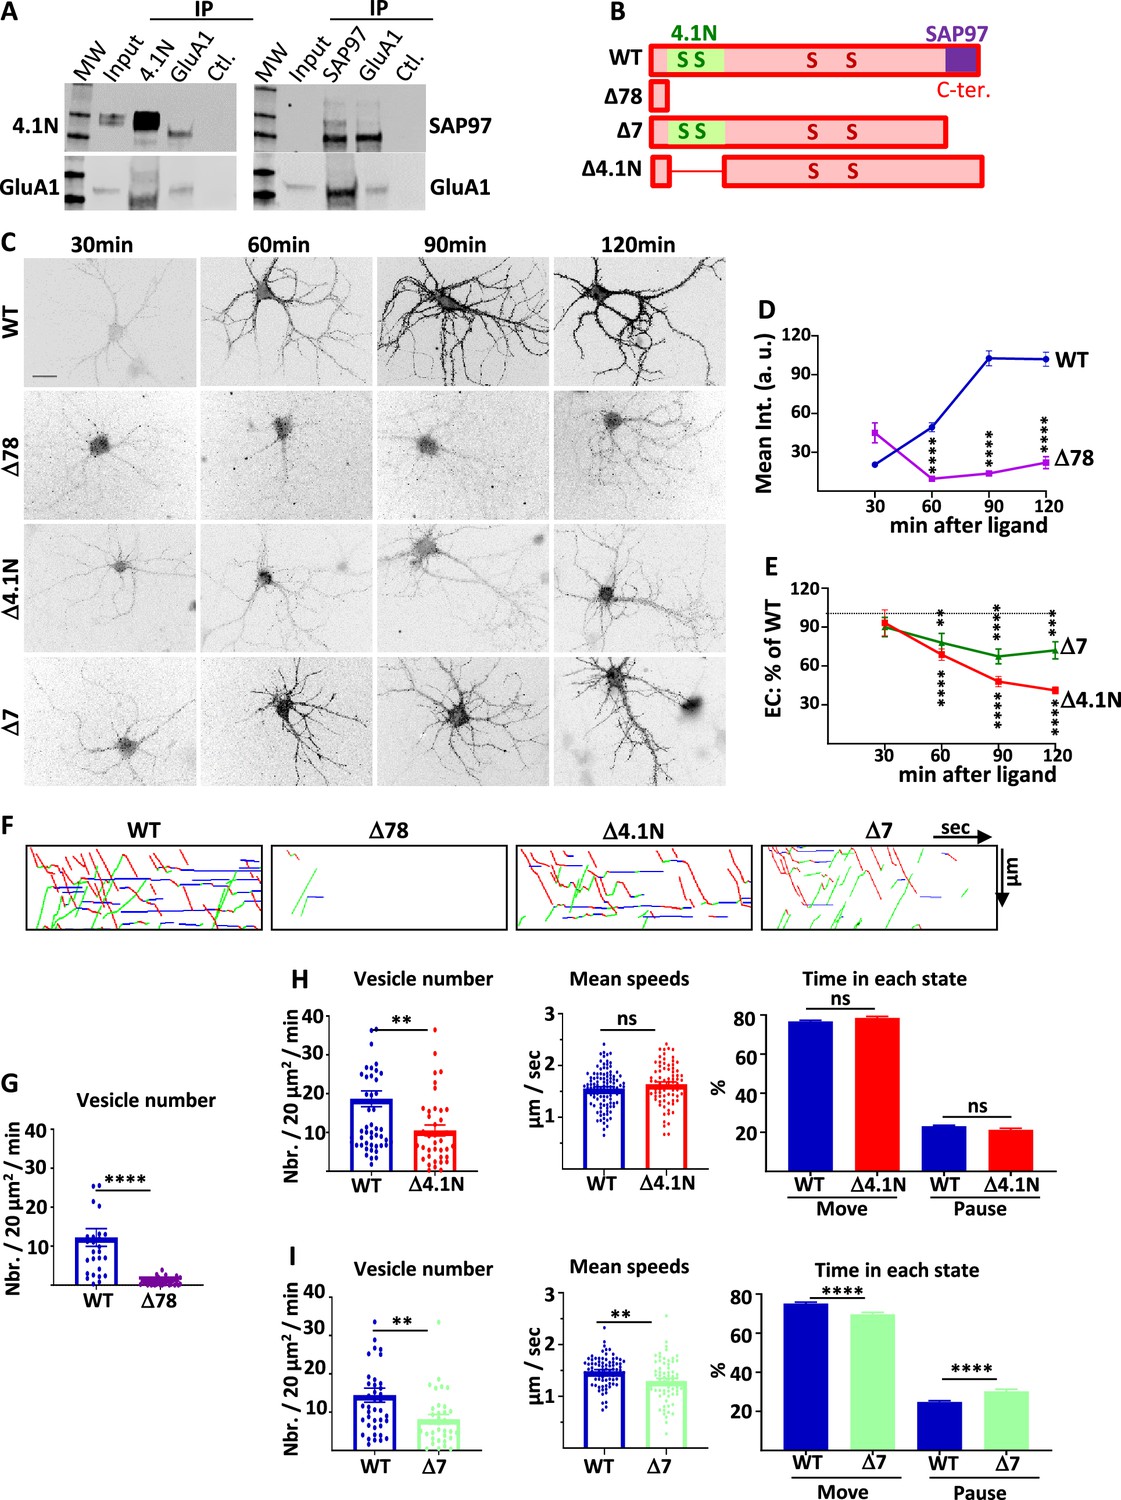
4.1N/GluA1 and SAP97/GluA1 interactions differently regulate GluA1 traffic in basal transmission.
(A) Co-immunoprecipitation of endogenous GluA1 with 4.1N and SAP97 in cultured rat hippocampal neurons. Control (Ctl.) is performed without an antibody. Western blot of GluA1, 4.1N and SAP97 as indicated. (B) Diagram of the different truncated mutants on the C-terminal (C-ter.) domain of GluA1. (C) Representative images of live labeling of ARIAD-GFP-GluA1 after the addition of AL during different times as indicated. Scale bar: 25 µm. (D) Quantification of the exit of ARIAD-GFP-GluA1-WT (WT) and ARIAD-GFP-GluA1-Δ78 (Δ78) over time after the addition of AL. For the WT, 100% of exit is taken after 120 min of addition of AL. (WT versus Δ78, arbitrary unit (a. (u).): 30 min, 20.43 +/−2.14 vs 45.02 +/−7.75; 60 min, 49.39 +/−3.42 vs 9.54 +/−1.95; 90 min, 102.68 +/−5.83 vs 13.64 +/−1.70; 120 min, 101.95 +/−5.37 vs 22.02 +/−4.59) (E) Quantification of the exit of ARIAD-GFP-GluA1-Δ4.1N (Δ4.1N) and ARIAD-GFP-GluA1-Δ7 (Δ7) over time after addition of AL induction (Δ4.1N: 30 min, 93.22 +/−10.00; 60 min, 68.75 +/−4.43; 90 min, 47.94 +/−4.01; 120 min, 41.19 +/− 2.70; Δ7: 30 min, 90.07 +/−7.42; 60 min, 77.98 +/−7.26; 90 min, 67.35 +/−5.68; 120 min, 72.04 +/−6.60). The 100% values correspond to the value of the WT for the same time, shown by a dotted line. (F) Traced kymographs for the different mutants. (G) Number of vesicles detected for the ARIAD-TdTom-GluA1-WT (WT) and the ARIAD-TdTom-GluA1-Δ78 (Δ78) (vesicles / 20 µm2/min; GluA1-WT: 12 +/−2.3, Δ78: 0.86 +/−0.2, n=4). (H) Parameters of intracellular transport for ARIAD-TdTom-GluA1-Δ4.1N (Δ4.1). Vesicle number (vesicles/20 µm2/min; GluA1-WT: 18.68 +/−2.05, Δ4.1N: 10.52 +/−1.40, n=5), mean speeds (µm/s; WT: 1.55 +/−0.03, Δ4.1N: 1.64 +/−0.05) and percentage of time in each state (% Move WT: 76.75 +/−0.53 %, Δ4.1N: 78.52 +/−0.78%; % pause: WT: 23.10 +/−0.53 %, Δ4.1N: 21.31 +/−0.78 %) (n=5). (I) Parameters of intracellular transport for the ARIAD-TdTom-GluA1-Δ7 (Δ7). Vesicle number (vesicles/20 µm2/min; GluA1-WT: 14.45 +/−1.82, Δ7: 8.16 +/−1.21), mean speeds (µm/s; WT: 1.48+/−0.03, Δ7: 1.30+/−0.05) and percentage of time in each state (% Move: WT: 75.18+/−0.70%, Δ7: 69.67+/−1.04%; % pause: WT: 24.82+/−0.69%, Δ7: 30.33+/−1.04%) (n=4).
-
Figure 2—source data 1
Individual data values for the bar graphs in panels D, E, G, H and I.
Raw images and summary of the western blots from panel A.
- https://cdn.elifesciences.org/articles/85609/elife-85609-fig2-data1-v1.zip
Figure 2—figure supplement 1
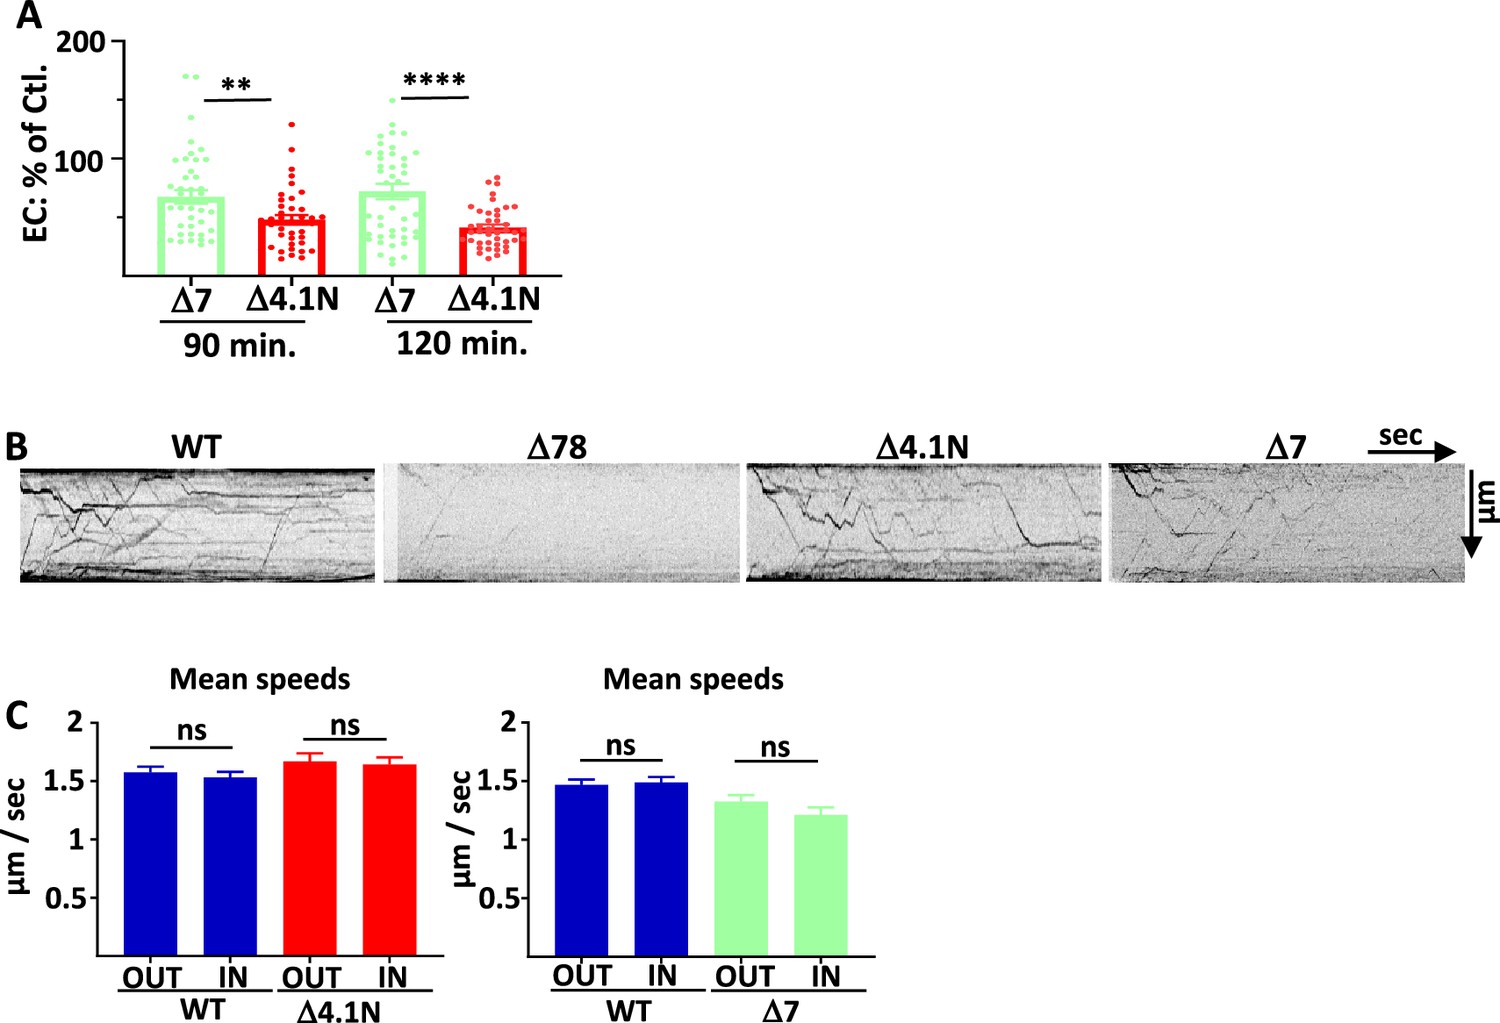
4.1 N/GluA1 and SAP97/GluA1 interactions differently regulate GluA1 traffic in basal transmission.
(A) Quantification from Figure 2E of the surface expression of Δ7 and Δ4.1N at 90 and 120 min. of incubation with AL. The 100% value corresponds to the surface expression of GluA1 WT in the same experiment. (B) Raw kymographs corresponding to Figure 2F. (C) Mean speeds OUT and IN of ARIAD-TdTom-GluA1-Δ4.1N (Δ4.1) and ARIAD-TdTom-GluA1-Δ7 (Δ7).
-
Figure 2—figure supplement 1—source data 1
Individual data values for the bar graphs in panels A and C.
- https://cdn.elifesciences.org/articles/85609/elife-85609-fig2-figsupp1-data1-v1.zip
Figure 3 with 1 supplement
4.1 N/GluA1 interaction is only necessary for the exocytosis of GluA1 in basal conditions.
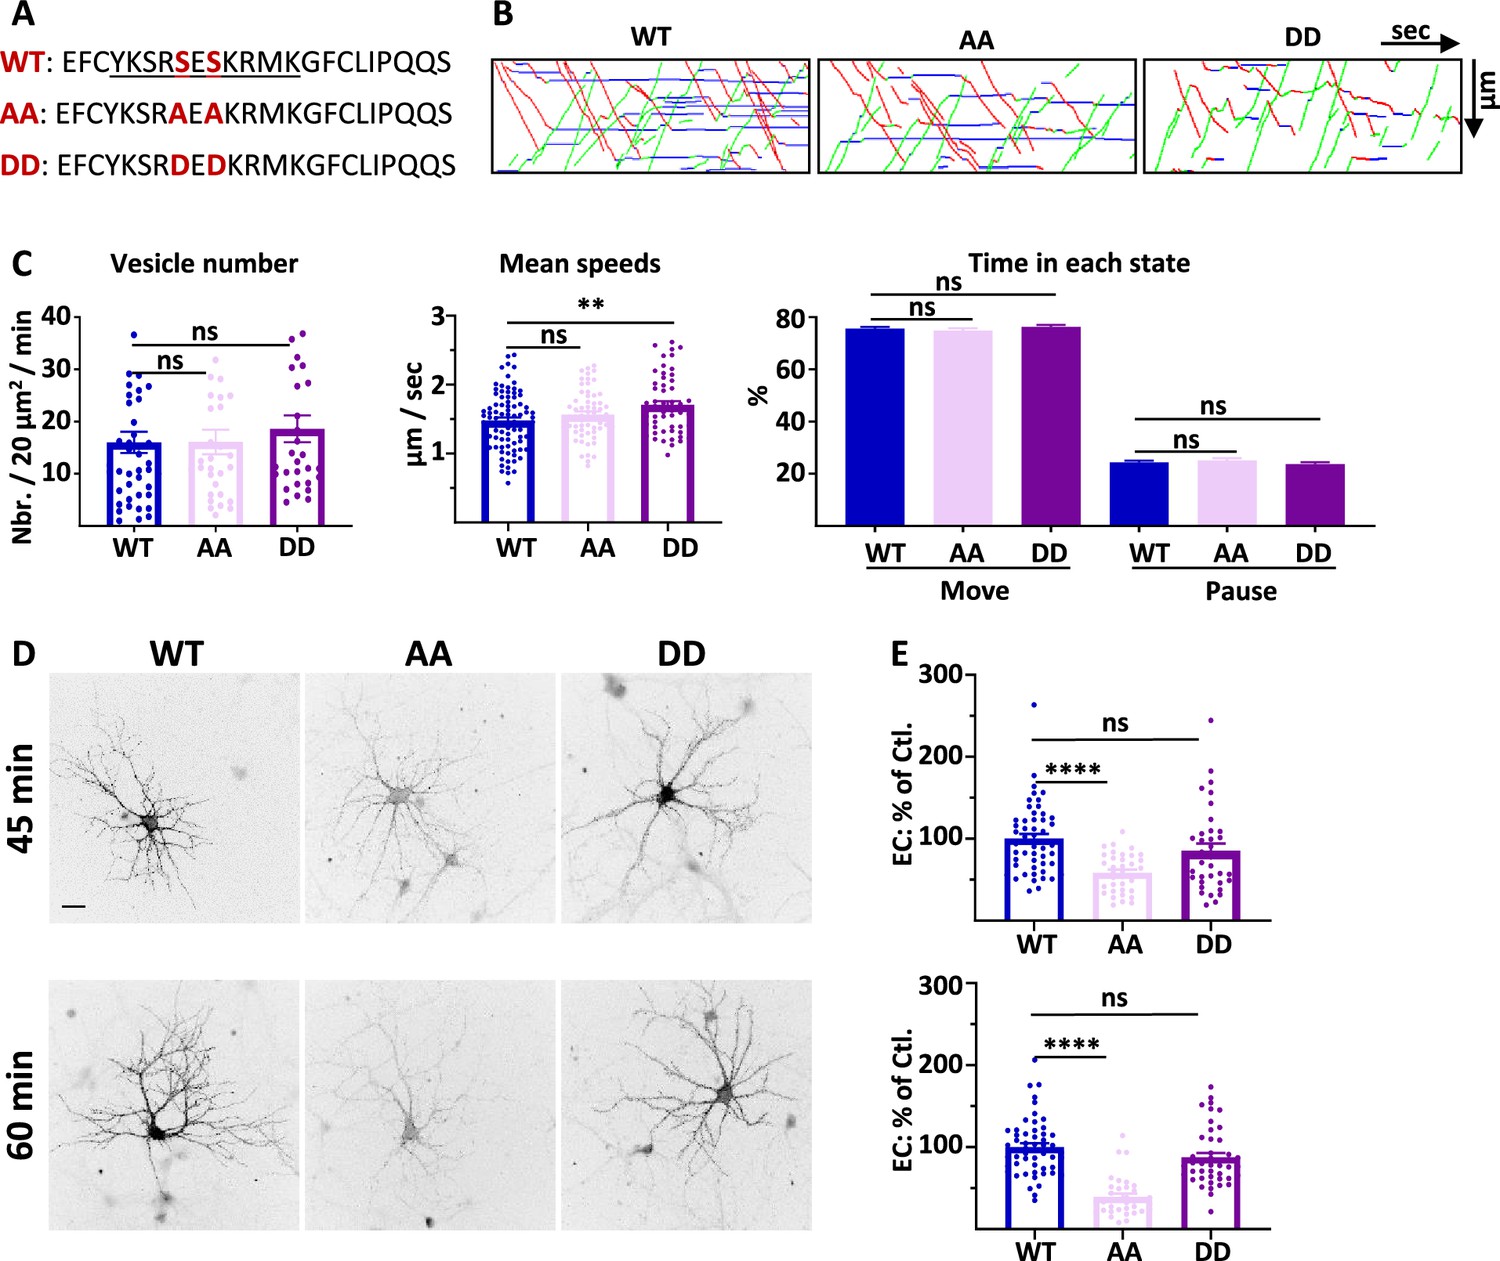
(A) Amino acid sequences representing the binding site of 4.1N on the C-ter. domain of GluA1 and mutations corresponding to the S816A S818A (AA) and S816D S818D (DD) mutants. (B) Representative traced kymographs for ARIAD-TdTom-GluA1-WT (WT), ARIAD-TdTom-GluA1-AA (AA), and ARIAD-TdTom-GluA1-DD (DD). (C) Parameters of IT for the WT, AA, and DD constructs. vesicle number (vesicles/20 µm2/min; GluA1-WT: 16.01 +/−2.05, AA: 16.10 +/−2.34, DD: 18.61 +/−2.56), mean speeds (µm/s; WT: 1.48 +/−0.04, AA: 1.57 +/−0.04, DD: 1.71 +/−0.05), percentage of time in each state (Move: WT: 75.64 +/−0.69%, AA: 74.90 +/−0.84%, DD: 76.31 +/−0.75%; Pause: WT: 24.36 +/−0.69%, AA: 25.10 +/−0.84%, DD: 23.70 +/−0.75%) (n=6). (D) Representative images of live labeling of ARIAD-GFP-GluA1-WT (WT), ARIAD-GFP-GluA1-AA (AA), and ARIAD-GFP-GluA1-DD (DD) after the addition of AL during different time as indicated. Scale bar: 25 µm. (E) Quantification of live labeling after 45 and 60 min of incubation with AL normalized on the WT after the same time of incubation with AL (% of EC labeling at 45min WT: 100 +/−6.0; AA: 58.44 +/−3.99; DD: 85.39 +/−8.75; at 60 min WT: 100 +/−4.76; AA: 39.27 +/−4.01; DD: 85.57 +/−5.39) (n=3). The 100% values correspond to the extracellular labeling of the WT (Ctl.) for the same times of incubation with AL.
-
Figure 3—source data 1
Individual data values for the bar graphs in panels D, E, G, H and I.
Raw images and summary of the western blots from panel A.
- https://cdn.elifesciences.org/articles/85609/elife-85609-fig3-data1-v1.zip
Figure 3—figure supplement 1
4.1 N/GluA1 interaction is only necessary for the exocytosis of GluA1 in basal conditions.
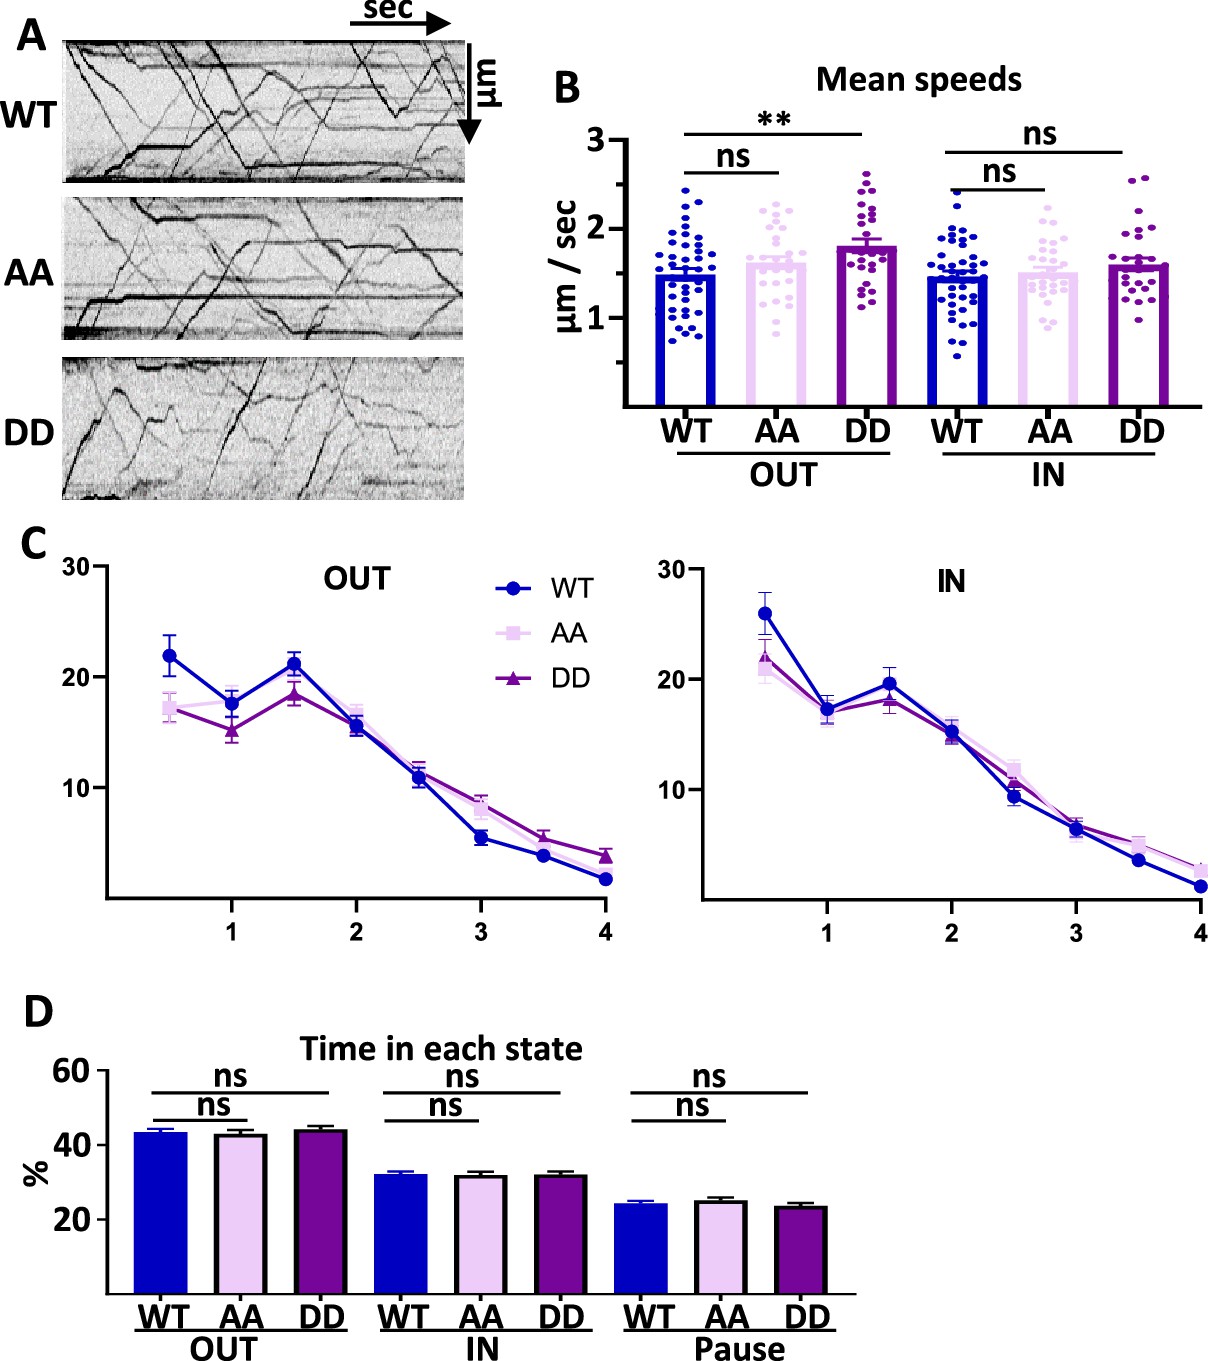
(A) Raw kymographs corresponding to Figure 3B. (B) Mean speeds OUT and IN of ARIAD-TdTom-GluA1-WT (WT), ARIAD-TdTom-GluA1-AA (AA), and ARIAD-TdTom-GluA1-DD (DD). (C) Frequency distribution of speeds OUT and IN directions for the different mutants as indicated. (D) Time spent by a vesicle in each state, OUT, IN, and Pause.
-
Figure 3—figure supplement 1—source data 1
Individual data values for the bar graphs in panels B and D.
- https://cdn.elifesciences.org/articles/85609/elife-85609-fig3-figsupp1-data1-v1.zip
Figure 4 with 1 supplement
SAP97 and SAP97/GluA1 interaction regulate GluA1 trafficking during cLTP.
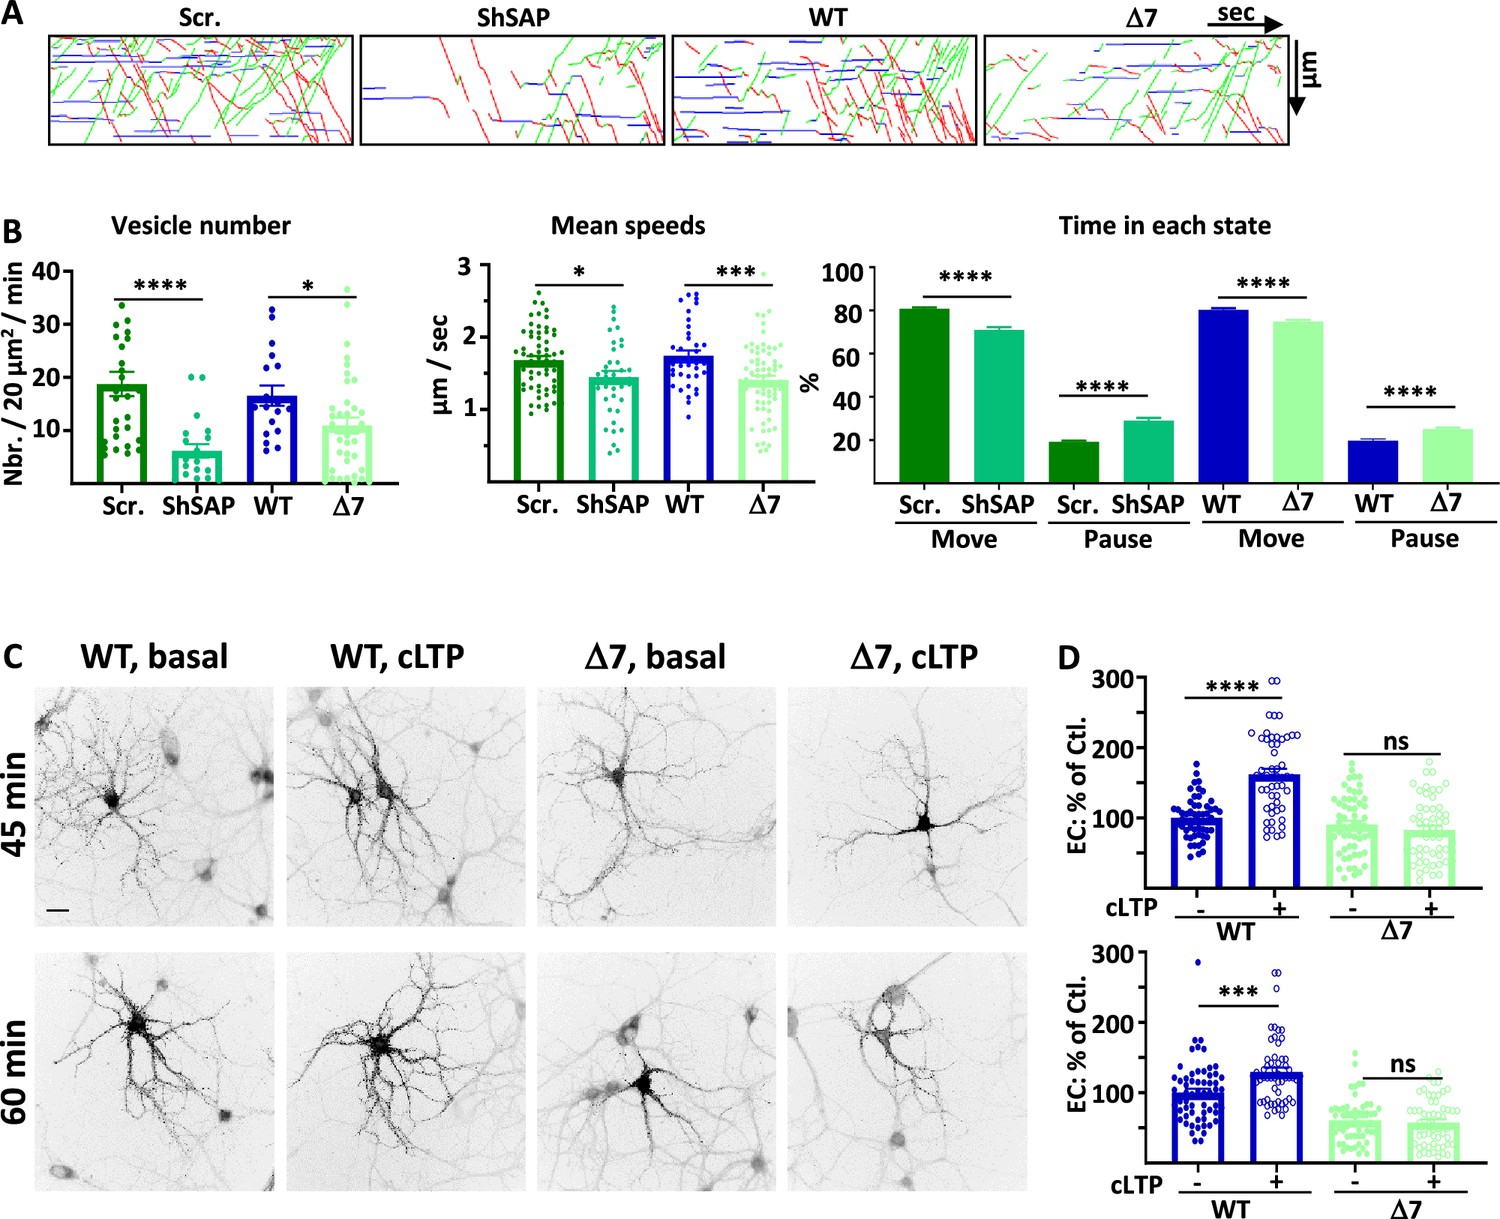
(A) Representative traced kymographs after LTP for ARIAD-TdTom-GluA1-WT co-transfected with scramble-RNA (Scr.) or with sh-SAP97 (ShSAP), ARIAD-TdTom-GluA1-WT (WT) and ARIAD-TdTom-GluA1-Δ7 (Δ7). (B) IT parameters of GluA1 in the different conditions as indicated 25-40 min after induction of cLTP: Vesicle number (vesicles/20 µm2/min; scr.: 18.77 +/−2.29, Sh-SAP97: 6.18 +/−1.25; WT: 16.55 +/−1.92, Δ7: 10.95 +/−1.50), mean speeds (µm/s; scr.: 1.68 +/−0.06, Sh-SAP97: 1.45 +/−0.09, WT: 1.74 +/−0.08; Δ7: 1.41 +/−0.06), time in each state (Move: scr.: 80.82 +/− 0.53%, Sh-SAP97: 70.99 +/−1.29%; pause: scr.: 19.18 +/−0.53%, Sh-SAP97: 29.00 +/−1.30%, and Move: WT: 79.63 +/−0.75%, Δ7: 76.45 +/−0.73%; pause: WT: 20.37 +/−0.75%, Δ7: 23.55 +/− 0.73%) (n=3). (C) Representative images of neurons for each condition 45-60 min after the addition of the AL, 25-40 after induction of cLTP. Scale bar: 25 µm. (D) Quantification of live immunolabeling before and after induction of cLTP for the GluA1-WT (WT) and GluA1-Δ7 (Δ7) mutant (% PM localization at 45 min: WT before LTP:100 +/−3.89, after LTP: 162.24 +/−7.71, Δ7 before LTP: 90.71 +/−5.50, after LTP: 82.78 +/−6.09; % PM localization at 60 min: WT before LTP: 100 +/−5.63, after LTP: 129.63 +/−6.22, Δ7 before LTP: 60.82 +/−4.27, after LTP: 57.62 +/−4.50) (n=3). Control (Ctl.) corresponds to extracellular (EC) labeling of the WT before LTP normalized to 100%.
-
Figure 4—source data 1
Individual data values for the bar graphs in panels B and D.
- https://cdn.elifesciences.org/articles/85609/elife-85609-fig4-data1-v1.zip
Figure 4—figure supplement 1
SAP97 and SAP97/GluA1 interaction regulate GluA1 trafficking during chemical long term potentiation (cLTP).
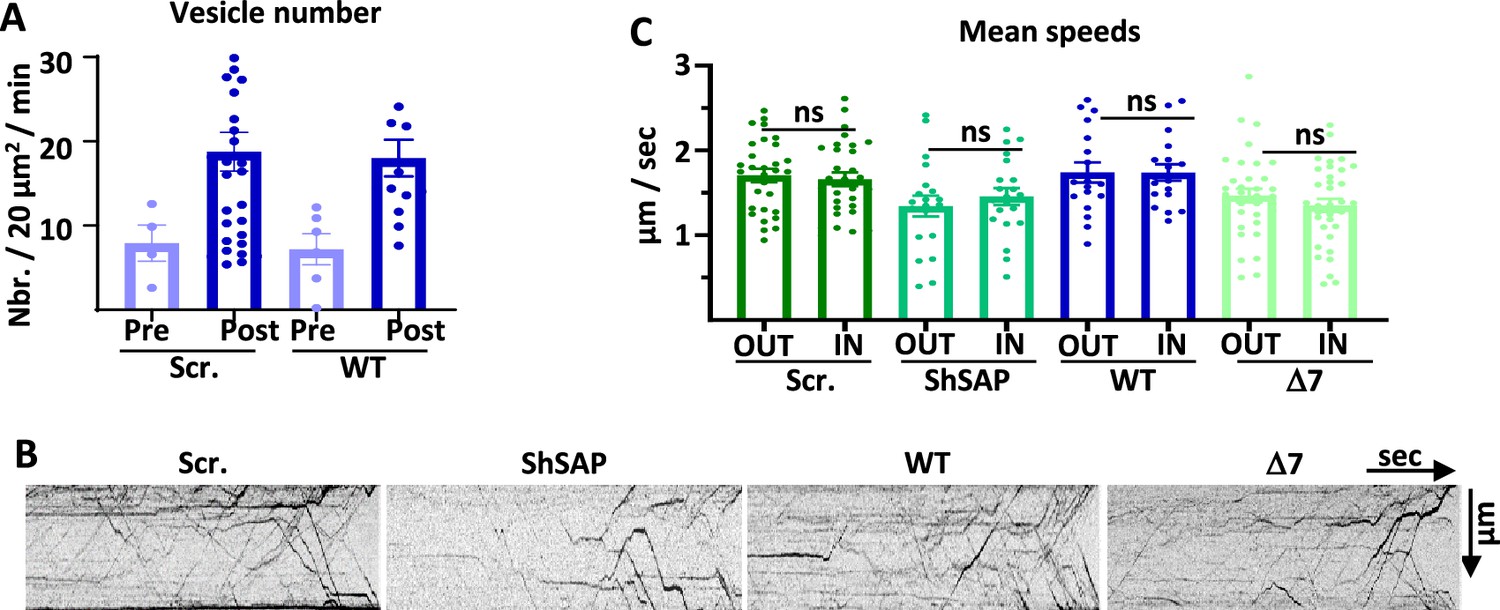
(A) Vesicle number before (Pre) and after (Post) cLTP induction for ARIAD-TdTom-GluA1-WT with the scramble (Scr.) RNA against SAP97 or when the GluA1-WT is expressed alone. (B) Raw kymographs corresponding to Figure 4A. (C) Mean speeds OUT and IN of the different conditions.
-
Figure 4—figure supplement 1—source data 1
Individual data values for the bar graphs in panels A and C.
- https://cdn.elifesciences.org/articles/85609/elife-85609-fig4-figsupp1-data1-v1.zip
Figure 5 with 1 supplement

4.1N and 4.1N/GluA1 interaction regulate GluA1 trafficking during chemical long term potentiation (cLTP).
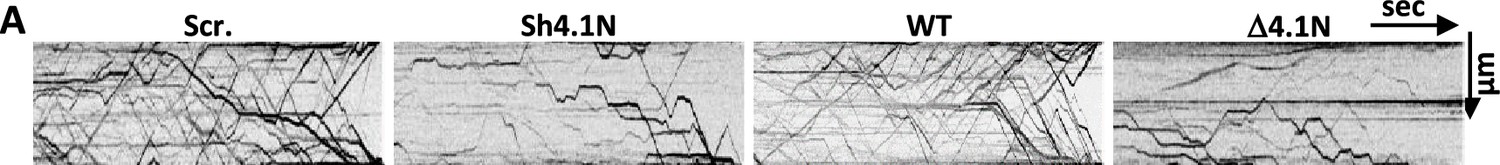
(A) Representative traced kymographs for ARIAD-TdTom-GluA1-WT co-transfected with scramble-RNA (Scr.) or with sh-4.1N (Sh4.1N), ARIAD-TdTom-GluA1-WT alone (WT) and ARIAD-TdTom-GluA1-Δ4.1N (Δ4.1N). (B) Intracellular transport (IT) parameters of GluA1 in the different conditions as indicated 25-40 min after induction of cLTP: Vesicle number (vesicles/20 µm2/min; scr.: 26.94 +/−2.59, Sh-4.1N: 15.75 +/−3.13; WT: 20.25 +/−2.42, Δ4.1N: 10.84 +/−1.23), mean speeds (µm/s; scr.: 1.72 +/−0.05, Sh-4.1N: 1.53 +/−0.07, WT: 1.69 +/−0.04; Δ4.1N: 1.51 +/−0.04), and time in each state (Move and Pause) (Move: scr.: 77.81 +/−0.50%, Sh-4.1N: 75.95 +/−0.67%; pause: scr.: 22.18 +/−0.50%, Sh-4.1N: 24.02 +/−0.67%, and Move: WT: 79.23 +/−0.54%, Δ4.1N: 75.34 +/−0.67%; pause: WT: 20.76 +/−0.54%, Δ4.1N: 24.70 +/−0.67%) (n=3). (C) Representative images of neurons for each condition 45-60 min after the addition of the AL, 25-40 min after induction of cLTP. Scale bar: 25 µm. (D) Quantification of live immunolabeling before and after induction of cLTP for the GluA1-WT (WT) and GluA1-Δ4.1N (Δ4.1N) mutant (% PM localization at 45 min.: WT before LTP: 100 +/−6.51, after LTP: 141.06 +/−7.17, Δ4.1N before LTP: 50.80 +/−3.37, after LTP: 58.59 +/−5.14; % PM localization at 60 min: WT before LTP: 100 +/−6.52, after LTP: 136.52 +/−7.47, Δ4.1N before LTP: 47.89 +/−3.98, after LTP: 45.04 +/−4.52) (n=3). Control (Ctl.) corresponds to extracellular (EC) labeling of the WT before LTP normalized to 100%.
-
Figure 5—source data 1
Individual data values for the bar graphs in panels B and D.
- https://cdn.elifesciences.org/articles/85609/elife-85609-fig5-data1-v1.zip
Figure 5—figure supplement 1
4.1 N and 4.1 N/GluA1 interaction regulate GluA1 trafficking during chemical long term potentiation (cLTP).
(A) Raw kymographs corresponding to Figure 5A.
Figure 6 with 1 supplement
4.1 N/GluA1 interaction drives intracellular transport of GluA1 during chemical long term potentiation (cLTP).
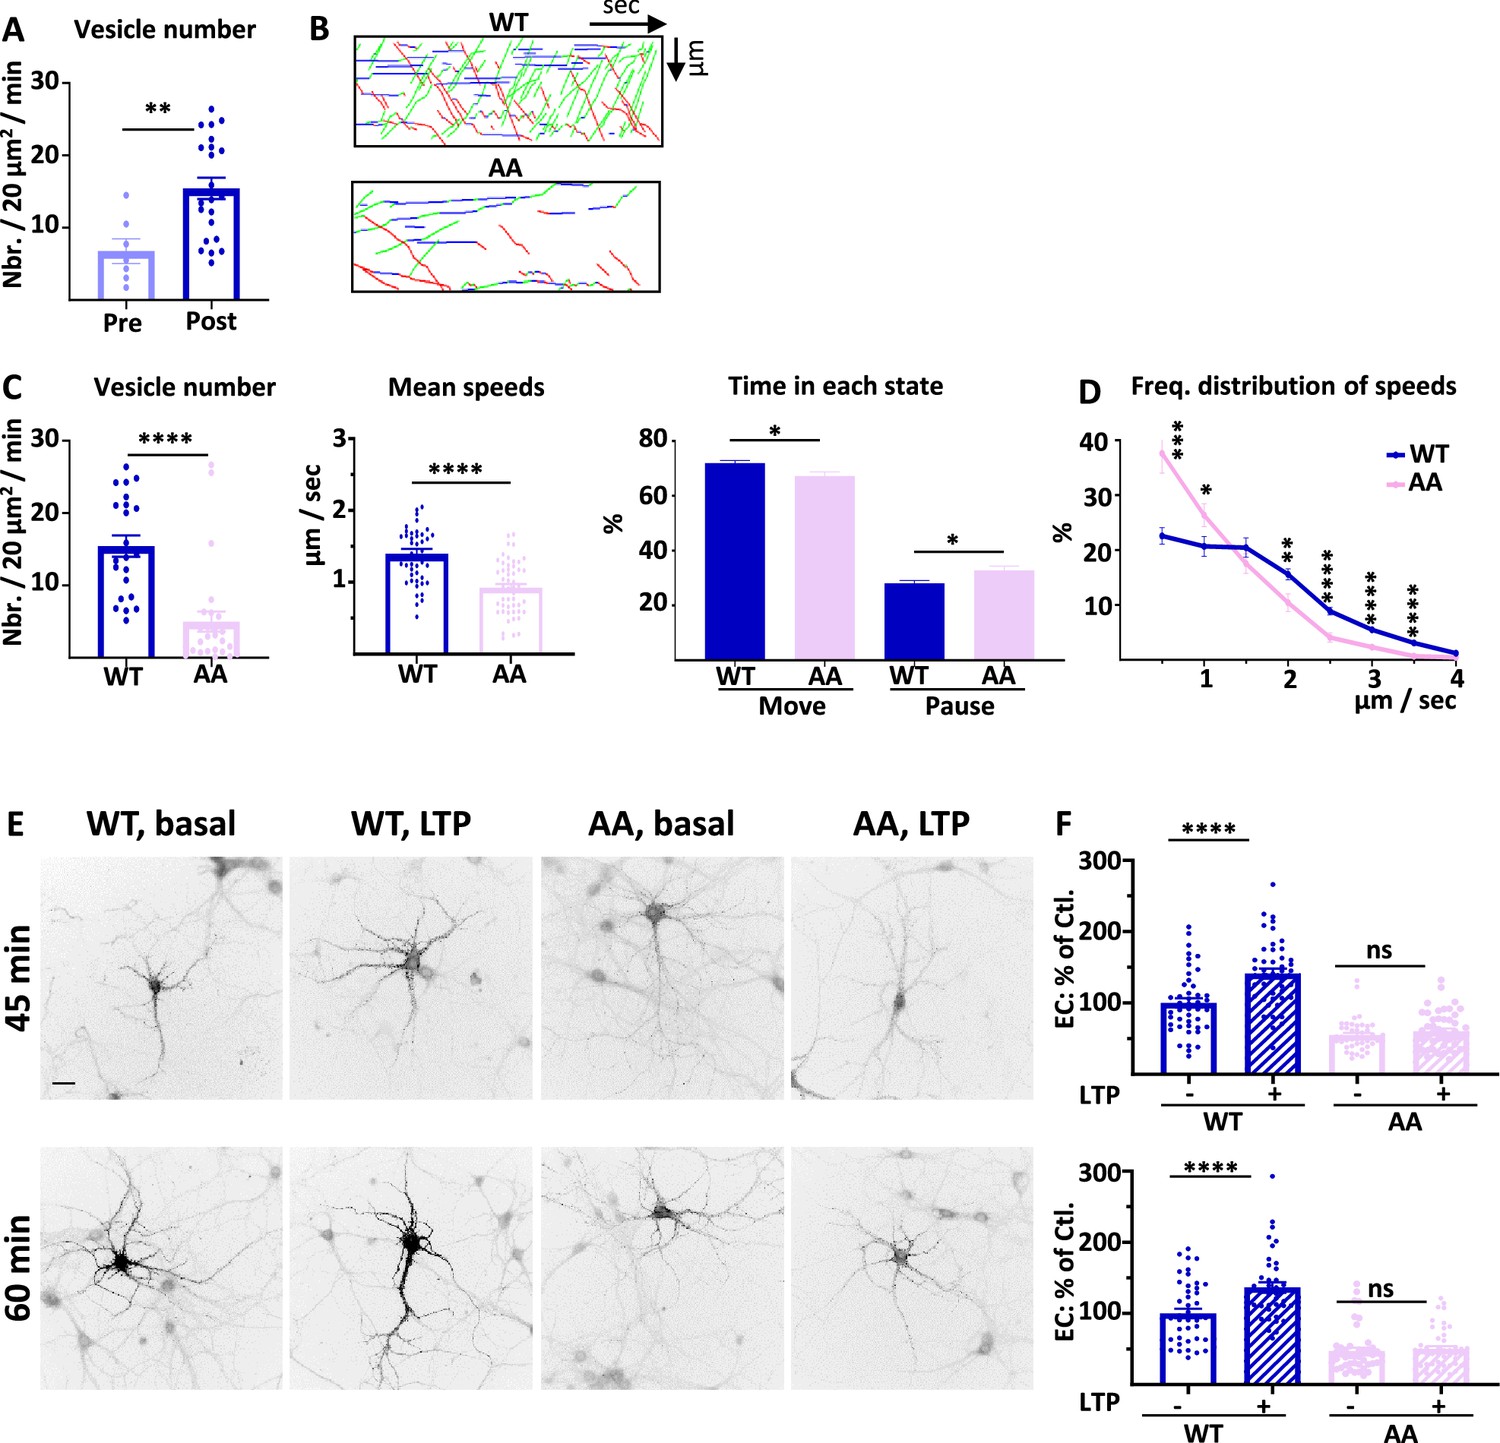
(A) Number of vesicles before (Pre) and after (Post) induction of cLTP for ARIAD-TdTom-GluA1-WT (vesicles/20 µm2/min; Pre cLTP: 6.77 +/−1.70, Post cLTP: 13.99 +/−1.52). (B) Representative traced kymographs for ARIAD-TdTom-GluA1-WT (WT) and ARIAD-TdTom-GluA1-AA (AA) 25–40 min after induction of cLTP. (C) IT parameters of GluA1 in the different conditions as indicated 25–40 min after induction of cLTP: Vesicle number (vesicles/20 µm2/min; GluA1-WT: 13.99 +/−1.52, AA: 4.99 +/−1.38), mean speeds of the vesicles (µm / sec: WT: 1.37 +/−0.06, AA: 0.92 +/−0.05) and time in each state (Move and Pause) (Move: WT: 71.68 +/−0.97%, AA: 67.22 +/−1.57%; pause: WT: 28.08 +/−0.97%, AA: 32.78 +/−1.57%). (D) Frequency distribution of speed for the two proteins after induction of cLTP.( E) Representative images for each condition 45 and 60 min after the addition of the AL, 25 and 40 min. after induction of cLTP. Scale bar: 25 µm. (F) Quantification of live labeling of GluA1 in WT and AA conditions, before and after cLTP (% PM localization at 45 min: WT before LTP:100 +/−6.51, after LTP: 141.06 +/−7.17, AA before LTP: 54.84 +/−3.27, after LTP: 60.31 +/−3.70; % PM localization at 60 min: WT before LTP: 100 +/−6.52, after LTP: 136.52 +/−7.47, AA before LTP: 47.17 +/−4.64, after LTP: 50.17 +/−4.04).
-
Figure 6—source data 1
Individual data values for the bar graphs in panels A, C, D and F.
- https://cdn.elifesciences.org/articles/85609/elife-85609-fig6-data1-v1.zip
Figure 6—figure supplement 1
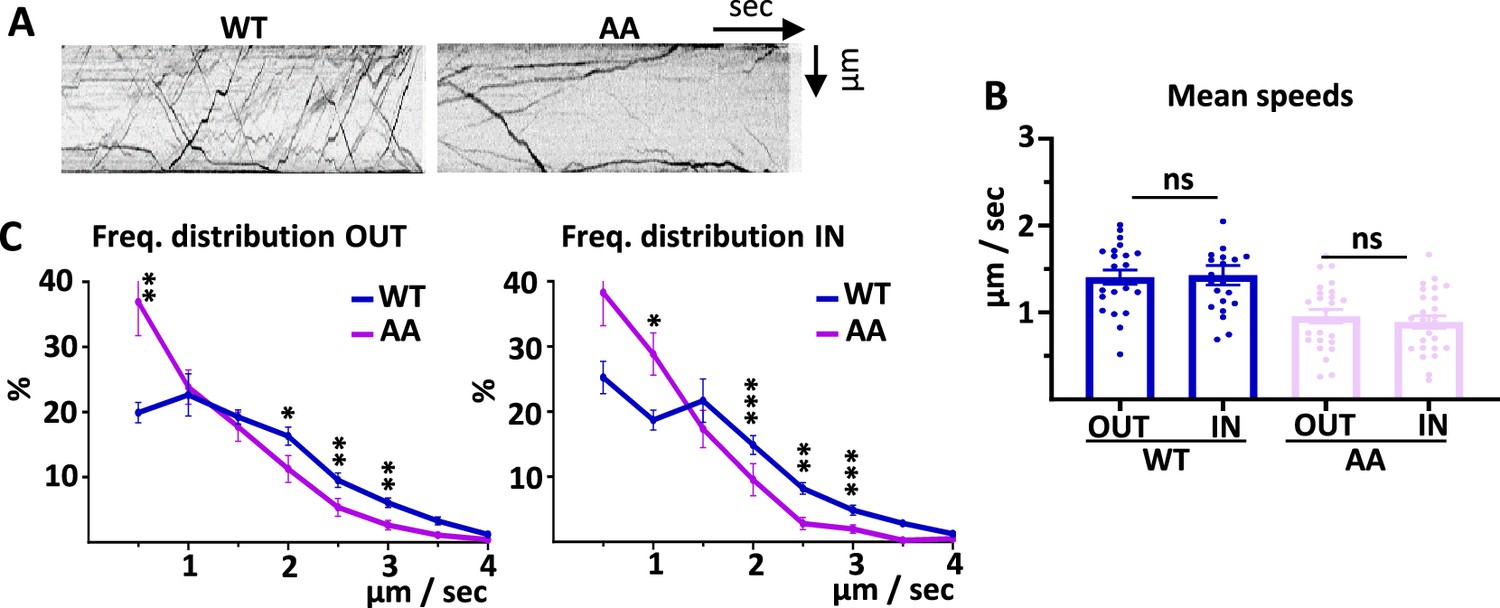
4.1 N/GluA1 interaction drives intracellular transport of GluA1 during chemical long term potentiation (cLTP).
(A) Raw kymographs corresponding to Figure 6B. (B) Mean speeds OUT and IN of the different conditions. (C) Frequency distribution of speeds OUT and IN for the two proteins WT and AA after induction of cLTP.
-
Figure 6—figure supplement 1—source data 1
Individual data values for the bar graphs in panels B and C.
- https://cdn.elifesciences.org/articles/85609/elife-85609-fig6-figsupp1-data1-v1.zip
Figure 7

Diagram showing the differential roles of 4.1N/GluA1 and SAP97/GluA1 in basal transmission and during chemical long term potentiation (cLTP).
In basal condition, upper panel, SAP97 participates in the different phases of intracellular transport (IT), and localization of GluA1 at the plasma membrane (PM) is decreased. The interaction between 4.1N and GluA1 is fundamental only for the exocytosis of the receptor at the PM. After induction of cLTP, down panel, SAP97 has the same effect than in the basal state. However, 4.1N regulates the exit from the ER/Golgi, the IT, and the exocytosis of GluA1.
Additional files
-
Supplementary file 1
Comparisons vesicle number, mean speed, and externalization of the mutants.
Values are calculated as a percentage of the corresponding WT GluA1 in the same set of experiments.
- https://cdn.elifesciences.org/articles/85609/elife-85609-supp1-v1.xlsx
-
Supplementary file 2
Statistical analysis of the results.
- https://cdn.elifesciences.org/articles/85609/elife-85609-supp2-v1.xlsx
-
MDAR checklist
- https://cdn.elifesciences.org/articles/85609/elife-85609-mdarchecklist1-v1.pdf
Download links
A two-part list of links to download the article, or parts of the article, in various formats.
Downloads (link to download the article as PDF)
Open citations (links to open the citations from this article in various online reference manager services)
Cite this article (links to download the citations from this article in formats compatible with various reference manager tools)
Regulation of different phases of AMPA receptor intracellular transport by 4.1N and SAP97
eLife 12:e85609.
https://doi.org/10.7554/eLife.85609


