Development and validation of COEWS (COVID-19 Early Warning Score) for hospitalized COVID-19 with laboratory features: A multicontinental retrospective study
- Turku PET Centre, University of Turku and Turku University Hospital, Finland
- Italian Hospital of Buenos Aires, Argentina
- 12 de Octubre University Hospital, Research Institute of Hospital 12 de Octubre (imas+12), Complutense University, Spain
- Vélez Sarsfield Hospital, Argentina
- Hospital Municipal de Agudos Dr Leónidas Lucero, Argentina
- Regional University Hospital of Málaga, Biomedical Research Institute of Málaga (IBIMA), University of Malaga, Spain
- Infanta Cristina University Hospital, Spain
- Division of Pharmacology & Toxicology, Department of Pharmaceutical Sciences, University of Vienna, Austria
Figures
Figure 1
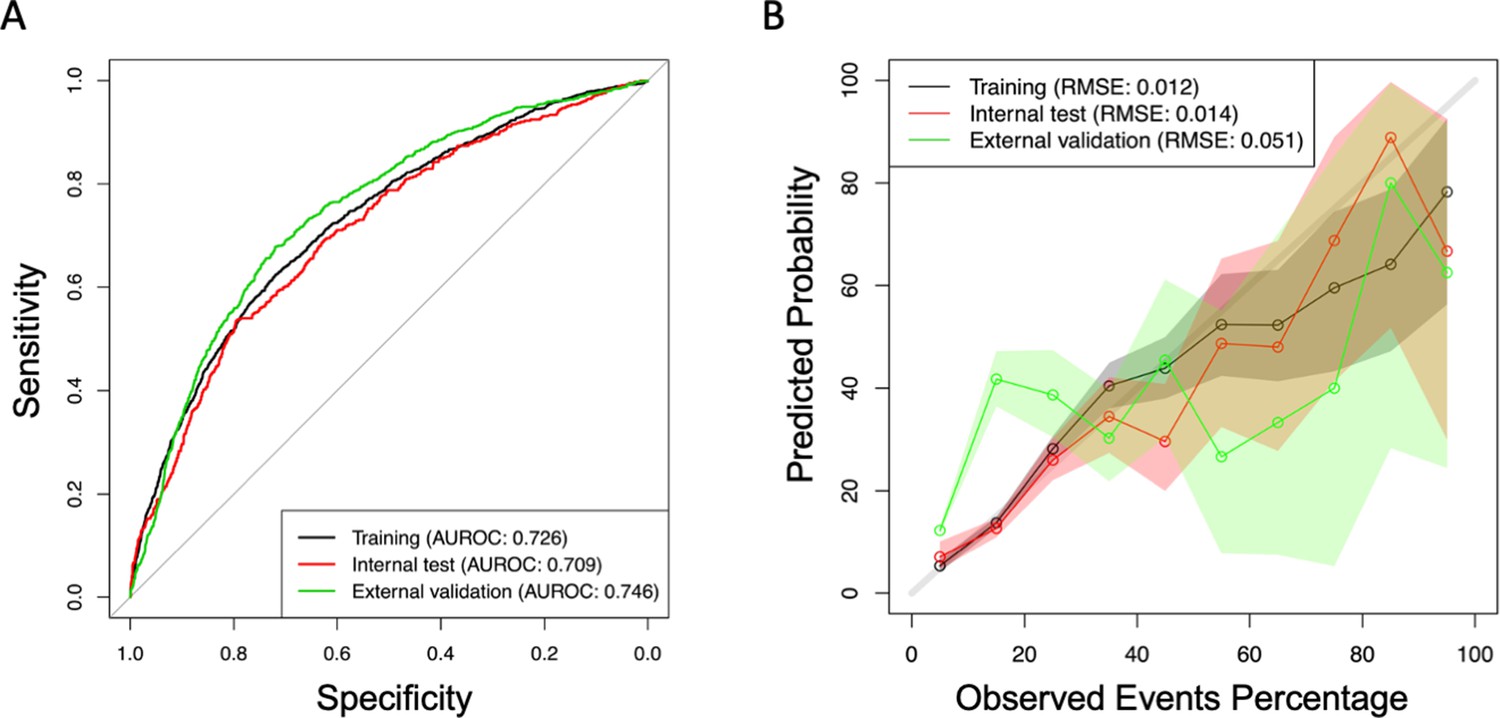
Area under the receiver operating characteristic curve (AUROC), (A) and calibration slopes for training and testing database (B).
Tables
Table 1
Demographic characteristics, with missing data for each variable for the training database.
We also include the coefficients of each variable included in the model.
| Values in training cohort | Missing, n (%) | Coefficient | |
|---|---|---|---|
| Sex (female) – n (%) | 3539 (47.1%) | 0 | 0.067 |
| Age in years – median (IQR) | 62.5 (47.8–78.7) | 0 | |
| Comorbidities | |||
| Cardiac insufficiency – n (%) | 65 (0.8%) | 0 | |
| Peripheral vascular disease – n (%) | 365 (5.0%) | 0 | |
| Brain vascular disease – n (%) | 332 (4.5%) | 0 | |
| Dementia – n (%) | 415 (5.5%) | 0 | |
| COPD – n (%) | 592 (8.0%) | 0 | |
| Asthma – n (%) | 543 (7.0%) | 0 | |
| Diabetes – n (%) | 1525 (20.0%) | 0 | |
| Kidney disease – n (%) | 81 (1.0%) | 0 | |
| Liver disease – n (%) | 864 (11.5%) | 0 | |
| Solid tumor – n (%) | 1312 (17.5%) | 0 | |
| HIV – n (%) | 59 (0.7%) | 0 | |
| Active smoker – n (%) | 521 (7.0%) | 0 | |
| Obesity – n (%) | 1590 (21.0%) | 0 | |
| Clinical parameters at admission | |||
| Temperature – Md (IQR) | 37.1 (36.5–37.9) | 53 (0.71) | |
| SBP– Md (IQR) | 127 (113–142) | 104 (1.39) | |
| Heart rate – Md (IQR) | 93 (80–106) | 76 (1.01) | |
| Respiration rate – Md (IQR) | 22 (18–28) | 5103 (67.98) | |
| O2_saturation (%) – Md (IQR) | 96 (93–98) | 102 (1.36) | 0.058 |
| Laboratory parameters | |||
| Sodium (mmol/l) – Md (IQR) | 137 (134–139) | 264 (3.52) | |
| Potassium (mmol/l) – Md (IQR) | 4.12 (3.79–4.5) | 272 (3.62) | |
| Glucose (mg/dl) – Md (IQR) | 116 (101–142) | 306 (4.08) | 0.002 |
| Leukocytes (×10³/mm³) – Md (IQR) | 6.8 (5.1–9.3) | 245 (3.26) | |
| Neutrophils (×10³/mm³) – Md (IQR) | 4.9 (3.5–7.2) | 245 (3.26) | 0.068 |
| Percentage of lymphocytes – Md (IQR) | 15.6 (9.9–22.6) | 245 (3.26) | 0.008 |
| Hemoglobin (g/dl) – Md (IQR) | 13.8 (12.4–15.1) | 244 (3.26) | 0.044 |
| Platelets (×10³/mm³) – Md (IQR) | 210 (161–272) | 245 (3.26) | 0.0006 |
| Lactate (mmol/l) – Md (IQR) | 1.5 (1.2–2.2) | 7367 (98.14) | |
| Creatinine (mg/dl) – Md (IQR) | 0.9 (0.72–1.16) | 342 (4.56) | |
| LDH (U/l) – Md (IQR) | 330 (266–419) | 995 (13.2) | |
| GOT (U/l) – Md (IQR) | 34 (25–51) | 737 (9.82) | |
| GPT (U/l) – Md (IQR) | 27 (17–46) | 453 (6.03) | |
| Bilirubine (mg/dl) – Md (IQR) | 0.5 (0.3–0.7) | 648 (8.63) | |
| aPTT – Md (IQR) | 30 (28–33) | 549 (7.31) | |
| Prothrombin activity (%) – Md (IQR) | 83 (74–93) | 545 (7.26) | |
| Intercept | 4.235 | ||
-
Model calculation C = A0 + A1* × 1 + A2* × 2 +A3* × 3 + A4* × 4 + A5* × 5 + A6* × 6 + A7* × 7. Example 4.23588…+−0.05808…*7.5 +…−0.06734*1 = −0.280637. aPTT: Activated Partial Thromboplastin Time, COPD: Chronic Obstructive Pulmonary Disease, GOT: glutamic-oxaloacetic transaminase, GPT: Glutamic-Pyruvic Transaminase, HIV : Human Immunodeficiency Virus, IQR: Intercuartile range, LDH: Lactate Dehydrogenase, SBP: Systolic Blood Pressure.
Table 2
Scores of the COVID-19 Early Warning Score (COEWS) predictive model. Green color means 0 points, yellow 1 point, ornge 2 points, and red 3 or more points.
| Parameters | 6 | 5 | 4 | 3 | 2 | 1 | 0 | 1 | 2 | 3 | 4 | 5 | 6 |
|---|---|---|---|---|---|---|---|---|---|---|---|---|---|
| SpO2 (%) | <85 | 85–86 | 87–88 | 89–90 | 91–92 | 93–95 | >95 | ||||||
| Neutrophils (×10³/mm³) | <1.5 | 1.5–8.0 | 8.1–9.0 | 9.1– 10.0 | 10.1– 11.0 | 11.1–12.0 | 12.1– 13.0 | >13 | |||||
| Hemoglobin (g/dl) | <9 | 10–11 | 12–17 | 18–19 | >19 | ||||||||
| Platelets (×10³/mm³) | <150 | 150–400 | >400 | ||||||||||
| Lymphocytes (%) | <8 | 8–20 | >20 | ||||||||||
| Glucose (mg/dl) | <90 | 90–140 | 141–187 | 188– 234 | 235– 280 | >280 | |||||||
| Sex | Male | Female | |||||||||||
| Global score | |||||||||||||
| Low risk 0–3 | |||||||||||||
| Moderate risk 4–5 | |||||||||||||
| High risk 6–7 | |||||||||||||
| Critical risk >7 | |||||||||||||
Table 3
Area under the receiver operating characteristic curve (AUROC) of the COVID-19 Early Warning Score (COEWS) predictive model calculated with the coefficients and with the score in vaccinated and unvaccinated patinetes.
| AUROC (95% CI) | Vaccinated | Non-vaccinated | ||
|---|---|---|---|---|
| EWS LASSO | EWS score | EWS LASSO | EWS score | |
| Training (Spanish data 75%) | 0.753 (0.656–0.851) | 0.748 (0.659–0.838) | 0.721 (0.706–0.736) | 0.723 (0.709–0.738) |
| Internal validation (Spanish data 25%) | 0.712 (0.565–0.859) | 0.684 (0.513–0.855) | 0.704 (0.677–0.732) | 0.711 (0.685–0.738) |
| External validation (Argentinian data) | 0.743 (0.703–0.784) | 0.700 (0.654–0.745) | 0.767 (0.749–0.785) | 0.741 (0.723–0.759) |
| NEWS2 in all databases | 0.677 (0.601–0.752) | 0.648 (0.608–0.689) | ||
| Patients hospitalized after July 2021 | 0.718 (0.569–0.867) | 0.682 (0.508–0.856) | 0.677 (0.612–0.742) | 0.705 (0.646–0.764) |
Additional files
-
Supplementary file 1
Original values plotted in the area under the receiver operating characteristic curve (AUROC) shown in Figure 1.
- https://cdn.elifesciences.org/articles/85618/elife-85618-supp1-v2.xlsx
-
Supplementary file 2
Original values plotted in the calibration curve shown in Figure 1.
- https://cdn.elifesciences.org/articles/85618/elife-85618-supp2-v2.xlsx
-
MDAR checklist
- https://cdn.elifesciences.org/articles/85618/elife-85618-mdarchecklist1-v2.docx
Download links
A two-part list of links to download the article, or parts of the article, in various formats.
Downloads (link to download the article as PDF)
Open citations (links to open the citations from this article in various online reference manager services)
Cite this article (links to download the citations from this article in formats compatible with various reference manager tools)
Development and validation of COEWS (COVID-19 Early Warning Score) for hospitalized COVID-19 with laboratory features: A multicontinental retrospective study
eLife 12:e85618.
https://doi.org/10.7554/eLife.85618


