Analysis of CDPK1 targets identifies a trafficking adaptor complex that regulates microneme exocytosis in Toxoplasma
- Whitehead Institute for Biomedical Research, United States
- Biology Department, Massachusetts Institute of Technology, United States
- Signaling in Apicomplexan Parasites Laboratory, The Francis Crick Institute, United Kingdom
Figures
Figure 1 with 1 supplement
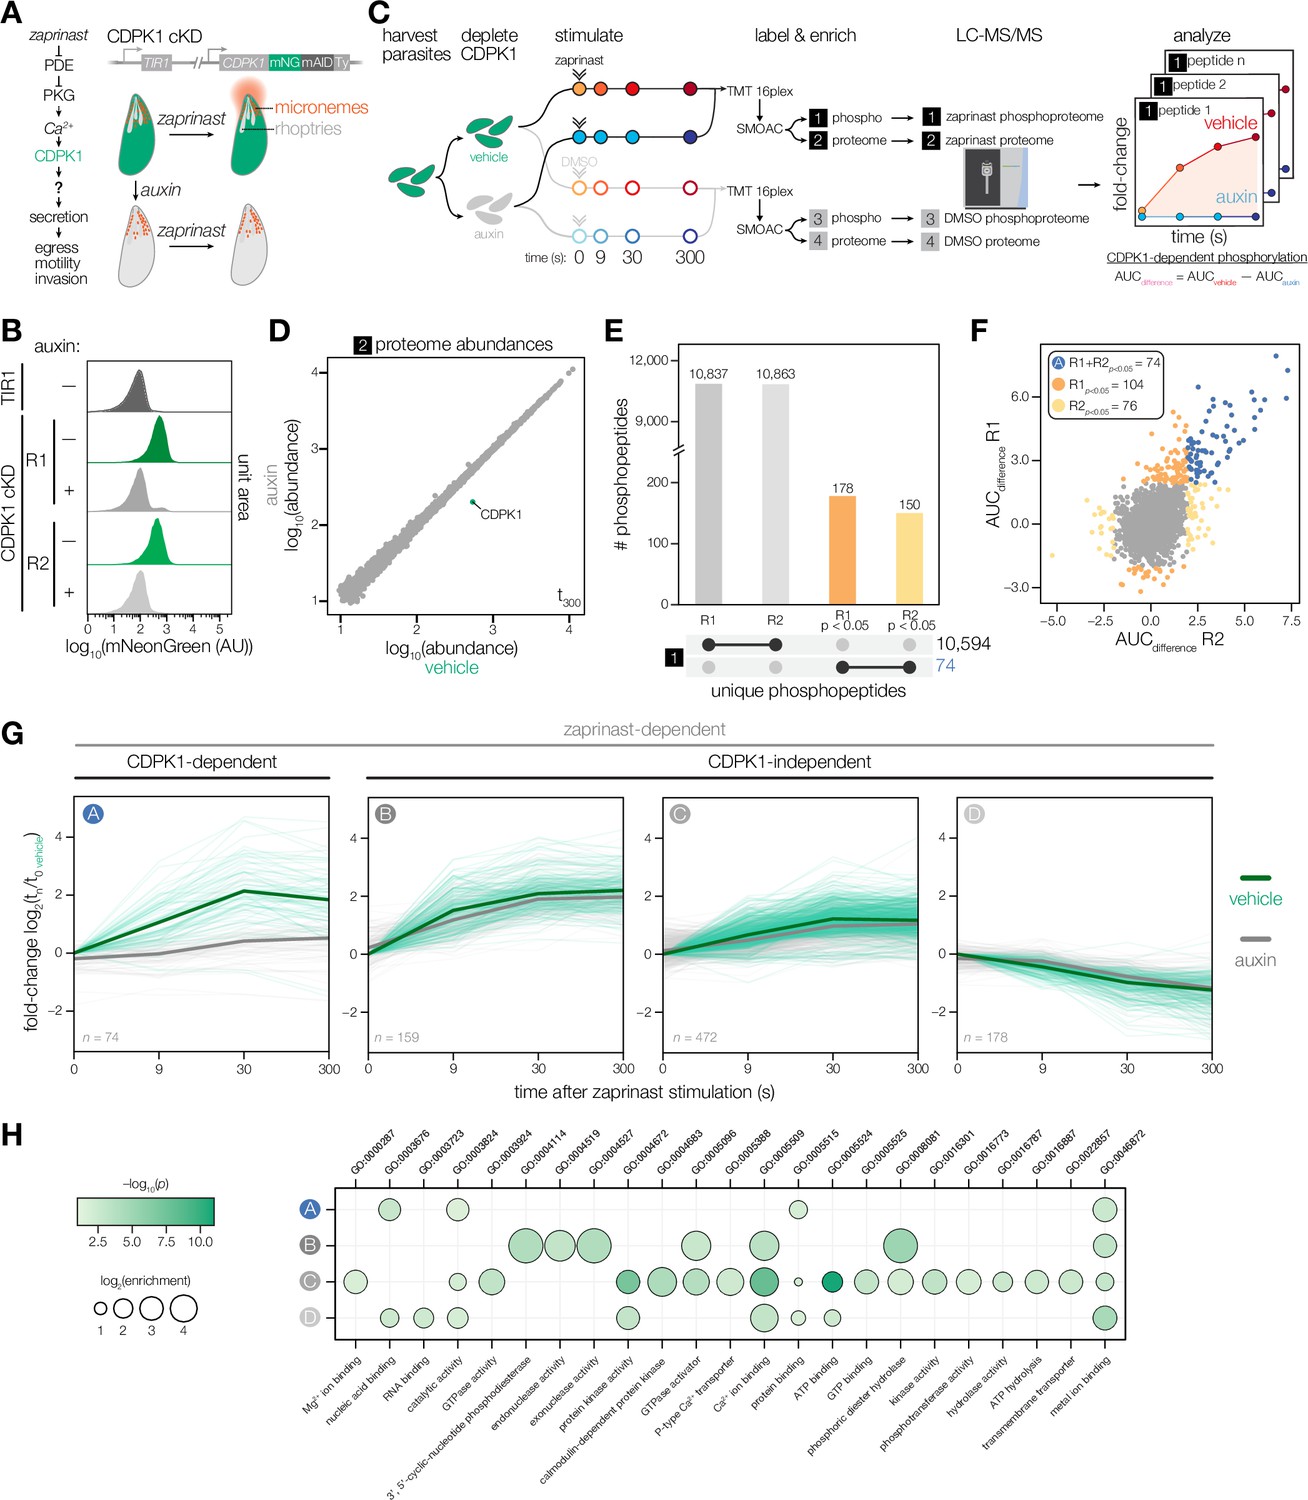
Identifying CDPK1-dependent phosphorylation with sub-minute resolution.
(A) Stimulating parasites with zaprinast triggers Ca2+-mediated activation of CDPK1, resulting in the secretion of microneme proteins (red) required for motile stages of the parasite. Conditional knockdown (cKD) of CDPK1 endogenously tagged with mNeonGreen-mAID-Ty (green) after auxin treatment. (B) Flow cytometry of mNeonGreen (mNG) fluorescence in extracellular CDPK1 cKD or parental TIR1 parasites treated with vehicle or auxin for 3.5 hr. (C) Schematic of phosphoproteomic time course. Parasites were harvested prior to CDPK1 depletion with auxin for 3.5 hs, followed by stimulation with zaprinast or vehicle (DMSO). Samples were collected at 0, 9, 30, and 300 s. The experiment was performed in biological replicates. Samples were labeled with TMTpro, pooled for analysis, and phosphopeptides were enriched using sequential metal-oxide affinity chromatography (SMOAC) prior to LC-MS/MS. Four sets of samples were generated: enriched phosphoproteomes for zaprinast [1] and DMSO [3], and proteomes for zaprinast [2] and DMSO [4]. Mock reporter ion intensities enabling relative quantification for a given peptide are shown to illustrate fold-change of unique phosphopeptide abundances during zaprinast stimulation. CDPK1-dependent phosphorylation is determined by calculating the area under the curve (AUC) difference between vehicle and auxin treatment conditions. (D) Protein abundances in the zaprinast proteome set [2] at 300 s comparing vehicle- and auxin-treated CDPK1 cKD parasites. (E) UpSet plot for the number of phosphopeptides identified in the enriched zaprinast phosphoproteome [1] across individual replicates. Phosphopeptides exhibiting CDPK1-dependent phosphorylation with p<0.05 are indicated. (F) Scatter plot of AUCdifference values of enriched zaprinast phosphopeptides [1] across biological replicates. Significance was determined by comparing the distribution of AUCdifference values from zaprinast phosphopeptides [1] to a null distribution of DMSO phosphopeptides [3] for individual replicates. (G) CDPK1-dependent and zaprinast-dependent phosphopeptide abundances over time. Ratios of zaprinast-treated samples relative to the vehicle-treated (no auxin) t = 0 samples. Median ratios of a group (solid lines). Individual phosphopeptides (opaque lines). CDPK1-dependent phosphopeptides (Group A) determined as described in (F). Zaprinast-dependent phosphopeptides (Groups B–D) were determined by comparing the distribution of AUCvehicle values from zaprinast phosphopeptides [1] to a null distribution of DMSO phosphopeptides [3]. Groups were determined by projection-based clustering. (H) GO terms enriched among phosphopeptides undergoing a significant change after zaprinast stimulation. Significance was determined using a hypergeometric test.
Figure 1—figure supplement 1
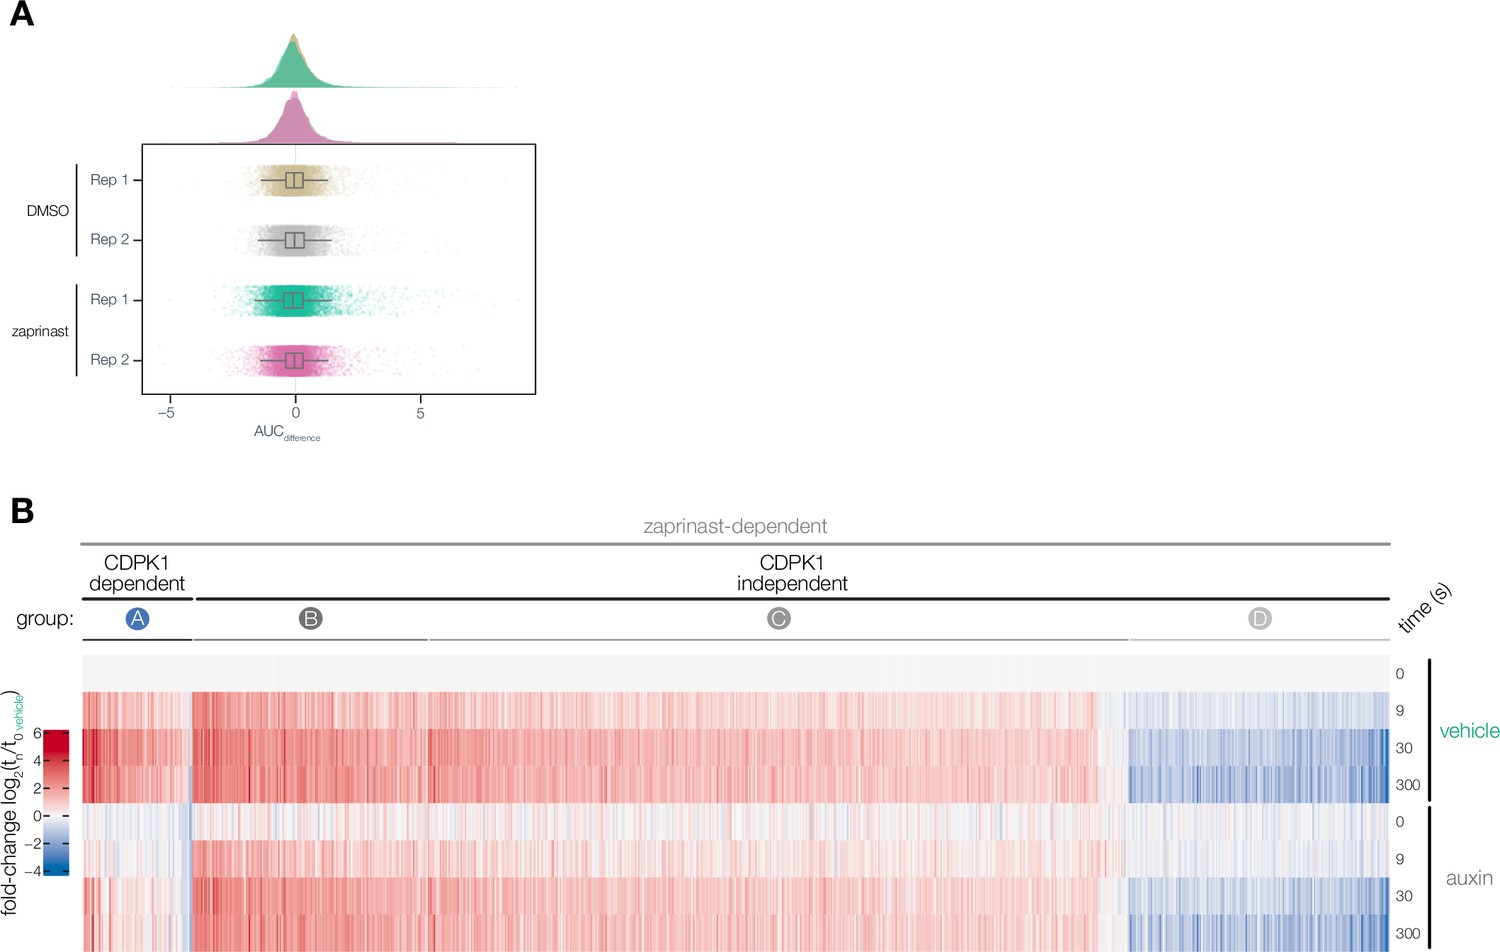
Zaprinast-dependent phosphoproteome.
(A) Distribution of AUCdifference values for individual peptides in the enriched DMSO phosphoproteome and enriched zaprinast phosphoproteome across two biological replicates. (B) Heatmap of zaprinast-dependent phosphopeptide abundance ratios across time relative to the vehicle t0 interval during auxin or vehicle treatment. Peptides are organized by CDPK1-dependent phosphopeptides (Group A) and CDPK1-independent phosphopeptides (Groups B–D).
Figure 2 with 1 supplement
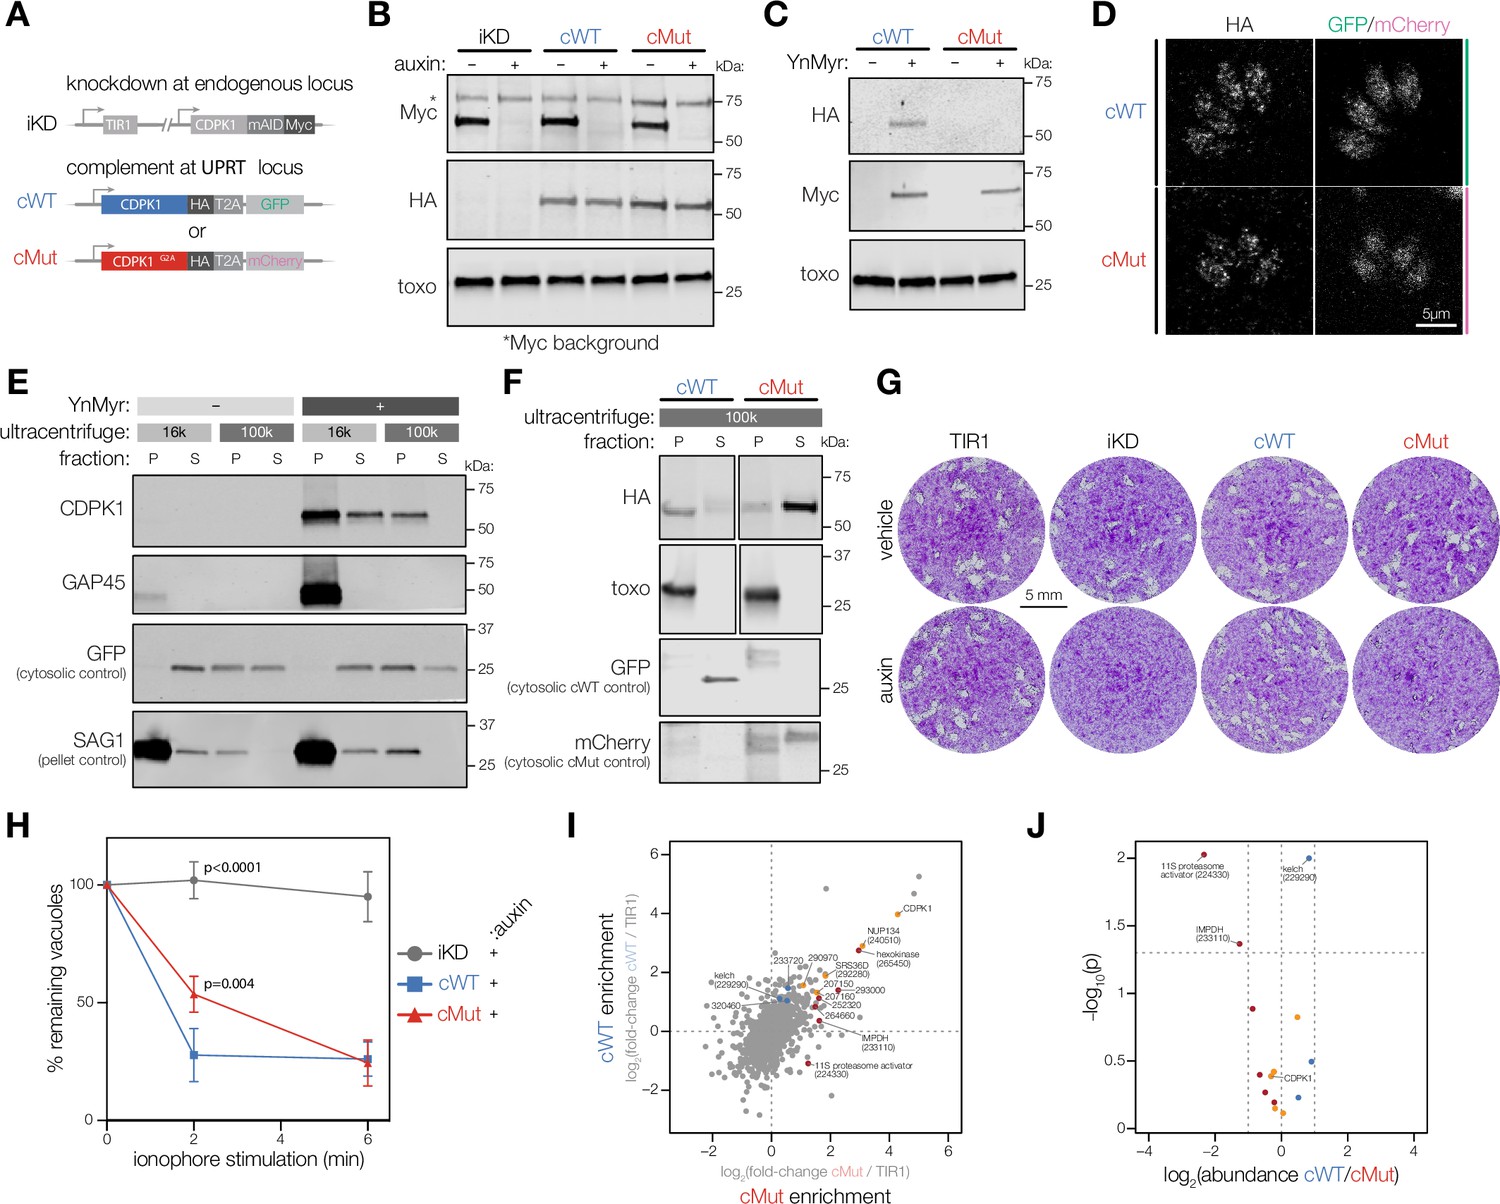
Myristoylation modulates CDPK1 activity and alters its interacting partners.
(A) Complementation strategy used to evaluate the functional importance of CDPK1 myristoylation. See Figure 2—figure supplement 1 for the construction of the inducible knock-down (iKD) (iKD) line. (B) Immunoblot demonstrating the auxin-dependent depletion of endogenous CDPK1 in the iKD, cWT, and cMut parasites (Myc) as well as equivalent expression of the complements (HA). T. gondii (toxo) antibody was used as a loading control. (C) Biochemical validation of complemented lines by YnMyr-dependent pulldown. Enrichment of WT and Mut complements (HA). The inducible endogenous CDPK1 (Myc) and T. gondii (toxo) antibody was used as enrichment and loading controls, respectively. (D) Localization of the complemented versions of CDPK1 and corresponding cytosolic reporters within cWT (GFP) and cMut (mCherry) by immunofluorescence. (E) Myristoylation-dependent subcellular partitioning of CDPK1. Localization of YnMyr-enriched CDPK1 was evaluated using differential centrifugation. The partitioning into pellet [P] and supernatant [S] fractions was detected by immunoblot (CDPK1) and compared to doubly acylated GAP45. GFP and SAG1 were used as S and P controls, respectively. As only half of the supernatant fraction was removed from the high-speed pellet (100,000 × g), the GFP signal is present in the latter. (F) Partitioning of complemented WT and mutant CDPK1 after high-speed centrifugation (HA). T. gondii (toxo) antibody was used as a P control, whereas GFP and mCherry were used as S controls for cWT and cMut, respectively. (G) Plaque assays demonstrating that myristoylation of CDPK1 is important for the lytic cycle of T. gondii. (H) Lack of CDPK1 myristoylation delays ionophore-induced egress from host cells. Each data point is an average of n = 3 biological replicates, error bars represent standard deviation. Significance calculated using one-way ANOVA with Tukey’s multiple-comparison test. See Figure 2—figure supplement 1 for vehicle controls. (I) Immunoprecipitation-MS (IP-MS) of CDPK1-HA in cWT, cMut, and untagged TIR1 parasites across n = 2 biological replicates. Significantly enriched proteins with at least one unique peptide are highlighted based on the following thresholds: significant enrichment in both cWT and cMut (orange) with pcWT<0.05, pcMut<0.05, cWT log2 fold-change > 1, cMut log2 fold-change > 1, significant enrichment in exclusively cWT (blue) or cMut (red) with similar criteria across both pulldowns; t-tests were Benjamini–Hochberg corrected. (J) Fold-enrichment comparing cWT and cMut pulldowns of significantly enriched proteins from I; t-tests were Benjamini–Hochberg corrected.
-
Figure 2—source data 1
This file contains source data that was used to generate the blot in Figure 2B (Myc, LI-COR).
- https://cdn.elifesciences.org/articles/85654/elife-85654-fig2-data1-v1.zip
-
Figure 2—source data 2
This file contains source data that was used to generate the blot in Figure 2B (HA, LI-COR).
- https://cdn.elifesciences.org/articles/85654/elife-85654-fig2-data2-v1.zip
-
Figure 2—source data 3
This file contains source data that was used to generate the blot in Figure 2B (toxo, LI-COR).
- https://cdn.elifesciences.org/articles/85654/elife-85654-fig2-data3-v1.zip
-
Figure 2—source data 4
This file contains source data that was used to generate the blot in Figure 2C (HA, LI-COR).
- https://cdn.elifesciences.org/articles/85654/elife-85654-fig2-data4-v1.zip
-
Figure 2—source data 5
This file contains source data that was used to generate the blot in Figure 2C (Myc, LI-COR).
- https://cdn.elifesciences.org/articles/85654/elife-85654-fig2-data5-v1.zip
-
Figure 2—source data 6
This file contains source data that was used to generate the blot in Figure 2C (toxo, LI-COR).
- https://cdn.elifesciences.org/articles/85654/elife-85654-fig2-data6-v1.zip
-
Figure 2—source data 7
This file contains source data that was used to generate the blot in Figure 2E (CDPK1, GFP, LI-COR).
- https://cdn.elifesciences.org/articles/85654/elife-85654-fig2-data7-v1.zip
-
Figure 2—source data 8
This file contains source data that was used to generate the blot in Figure 2E (GAP45, SAG1, LI-COR).
- https://cdn.elifesciences.org/articles/85654/elife-85654-fig2-data8-v1.zip
-
Figure 2—source data 9
This file contains source data that was used to generate the blot in Figure 2F (HA, LI-COR).
- https://cdn.elifesciences.org/articles/85654/elife-85654-fig2-data9-v1.zip
-
Figure 2—source data 10
This file contains source data that was used to generate the blot in Figure 2F (toxo, LI-COR).
- https://cdn.elifesciences.org/articles/85654/elife-85654-fig2-data10-v1.zip
-
Figure 2—source data 11
This file contains source data that was used to generate the blot in Figure 2F (GFP, LI-COR).
- https://cdn.elifesciences.org/articles/85654/elife-85654-fig2-data11-v1.zip
-
Figure 2—source data 12
This file contains source data that was used to generate the blot in Figure 2F (mCherry, LI-COR).
- https://cdn.elifesciences.org/articles/85654/elife-85654-fig2-data12-v1.zip
-
Figure 2—source data 13
This file contains the annotated source data that were used to generate blots in Figure 2.
- https://cdn.elifesciences.org/articles/85654/elife-85654-fig2-data13-v1.zip
-
Figure 2—source data 14
This file contains source data that was used to make the graph presented in Figure 2H (GraphPad Prism data).
- https://cdn.elifesciences.org/articles/85654/elife-85654-fig2-data14-v1.zip
Figure 2—figure supplement 1
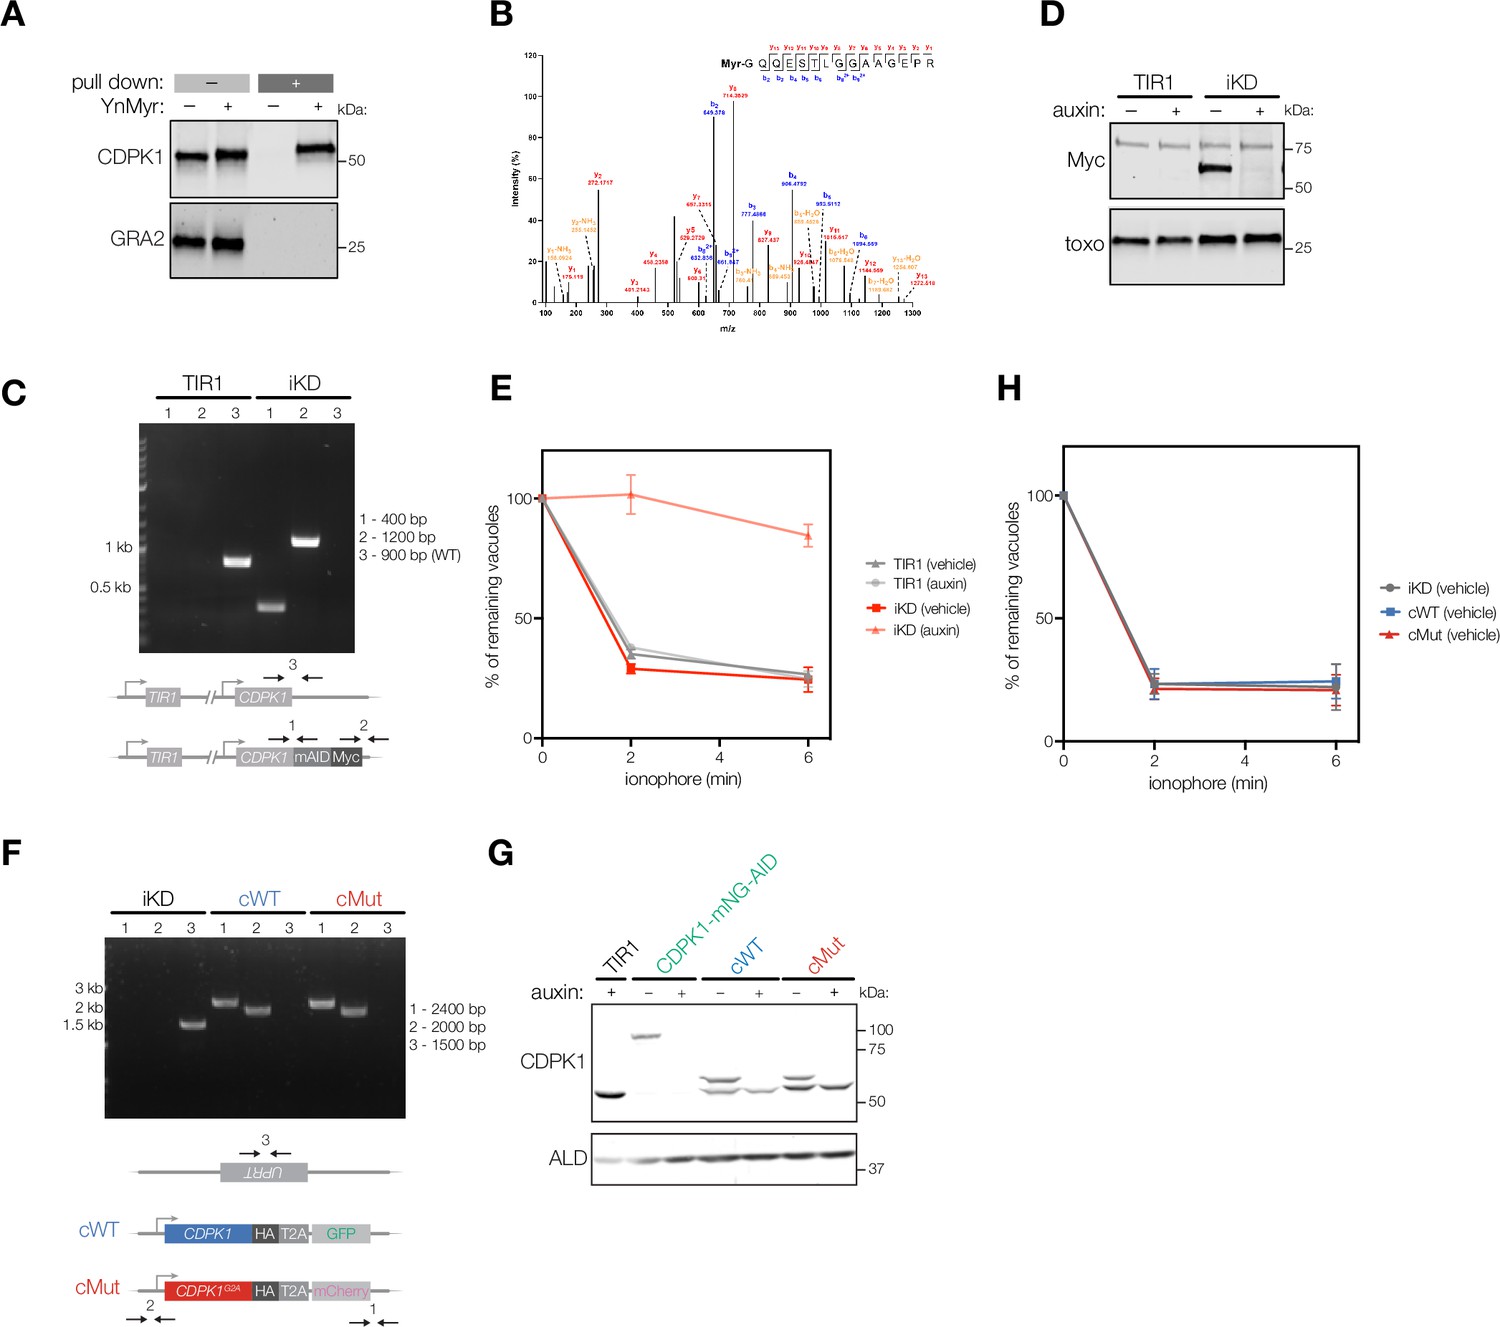
CDPK1 myristoylation, inducible knockdown, and complementation.
(A) YnMyr-dependent pulldown confirming myristoylation of CDPK1. GRA2 antibody was used as a loading control. (B) MS2 fragmentation spectra indicating myristoylation of Gly2 of CDPK1 after YnMyr-dependent pulldown. (C) PCR analysis confirming correct integration of the mAID cassette at the C terminus of endogenous CDPK1 in the TIR1 line. (D) Immunoblot validation of auxin-dependent depletion of CDPK1 in the inducible knock-down (iKD) line using the anti-Myc antibody and the anti-toxo antibody as a loading control. The band at 75 kDa represents anti-Myc-related background. (E) Conditional depletion of CDPK1 abolishes ionophore-induced egress from host cells. Intracellular parasites were treated with auxin or vehicle (EtOH) for 2 hr and egress was initiated by addition of 8 µM A23187. The number of intact vacuoles was monitored over the course of 6 min. Each data point is an average of two biological replicates, each in technical triplicate, error bars represent standard deviation. (F) PCR analysis confirming correct integration of the complementation constructs encoding the WT (cWT) and myristoylation mutant (cMut) copies of CDPK1 at the UPRT locus of the iKD line. Primers are indicated by arrows. Base pairs (bp). (G) Immunoblot of CDPK1 levels from endogenous and tagged loci after auxin treatment using the anti-CDPK1 antibody and the anti-aldolase antibody as a loading control. (H) In the absence of auxin, both cWT and cMut parasites egress from host cells within 2 min post-ionophore treatment.
-
Figure 2—figure supplement 1—source data 1
This file contains source data that was used to generate the blot in Figure 2—figure supplement 1 (CDPK1, LI-COR).
- https://cdn.elifesciences.org/articles/85654/elife-85654-fig2-figsupp1-data1-v1.zip
-
Figure 2—figure supplement 1—source data 2
This file contains source data that was used to generate the blot in Figure 2—figure supplement 1 (GRA2, LI-COR).
- https://cdn.elifesciences.org/articles/85654/elife-85654-fig2-figsupp1-data2-v1.zip
-
Figure 2—figure supplement 1—source data 3
This file contains source data that was used to generate the blot in Figure 2—figure supplement 1 (Myc, LI-COR).
- https://cdn.elifesciences.org/articles/85654/elife-85654-fig2-figsupp1-data3-v1.zip
-
Figure 2—figure supplement 1—source data 4
This file contains source data that was used to generate the blot in Figure 2—figure supplement 1 (toxo, LI-COR).
- https://cdn.elifesciences.org/articles/85654/elife-85654-fig2-figsupp1-data4-v1.zip
-
Figure 2—figure supplement 1—source data 5
This file contains source data that was used to generate the DNA gel in Figure 2—figure supplement 1 (iKD integration).
- https://cdn.elifesciences.org/articles/85654/elife-85654-fig2-figsupp1-data5-v1.zip
-
Figure 2—figure supplement 1—source data 6
This file contains source data that was used to generate the DNA gel in Figure 2—figure supplement 1 (cWT, cMut integration).
- https://cdn.elifesciences.org/articles/85654/elife-85654-fig2-figsupp1-data6-v1.zip
-
Figure 2—figure supplement 1—source data 7
This file contains source data that was used to generate the blot in Figure 2—figure supplement 1 (CDPK1, LI-COR 700).
- https://cdn.elifesciences.org/articles/85654/elife-85654-fig2-figsupp1-data7-v1.zip
-
Figure 2—figure supplement 1—source data 8
This file contains source data that was used to generate the blot in Figure 2—figure supplement 1 (CDPK1, LI-COR 800).
- https://cdn.elifesciences.org/articles/85654/elife-85654-fig2-figsupp1-data8-v1.zip
-
Figure 2—figure supplement 1—source data 9
This file contains the annotated source data that were used to generate blots in Figure 2—figure supplement 1.
- https://cdn.elifesciences.org/articles/85654/elife-85654-fig2-figsupp1-data9-v1.zip
-
Figure 2—figure supplement 1—source data 10
This file contains source data that was used to make the graph presented in Figure 2—figure supplement 1E (GraphPad Prism data).
- https://cdn.elifesciences.org/articles/85654/elife-85654-fig2-figsupp1-data10-v1.zip
-
Figure 2—figure supplement 1—source data 11
This file contains source data that was used to make the graph presented in Figure 2—figure supplement 1G (GraphPad Prism data).
- https://cdn.elifesciences.org/articles/85654/elife-85654-fig2-figsupp1-data11-v1.zip
Figure 3 with 1 supplement
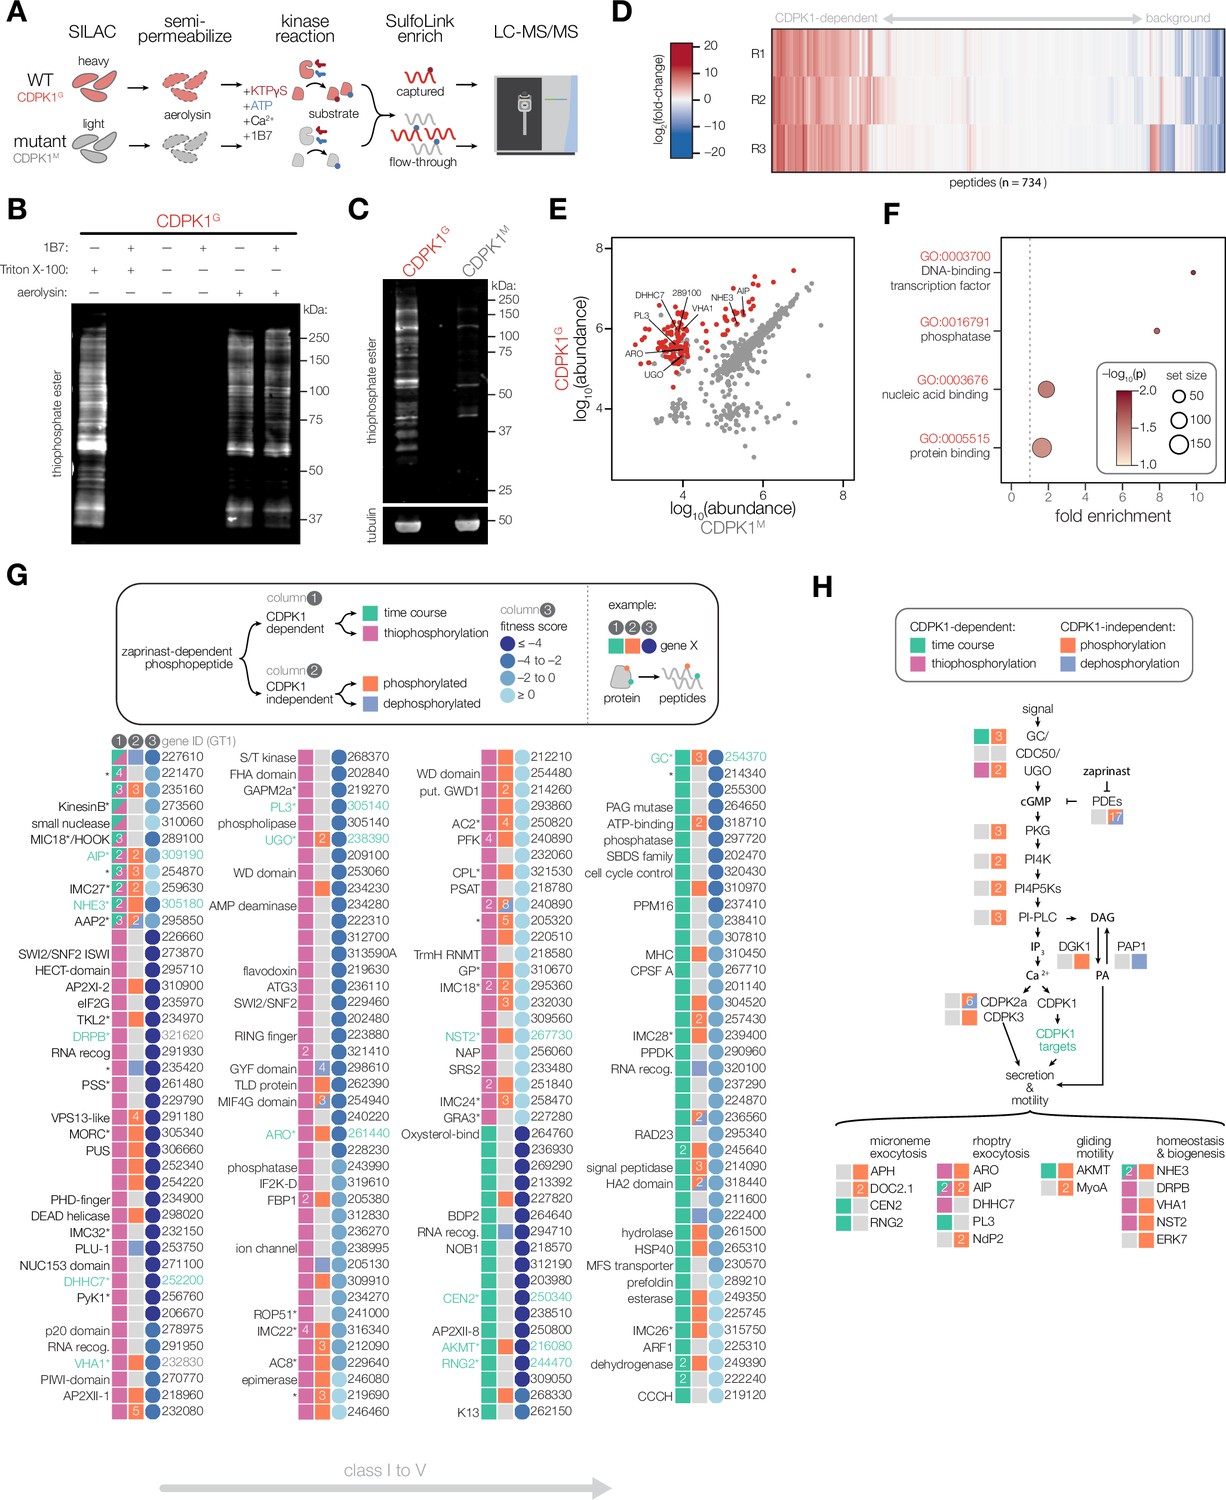
Identifying the direct substrates of CDPK1.
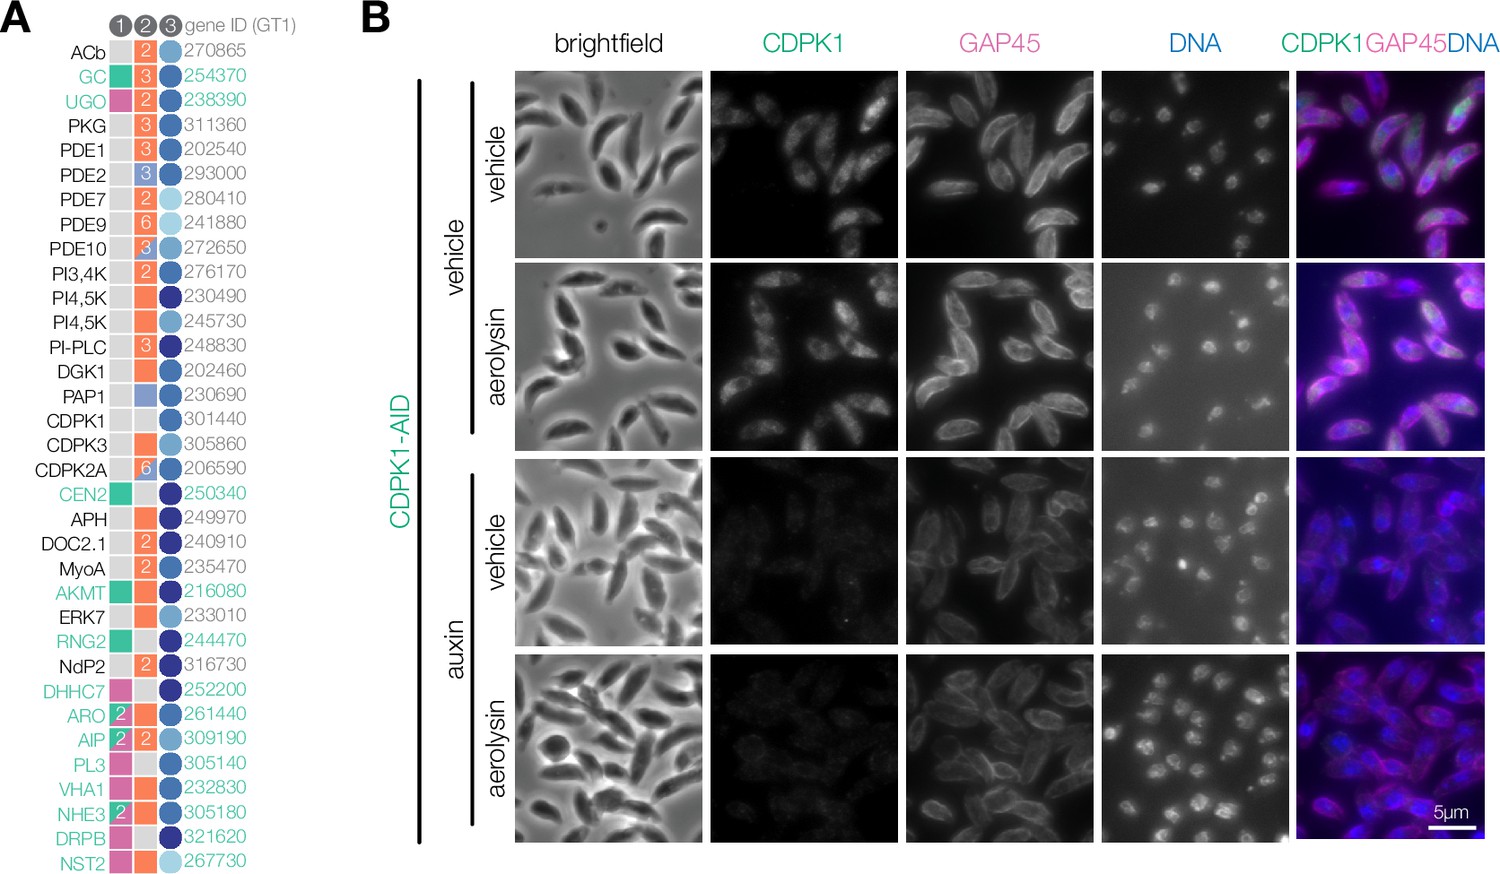
(A) Schematic describing a strategy to identify direct substrates of CDPK1. WT (CDPK1G) and mutant (G128M; CDPK1M) parasites were grown in stable isotope labeling of amino acids in cell culture (SILAC) media for multiplexed quantitation. Extracellular parasites were semi-permeabilized with aerolysin, enabling diffusion of small molecules but not proteins. CDPK1 substrate labeling was initiated by treating semi-permeabilized parasites with Ca2+, KTPγS, ATP, and 1B7. While CDPK1 in both WT and mutant parasites can utilize ATP to phosphorylate substrates, only WT parasites can use KTPγS to thiophosphorylate substrates. Thiophosphorylated peptides were specifically enriched and the remaining flow-through was saved for whole-proteome analysis. Enriched and whole-proteome samples were analyzed by LC-MS/MS. (B) 1B7 nanobody treatment inhibits non-specific extracellular kinase activity of CDPK1. Thiophosphorylated substrates were detected in lysates using an anti-thiophosphate ester antibody immunoblot. Extracellular CDPK1 activity (lane 1) was blocked by 1B7 (lane 2). Aerolysin treatment resulted in intracellular labeling (lane 5) that was unaffected by 1B7 (lane 6). (C) Thiophosphorylation performed in aerolysin-treated parasites comparing WT (CDPK1G) and mutant (CDPK1M) strains. Detection was performed as in (B). Tubulin was used as a loading control. (D) Heatmap quantification of peptides using LC-MS/MS. Fold-change of peptide abundance shown as a ratio of WT (CDPK1G) to mutant (CDPK1M) abundances. Experiment was performed in n = 3 biological replicates. (E) Abundances of unique peptides after thiophosphorylation in CDPK1G and CDPK1M parasites across n = 3 biological replicates. Significantly enriched phosphorylated peptides are colored in red (-log10(p)*fold-change >4), one-tailed t-test. (F) GO terms enriched among significant phosphopeptides from (E). Significance was determined using a hypergeometric test. (G) Putative targets of CDPK1 determined by sub-minute phosphoproteomics and thiophosphorylation of direct substrates. For a given CDPK1 target gene, the presence of a unique peptide phosphorylated in a CDPK1-dependent manner (column 1) is indicated if identified in the time course (green) and/or thiophosphorylation (magenta). The presence of additional unique phosphorylated peptides exhibiting zaprinast-dependent effects (column 2) is indicated if the peptide was phosphorylated (orange) or dephosphorylated (blue). Numbered boxes indicate multiple unique peptides. Fitness scores (column 3) obtained from genome-wide KO screen data (blues). Lower scores indicate gene is required for lytic stages of the parasite. Gene names (left), TGGT1 gene IDs (right). Gene names with asterisks (*) are associated with published data. (H) Signaling diagram describing parasite motility. Proteins exhibiting CDPK1-dependent phosphorylation by either sub-minute phosphoproteomics or thiophosphorylation are indicated (green). Proteins exhibiting CDPK1-independent phosphorylation (red) or dephosphorylation (blue) are indicated.
-
Figure 3—source data 1
This file contains source data that was used to generate the blot in Figure 3 (thiophosphate ester, LI-COR 700 channel).
- https://cdn.elifesciences.org/articles/85654/elife-85654-fig3-data1-v1.zip
-
Figure 3—source data 2
This file contains source data that was used to generate the blot in Figure 3 (thiophosphate ester, LI-COR 700 channel).
- https://cdn.elifesciences.org/articles/85654/elife-85654-fig3-data2-v1.zip
-
Figure 3—source data 3
This file contains source data that was used to generate the blot in Figure 3 (TUB1, LI-COR 800 channel).
- https://cdn.elifesciences.org/articles/85654/elife-85654-fig3-data3-v1.zip
-
Figure 3—source data 4
This file contains the annotated source data that were used to generate blots in Figure 3.
- https://cdn.elifesciences.org/articles/85654/elife-85654-fig3-data4-v1.zip
Figure 3—figure supplement 1
Factors controlling parasite motility.
(A) Expanded list of factors involved in parasite motile stages from Figure 3H. (B) CDPK1 localized in fixed extracellular parasites after aerolysin treatment. GAP45 and Hoechst are used as counterstains.
Figure 4 with 1 supplement
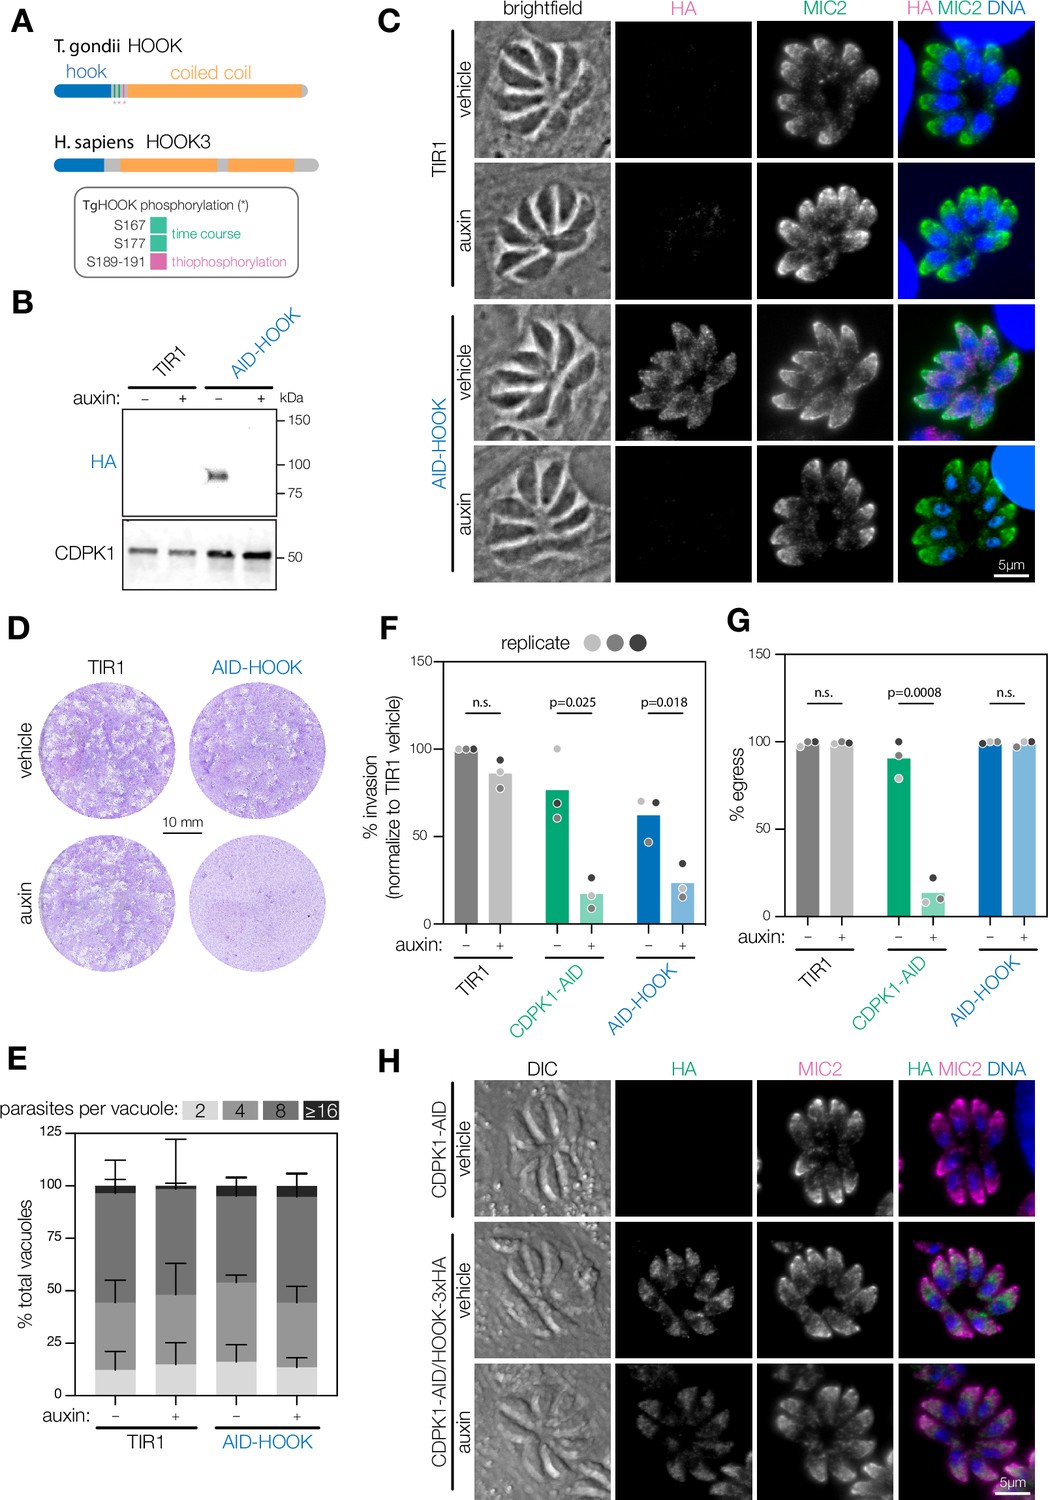
HOOK is required for host cell invasion, but dispensable for egress.
(A) Schematic of T. gondii and H. sapiens HOOK protein domains. HOOK domain (blue), coiled-coil domain (yellow), sites phosphorylated by CDPK1 (red). (B) Immunoblot of HOOK conditional knockdown parasites (AID-HOOK) after auxin treatment for 40 hr compared to untagged TIR1 parasites. CDPK1 was used as a loading control. (C) AID-HOOK is visualized in fixed intracellular parasites by immunofluorescence after auxin treatment for 24 hr. Hoechst and MIC2 are used as counterstains. (D) Plaque assays of host cells infected with TIR1 or AID-HOOK parasites for 8 d in auxin. Host cells are stained with crystal violet. (E) Replication assays of host cells infected with TIR1 or AID-HOOK parasites in auxin for 24 hr. Parasites per vacuole were quantified from immunofluorescence on fixed intracellular parasites. p>0.9. Two-way ANOVA. (F) Invasion assays of untagged TIR1, CDPK1-AID, and AID-HOOK parasites treated auxin for 40 hr. Medians are plotted for n = 3 biological replicates (different shades of gray); n.s., p>0.05, Welch’s t-test. (G) Parasite egress stimulated with zaprinast following treatment with auxin for 24 hr. Egress was monitored by live microscopy. Percent egress plotted for n = 3 biological replicates, n.s., p>0.05, Welch’s t-test. (H) HOOK tagged with a C-terminal 3xHA in CDPK1 cKD parasites (CDPK1-AID) visualized in fixed intracellular parasites by immunofluorescence as in (D).
-
Figure 4—source data 1
This file contains source data that was used to generate the blot in Figure 4 (HA-AID-HOOK, chemiluminescence).
- https://cdn.elifesciences.org/articles/85654/elife-85654-fig4-data1-v1.zip
-
Figure 4—source data 2
This file contains source data that was used to generate the blot in Figure 4 (HA-AID-HOOK, colorimetric, ladder).
- https://cdn.elifesciences.org/articles/85654/elife-85654-fig4-data2-v1.zip
-
Figure 4—source data 3
This file contains source data that was used to generate the blot in Figure 4 ( CDPK1, LI-COR 700 channel).
- https://cdn.elifesciences.org/articles/85654/elife-85654-fig4-data3-v1.zip
-
Figure 4—source data 4
This file contains the annotated source data that were used to generate blots in Figure 4.
- https://cdn.elifesciences.org/articles/85654/elife-85654-fig4-data4-v1.zip
-
Figure 4—source data 5
This file contains source data that was used to make the graph presented in Figure 4.
GraphPad Prism data for Figure 4E.
- https://cdn.elifesciences.org/articles/85654/elife-85654-fig4-data5-v1.zip
-
Figure 4—source data 6
This file contains source data that was used to make the graph presented in Figure 4F (GraphPad Prism data).
- https://cdn.elifesciences.org/articles/85654/elife-85654-fig4-data6-v1.zip
-
Figure 4—source data 7
This file contains source data that was used to make the graph presented in Figure 4 and Figure 5.
- https://cdn.elifesciences.org/articles/85654/elife-85654-fig4-data7-v1.zip
Figure 4—figure supplement 1
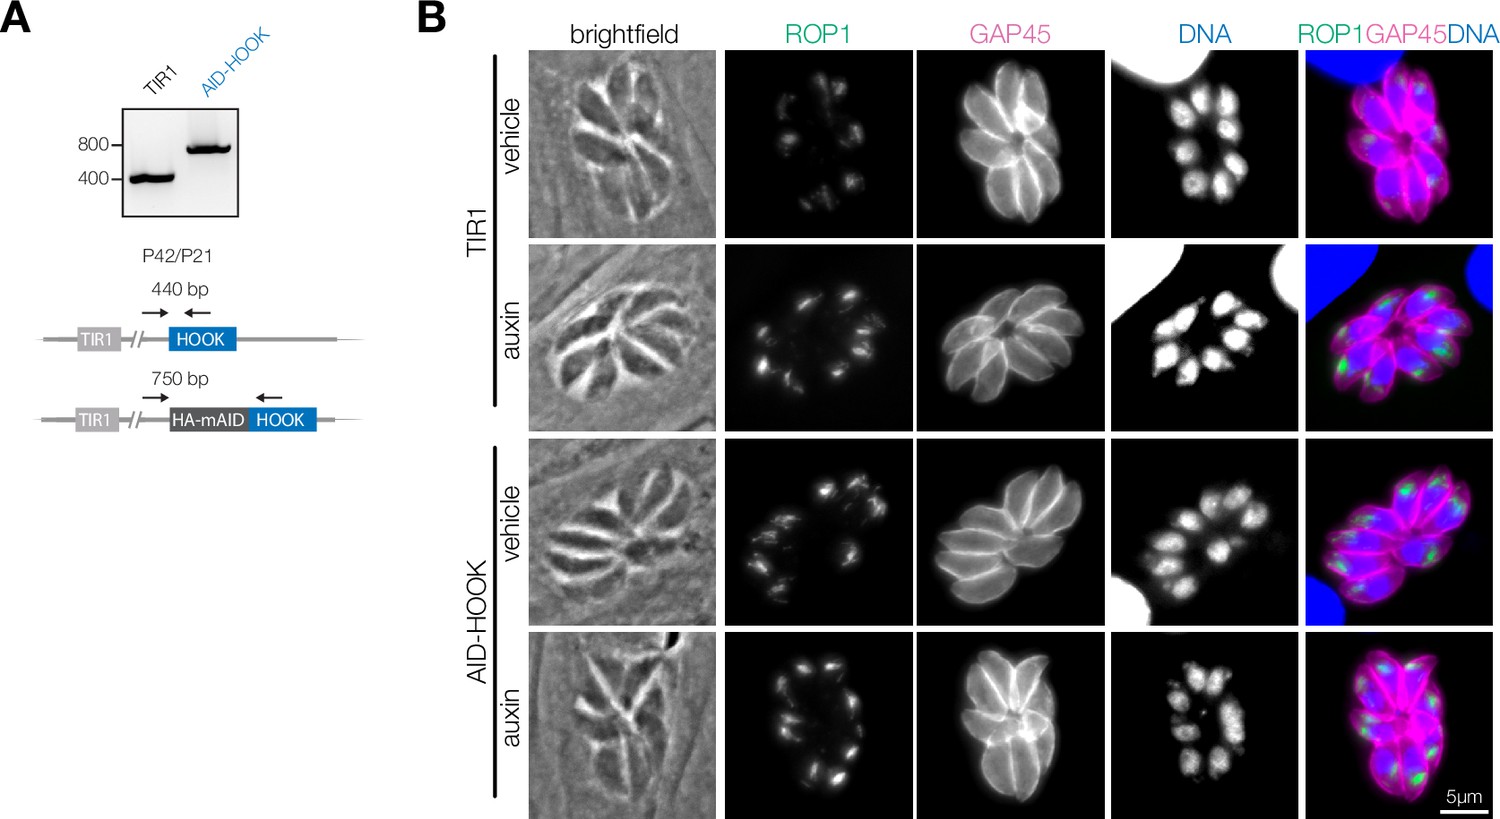
Extended analysis of HOOK knockdown.
(A) PCR analysis confirming correct integration of the HA-mAID cassette at the N terminus of endogenous HOOK (TGGT1_289100) in the TIR1 line. (B) Rhoptries (ROP1) are visualized in fixed intracellular parasites by immunofluorescence after treatment with auxin for 24 hr. Hoechst and GAP45 are used as counterstains.
-
Figure 4—figure supplement 1—source data 1
This file contains source data that was used to generate the DNA gel in Figure 4—figure supplement 1 (AID-HOOK integration).
- https://cdn.elifesciences.org/articles/85654/elife-85654-fig4-figsupp1-data1-v1.zip
-
Figure 4—figure supplement 1—source data 2
This file contains the annotated source data that were used to generate blots in Figure 4—figure supplement 1.
- https://cdn.elifesciences.org/articles/85654/elife-85654-fig4-figsupp1-data2-v1.zip
Figure 5 with 1 supplement
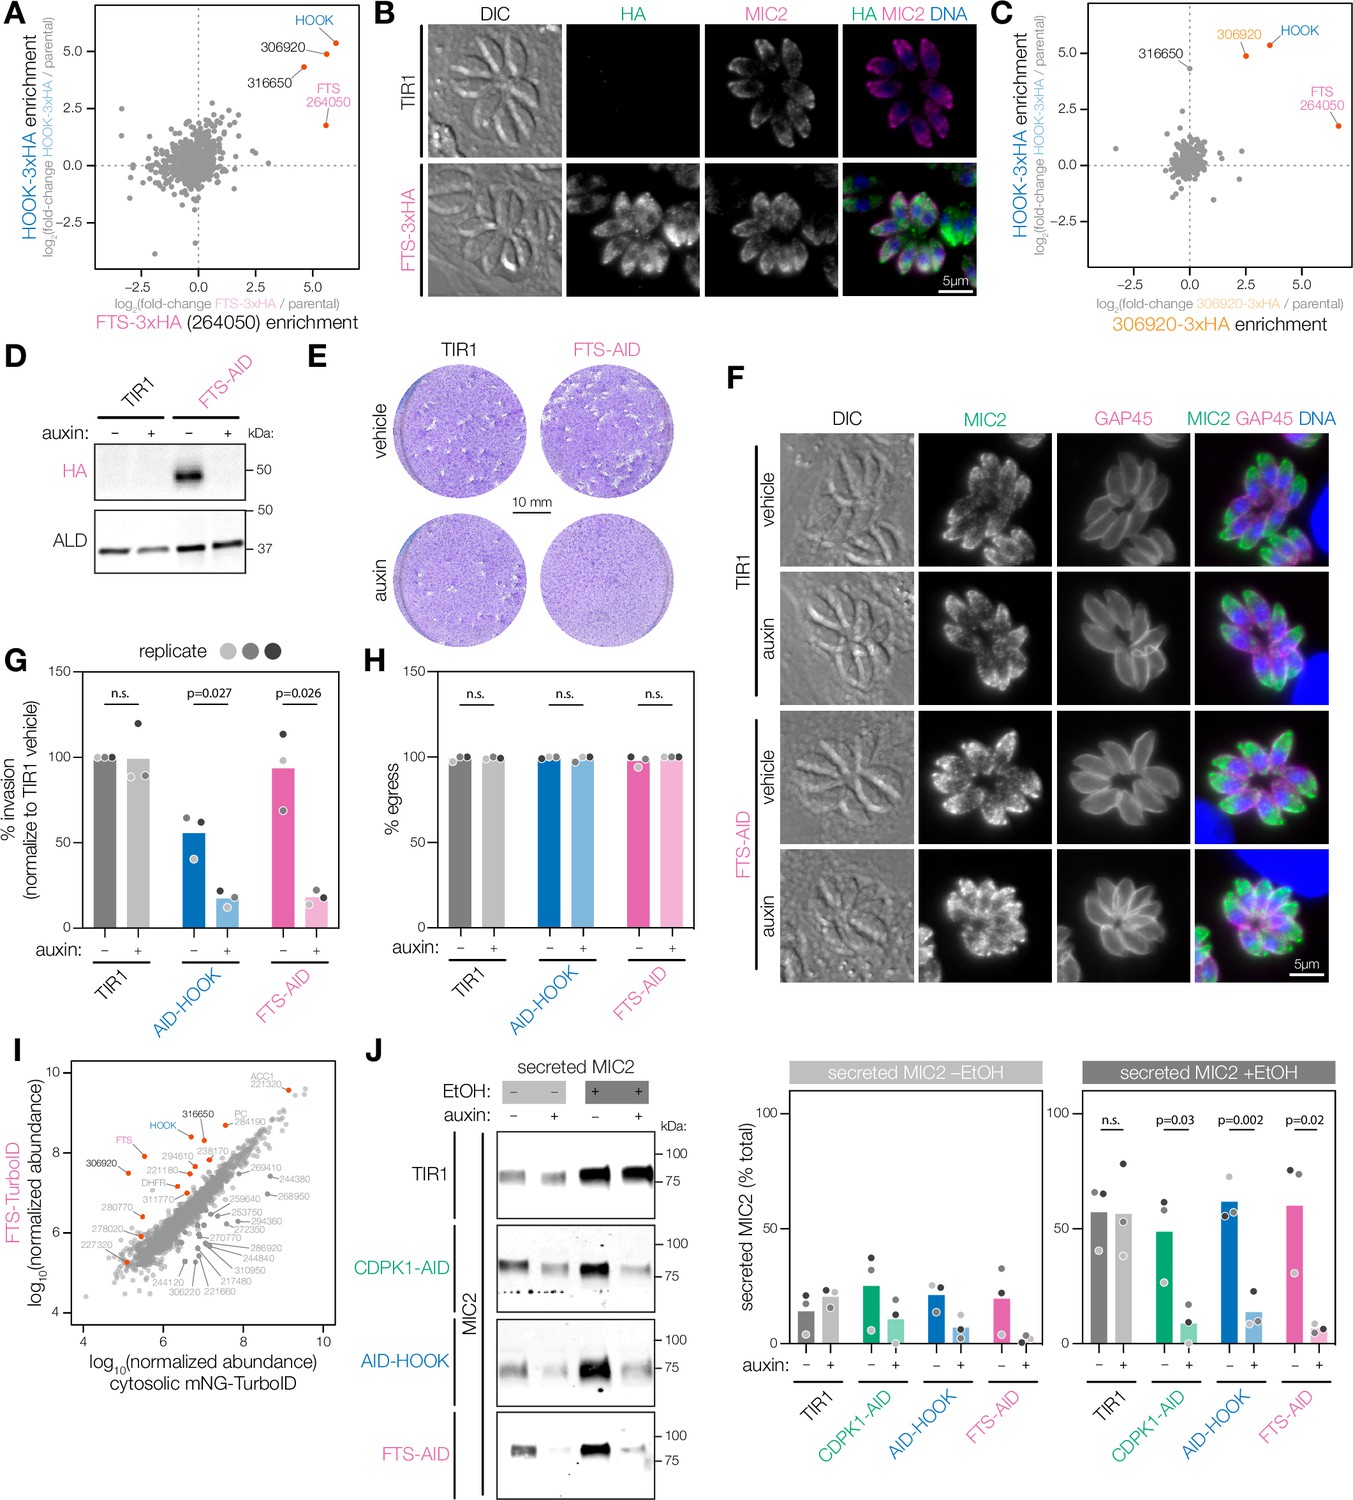
The HOOK complex is required for microneme exocytosis.
(A) Reciprocal IP-MS of HOOK-3xHA and FTS-3xHA. FTS is tagged with a C-terminal 3xHA epitope at the endogenous locus (FTS-3xHA). IP enrichment is shown as the fold-change of protein abundances in tagged versus untagged strains determined by LC-MS/MS across n = 3 biological replicates. Significantly enriched proteins with more than 3 unique peptides highlighted (red); pHOOK<0.05, and pFTS<0.05; ANOVA was Benjamini–Hochberg corrected. (B) FTS-3xHA visualized in fixed intracellular parasites by immunofluorescence after treatment with auxin for 24 hr. Hoechst and MIC2 are used as counterstains. (C) Reciprocal IP-MS of HOOK-3xHA and 306920-3xHA. TGGT1_306920 is tagged with a C-terminal 3xHA epitope at the endogenous locus (306920-3xHA). IP enrichment is shown as a fold-change of protein abundances in tagged versus untagged strains determined by LC-MS/MS across n = 3 and n = 2 biological replicates for the HOOK-3xHA and 306920-3xHA IP, respectively. Significantly enriched proteins with more than hree unique peptides highlighted (red); pHOOK<0.05 and p306920<0.05; ANOVA was Benjamini–Hochberg corrected. (D) Immunoblot of FTS cKD parasites. FTS is tagged with an C-terminal mAID-HA at its endogenous locus (FTS-AID) and treated with auxin for 40 hr. ALD is used as a loading control. (E) Plaque assays of host cells infected with TIR1 or FTS-AID parasites for 8 d in auxin. Host cells are stained with crystal violet. (F) Micronemes are visualized in fixed intracellular FTS-AID and TIR1 parasites by immunofluorescence after treatment auxin for 24 hr. Hoechst and GAP45 are used as counterstains. (G) Invasion assays of untagged TIR1, AID-HOOK, and FTS-AID parasites treated auxin for 40 hr. Medians are plotted for n = 3 biological replicates (different shades of gray), n.s., p>0.05, Welch’s t-test. (H) Parasite egress stimulated zaprinast following auxin treatment for 24 hr. Egress was monitored by live microscopy. Percent egress plotted for n = 3 biological replicates, n.s., p>0.05, Welch’s t-test. (I) Proximity labeling MS of FTS using TurboID (FTS-TurboID) compared to a cytosolic TurboID control (cytosolic mNeonGreen-TurboID). Protein abundances determined by LC-MS/MS are shown for n = 3 biological replicates. Significantly enriched proteins in FTS-TurboID are colored in red (red and blue), unique peptides >3, ratio > 1, p<0.05, ANOVA was Benjamini–Hochberg corrected. (J) Microneme protein secretion assays of parasites treated with auxin for 40 hr. Extracellular parasites are stimulated with 1% ethanol (EtOH) and 3% IFS for 1.5 hr. Percent MIC2 secreted is plotted for n = 3 biological replicates, n.s., p>0.05, Welch’s t-test.
-
Figure 5—source data 1
This file contains source data that was used to generate the blot in Figure 5 (FTS-AID-HA, chemiluminescence).
- https://cdn.elifesciences.org/articles/85654/elife-85654-fig5-data1-v1.zip
-
Figure 5—source data 2
This file contains source data that was used to generate the blot in Figure 5 (FTS-AID-HA, colorimetric, ladder).
- https://cdn.elifesciences.org/articles/85654/elife-85654-fig5-data2-v1.zip
-
Figure 5—source data 3
This file contains source data that was used to generate the blot in Figure 5 (ALD, LI-COR 700 channel).
- https://cdn.elifesciences.org/articles/85654/elife-85654-fig5-data3-v1.zip
-
Figure 5—source data 4
This file contains source data that was used to generate the blot in Figure 5 and Figure 5—figure supplement 1 (MIC2, LI-COR 800 channel [TIR1]).
- https://cdn.elifesciences.org/articles/85654/elife-85654-fig5-data4-v1.zip
-
Figure 5—source data 5
This file contains source data that was used to generate the blot in Figure 5 and Figure 5—figure supplement 1 (MIC2, LI-COR 800 channel [CDPK1-AID]).
- https://cdn.elifesciences.org/articles/85654/elife-85654-fig5-data5-v1.zip
-
Figure 5—source data 6
This file contains source data that was used to generate the blot in Figure 5 and Figure 5—figure supplement 1 (MIC2, LI-COR 800 channel [AID-HOOK]).
- https://cdn.elifesciences.org/articles/85654/elife-85654-fig5-data6-v1.zip
-
Figure 5—source data 7
This file contains source data that was used to generate the blot in Figure 5 and Figure 5—figure supplement 1 (MIC2, LI-COR 800 channel [FTS-AID]).
- https://cdn.elifesciences.org/articles/85654/elife-85654-fig5-data7-v1.zip
-
Figure 5—source data 8
This file contains the annotated source data that were used to generate blots in Figure 5.
- https://cdn.elifesciences.org/articles/85654/elife-85654-fig5-data8-v1.zip
-
Figure 5—source data 9
This file contains source data that was used to make the graph presented in Figure 5G (GraphPad Prism data).
- https://cdn.elifesciences.org/articles/85654/elife-85654-fig5-data9-v1.zip
-
Figure 5—source data 10
This file contains source data that was used to make the graphs presented in Figure 5J (GraphPad Prism data).
- https://cdn.elifesciences.org/articles/85654/elife-85654-fig5-data10-v1.zip
Figure 5—figure supplement 1
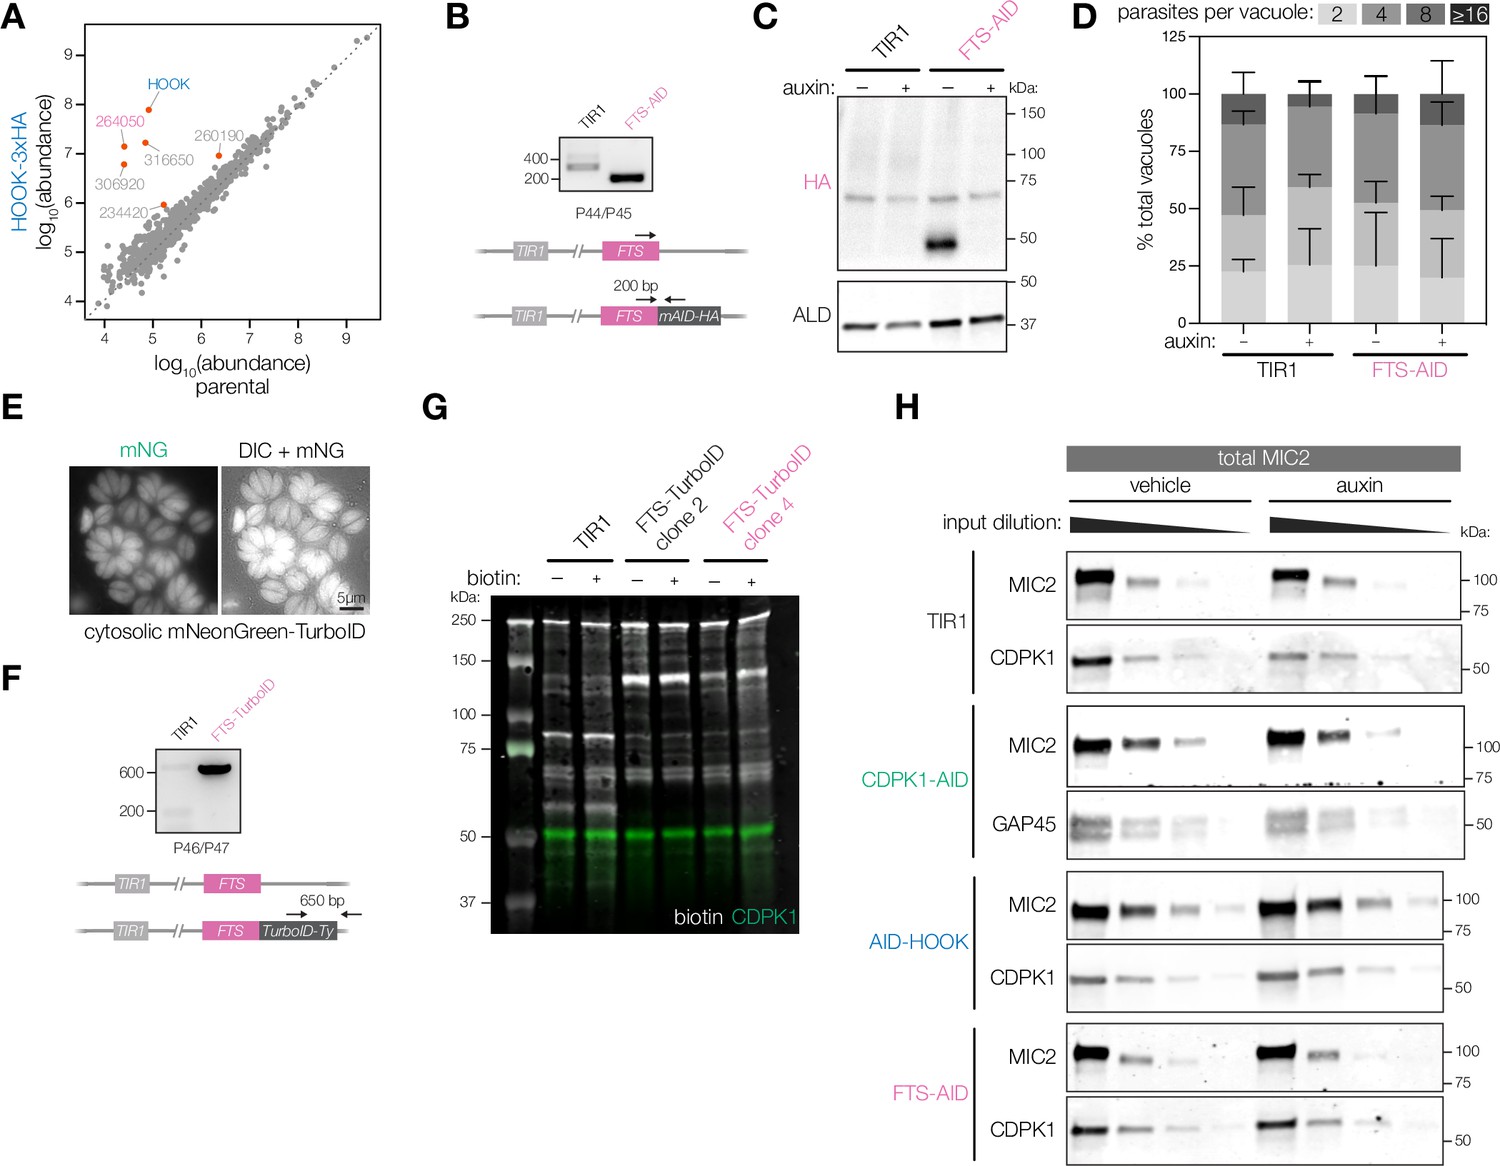
Extended analysis of FTS knockdown, proximity labeling, and microneme protein secretion.
(A) IP-MS of HOOK-3xHA or untagged parasites. Protein abundances determined by LC-MS/MS are shown for n = 3 biological replicates. Significantly enriched proteins (red) based on more than three unique peptides and p<0.05; ANOVA was Benjamini–Hochberg corrected. (B) PCR analysis confirming correct integration of the mAID-HA cassette at the C terminus of endogenous FTS (TGGT1_264050) in the TIR1 line. (C) Uncropped immunoblot shown in Figure 5D confirming C-terminal tagging of FTS. The band at ~70 kDa represents anti-HA/anti-ALD-related background present in all conditions. (D) Replication assays of host cells infected with TIR1 or FTS-AID parasites in auxin for 24 hr. Parasites per vacuole were quantified from immunofluorescence on fixed intracellular parasites. p>0.9. Two-way ANOVA. (E) Live microscopy of HFFs infected with parasites expressing cytosolic mNeonGreen-TurboID as the cytosolic control for proximity labeling. (F) PCR analysis confirming presence of TurboID-Ty cassette in the TIR1 line. (G) Immunoblot detection of biotinylated proteins in FTS-TurboID and cytosolic mNG-TurboID parasites treated with 500 µM of biotin or a vehicle of DMSO. Biotinylated proteins detected with a labeled streptavidin. anti-CDPK1 antibody was used as a loading control. (H) Serial dilution of total parasite lysate for cKD strains for TIR1, CDPK1, HOOK, and FTS used in microneme protein secretion assays in Figure 5J to generate standard curves.
-
Figure 5—figure supplement 1—source data 1
This file contains source data that was used to generate the DNA gel in Figure 5—figure supplement 1 (FTS-AID integration).
- https://cdn.elifesciences.org/articles/85654/elife-85654-fig5-figsupp1-data1-v1.zip
-
Figure 5—figure supplement 1—source data 2
This file contains source data that was used to generate the DNA gel in Figure 5—figure supplement 1 (FTS-TurboID tag).
- https://cdn.elifesciences.org/articles/85654/elife-85654-fig5-figsupp1-data2-v1.zip
-
Figure 5—figure supplement 1—source data 3
This file contains source data that was used to generate the blot in Figure 5—figure supplement 1 (Biotin, LI-COR 700 channel).
- https://cdn.elifesciences.org/articles/85654/elife-85654-fig5-figsupp1-data3-v1.zip
-
Figure 5—figure supplement 1—source data 4
This file contains source data that was used to generate the blot in Figure 5—figure supplement 1 (CDPK1, LI-COR 800 channel).
- https://cdn.elifesciences.org/articles/85654/elife-85654-fig5-figsupp1-data4-v1.zip
-
Figure 5—figure supplement 1—source data 5
This file contains source data that was used to generate the blot in Figure 5—figure supplement 1 (CDPK1, LI-COR 700 channel [TIR1 standard]).
- https://cdn.elifesciences.org/articles/85654/elife-85654-fig5-figsupp1-data5-v1.zip
-
Figure 5—figure supplement 1—source data 6
This file contains source data that was used to generate the blot in Figure 5—figure supplement 1 (GAP45, LI-COR 700 channel [CDPK1-AID standard]).
- https://cdn.elifesciences.org/articles/85654/elife-85654-fig5-figsupp1-data6-v1.zip
-
Figure 5—figure supplement 1—source data 7
This file contains source data that was used to generate the blot in Figure 5—figure supplement 1 (CDPK1, LI-COR 700 channel [AID-HOOK standard]).
- https://cdn.elifesciences.org/articles/85654/elife-85654-fig5-figsupp1-data7-v1.zip
-
Figure 5—figure supplement 1—source data 8
This file contains source data that was used to generate the blot in Figure 5—figure supplement 1 (CDPK1, LI-COR 700 channel [FTS-AID standard]).
- https://cdn.elifesciences.org/articles/85654/elife-85654-fig5-figsupp1-data8-v1.zip
-
Figure 5—figure supplement 1—source data 9
This file contains the annotated source data that were used to generate blots in Figure 5—figure supplement 1 (CDPK1, LI-COR 700 channel [FTS-AID standard]).
- https://cdn.elifesciences.org/articles/85654/elife-85654-fig5-figsupp1-data9-v1.zip
-
Figure 5—figure supplement 1—source data 10
This file contains source data that was used to make the graph presented in Figure 5—figure supplement 1C (GraphPad Prism data).
- https://cdn.elifesciences.org/articles/85654/elife-85654-fig5-figsupp1-data10-v1.zip
Figure 6 with 1 supplement
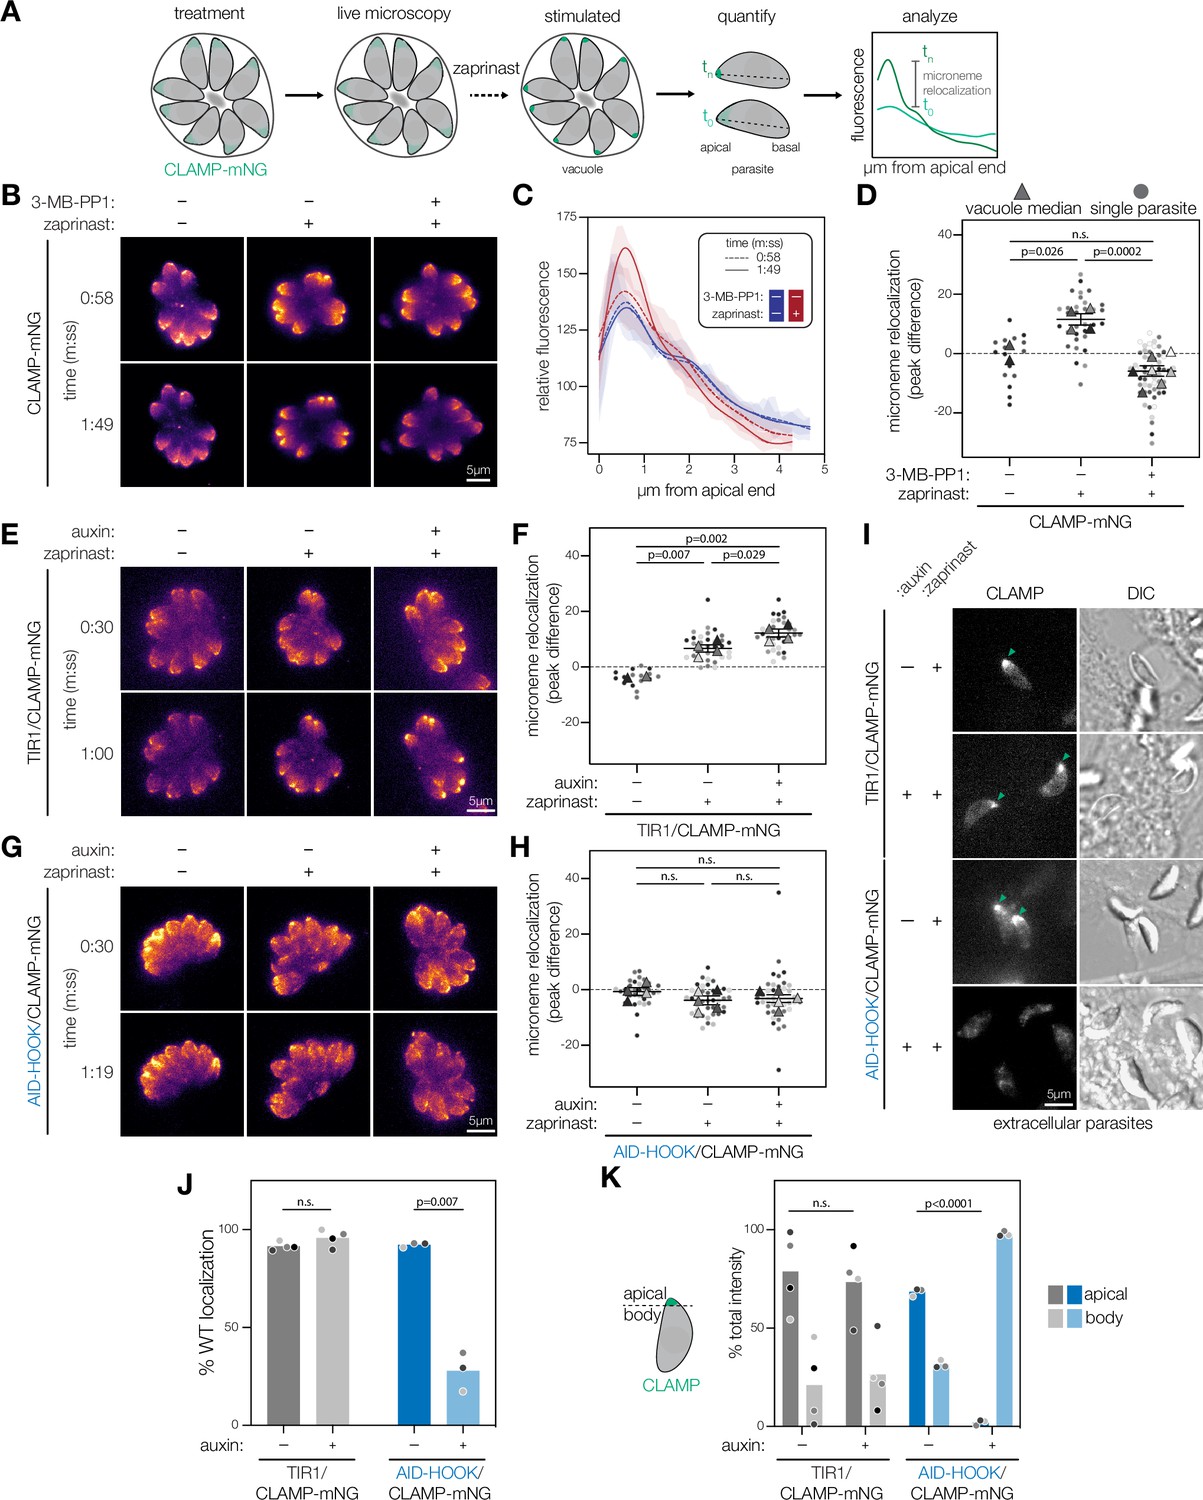
CDPK1 activity and HOOK are required for microneme trafficking during parasite motility stages.
(A) Schematic to analyze microneme trafficking during parasite motile stages. Intracellular parasites expressing microneme protein CLAMP endogenously tagged with mNeonGreen (CLAMP-mNG). Parasites are treated either with 3-MB-PP1 (inhibit CDPK1) or auxin (for conditional knockdown). Live microscopy was performed to detect CLAMP-mNG signal over time. Zaprinast was added at 1 min or 30 s to stimulate microneme relocalization to the apical end of the parasite. Fluorescence intensities across the apical-basal axis of each individual parasite within a vacuole was measured across time. Microneme relocalization was quantified by calculating the difference of maximum CLAMP intensity between time points preceding drug addition and egress. (B) Maximum intensity projections at single time points of CLAMP-mNG parasites treated with 3 µM 3-MB-PP1 or vehicle and zaprinast. (C) Relative fluorescence intensity of CLAMP-mNG signal across the apical-basal axis of parasites in (B). Zaprinast (red) or vehicle (blue). Splines mean intensity for all parasites in each vacuole are shown with SD shaded. (D) Microneme relocalization. SuperPlots showing vacuole median peak differences are displayed as triangles. Individual parasites are displayed as circles. Replicates are differentially shaded, n.s., p>0.05, unpaired t-test. (E) Maximum intensity projections at single time points of TIR1/CLAMP-mNG parasites treated with auxin and stimulated with zaprinast. (F) Microneme relocalization was quantified for TIR1/CLAMP-mNG parasites as in (D). (G) Maximum intensity projections at single time points of AID-HOOK/CLAMP-mNG parasites treated auxin and stimulated with zaprinast. (H) Microneme relocalization was quantified for AID-HOOK/CLAMP-mNG parasites as in (D). (I) Maximum intensity projections of extracellular TIR1/CLAMP-mNG and AID-HOOK/CLAMP-mNG parasites. (J) Percent of extracellular parasites in (I) with WT CLAMP-mNG localization, n.s., p>0.05, Welch’s t-test. (K) Percent total CLAMP-mNG signal intensity in the apical versus body of extracellular parasites, n.s., p>0.05, Welch’s t-test.
-
Figure 6—source data 1
This file contains source data that was used to make the graph presented in Figure 6C (GraphPad Prism data).
- https://cdn.elifesciences.org/articles/85654/elife-85654-fig6-data1-v1.zip
-
Figure 6—source data 2
This file contains source data that was used to make the graph presented in Figure 6D (GraphPad Prism data).
- https://cdn.elifesciences.org/articles/85654/elife-85654-fig6-data2-v1.zip
-
Figure 6—source data 3
This file contains source data that was used to make the graph presented in Figure 6F (GraphPad Prism data).
- https://cdn.elifesciences.org/articles/85654/elife-85654-fig6-data3-v1.zip
-
Figure 6—source data 4
This file contains source data that was used to make the graph presented in Figure 6H (GraphPad Prism data).
- https://cdn.elifesciences.org/articles/85654/elife-85654-fig6-data4-v1.zip
-
Figure 6—source data 5
This file contains source data that was used to make the graph presented in Figure 6J (GraphPad Prism data).
- https://cdn.elifesciences.org/articles/85654/elife-85654-fig6-data5-v1.zip
-
Figure 6—source data 6
This file contains source data that was used to make the graph presented in Figure 6K (GraphPad Prism data).
- https://cdn.elifesciences.org/articles/85654/elife-85654-fig6-data6-v1.zip
Figure 6—figure supplement 1

Extended analysis of FTS knockdown, proximity labeling, and microneme protein secretion.
(A) PCR analysis confirming correct integration of the mNeonGreen reporter at the C terminus of endogenous CLAMP (TGGT1_265790) in the TIR1 line. (B) PCR analysis confirming correct integration of the mNeonGreen reporter at the C terminus of endogenous CLAMP in the AID-HOOK line.
-
Figure 6—figure supplement 1—source data 1
This file contains source data that was used to generate the DNA gel in Figure 6—figure supplement 1 (CLAMP-mNeonGreen integration [TIR1/CLAMP-mNG]).
- https://cdn.elifesciences.org/articles/85654/elife-85654-fig6-figsupp1-data1-v1.zip
-
Figure 6—figure supplement 1—source data 2
This file contains source data that was used to generate the DNA gel in Figure 6—figure supplement 1 (CLAMP-mNeonGreen integration [AID-HOOK/CLAMP-mNG]).
- https://cdn.elifesciences.org/articles/85654/elife-85654-fig6-figsupp1-data2-v1.zip
-
Figure 6—figure supplement 1—source data 3
This file contains the annotated source data that were used to generate blots in Figure 6—figure supplement 1.
- https://cdn.elifesciences.org/articles/85654/elife-85654-fig6-figsupp1-data3-v1.zip
Figure 7 with 1 supplement
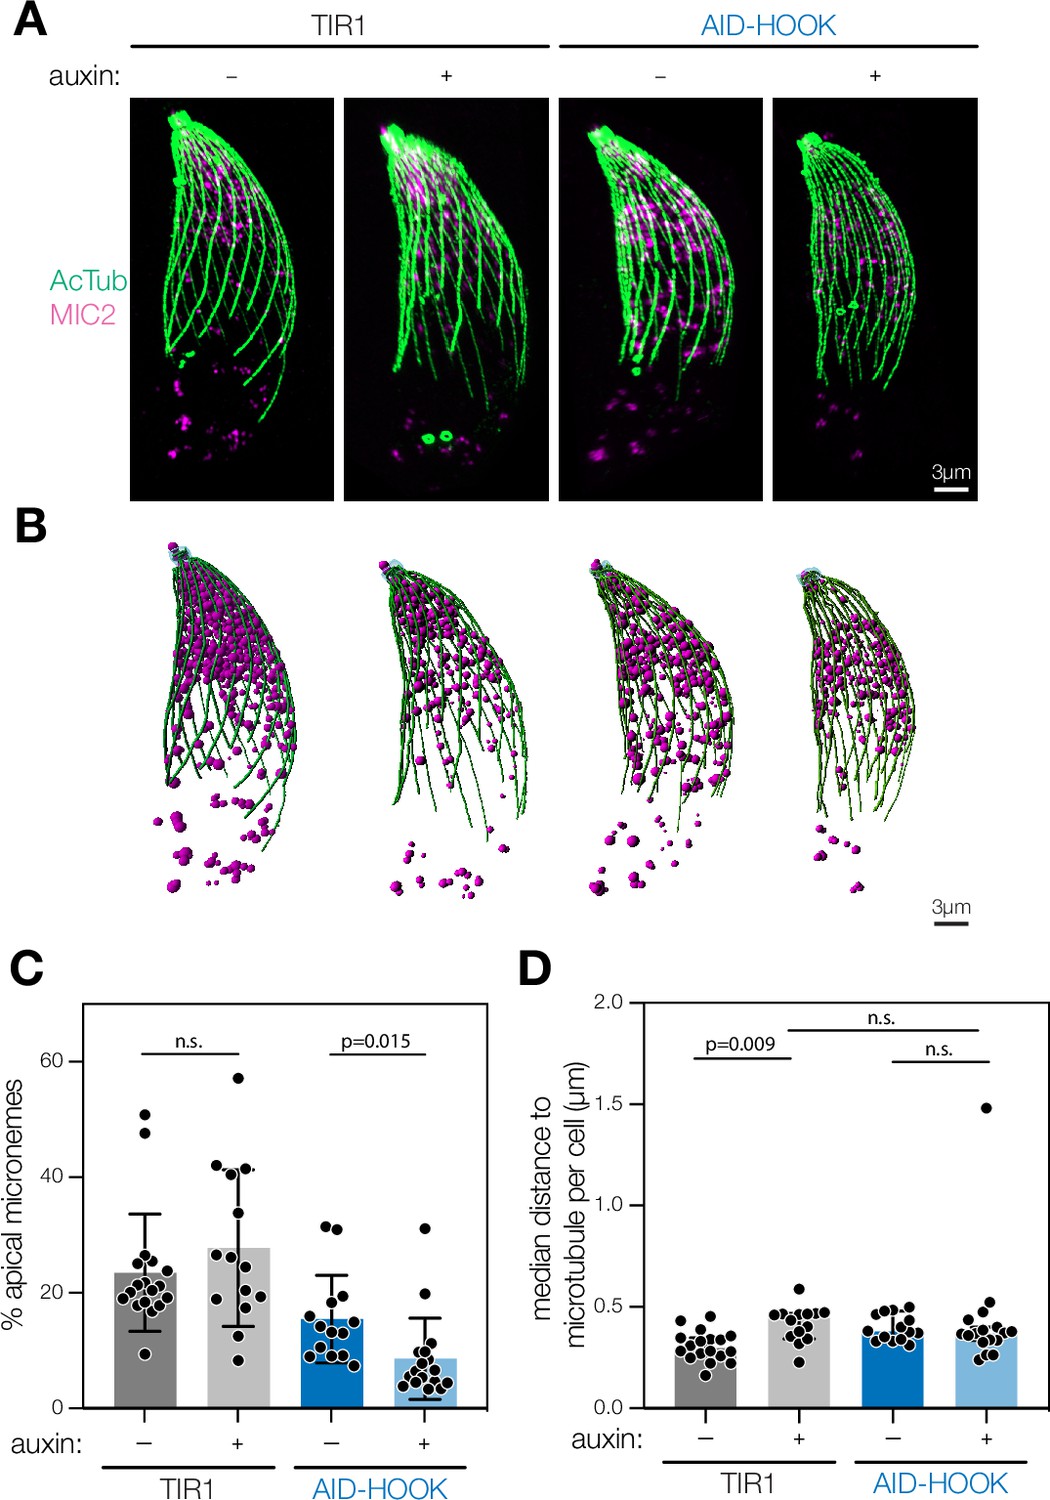
Ultrastructure expansion microscopy reveals HOOK is required for apical microneme positioning.
(A) Maximum intensity projection of fixed extracellular parasites subjected to expansion microscopy. Parasites were pre-treated with auxin. Acetylated tubulin (Lys40) is used to visualize cortical microtubules (green) and MIC2 to visualize micronemes (magenta). (B) 3D reconstruction of maximum intensity projections. Filaments are constructed for cortical microtubules (green) and globular organelles constructed for micronemes (magenta). (C) Percent of all micronemes localized to the apical region (4 µm from parasite apex) in each parasite. Mean ± SD plotted for n = 14–18 parasites, n.s., p>0.05, Welch’s t-test. (D) Median shortest distance between individual micronemes and closest cortical microtubule per parasite. Median with 95% confidence interval plotted for n = 14–18 parasites, n.s., p>0.05, Welch’s t-test. Actual distances in expanded samples were used. The expansion factor was 4×.
-
Figure 7—source data 1
This file contains source data that was used to make the graph presented in Figure 7C (GraphPad Prism data).
- https://cdn.elifesciences.org/articles/85654/elife-85654-fig7-data1-v1.zip
-
Figure 7—source data 2
This file contains source data that was used to make the graph presented in Figure 7D (GraphPad Prism data).
- https://cdn.elifesciences.org/articles/85654/elife-85654-fig7-data2-v1.zip
Figure 7—figure supplement 1

Extended analysis of ultrastructure expansion microscopy of HOOK knockdown parasites.
(A) Percent of extruded conoids in fixed extracellular parasites subjected to ultrastructure expansion microscopy, n = 100 parasites per condition. (B) Number of micronemes per parasite counted from 3D reconstructed maximum intensity projections. Mean ± SD. plotted for n = 14–18 parasites per condition; n.s., p>0.05, Welch’s t-test. (C) Distance of individual micronemes to the parasite apical end. Distances from n = 14–18 parasites per condition were measured. Violin plot with median and quartiles indicated; n.s., p>0.05, Welch’s t-test. (D) Shortest distance of individual micronemes to the nearest cortical microtubule filament. Distances from n = 14–18 parasites per condition were measured. Mean ± SD. plotted; n.s., p>0.05, Welch’s t-test. Actual distances in expanded samples were used. The expansion factor was 4×.
-
Figure 7—figure supplement 1—source data 1
This file contains source data that was used to make the graph presented in Figure 7—figure supplement 1B (GraphPad Prism data).
- https://cdn.elifesciences.org/articles/85654/elife-85654-fig7-figsupp1-data1-v1.zip
-
Figure 7—figure supplement 1—source data 2
This file contains source data that was used to make the graph presented in Figure 7—figure supplement 1C (GraphPad Prism data).
- https://cdn.elifesciences.org/articles/85654/elife-85654-fig7-figsupp1-data2-v1.zip
-
Figure 7—figure supplement 1—source data 3
This file contains source data that was used to make the graph presented in Figure 7—figure supplement 1D (GraphPad Prism data).
- https://cdn.elifesciences.org/articles/85654/elife-85654-fig7-figsupp1-data3-v1.zip
Videos
Video 1
Representative image series of parasites expressing endogenously tagged CLAMP-mNG following pre-treatment with DMSO and stimulation with DMSO.
Video 2
Representative image series of parasites expressing endogenously tagged CLAMP-mNG following pre-treatment with DMSO and stimulation with 500 µM zaprinast.
Video 3
Representative image series of parasites expressing endogenously tagged CLAMP-mNG following pre-treatment with 3 µM 3-MB-PP1 and stimulation with 500 µM zaprinast.
Video 4
Representative image series of parasites expressing endogenously tagged TIR1/CLAMP-mNG following pre-treatment with vehicle and stimulation with DMSO.
Video 5
Representative image series of parasites expressing endogenously tagged TIR1/CLAMP-mNG following pre-treatment with vehicle and stimulation with 500 µM zaprinast.
Video 6
Representative image series of parasites expressing endogenously tagged TIR1/CLAMP-mNG following pre-treatment with auxin and stimulation with 500 µM zaprinast.
Video 7
Representative image series of parasites expressing endogenously tagged AID-HOOK/CLAMP-mNG following pre-treatment with vehicle and stimulation with DMSO.
Video 8
Representative image series of parasites expressing endogenously tagged AID-HOOK/CLAMP-mNG following pre-treatment with vehicle and stimulation with 500 µM zaprinast.
Video 9
Representative image series of parasites expressing endogenously tagged AID-HOOK/CLAMP-mNG following pre-treatment with auxin and stimulation with 500 µM zaprinast.
Tables
Appendix 1—key resources table
| Reagent type (species) or resource | Designation | Source or reference | Identifiers | Additional information |
|---|---|---|---|---|
| Strain, strain background RH (Toxoplasma gondii) | TIR1 | PMID:28465425 | RH/TIR1/∆KU80/∆HXGPRT. Mycoplasma negative. | |
| Strain, strain background RH (T. gondii) | CDPK1-AID | doi:https://doi.org/10.1101/2022.07.19.500742 | RH/TIR1/∆KU80/∆HXGPRT/CDPK1-V5-mNeonGreen-mAID-Ty. Mycoplasma negative. | |
| Strain, strain background RH (T. gondii) | iKD CDPK1 | This paper | TGGT1_301440 | RH/TIR1/∆KU80/∆HXGPRT/CDPK1-mAID-Myc/HXGPRT. Mycoplasma negative. |
| Strain, strain background RH (T. gondii) | cWT CDPK1 | This paper | TGGT1_301440 | RH/TIR1/∆KU80/∆HXGPRT/CDPK1-mAID-Myc/HXGPRT/CDPK1-HA-T2A-GFP. Mycoplasma negative. |
| Strain, strain background RH (T. gondii) | cMut CDPK1 | This paper | TGGT1_301440 | RH/TIR1/∆KU80/∆HXGPRT/CDPK1-mAID-Myc/HXGPRT/CDPK1(G2A)-HA-T2A-mCherry. Mycoplasma negative. |
| Strain, strain background RH (T. gondii) | ∆ku80∆hxgprt YFP | PMID:32618271 | RH/∆KU80/∆HXGPRT/YFP. Mycoplasma negative. | |
| Strain, strain background RH (T. gondii) | CDPK1G | PMID:19218426 | RH/∆KU80/∆HXGPRT. Mycoplasma negative. | |
| Strain, strain background RH (T. gondii) | CDPK1M | PMID:23149386 | TGGT1_301440 | RH/∆KU80/∆HXGPRT/CDPK1(G128M)-Myc. Mycoplasma negative. |
| Strain, strain background RH (T. gondii) | AID-HOOK | This paper | TGGT1_289100 | RH/TIR1/∆KU80/∆HXGPRT/HA-mAID-HOOK. Mycoplasma negative. |
| Strain, strain background RH (T. gondii) | CDPK1-AID/HOOK-3xHA | This paper | TGGT1_289100 | RH/TIR1/∆KU80/∆HXGPRT/CDPK1-V5-mNeonGreen-mAID-Ty/HOOK-V5-3HA/HXGPRT. Mycoplasma negative. |
| Strain, strain background RH (T. gondii) | FTS-AID | This paper | TGGT1_264050 | RH/TIR1/∆KU80/∆HXGPRT/FTS-V5-mAID-HA/HXGPRT. Mycoplasma negative. |
| Strain, strain background RH (T. gondii) | 306920-3xHA | This paper | TGGT1_306920 | RH/TIR1/∆KU80/∆HXGPRT/306920-V5-3HA/HXGPRT. Mycoplasma negative. |
| Strain, strain background RH (T. gondii) | FTS-3xHA | This paper | TGGT1_264050 | RH/TIR1/∆KU80/∆HXGPRT/FTS-V5-3HA/HXGPRT. Mycoplasma negative. |
| Strain, strain background RH (T. gondii) | FTS-TurboID | This paper | TGGT1_264050 | RH/TIR1/∆KU80/∆HXGPRT/FTS-TurboID-Ty/DHFR. Mycoplasma negative. |
| Strain, strain background RH (T. gondii) | Cytosolic mNG-TurboID | This paper | RH/TIR1/∆KU80/∆HXGPRT/pMIC2-mNeonGreen-TurboID-Ty. Mycoplasma negative. | |
| Strain, strain background RH (T. gondii) | CLAMP-mNG | PMID:27594426 | TGGT1_265790 | RH/∆KU80/∆HXGPRT/CLAMP-mNeonGreen. Mycoplasma negative. |
| Strain, strain background RH (T. gondii) | TIR1/CLAMP-mNG | This paper | TGGT1_265790 | RH/TIR1/∆KU80/∆HXGPRT/CLAMP-mNeonGreen. Mycoplasma negative. |
| Strain, strain background RH (T. gondii) | TIR1/CLAMP-mNG/AID-HOOK | This paper | TGGT1_265790 | RH/TIR1/∆KU80/∆HXGPRT/HA-mAID-HOOK/CLAMP-mNeonGreen. Mycoplasma negative. |
| Cell line (Homo sapiens) | Human Foreskin Fibroblasts (HFFs) | ATCC | SCRC-1041 | Mycoplasma negative. |
| Antibody | Mouse polyclonal anti-CDPK1 | PMID:28246362 | Provided by Matthew Child and Matt Bogyo. WB (1:3000). Only used in Figure 2. | |
| Antibody | Mouse monoclonal clone 4A6 anti-Myc | Millipore | Cat# 05-724, RRID:AB_11211891 | WB (1:1000). |
| Antibody | Rat monoclonal clone 3F10 anti-HA | Roche | Cat# 11867423001, RRID:AB_390919 | WB (1:1000); IFA (1:1000). Only used in Figure 2. |
| Antibody | Mouse monoclonal clone TP3 anti-Toxoplasma | Abcam | Cat# ab8313, RRID:AB_306466 | WB (1:1000). |
| Antibody | Mouse monoclonal anti-GFP | Roche | Cat# 11814460001, RRID:AB_390913 | WB (1:1000). |
| Antibody | Rabbit polyclonal anti-mCherry | Abcam | Cat# ab167453, RRID:AB_2571870 | WB (1:1000). |
| Antibody | Rabbit monoclonal anti-SAG1 | PMID:3183382 | Provided by John Boothroyd Lab; WB (1:10,000). Only used in Figure 2. | |
| Antibody | Rabbit monoclonal clone 51-8 anti-thiophosphate ester | Abcam | Cat# ab92570, RRID:AB_10562142 | WB (1:5000). |
| Antibody | Mouse monoclonal clone 12G10 anti-tubulin | Developmental Studies Hybridoma Bank at the University of Iowa | RRID:AB_1157911 | Provided by Marc-Jan Gubbels Lab. WB (1:2000). |
| Antibody | Guinea pig monoclonal anti-CDPK1 | Covance | Custom antibody | WB (1/50,000). |
| Antibody | Rabbit monoclonal (C29F4) anti-HA | Cell Signaling Technology | Cat# 3724, RRID:AB_1549585 | WB (1:1000); IFA (1:1600). |
| Antibody | Mouse monoclonal clone 6D10 anti-MIC2 | PMID:10799515 | Provided by L. David Sibley Lab. WB (1:5000); IFA (1:2000). | |
| Antibody | Mouse anti-ROP1 | PMID:12467986 | Provided by Peter Bradley Lab. IFA (1:2000). | |
| Antibody | Mouse polyclonal anti-SAG1 | PMID:3183382 | Provided by L. David Sibley Lab. IFA (1:500). Used for invasion assays. | |
| Antibody | Rabbit polyclonal anti-GAP45 | Lampire Biological Laboratory | Provided by R. Drew Etheridge Lab. IFA (1:1000). Used for invasion assays. | |
| Antibody | Mouse monoclonal (16B12) anti-HA | BioLegend | Cat# 901533, RRID:AB_2565005 | WB (1:1000). |
| Antibody | Rabbit polyclonal clone WU1614 anti-ALD | PMID:16923803 | Provided by L. David Sibley Lab. WB (1:10,000). | |
| Antibody | Rabbit polyclonal anti-GAP45 | PMID:18312842 | Provided by Dominique Soldati-Favre Lab. WB (1:5000); IFA (1:5000). | |
| Antibody | Peroxidase-AffiniPure polyclonal Goat Anti-Rabbit IgG (H+L) | Jackson ImmunoResearch Laboratories | Cat# 111-035-003, RRID:AB_2313567 | WB (1/5000). |
| Antibody | Alexa Fluor 594 polyclonal Goat Anti-Rabbit IgG (H+L) | Life Technologies | IFA (1:1000). | |
| Antibody | Alexa Fluor 488 polyclonal Goat Anti-Mouse IgG (H+L) | Life Technologies | IFA (1:1000). | |
| Antibody | Alexa Fluor 488 polyclonal Goat Anti-Rabbit IgG (H+L) | Life Technologies | IFA (1:1000). | |
| Antibody | Alexa Fluor 594 polyclonal Goat Anti-Mouse IgG (H+L) | Life Technologies | IFA (1:1000). | |
| Antibody | IRDye 800CW Donkey anti-Guinea Pig IgG Secondary Antibody | LI-COR | LI-COR: 926-32411 | WB (1:10,000). |
| Antibody | IRDye 680RD Donkey anti-Guinea Pig IgG Secondary Antibody | LI-COR | LI-COR: 926-68077 | WB (1:10,000). |
| Antibody | IRDye 800CW Goat anti-Mouse IgG1-Specific Secondary Antibody | LI-COR | LI-COR: 926-32350 | WB (1:10,000). |
| Antibody | IRDye 680LT Goat anti-Mouse IgG Secondary Antibody | LI-COR | LI-COR: 926-68020 | WB (1:10,000). |
| Antibody | IRDye 800CW Goat anti-Rabbit IgG Secondary Antibody | LI-COR | LI-COR: 926-32211 | WB (1:10,000). |
| Antibody | IRDye 680LT Goat anti-Rabbit IgG Secondary Antibody | LI-COR | LI-COR: 926-68021 | WB (1:10,000). |
| Antibody | Alpaca monoclonal (1B7) anti-CDPK1 | PMID:26305940 | n/a | |
| Peptide, recombinant protein | IRDye 680RD Streptavidin | LI-COR | LI-COR: 926-68079 | WB (1:3000). |
| Peptide, recombinant protein | Aerolysin | PMID:26584919 | n/a | |
| Peptide, recombinant protein | Sequencing Grade Modified Trypsin | Promega | Promega: V5113 | |
| Chemical compound, drug | 3-Indoleacetic acid (auxin) | Sigma-Aldrich | Sigma-Aldrich: I2886-5G | |
| Chemical compound, drug | Compound 1 | PMID:12455981 | n/a | |
| Chemical compound, drug | Hoechst 33258 | Santa Cruz | Santa Cruz: sc-394039 | Egress assay (1:4000). |
| Chemical compound, drug | Hoechst 33342 | Invitrogen | Invitrogen: H3570 | IFA (1:20,000). |
| Chemical compound, drug | DAPI (4',6-diamidino-2-phenylindole, dihydrochloride) | Invitrogen | Invitrogen: D1306 | |
| Chemical compound, drug | Prolong Diamond | Thermo Fisher | Thermo Fisher: P36965 | |
| Chemical compound, drug | Zaprinast | Calbiochem | Calbiochem: 684500 | |
| Chemical compound, drug | A23187 | Calbiochem | Calbiochem: 100105 | |
| Chemical compound, drug | Myristic acid | Tokyo Chemical Industry | Cat# M0476 | |
| Chemical compound, drug | Alkyne-myristic acid (YnMyr) | Iris Biotech | Cat# RL-2055 | |
| Chemical compound, drug | Trypsin cleavable capture reagent | PMID:25807930; PMID:32618271 | This reagent was first reported as RTB in PMID:25807930. | |
| Chemical compound, drug | L-Proline for SILAC | Thermo Fisher Scientific | Thermo Fisher Scientific: 88211 | |
| Chemical compound, drug | Fetal bovine serum, dialyzed, US origin, One Shot format | Thermo Fisher Scientific | Thermo Fisher Scientific: A3382001 | |
| Chemical compound, drug | DMEM for SILAC | Thermo Fisher Scientific | Thermo Fisher Scientific: 88364 | |
| Chemical compound, drug | L-Arginine-HCl for SILAC | Thermo Fisher Scientific | Thermo Fisher Scientific: 89989 | |
| Chemical compound, drug | L-Lysine-2HCl for SILAC | Thermo Fisher Scientific | Thermo Fisher Scientific: 89987 | |
| Chemical compound, drug | L-Arginine-HCl, 13C6, 15N4 for SILAC | Thermo Fisher Scientific | Thermo Fisher Scientific: 89990 | |
| Chemical compound, drug | L-Lysine-2HCl, 13C6, 15N2 for SILAC | Thermo Fisher Scientific | Thermo Fisher Scientific: 88209 | |
| Chemical compound, drug | p-Nitrobenzyl mesylate (PNBM) | Epitomics | Epitomics # 3700-1 | |
| Chemical compound, drug | OXONE, monopersulfate compound | Sigma-Aldrich | Sigma-Aldrich: 228036-5G | |
| Chemical compound, drug | N6-furfuryladenosine (kinetin)–5′-O-[3- thiotriphosphate] sodium salt (KTPγS) | Axxora | Axxora: BLG-F008-05 | |
| Chemical compound, drug | Adenosine 5′-triphosphate disodium salt hydrate (ATP) | Sigma-Aldrich | Sigma-Aldrich: A6419-1G | |
| Chemical compound, drug | Guanosine 5ʹ-Triphosphate, Disodium Salt (GTP) | Calbiochem | Millipore: 371701 | |
| Chemical compound, drug | β-Casein from bovine milk | Sigma-Aldrich | Sigma-Aldrich: C6905 | |
| Chemical compound, drug | Biotin | Sigma-Aldrich | Sigma-Aldrich: B4501-1G | |
| Chemical compound, drug | PP1 Analog III, 3-MB-PP1 | Calbiochem | Sigma-Aldrich: 529582 | |
| Chemical compound, drug | Formaldehyde | Sigma-Aldrich | Sigma-Aldrich: F8775 | |
| Chemical compound, drug | Acrylamide | Sigma-Aldrich | Sigma-Aldrich: A4058 | |
| Chemical compound, drug | Sodium acrylate | AK Scientific | AK Scientific: R624 | |
| Chemical compound, drug | N,N'-Methylenebisacrylamide (BIS) | Sigma-Aldrich | Sigma-Aldrich: M1533 | |
| Chemical compound, drug | Tetramethyle thylenediamine (TEMED) | Sigma-Aldrich | Sigma-Aldrich: T9281 | |
| Chemical compound, drug | Ammonium persulfate (APS) | Sigma-Aldrich | Sigma-Aldrich: A3678 | |
| Commercial assay or kit | S-trap micro | Protifi | Protifi: C02-micro-80 | |
| Commercial assay or kit | Pierce Quantitative Fluorometric Peptide Assay | Thermo Fisher Scientific | Thermo Fisher Scientific: 23290 | |
| Commercial assay or kit | TMTpro 16plex Label Reagent Set | Thermo Fisher Scientific | Thermo Fisher Scientific: A44522 | |
| Commercial assay or kit | EasyPep MS Sample Prep Kits - Maxi | Thermo Fisher Scientific | Thermo Fisher Scientific: A45734 | |
| Commercial assay or kit | High-Select TiO2 Phosphopeptide Enrichment Kit | Thermo Fisher Scientific | Thermo Fisher Scientific: A32993 | |
| Commercial assay or kit | High-Select Fe-NTA Phosphopeptide Enrichment Kit | Thermo Fisher Scientific | Thermo Fisher Scientific: A32992 | |
| Commercial assay or kit | Pierce High pH Reversed-Phase Peptide Fractionation Kit | Thermo Fisher Scientific | Thermo Fisher Scientific: 84868 | |
| Commercial assay or kit | Dynabeads MyOne Streptavidin C1 | Invitrogen | Cat# 65001 | |
| Commercial assay or kit | Bio-Rad DC assay | Bio-Rad | Bio-Rad: 5000116 | |
| Commercial assay or kit | Sep-Pak C18 Plus Short Cartridge, 360 mg Sorbent per Cartridge, 55–105 µm | Waters | Waters: WAT020515 | |
| Commercial assay or kit | SulfoLink Coupling Resin | Thermo Fisher Scientific | Thermo Fisher Scientific: 20401 | |
| Commercial assay or kit | Radiance Plus Chemiluminescent Substrate | Azure Biosystems | VWR: 10147-298 | |
| Commercial assay or kit | Pierce Anti-HA Magnetic Beads | Thermo Scientific | Thermo Scientific: 88836 | |
| Commercial assay or kit | Pierce Streptavidin Magnetic Beads | Thermo Scientific | Thermo Scientific: 88817 | |
| Recombinant DNA reagent | All plasmids used in this study are listed in Supplementary file 10 | This paper | ||
| Sequence-based reagent | All primers and oligonucleotides used in this study are listed in Supplementary file 10 | This paper | ||
| Software, algorithm | Proteome Discoverer 4.2 | Thermo Fisher | ||
| Software, algorithm | MaxQuant (version 1.5.0.25 and 1.5.2.8) | PMID:19029910 | RRID:SCR_014485 | Free software for searching of mass spectrometry acquisition files. |
| Software, algorithm | Perseus (version 1.5.0.9) | PMID:27348712 | RRID:SCR_015753 | Free software for processing of MaxQuant output files. |
| Software, algorithm | Scaffold DIA | Proteome Software | ||
| Software, algorithm | R version 4.0 | R Foundation for Statistical Computing | ||
| Software, algorithm | Prism 8 | GraphPad | ||
| Software, algorithm | Fiji | PMID:22743772 | ||
| Software, algorithm | ilastik | PMID:31570887 | ilastik.org | |
| Software, algorithm | HHPRED | PMID:29258817 | ||
| Software, algorithm | SnapGene | Dotmatics | https://www.snapgene.com/ | |
| Software, algorithm | ToxoDB | PMID:18003657 | ToxoDB.org | |
| Software, algorithm | Imaris (release 9.9) | Oxford Instruments | https://imaris.oxinst.com/ | |
| Other | DMEM, high glucose (media) | Life Technologies | Life Technologies: 11965118 | Materials and methods: Cell culture |
| Other | HALT protease inhibitor | Thermo Fisher | Thermo Fisher: 87786 | Materials and methods: Immunoprecipitation, lysis buffer |
| Other | HALT protease and phosphatase inhibitor | Thermo Fisher | Thermo Fisher: PI78440 | Materials and methods: Sub-minute resolution phosphoproteomics, lysis buffer |
| Other | Benzonase | Sigma-Aldrich | Sigma-Aldrich: E1014 | Materials and methods: Sub-minute resolution phosphoproteomics, lysis buffer |
Additional files
-
Supplementary file 1
Sub-minute phosphoproteomics time course peptide and abundance assignments from Proteome Discoverer 2.4 and analysis for the zaprinast enriched samples.
(A) RAW peptide and abundance assignments. (B) Replicate 1 analysis with AUCdifference and p-values. (C) Replicate 2 analysis with AUCdifference and p-values. (D) Replicate 1 and 2 analysis with AUCvehicle values for CDPK1-independent phosphorylation. (E) Group assignments for zaprinast-dependent phosphopeptides.
- https://cdn.elifesciences.org/articles/85654/elife-85654-supp1-v1.xlsx
-
Supplementary file 2
Sub-minute phosphoproteomics time course protein and abundance assignments from Proteome Discoverer 2.4 for the zaprinast proteome.
- https://cdn.elifesciences.org/articles/85654/elife-85654-supp2-v1.xlsx
-
Supplementary file 3
Sub-minute phosphoproteomics time course peptide and abundance assignments from Proteome Discoverer 2.4 and analysis for the DMSO enriched samples.
(A) RAW peptide and abundance assignments. (B) Replicate 1 analysis with AUCdifference values. (C) Replicate 2 analysis with AUCdifference values. (D) Replicate 1 and 2 analysis with AUCvehicle values for CDPK1-independent phosphorylation.
- https://cdn.elifesciences.org/articles/85654/elife-85654-supp3-v1.xlsx
-
Supplementary file 4
Sub-minute phosphoproteomics time course protein and abundance assignments from Proteome Discoverer 2.4 for the DMSO proteome.
- https://cdn.elifesciences.org/articles/85654/elife-85654-supp4-v1.xlsx
-
Supplementary file 5
CDPK1 immunoprecipitation protein and abundance assignments from Scaffold DIA.
- https://cdn.elifesciences.org/articles/85654/elife-85654-supp5-v1.xlsx
-
Supplementary file 6
Thiophosphorylation of CDPK1 substrates.
Peptide and abundance assignments from Proteome Discoverer 2.4 and analysis. (A) RAW peptide and abundance assignments. (B) Analyzed peptides with enrichment significance values. (C) Analyzed flow-through peptides used for normalization.
- https://cdn.elifesciences.org/articles/85654/elife-85654-supp6-v1.xlsx
-
Supplementary file 7
Thiophosphorylation of CDPK1 substrates.
Protein and abundance assignments from Proteome Discoverer 2.4 and analysis.
- https://cdn.elifesciences.org/articles/85654/elife-85654-supp7-v1.xlsx
-
Supplementary file 8
HOOK, FTS, and TGGT1_306920 immunoprecipitation protein and abundance assignments from Proteome Discoverer 2.4.
- https://cdn.elifesciences.org/articles/85654/elife-85654-supp8-v1.xlsx
-
Supplementary file 9
FTS proximity labeling protein and abundance assignments from Proteome Discoverer 2.4.
- https://cdn.elifesciences.org/articles/85654/elife-85654-supp9-v1.xlsx
-
Supplementary file 10
Sequences and accessions of oligonucleotides and plasmids used in this study.
- https://cdn.elifesciences.org/articles/85654/elife-85654-supp10-v1.xlsx
-
Supplementary file 11
Zip file containing R scripts and CSVs for sub-minute phosphoproteomic time course analysis.
- https://cdn.elifesciences.org/articles/85654/elife-85654-supp11-v1.zip
-
Supplementary file 12
Zip file containing R scripts and CSVs for thiophosphorylation analysis.
- https://cdn.elifesciences.org/articles/85654/elife-85654-supp12-v1.zip
-
MDAR checklist
- https://cdn.elifesciences.org/articles/85654/elife-85654-mdarchecklist1-v1.docx
Download links
A two-part list of links to download the article, or parts of the article, in various formats.
Downloads (link to download the article as PDF)
Open citations (links to open the citations from this article in various online reference manager services)
Cite this article (links to download the citations from this article in formats compatible with various reference manager tools)
Analysis of CDPK1 targets identifies a trafficking adaptor complex that regulates microneme exocytosis in Toxoplasma
eLife 12:RP85654.
https://doi.org/10.7554/eLife.85654.3


