A pH-sensitive switch activates virulence in Salmonella
- Mechanobiology Institute, National University of Singapore, Singapore
- Department of Biochemistry and Molecular Biology, The University of Texas Medical Branch at Galveston, United States
- Sealy Center for Structural Biology and Molecular Biophysics, The University of Texas Medical Branch at Galveston, United States
Figures
Figure 1 with 1 supplement
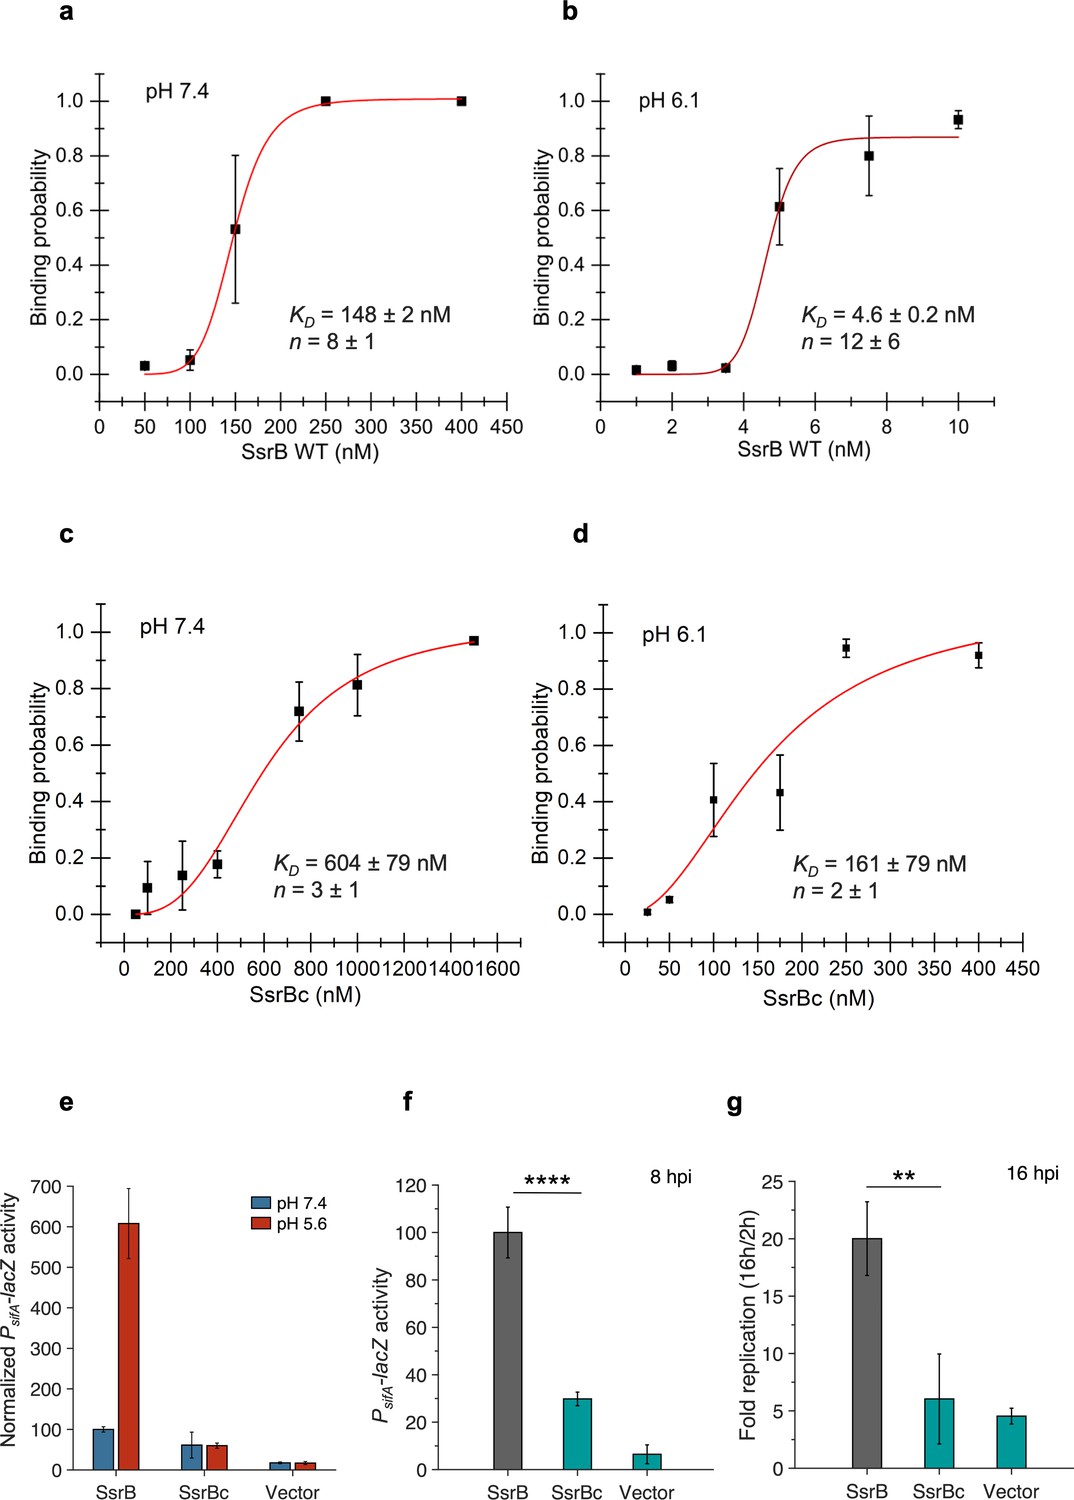
SsrBc is not the locus of acid-sensitive DNA binding.
(a) The plots represent the binding probability of SsrB or SsrBc to the sseI DNA hairpin as a function of protein concentration (nM) at pH 7.4 and 6.1. At neutral pH, SsrB binds to the sseI promoter with a KD of 148 ± 2 nM, Hill coefficient (n) = 8 ± 1. (b) At acid pH 6.1, the KD was 4.6 ± 0.2 nM and n = 12 ± 6. (c) At neutral pH, SsrBc binds to the sseI promoter with a KD of 604 ± 79 nM, Hill coefficient (n) = 3 ± 1. (d) At acid pH 6.1, the KD was 161 ± 79 nM and n = 2 ± 1. The error bars represent the standard deviation of 3–5 independent measurements. The red line represents the curve derived from fitting the points to the Hill equation to determine the KD. The absence of error bars indicates that the standard deviation was < the symbol. (e) PsifA-lacZ activity in the presence of SsrB or SsrBc grown in magnesium minimal medium (MGM) pH 7.4 (blue bars) and pH 5.6 (red bars) after 3 hr of 0.1% (w/v) arabinose induction. In comparison to SsrB activity at pH 7.4, the activity of the SsrBc strains was reduced to 61 and 60 in pH 7.4 and 5.6 media, respectively. (f) PsifA-lacZ activity measured from strains recovered at 8 hr post infection of HeLa cells. The activity for the SsrBc strain was 30% of the wild-type SsrB strain (***p<0.001, n = 3) (g) During HeLa cell infection, the wild-type full-length SsrB strain increased 20-fold after 16 hr post infection (hpi). The SsrBc strain only increased sixfold over the same time period.
-
Figure 1—source data 1
Binding probabilities for individual experiments used to create plots for figures 1a-d, PsifA-lacZ activities and fold replication values for individual experiments used to create plots for Figure 1e–g.
- https://cdn.elifesciences.org/articles/85690/elife-85690-fig1-data1-v2.zip
Figure 1—figure supplement 1

The plots represent the binding probability of SsrB to the sseI DNA hairpin as a function of SsrB concentration (nM) at pH 7.4.
The red curve is fitted to the average binding probabilities against each protein concentration. The dashed lines represent the curve fitted to the upper and lower limits of the binding probabilities measured for the protein concentration near the KD, at 150 nM.
Figure 2 with 3 supplements
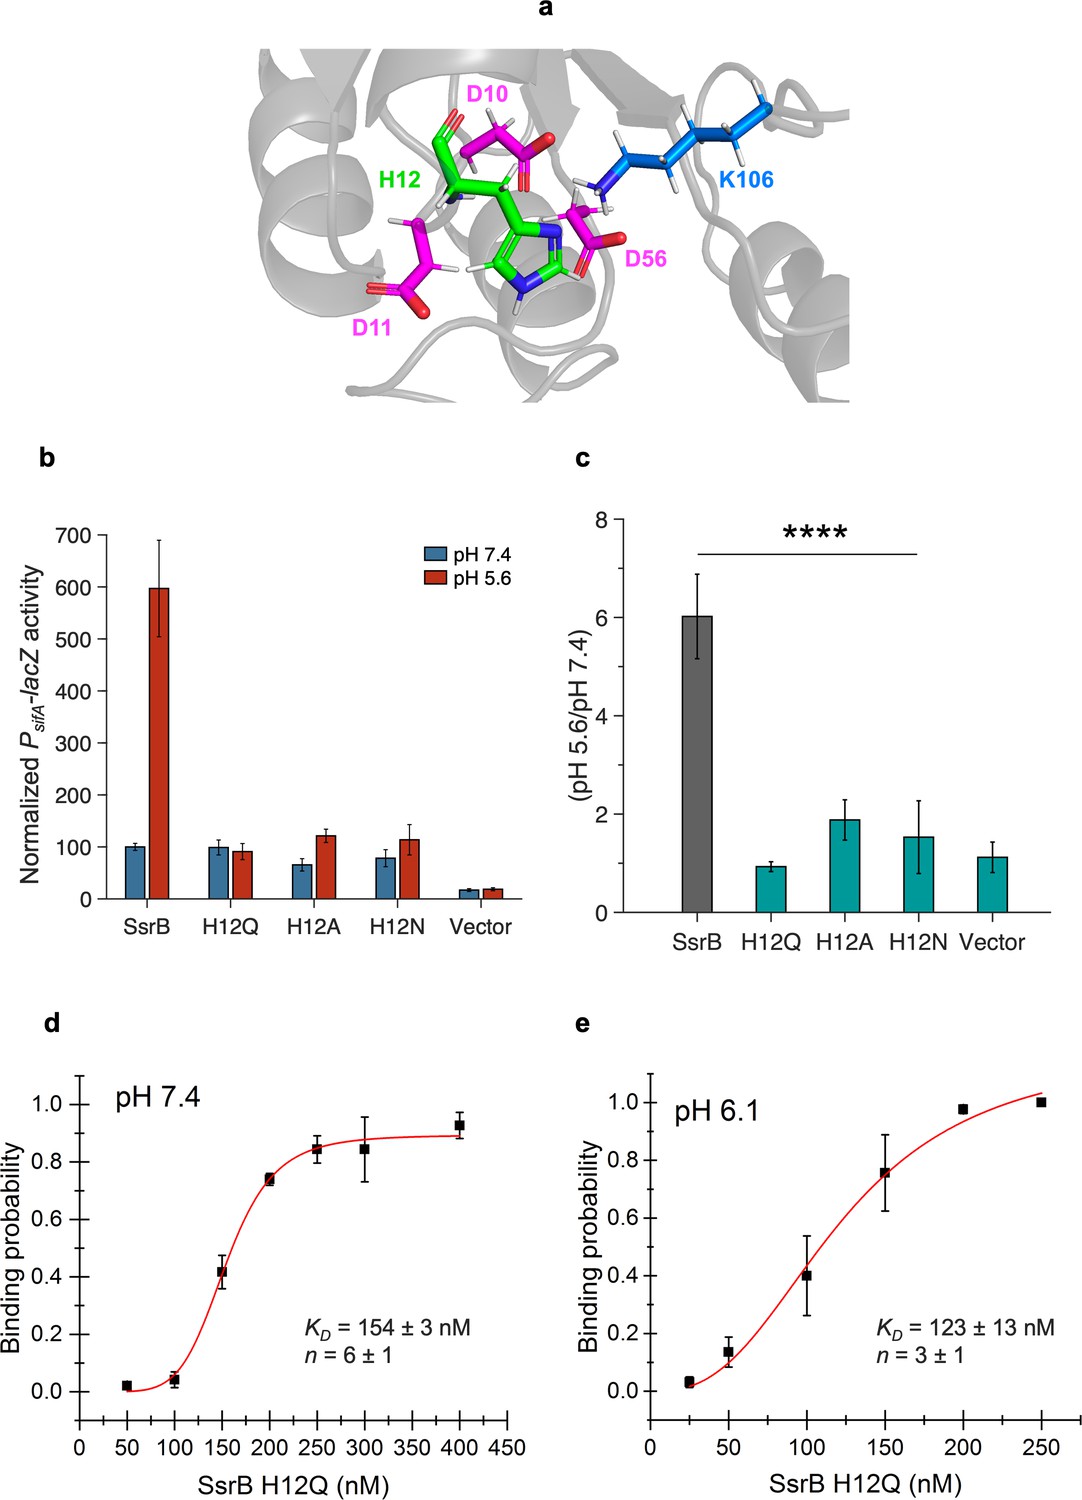
Histidine 12 is essential for acid-stimulated DNA binding of SsrB.
(a) The location of His12, on a predicted receiver domain structure of SsrB. His12 is in the vicinity of the active site residues Asp10, Asp11, Asp56, and Lys106. (b) Normalized PsifA-lacZ activity in the presence of SsrB or H12 mutants of SsrB grown in magnesium minimal medium (MGM) pH 7.4 (blue bars) and pH 5.6 (red bars) after 3 hr of 0.1% (w/v) arabinose induction. (c) The H12Q, H12A, and H12N substitutions showed no increase in activity at pH 5.6 (0.9-, 1.9-, and 1.5-fold respectively) compared to wild-type SsrB (6-fold) (p<0.0001, n = 3). (d, e) The plots represent the binding probability of SsrB H12Q to the sseI DNA hairpin as a function of SsrB H12Q concentration (nM) at pH 7.4 and 6.1. (d) At neutral pH, SsrB H12Q binds to the sseI promoter with a KD of 154 ± 3 nM, n = 6 ± 1. (e) At acidic pH 6.1, the KD was 123 ± 13 nM and n = 3 ± 1. The error bars represent the standard deviation of 3–5 independent measurements. The red line represents the curve derived from fitting the points to the Hill equation to determine the KD. The absence of error bars indicates that the standard deviation was < the symbol.
-
Figure 2—source data 1
PsifA-lacZ activities for individual experiments used to create plots for Figure 2b–c, binding probabilities for individual experiments used to create plots for Figure 2d–e.
- https://cdn.elifesciences.org/articles/85690/elife-85690-fig2-data1-v2.zip
Figure 2—figure supplement 1
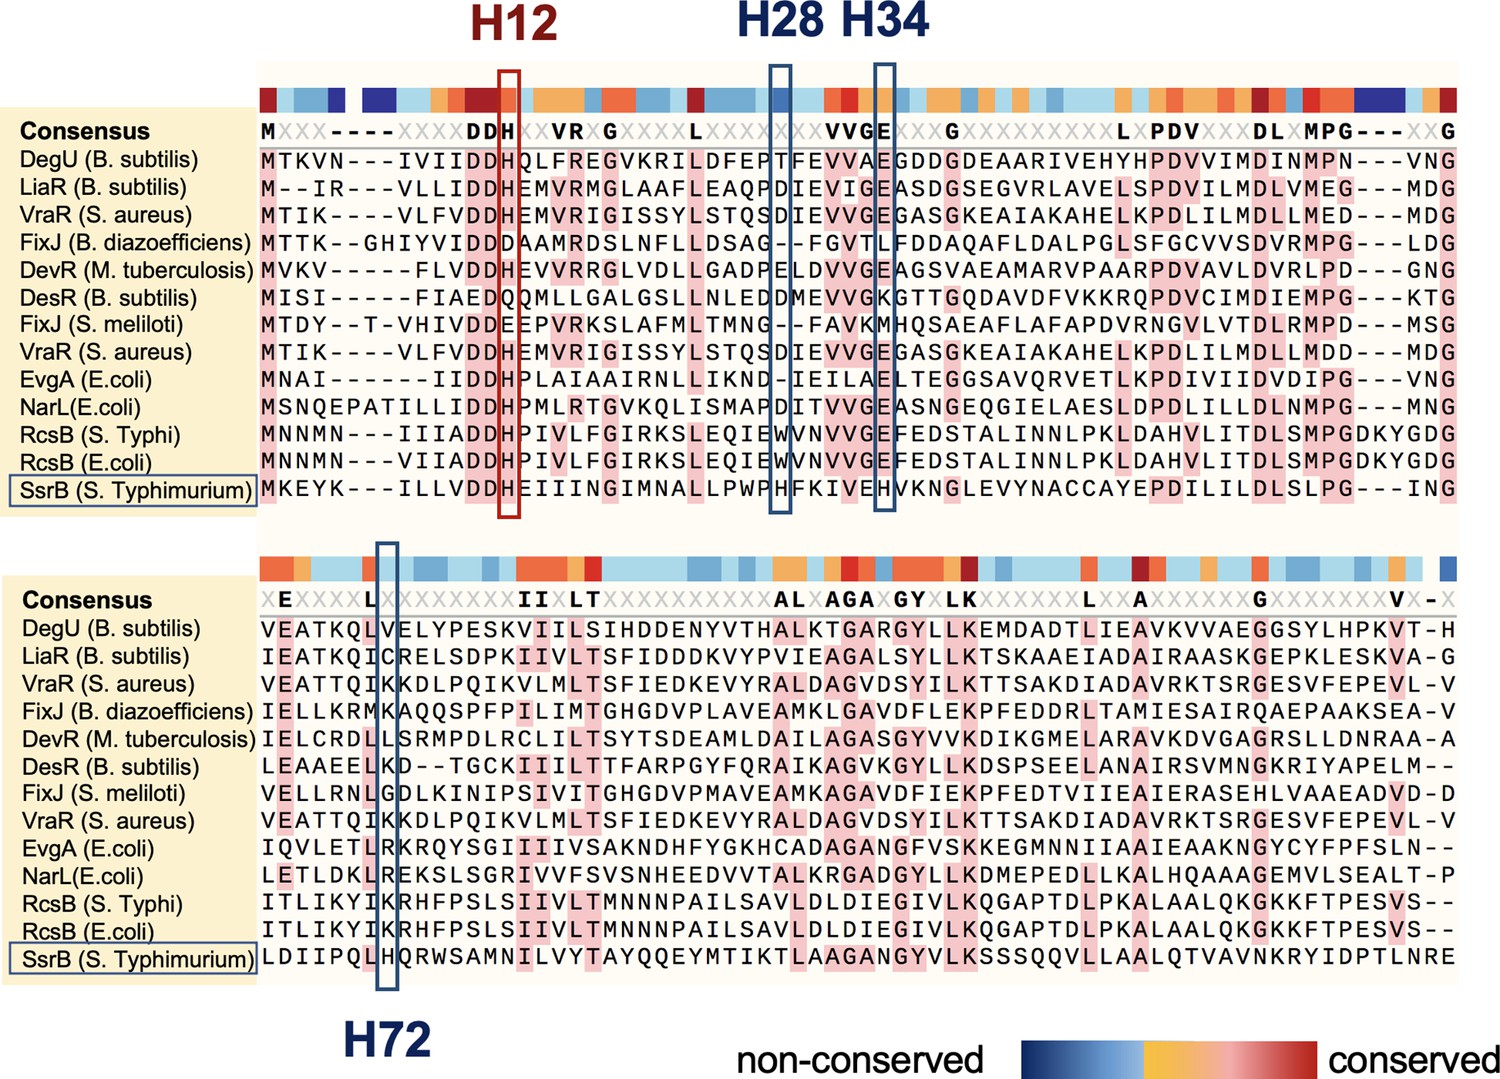
Analysis of NarL/FixJ response regulator (RR) receiver domains and selection of histidine residues.
Multiple sequence alignment of the receiver domains of NarL/FixJ subfamily RRs from sequences obtained through a DELTA_BLAST of SsrB sequence against the UniProt/SWISSPROT database. These sequences share >20% identity with SsrB. The histidines at positions 28, 34, and 72 in SsrB were the least conserved amongst NarL/FixJ family members, and their homologous aligned residues are shown in the blue box. The histidine at position 12 in SsrB was conserved among most NarL RRs, and its homologous aligned residues are shown in the red box. Amino acid conservation is represented by the colored bar above the aligned residues, with blue being the least conserved and red being the most conserved residues.
Figure 2—figure supplement 2

The location of His12, His28, His34, and His72 on the predicted receiver domain of SsrB (visualized using PyMol).
His12 is present in the β1-α1 loop, His28 is present in the α1 -β2 loop, His34 is in the β2-α2 loop, and His72 is in α3.
Figure 2—figure supplement 3

Non-conserved histidines in the receiver domain do not confer acid sensitivity to SsrB.
(a) PsifA-lacZ activity in the presence of SsrB, single histidine mutants of SsrB or vector-only control grown in magnesium minimal medium (MGM) pH 7.4 (blue bars) and pH 5.6 (red bars) after 3 hr of 0.1% (w/v) arabinose induction. (b) The increase in activity at pH 5.6 shown by SsrB H28A, SsrB H34A, and SsrB H72A is 4.2-, 4.8-, and 4.5-fold respectively, which is comparable to the wild-type SsrB (5-fold) (n.s. = p>0.05, n = 3). (c) PsifA-lacZ activity in the presence of SsrB or double or triple histidine mutants of SsrB grown in MGM pH 7.4 (blue bars) and pH 5.6 (red bars) after 3 hr of 0.1% (w/v) arabinose induction. (d) The increase in activity at pH 5.6 shown by SsrB 2H1, SsrB 2H2, SsrB 2H3, and SsrB 3H (4.9-, 6.6-, 5.6-, and 8.1-fold respectively) was comparable to the increase in activity shown by wild-type SsrB (6-fold) (n.s. = p>0.05, n = 3). (e) PsifA-lacZ activity measured from strains recovered at 8 hr post HeLa infection. The activity of the SsrB 2H1, SsrB 2H2, and SsrB 2H3-expressing strains was 113 ± 12%, 89 ± 18%, and 94 ± 29%, respectively, relative to the SsrB-expressing strain (n.s. = p>0.05, n = 3). (f) Intracellular survival of strains in HeLa cells at 16 hr post infection (hpi). During HeLa cell infection, the c.f.u./ml of the SsrB-expressing strain increased 13.2-fold at 16 hpi. For SsrB 2H1, SsrB 2H2, and SsrB 2H3-expressing strains, the c.f.u./ml increased 10.7-, 13.3-, and 14.5-fold, respectively, similar to SsrB (n.s. = p>0.05, n = 3).
-
Figure 2—figure supplement 3—source data 1
PsifA-lacZ activities and fold replication values for individual experiments used to create plots for Figure 2—figure supplement 3.
- https://cdn.elifesciences.org/articles/85690/elife-85690-fig2-figsupp3-data1-v2.zip
Figure 3 with 3 supplements
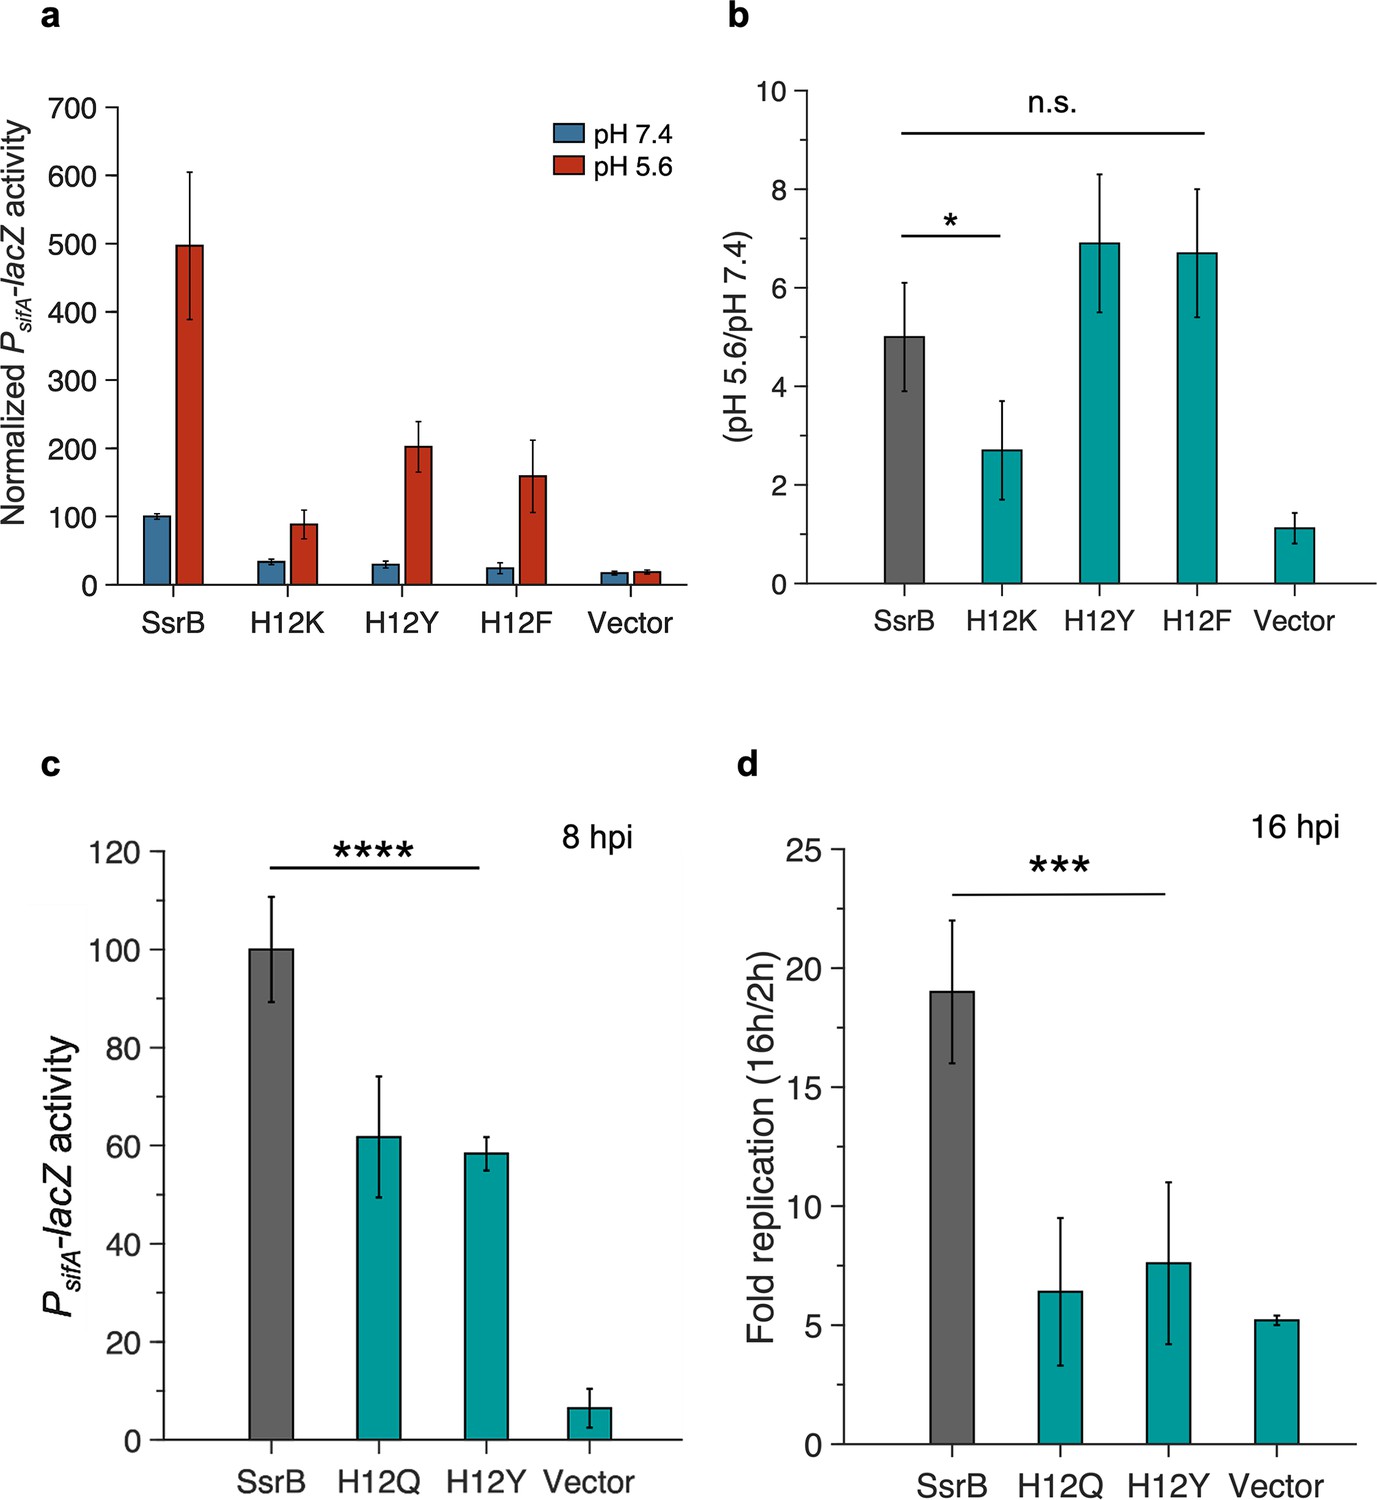
Aromatic substitutions at position 12 retain SsrB pH sensitivity.
(a) Normalized PsifA-lacZ activity in the presence of SsrB or H12 mutants of SsrB grown in magnesium minimal medium (MGM) pH 7.4 (blue bars) and pH 5.6 (red bars) after 3 hr of 0.1% (w/v) arabinose induction. The H12K, H12Y, and H12F substitutions showed a decrease in activity at pH 7.4 compared to SsrB (34 ± 4%, 30 ± 4%, and 24 ± 8%). (b) SsrB H12K only showed a moderate increase in activity at pH 5.6 (2.7-fold); however, the SsrB H12Y and H12F substitutions retained an acid-stimulated increase in the activity (6.9- and 6.7-fold, respectively) comparable to the wild-type (5-fold). (c) PsifA-lacZ activity measured from strains recovered at 8 hr post HeLa infection. The activity of the SsrB H12Q and SsrB H12Y-expressing strains was 62 ± 12% and 58 ± 3%, respectively, relative to the SsrB-expressing strain (p<0.001, n = 3). (d) Intracellular survival of strains in HeLa cells at 16 hr post infection (hpi). During HeLa cell infection, the c.f.u./ml of the SsrB-expressing strain increased 19-fold at 16 hpi. For SsrB H12Q and SsrB H12Y-expressing strains, the c.f.u./ml only increased 6.4- and 7.6-fold, respectively (p<0.0001, n = 3).
-
Figure 3—source data 1
PsifA-lacZ activities and fold replication values for individual experiments used to create plots for Figure 3.
- https://cdn.elifesciences.org/articles/85690/elife-85690-fig3-data1-v2.zip
Figure 3—figure supplement 1
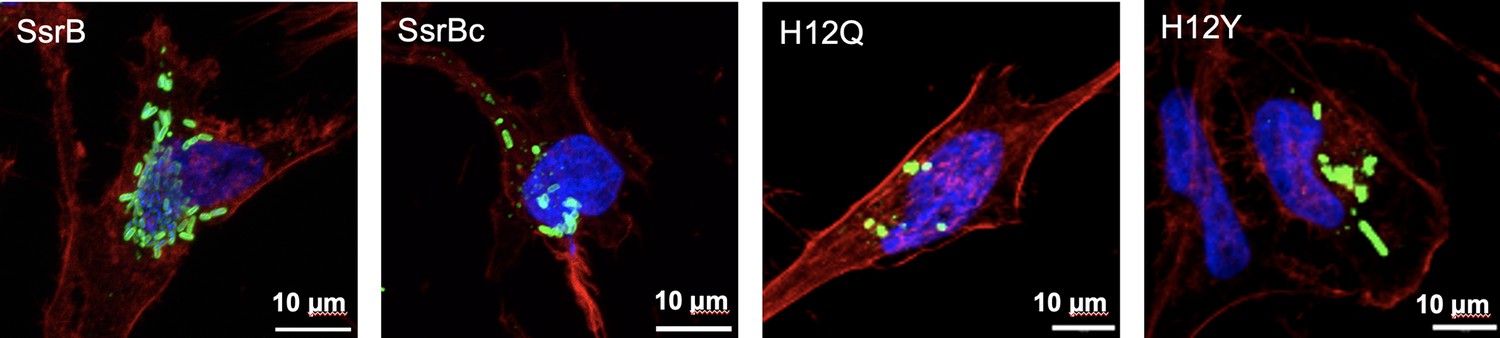
DW637 strains expressing SsrB, SsrBc, H12Q, or H12Y infecting HeLa cells at 16 hr post infection (hpi).
Salmonellae were stained with anti-LPS antibody (green), HeLa cells were stained using phalloidin (red) and DAPI (blue). Fewer intracellular bacteria were present in the HeLa cells infected with SsrBc and H12 mutants.
Figure 3—figure supplement 2
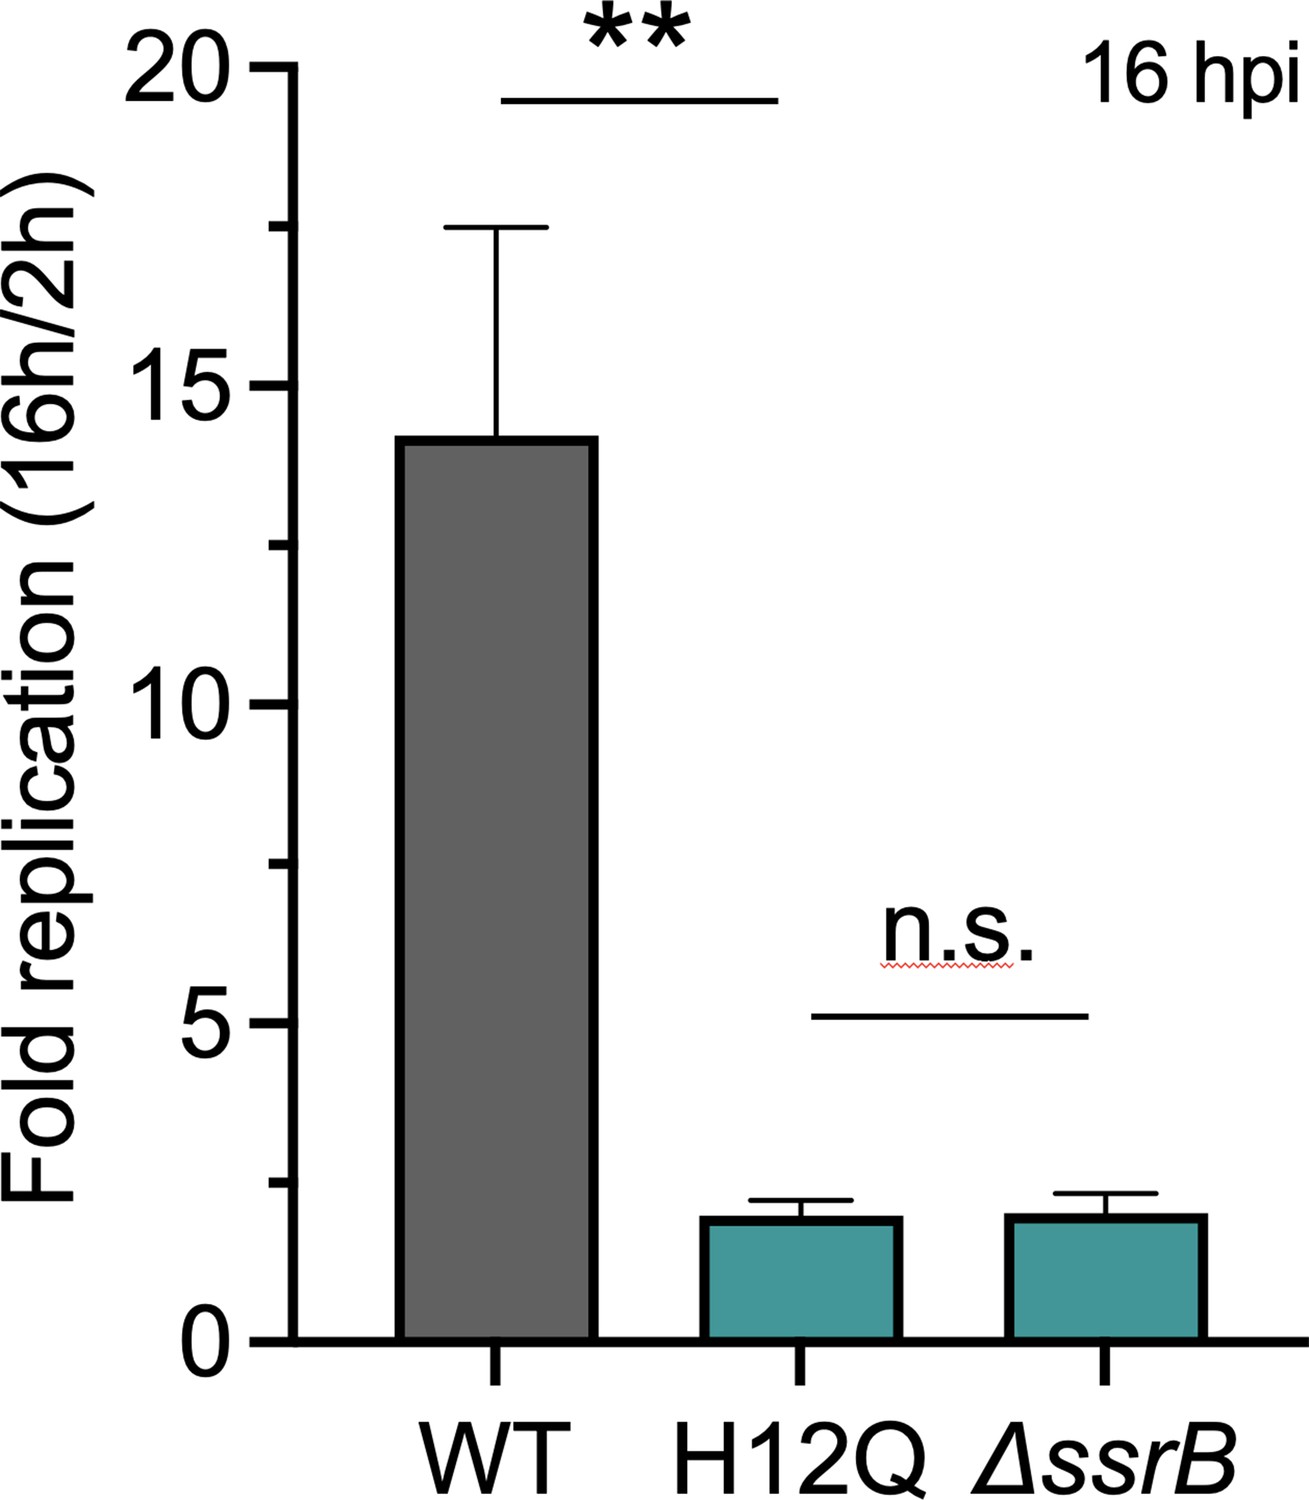
Intracellular survival of 14028s strains expressing SsrB wild-type or H12Q or lacking SsrB during infection of RAW 264.7 macrophages.
As compared to the wild-type, which exhibits a 14.2-fold increase in replication at 16 hr post infection (hpi) vs. 2 hpi, Salmonellae expressing H12Q only showed a twofold increase in replication, similar to that of a ΔssrB strain (twofold) (**p<0.01, n.s. = p>0.05, n = 3).
-
Figure 3—figure supplement 2—source data 1
Fold replication values for individual experiments used to create plots for Figure 3—figure supplement 2.
- https://cdn.elifesciences.org/articles/85690/elife-85690-fig3-figsupp2-data1-v2.xlsx
Figure 3—figure supplement 3

Immunoblotting of strains expressing various SsrB constructs grown in magnesium minimal medium (MGM) pH 7.4.
An anti-6X-HisTag monoclonal antibody was used to detect SsrB, and an anti-DnaK antibody was used as a loading control. Lane 1 contains purified SsrB (6.9 μg) as a positive control. Lanes 2–5 contain cell-free extracts from strains expressing the empty vector (lane 2), SsrB (lane 3), H12Q (lane 4), and H12Y (lane 5).
-
Figure 3—figure supplement 3—source data 1
Original uncropped images of immunoblot used to generate Figure 3—figure supplement 2.
- https://cdn.elifesciences.org/articles/85690/elife-85690-fig3-figsupp3-data1-v2.zip
Figure 4 with 1 supplement
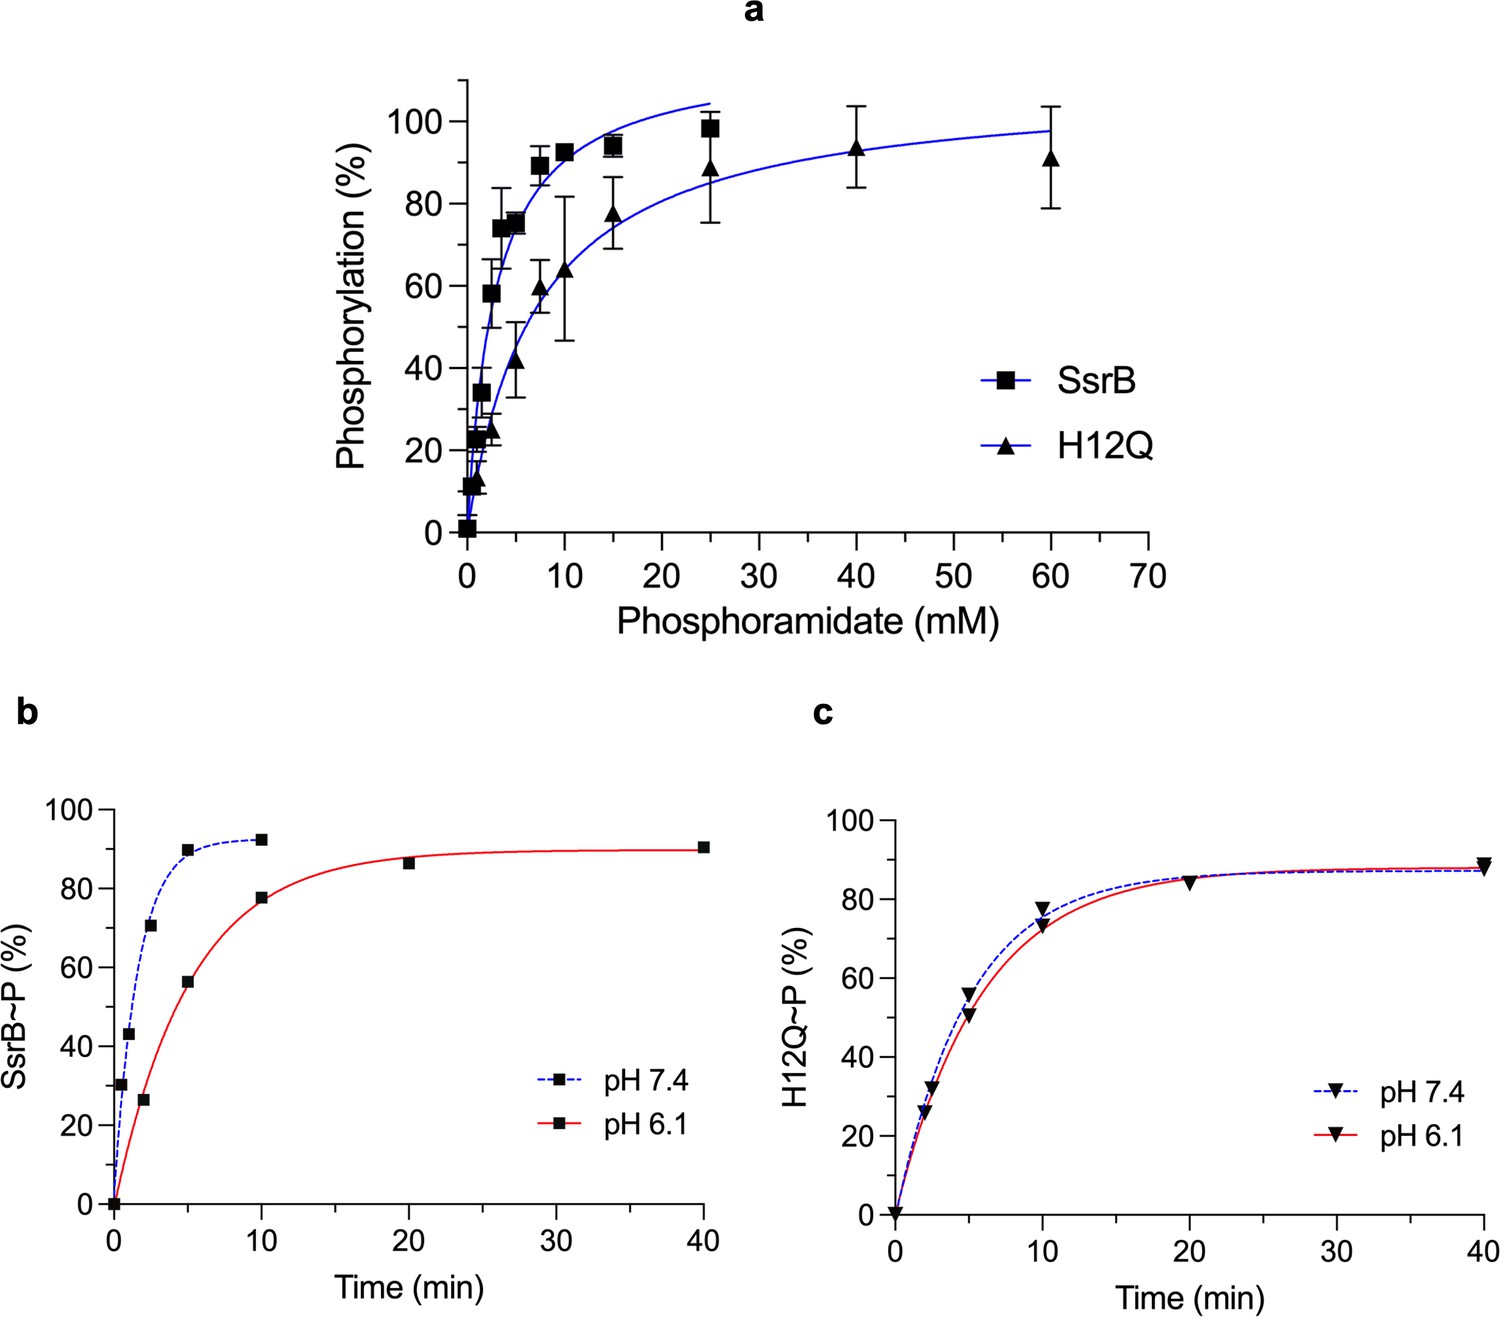
His12 substitution reduces SsrB phosphorylation.
(a) The plot represents the percentage of phosphorylated protein (12 μM) at pH 7.4 after 10 min as a function of phosphoramidate (PA) concentration (mM) in the phosphorylation reaction. The K0.5 for SsrB (squares) and H12Q (triangles) phosphorylation with PA was 2.9 ± 0.3 and 7.1 ± 1.1 mM, respectively. The error bars represent the standard deviation of two independent measurements. The blue lines represent the curve derived from fitting the points to the hyperbolic equation to determine the K0.5. The absence of error bars indicates that the standard deviation was < the symbol. (b) The plots represent the percentage of phosphorylated protein (12 μM) with 15 mM PA and 100 mM MgCl2 at varying times at neutral (blue) or acid pH (red) (see ‘Materials and methods’). Phosphorylation of SsrB slows down at acid pH (Kobs = 0.19 min–1) compared to neutral pH (Kobs = 0.62 min–1). (c) The rate of H12Q phosphorylation was similar at neutral and acid pH (Kobs = 0.20 and 0.17 min–1, respectively). The blue or red lines represent the curve derived from fitting the points to a single exponential decay equation to determine the Kobs (n=1).
-
Figure 4—source data 1
Phosphorylated protein percentages for individual experiments used to create plots for Figure 4.
- https://cdn.elifesciences.org/articles/85690/elife-85690-fig4-data1-v2.xlsx
Figure 4—figure supplement 1

The elution profile of unphosphorylated and phosphorylated SsrB and SsrB H12Q in a 40–50% acetonitrile in water gradient.
The red curve represents the profile of unphosphorylated SsrB, which has a retention time of 19.5 min. The blue curve represents a reaction of SsrB with 2.5 mM phosphoramidate (PA), with SsrB~P eluting at 18 min and SsrB eluting at 19.3 min. The black curve represents the profile of unphosphorylated SsrB H12Q, its retention time was 21.8 min. The green curve represents a reaction of SsrB H12Q with 2.5 mM PA, with SsrB H12Q~P eluting at 20.9 min and SsrB H12Q eluting at 21.8 min.
Figure 5 with 3 supplements
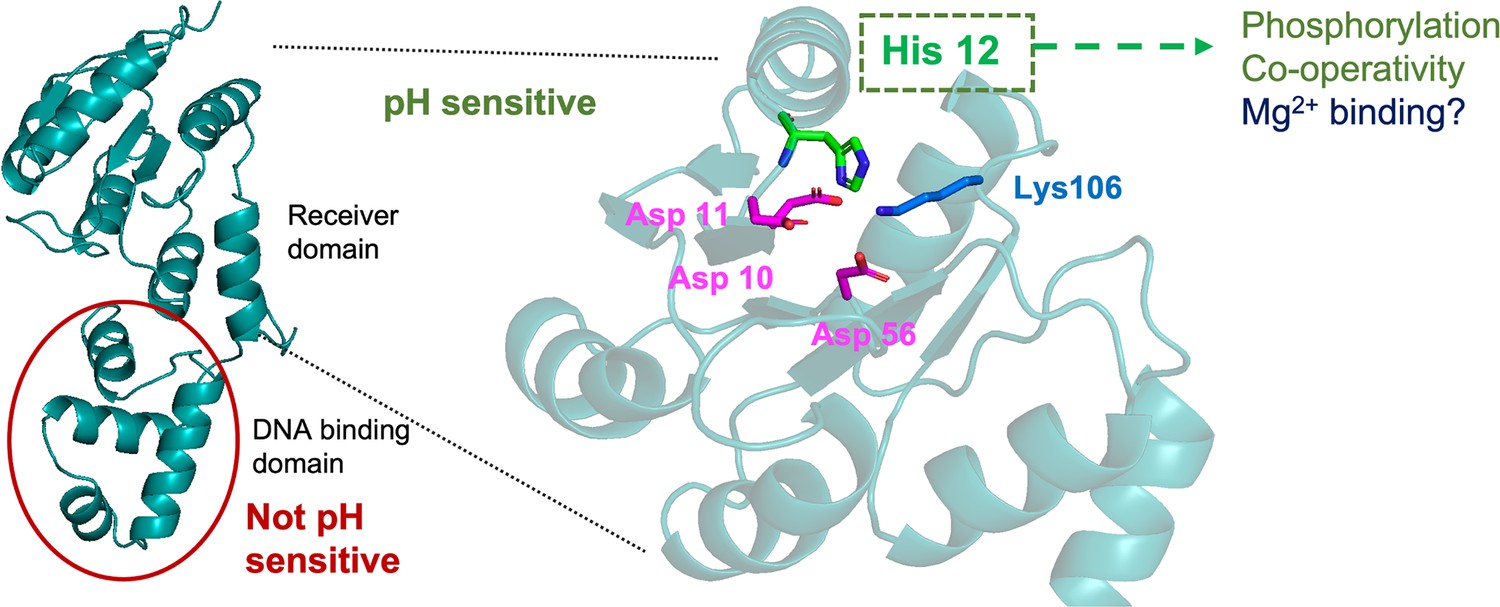
Summary of key findings.
SsrB pH sensing lies in the receiver domain and not in the DNA-binding domain. A conserved histidine at position 12, which lies in the proximity of active site residues, is responsible for pH sensing. His12 also affects phosphorylation and cooperativity of DNA binding, and potentially influences Mg2+ binding as well.
Figure 5—figure supplement 1
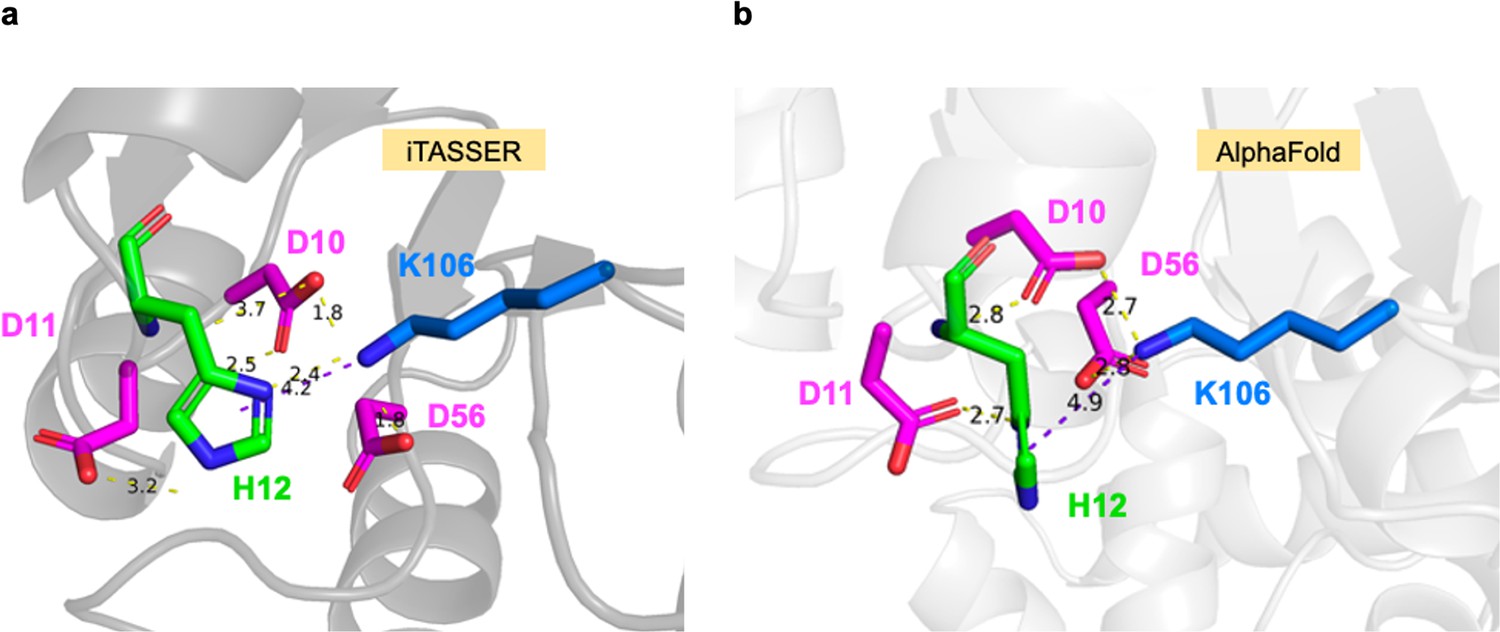
His12 interactions with residues in the SsrB receiver domain.
(a) In an i-TASSER prediction, His12 forms polar contacts with Asp10, Asp11, and Lys106, and a π–cation interaction with Lys106. (b) In an AlphaFold prediction, His12 forms polar contacts with Asp10 and Asp11, and a π–cation interaction with Lys106. Structures were visualized using PyMol; yellow dashed lines represent polar contacts, and purple lines represent π–cation distance.
Figure 5—figure supplement 2
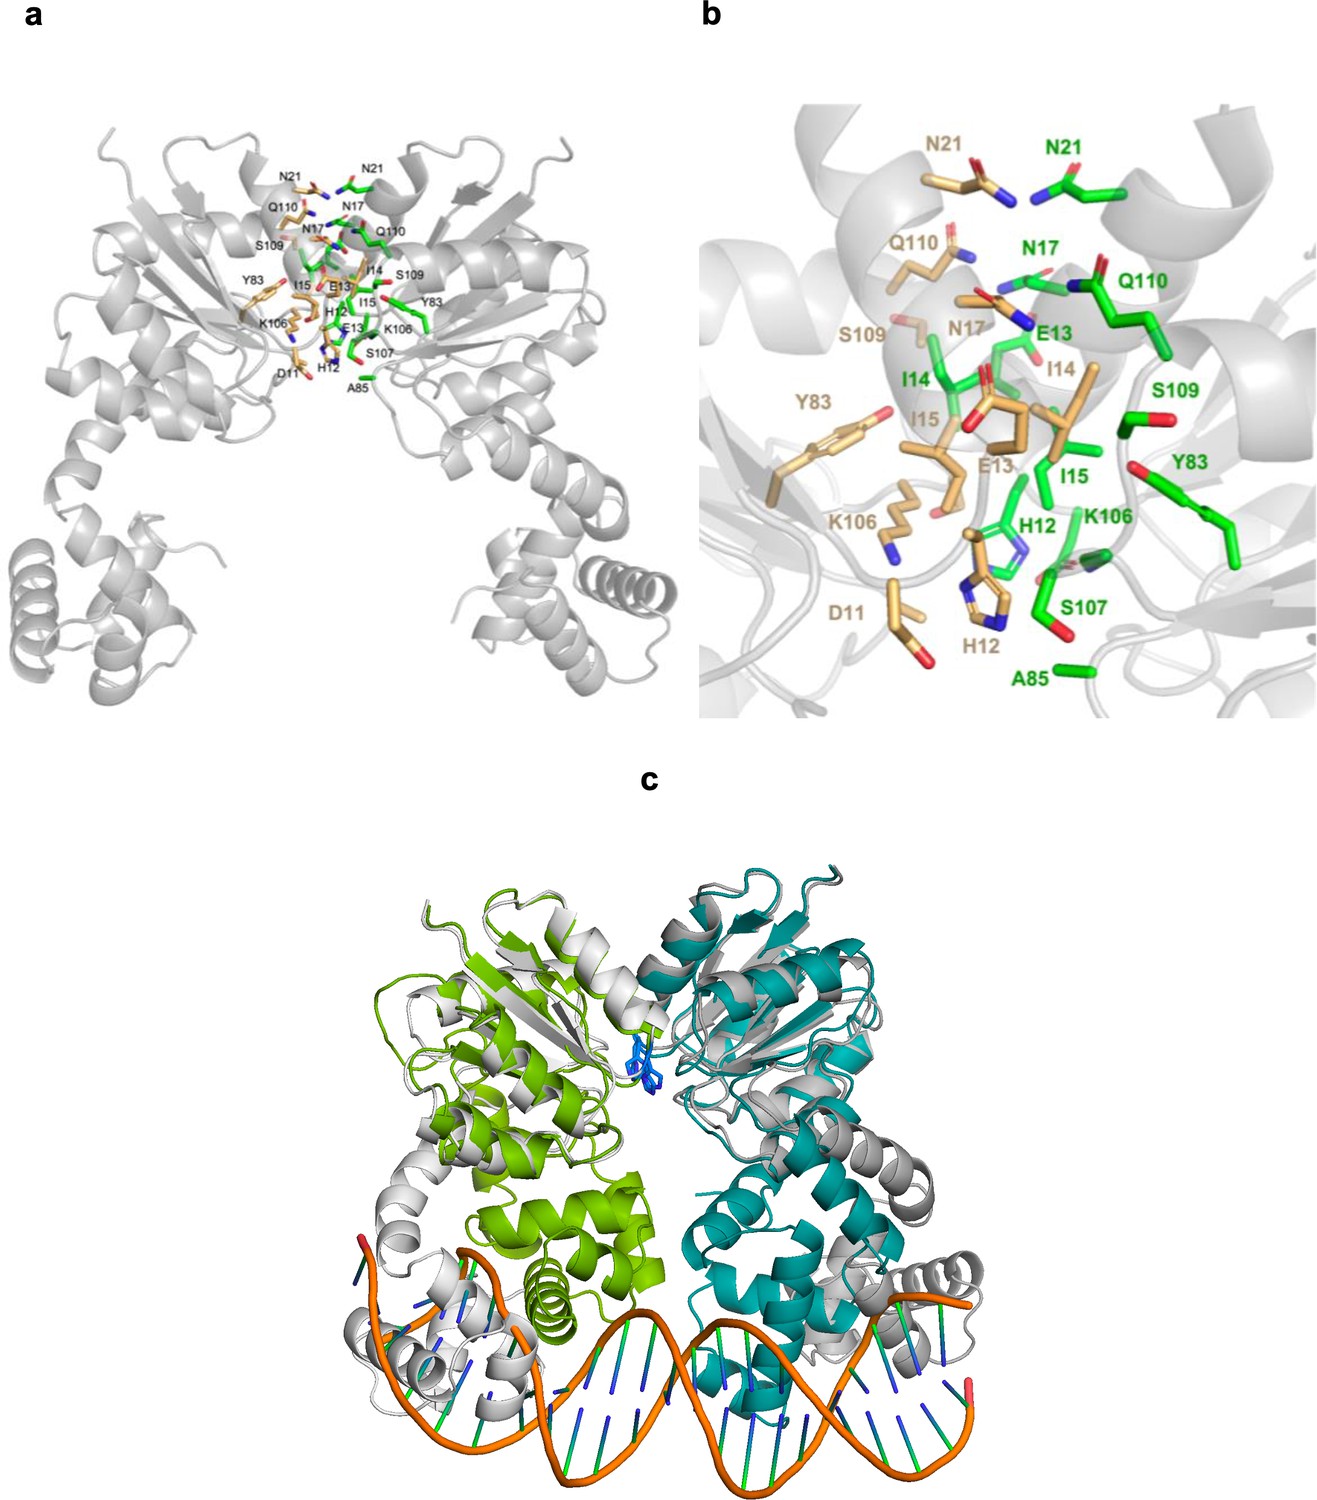
AlphaFold prediction of an SsrB dimer.
(a) The dimer structure of SsrB was predicted using the AlphaFold server. Interacting residues were analyzed using UCSF ChimeraX. Side chains of residues involved in the dimer interface are colored and represented as sticks, with orange sticks representing residues from monomer one and green sticks representing residues from the other monomer. (b) A zoomed-in image of the dimerization interface. (c) SsrB dimer–DNA interaction (in green and teal) modeled on the crystal structure of the RcsB dimer bound to DNA (PDB: 6ZIX). The AlphaFold dimer prediction, depicted in gray, aligns with the receiver domain. His12 residues are depicted as blue sticks.
Figure 5—figure supplement 3
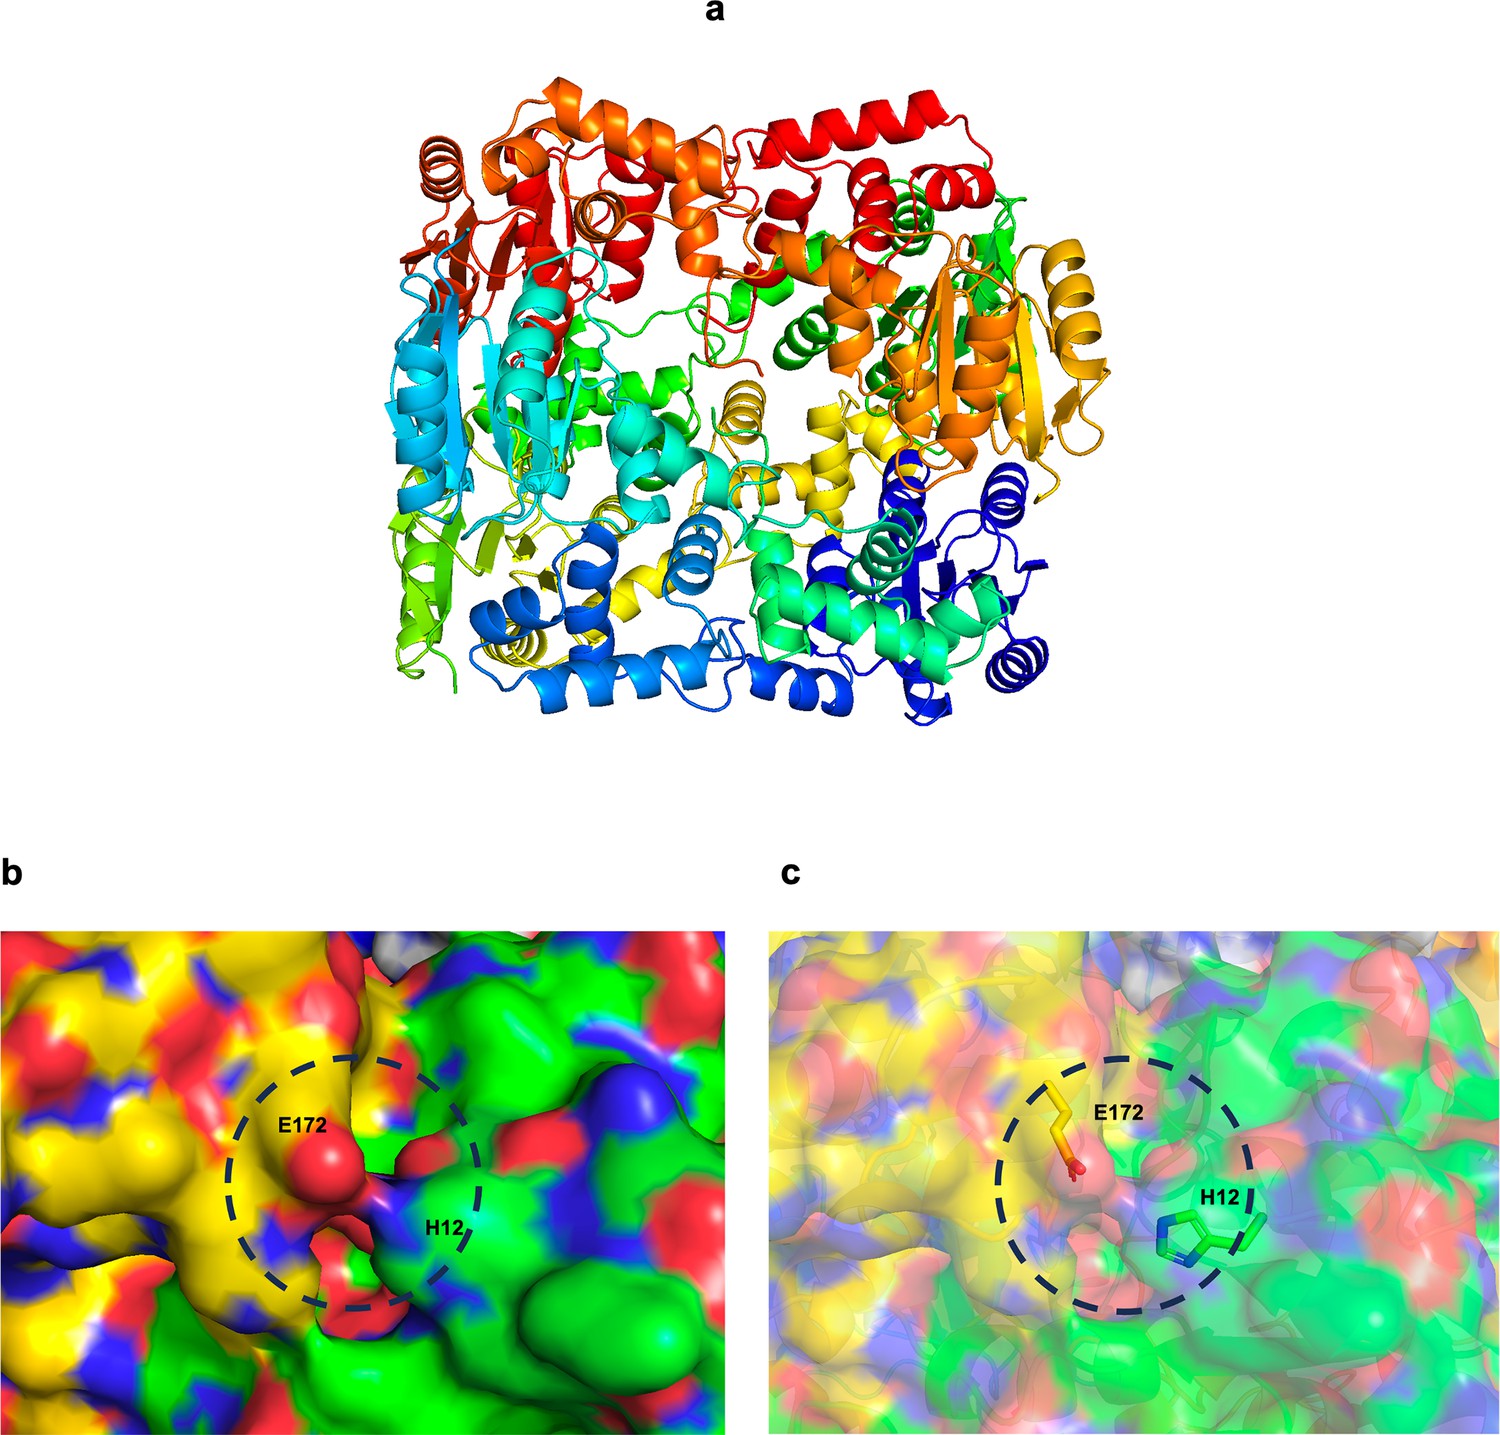
A model for an SsrB oligomer, generated using the RcsB hexamer (PDB id: 5O8Y) as the template.
(a) Cartoon representation of the SsrB hexamer. (b) A zoomed-in depiction of the interface between two monomers. His12 of one monomer potentially interacts with Glu172 of another monomer, the interaction is depicted here using the surface view, and (c) the surface and stick views.
Tables
Table 1
Comparison of some response regulators.
| Protein | Organism | pI | Number of histidines | % identity with SsrB |
|---|---|---|---|---|
| SsrB | Salmonella Typhimurium | 7.12 | 9 | 100.0 |
| RcsB | Escherichia coli K12 | 6.85 | 3 | 25.5 |
| RcsB | Salmonella Typhimurium | 6.85 | 3 | 25.5 |
| EvgA | Shigella flexineri | 6.83 | 3 | 28.2 |
| Spo0A | Bacillus stearothermophilus | 6.31 | 9 | 25.2 |
| NarL | E. coli K12 | 5.73 | 6 | 28.3 |
| DegU | Bacillus subtilis | 5.66 | 11 | 26.8 |
| DosR | Mycobacterium tuberculosis | 5.62 | 1 | 27.5 |
| VraR | Staphylococcus aureus | 5.47 | 5 | 29.2 |
| StyR | Pseudomonas fluorescens | 5.42 | 6 | 26.5 |
| LiaR | Enterococcus faecium | 5.11 | 5 | 30.0 |
| Spr1814 | Streptococcus pneumoniae | 4.95 | 1 | 25.6 |
| PhoP | E. coli | 5.10 | 6 | 22.5 |
| OmpR | E. coli | 6.04 | 3 | 31.6 |
Table 2
Cell lines, strains, and plasmids used in this study.
| Strain/plasmid/cell line | Description/genotype | Reference/ source |
|---|---|---|
| Salmonella strains | ||
| 14028s WT | Salmonella enterica serovar Typhimurium strain 14028s | Lab stock |
| 14028s.ssrB.H12Q | 14028s ssrB:ssrB.H12Q-catR | This work |
| DW637 | 14028s ΔssrB attP::PsifA-lacZ (KanR) | Desai et al., 2016 |
| E. coli strains | ||
| TOP10 | E. coli DH10B | Saunders lab, MBI |
| Plasmids | ||
| pMPMA5Ω | (AmpR) | Lab stock |
| pMPM_SsrBWT | pMPMA5Ω plasmid cloned with 6xhis-ssrB (AmpR) | Feng et al., 2004 |
| pMPM_SsrBc | pMPMA5Ω plasmid cloned with 6xhis-ssrBc (AmpR) | Feng et al., 2004 |
| pMPM_SsrB_H28A | pMPMA5Ω plasmid cloned with 6xhis-ssrB.H28A (AmpR) | This work |
| pMPM_SsrB_H34A | pMPMA5Ω plasmid cloned with 6xhis-ssrB.H34A (AmpR) | This work |
| pMPM_SsrB_H72A | pMPMA5Ω plasmid cloned with 6xhis-ssrB.H72A (AmpR) | This work |
| pMPM_SsrB_2H1 | pMPMA5Ω plasmid cloned with 6xhis-ssrB.H28A.H34A (AmpR) | This work |
| pMPM_SsrB_2H2 | pMPMA5Ω plasmid cloned with 6xhis-ssrB.H28A.H72A (AmpR) | This work |
| pMPM_SsrB_2H3 | pMPMA5Ω plasmid cloned with 6xhis-ssrB.H34A.H72A (AmpR) | This work |
| pMPM_SsrB_3H | pMPMA5Ω plasmid cloned with 6xhis-ssrB.H28A.H34A.H72A (AmpR) | This work |
| pMPM_SsrB_H12A | pMPMA5Ω plasmid cloned with 6xhis-ssrB.H12A(AmpR) | This work |
| pMPM_SsrB_H12Q | pMPMA5Ω plasmid cloned with 6xhis-ssrB.H12Q (AmpR) | This work |
| pMPM_SsrB_H12N | pMPMA5Ω plasmid cloned with 6xhis-ssrB.H12N (AmpR) | This work |
| pMPM_SsrB_H12Y | pMPMA5Ω plasmid cloned with 6xhis-ssrB.H12Y (AmpR) | This work |
| pMPM_SsrB_H12K | pMPMA5Ω plasmid cloned with 6xhis-ssrB.H12K (AmpR) | This work |
| pMPM_SsrB_H12F | pMPMA5Ω plasmid cloned with 6xhis-ssrB.H12F (AmpR) | This work |
| pKDS121 | pKD3 plasmid with ssrB.H12Q inserted upstream the catR gene | This work |
| Cell lines | ||
| HeLa | Human Cervical Adenocarcinoma cell line | ATCC |
| RAW264.7 | Murine Macrophage cell line | Bruno lab, UTMB |
Table 3
Primers and oligonucleotides used in this study.
| Primer/oligo | Description | Sequence |
|---|---|---|
| SsrB_His28A_FP | SsrB: substituting His28 to A | TTACCCTGGCCTGCCTTTAAAATTGTA |
| SsrB_His28A_RP | SsrB: substituting His28 to A | TACAATTTTAAAGGCAGGCCAGGGTAA |
| SsrB_His34A_FP | SsrB: substituting His34 to A | TTTAAAATTGTAGAGGCGGTTAAAAATGGTCTT |
| SsrB_His34A_RP | SsrB: substituting His34 to A | AAGACCATTTTTAACCGCCTCTACAATTTTAAA |
| SsrB_His72A_FP | SsrB: substituting His72 to A | ATTCCTCAATTAGCACAGCGTTGGCC |
| SsrB_His72A_RP | SsrB: substituting His72 to A | GGCCAACGCTGTGCTAATTGAGGAAT |
| SsrB_H12N_FP | SsrB: substituting His12 to N | TTAGTAGACGATAATGAAATCATCA |
| SsrB_H12N_RP | SsrB: substituting His12 to N | GATGATTTCATTATCGTCTACTAATAA |
| SsrB_H12K_FP | SsrB: substituting His12 to K | TTAGTAGACGATAAGGAAATCATCA |
| SsrB_H12K_RP | SsrB: substituting His12 to K | GATGATTTCCTTATCGTCTACTAATAA |
| SsrB_H12Y_FP | SsrB: substituting His12 to Y | TTAGTAGACGATTATGAAATCATCA |
| SsrB_H12A_FP | SsrB: substituting His12 to A | TTAGTAGACGATGCGGAAATCATCA |
| SsrB_H12Q_FP | SsrB: substituting His12 to Q | TTAGTAGACGATCAGGAAATCATCA |
| SsrB_H12F_FP | SsrB: substituting His12 to F | TTAGTAGACGATTTTGAAATCATCATT |
| SsrB_RP | SsrB reverse primer | TTAATACTCTATTAACCTCATTCTTCG |
| pKDSsrB_FP | To amplify ssrB.H12Q with homology to pKD3 | ATATGAATATCCTCCTATGAAAGAATATAAGATCTTATTA |
| H12Q_CmR_RP1 | To amplify ssrB.H12Q with homology upstream of catR | GGACCATGGCTAATTCCCATTTAATACTCTATTAA |
| GA_CmR_FP | To amplify pKD3 with homology to ssrB.H12Q | TTAATAGAGTATTAAATGGGAATTAGCCATGGTCC |
| pKD3_FP | To amplify pKD3 with homology to ssrB.H12Q | GATCTTATATTCTTTCATACTAAGGAGGATATTCATAT |
| Lam_FP | To amplify ssrB.H12Q.catR with 40 bp homology upstream of ssrB in 14028s | ATTACTTAATATTATCTTAATTTTCGCGAGGGCAGCAAAATGAAAGAATA |
| Lam_RP2 | To amplify ssrB.H12Q.catR with 40 bp homology downstream of ssrB in 14028s | CAAAATATGACCAATGCTTAATACCATCGGACGCCCCTGGGTGTAGGCTGGAG |
| Ex_SsrB_F | To confirm insertion of ssrB.H12Q.catR in 14028s | TTGGTATGCTATGTCATAGACA |
| Ex_SsrB_R | To confirm insertion of ssrB.H12Q.catR in 14028s | GTGCGGCATACCAGGGCATC |
| pMPM_FP | For sequence check of constructs in pMPMA5Ω | TACCTGACGCTTTTTATCGC |
| pMPM_RP | For sequence check of constructs in pMPMA5Ω | CTTCTCTCATCCGCCAAAAC |
| sseI hairpin | Used for single-molecule unzipping assay | 5′-Biotin-TTTTTTTTTTTCTATGCGCCAGTCCTTAATGGCATTATCTGAATCGTTAAGTAATTTCTTGTG TGAAATTACTTAACGATTCAGATAATGCCATTAAGGACTGGCGCATAGAGCAGCGTCCCGGGCGGCC |
Additional files
Download links
A two-part list of links to download the article, or parts of the article, in various formats.
Downloads (link to download the article as PDF)
Open citations (links to open the citations from this article in various online reference manager services)
Cite this article (links to download the citations from this article in formats compatible with various reference manager tools)
A pH-sensitive switch activates virulence in Salmonella
eLife 12:e85690.
https://doi.org/10.7554/eLife.85690


