Osteoblast-intrinsic defect in glucose metabolism impairs bone formation in type II diabetic male mice
- Translational Research Program in Pediatric Orthopedics, Department of Surgery, The Children’s Hospital of Philadelphia, United States
- The State Key Laboratory Breeding Base of Basic Science of Stomatology and Key Laboratory for Oral Biomedicine of Ministry of Education, School and Hospital of Stomatology, Wuhan University, China
- Lewis Sigler Institute for Integrative Genomics, Princeton University, United States
- Department of Computer Science, New Jersey Institute of Technology, United States
- Deaprtment of Orthopedic Surgery, University of Pennsylvania, United States
Figures
Figure 1 with 1 supplement
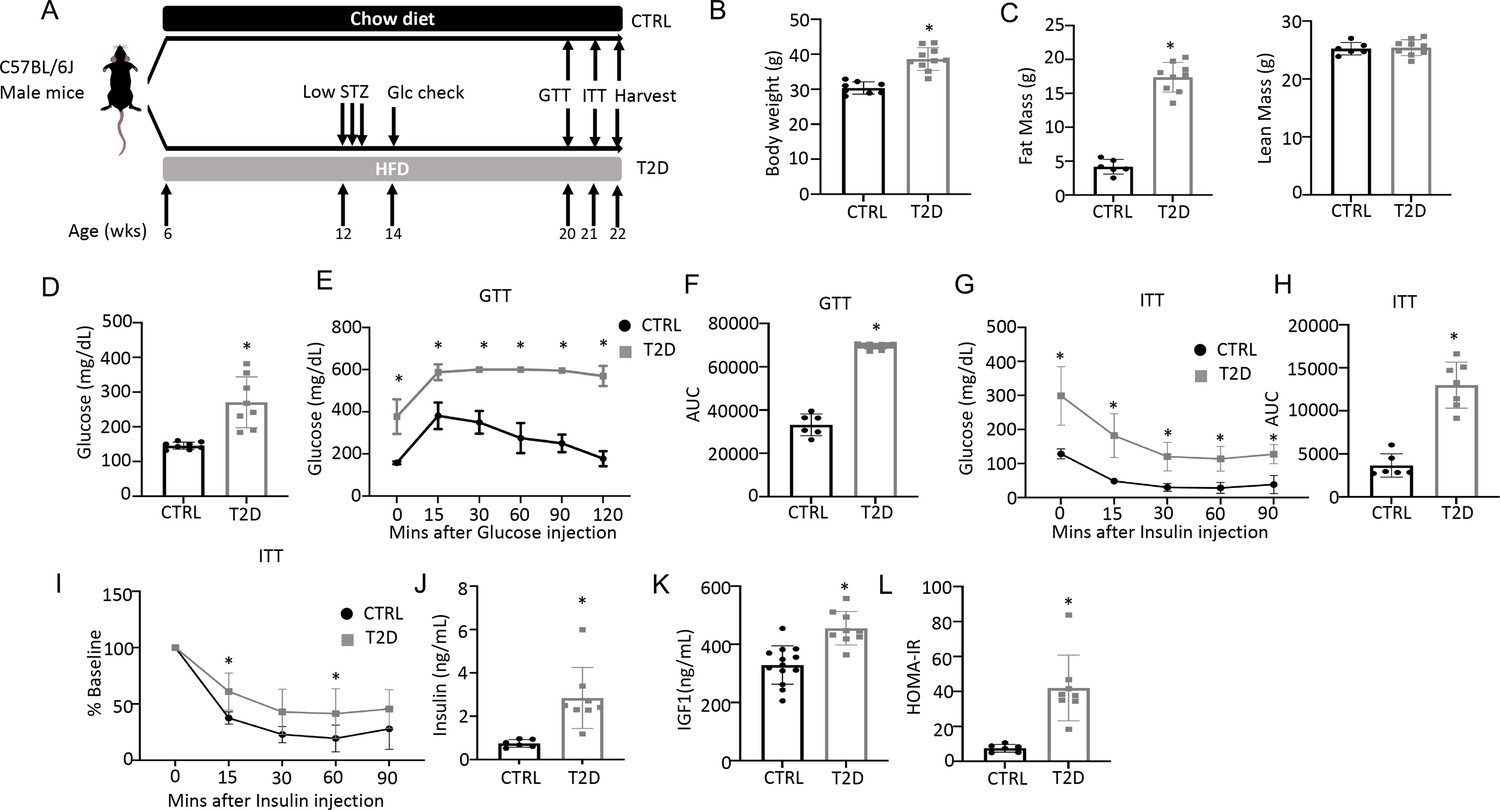
Combination of HFD and low-dose streptozotocin (STZ) induces Type 2 diabetes (T2D) in mice.
(A) A schematic for experimental design. Low-dose STZ: 30 mg/kg body weight. (B, C) Body weight (B, CTRL, n=8; T2D, n=10) and body composition by DXA (C, CTRL, n=6; T2D, n=9) at harvest. (D) Glucose levels after 6 hr fasting immediately before harvest. n=8. (E, F) Glucose tolerance test (GTT) curve (E) and area under curve (AUC) (F). CTRL, n=6; T2D, n=9. (G, H) Insulin tolerance test (ITT) glucose curve (G), AUC, (H) and percentage of baseline (I). CTRL, n=6; T2D, n=7. (J, K) Serum insulin (J, CTRL, n=6; T2D, n=8) and Igf1 (K, CTRL, n=9; T2D, n=13) levels. (L) HOMA-IR graphs. CTRL, n=6; T2D, n=8. All bar graphs are presented as mean ± SD. unpaired student’s t-test (B–D, F, H, J–L) or two-way ANOVA with Sidak’s multiple comparisons test (E, G, I). *p<0.05.
Figure 1—figure supplement 1
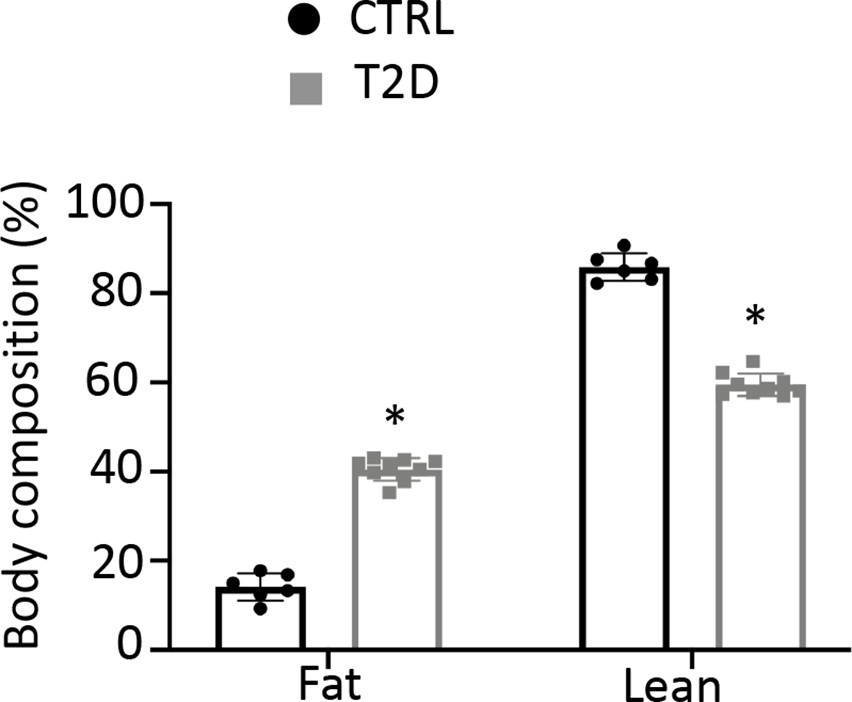
Type 2 diabetes (T2D) mice increase fat mass over lean mass.
Body composition was measured with DEXA. CTRL, n=6; T2D, n=9. *p<0.05, Student’s t-test.
Figure 2 with 1 supplement
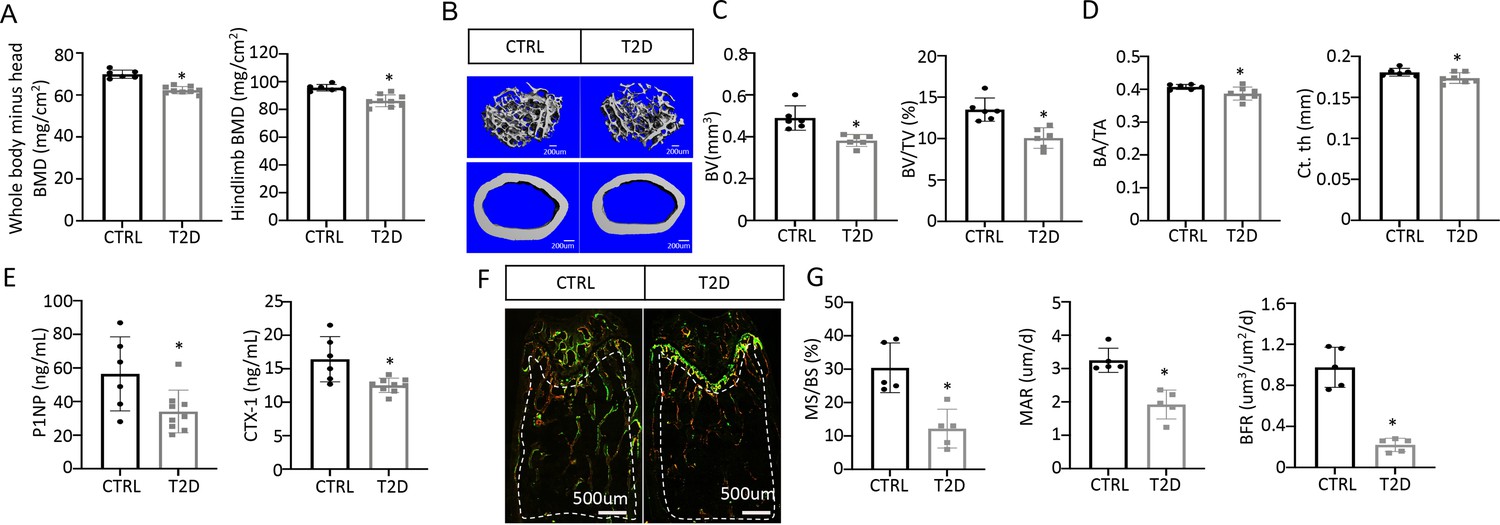
Type 2 diabetes (T2D) causes low turnover osteopenia.
(A) Bone mineral density (BMD) for the whole body (minus head) and one leg (femur and tibia). CTRL, n=6; T2D, n=9. (B) Representative µCT images. (C) Quantitative analysis of trabecular bone of the distal femur. n=6. (D) Quantitative analysis of cortical bone in femur. CTRL, n=6; T2D, n=7. (E) Serum bone formation (P1NP) and resorption (CTX-1) markers. CTRL, n=6; T2D, n=9. (F, G) Representative images (F) and quantification (G) for double labeling of trabecular bone in the distal femur. n=5. Data are mean ± SD. Unpaired Student’s t-tests. *p<0.05.
Figure 2—figure supplement 1
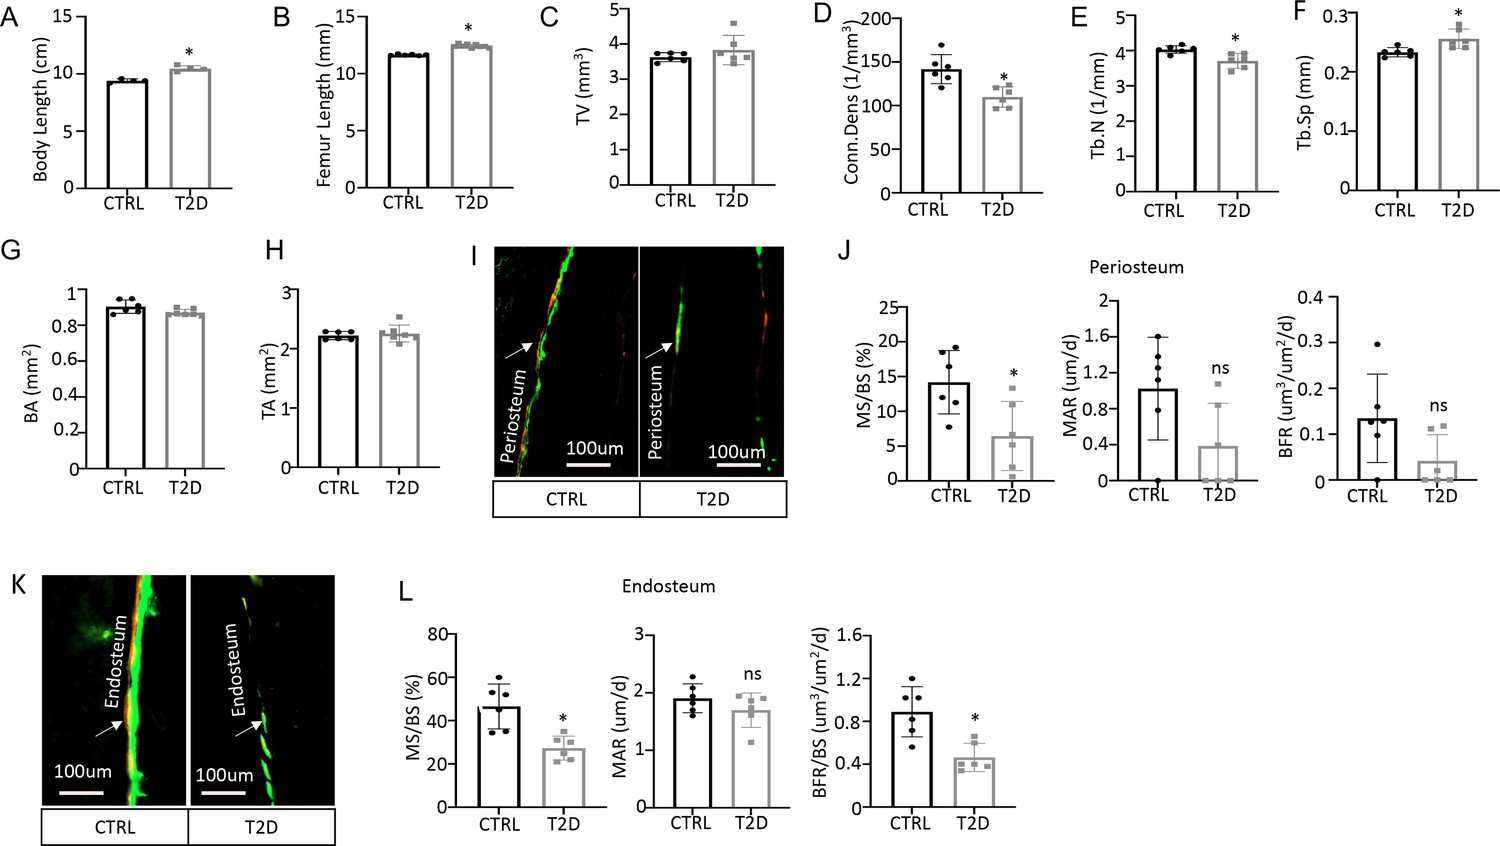
Diabetic osteopenia in Type 2 diabetes (T2D) mouse model.
(A) Body length (cm) from nose tip to the anus. n=4. (B) Femur length measured by DEXA. CTRL, n=6; T2D, n=9. (C–F) Trabecular bone parameters by µCT. n=6. (G, H) Cortical bone parameters by µCT. CTRL, n=6; T2D, n=7. (I, J) Double labeling analysis of periosteum. n=6. (K, L) Double labeling analysis of endosteum. n=6. Data are represented as mean ± SD. *p<0.05, Student’s t-test.
Figure 3 with 2 supplements
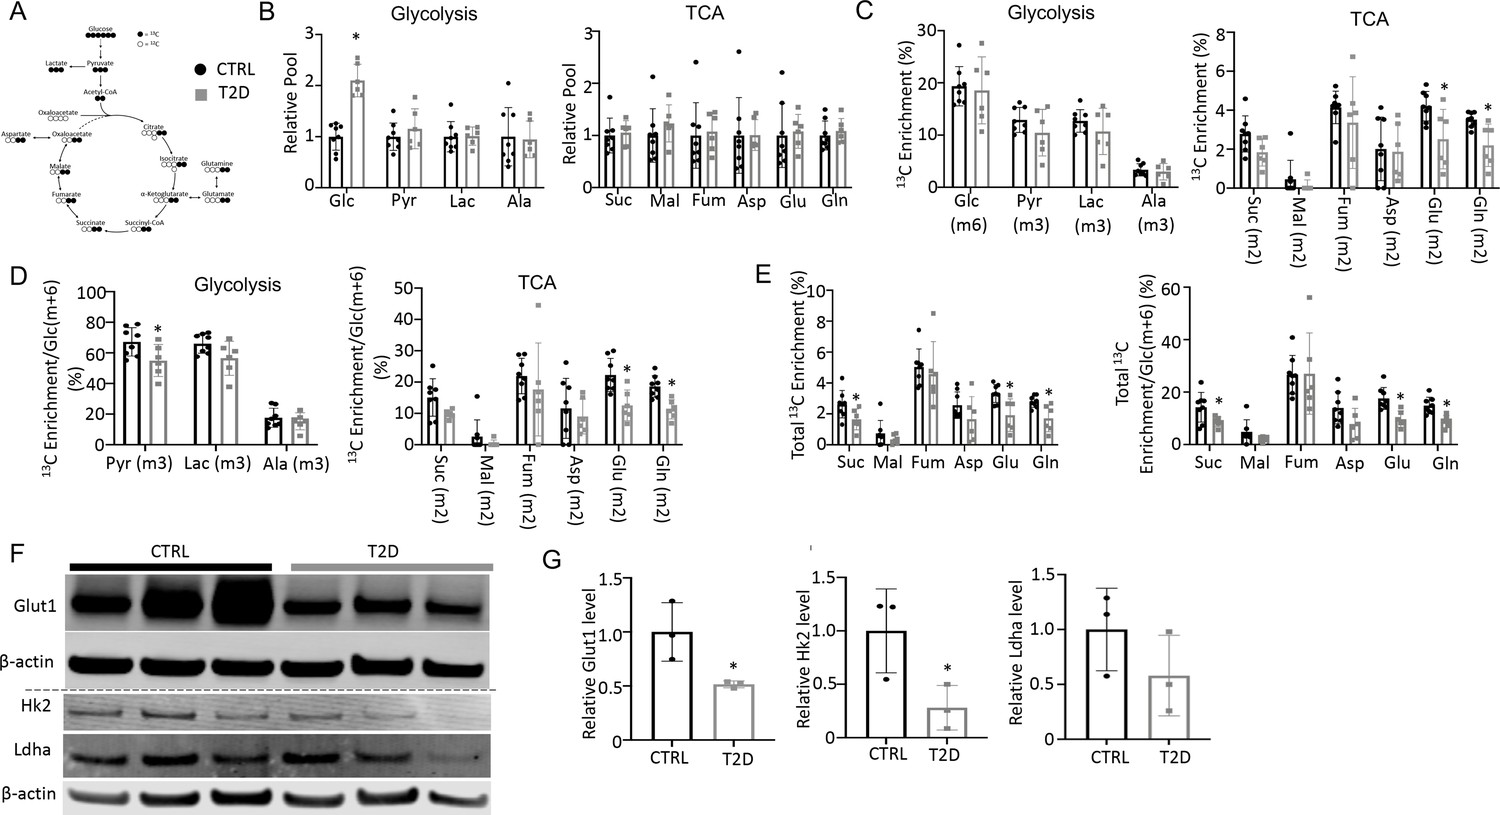
Type 2 diabetes (T2D) suppresses glucose metabolism in bone.
(A) A diagram for carbon tracing with 1313C6-Glc. (B) Relative pool size of glycolytic and TCA metabolites. CTRL, n=8; T2D, n=6. (C) Enrichment of specific isotopologues of metabolites relative to own pool. CTRL, n=8; T2D, n=6. (D) Relative enrichment of specific isotopologues normalized to Glc(m+6). CTRL, n=8; T2D, n=6. (E) Carbon enrichment of metabolites relative to own pool (left) and normalized to Glc(m+6) (right). CTRL, n=8; T2D, n=6. (F, G) Western blot images (F) and quantifications (G). n=3. Data presented as mean ± SD. *p<0.05, Two-tailed unpaired t-test.
-
Figure 3—source data 1
Raw images of Western blots for Figure 3F.
- https://cdn.elifesciences.org/articles/85714/elife-85714-fig3-data1-v2.zip
Figure 3—figure supplement 1
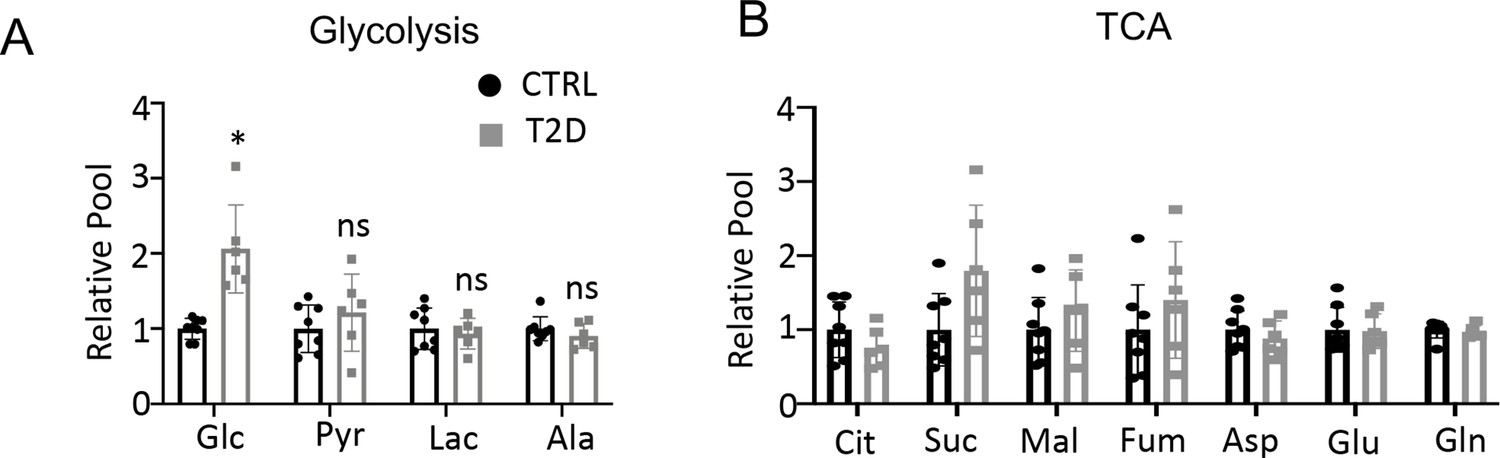
Glucose tracing in plasma.
(A, B) Relative levels of glycolysis (A) and TCA (B) metabolites in the plasma. CTRL, n=8; T2D, n=6. Data are represented as mean ± SD. *p<0.05, Student’s t-test.
Figure 3—figure supplement 2
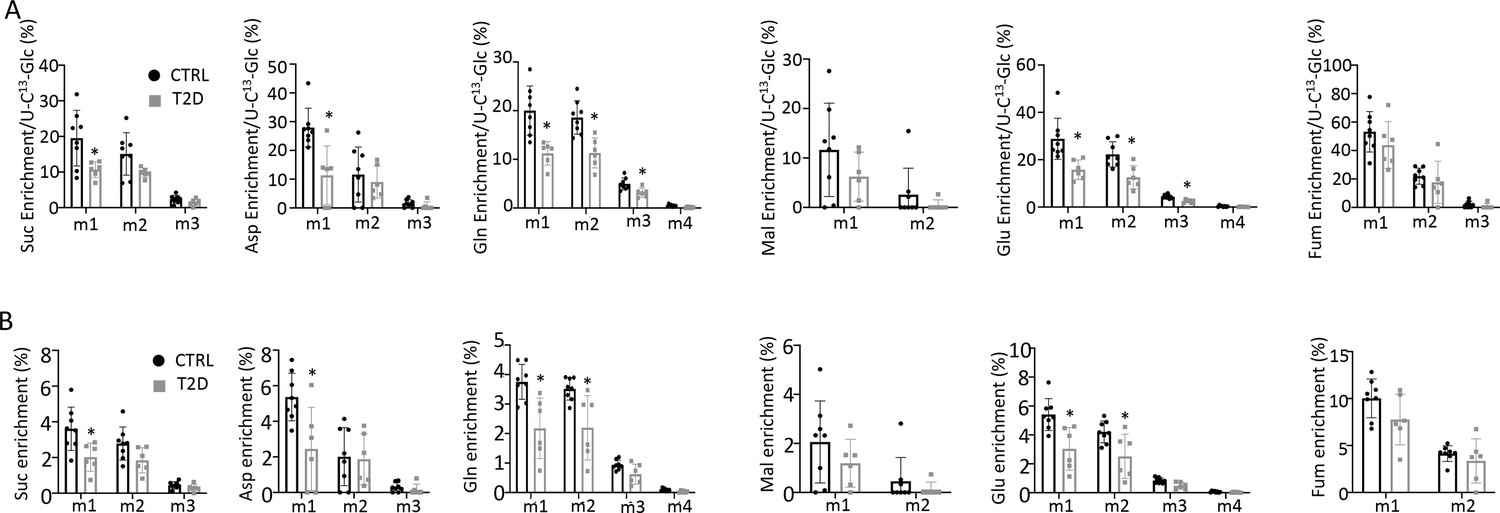
Glucose tracing in bone.
(A) Relative enrichment of specific isotopomers normalized to 1313C6-Glc in bone. (B) Enrichment of specific isotopomers in bone. CTRL, n=8; T2D, n=6. Data are represented as mean ± SD. *p<0.05, Student’s t-test.
Figure 4
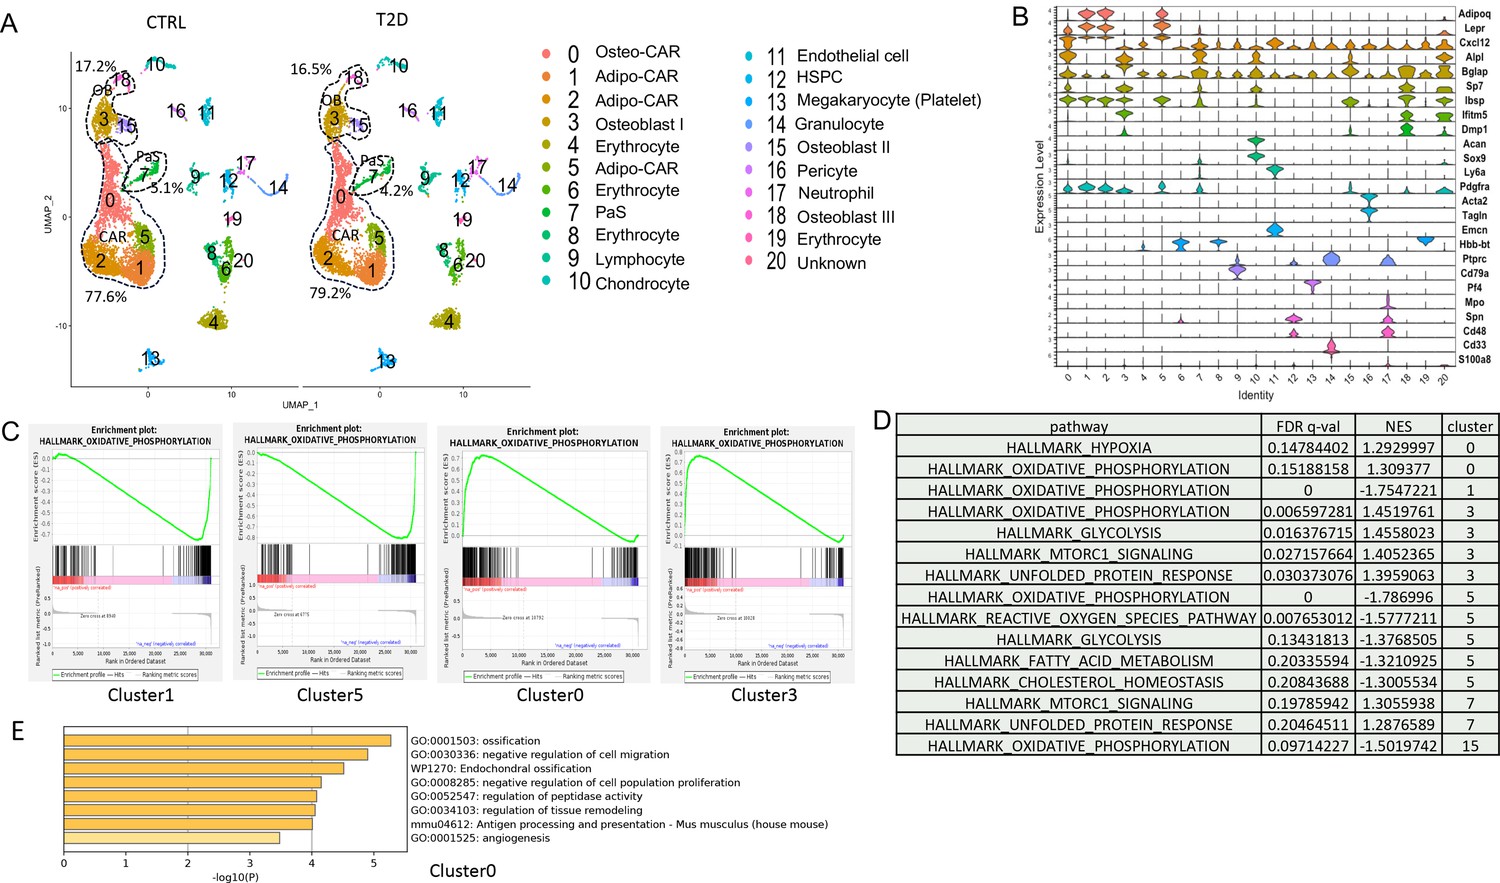
Single-cell RNA-sequencing (scRNA-seq) detects metabolic dysregulation in bone marrow mesenchymal cells of Type 2 diabetes (T2D) mice.
(A) UMAP clusters with annotations to the right. Percentages denote the relative abundance of osteoblast (OB), CAR, and PaS cells among mesenchymal cells. (B) Violin plots of the example feature genes for each cluster. (C) Gene set enrichment analysis (GSEA) of T2D over CTRL for OXPHOS pathway in clusters as indicated. (D) GSEA of T2D over CTRL for metabolic pathways in clusters as indicated. (E) Top pathways identified among T2D downregulated genes in cluster 0 with Metascape.
-
Figure 4—source data 1
GSEA results for gene pathway changes between ctrl and T2D identfied by scRNA-seq.
- https://cdn.elifesciences.org/articles/85714/elife-85714-fig4-data1-v2.docx
Figure 5 with 2 supplements
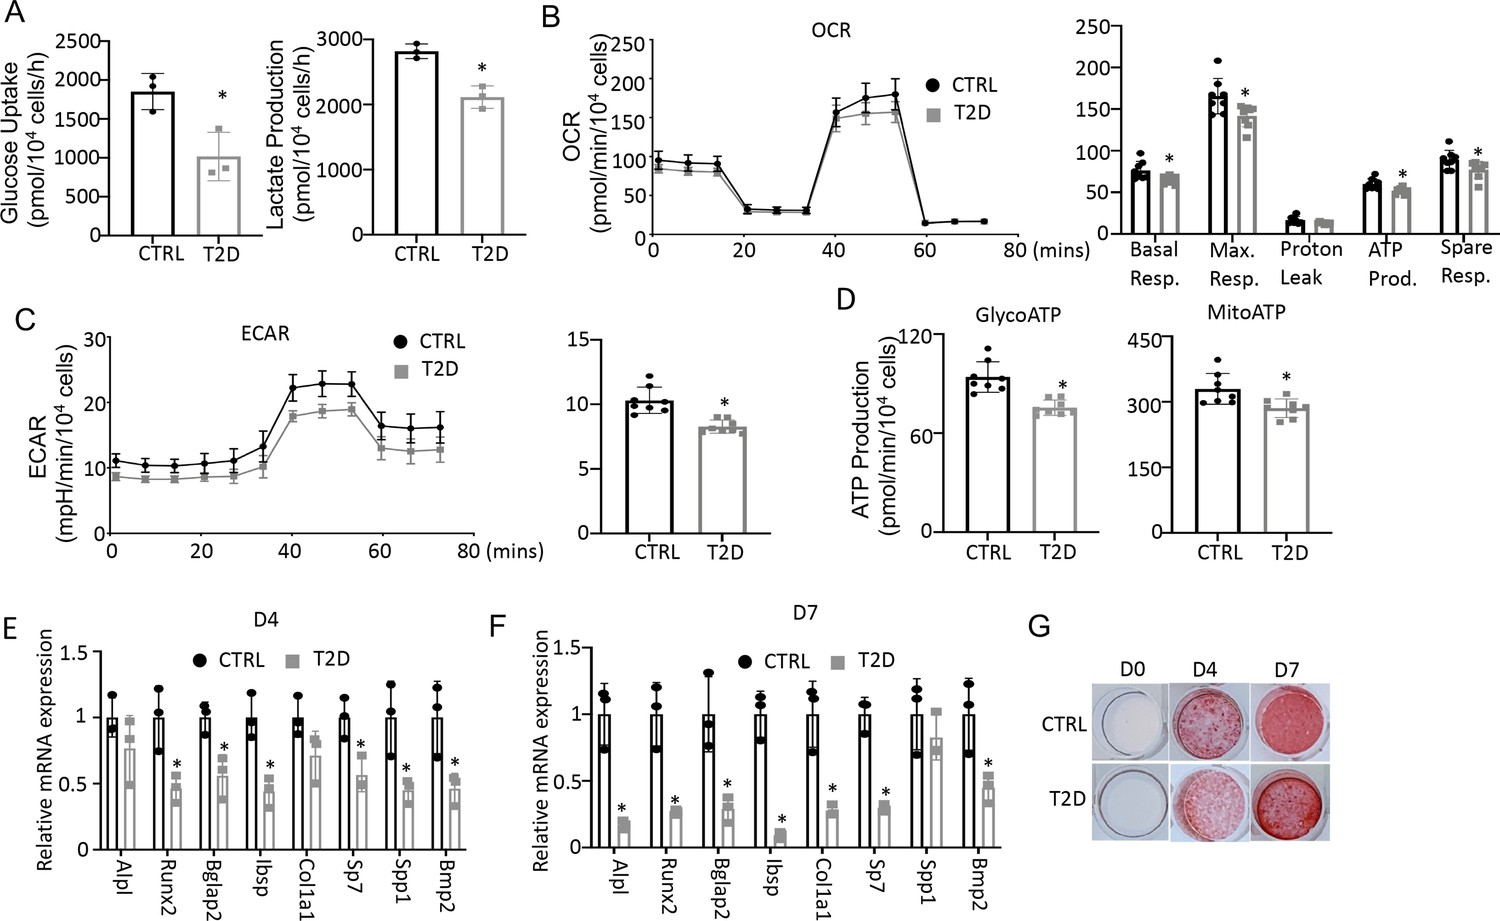
Type 2 diabetes (T2D) impairs glucose metabolism and osteogenic differentiation in bone marrow stromal cells (BMSC).
(A) Glucose uptake and lactate production rates. n=3. (B, C) Seahorse measurements of oxygen consumption rate (OCR) (B) and extracellular acidification rate (ECAR) (C). n=8. (D) Projected ATP production glycolysis (glycoATP) and mitochondria (mitoATP) based on Seahorse. n=8. (E, F) qPCR for osteoblast markers at day 4 (E) and day 7 (F) of differentiation. n=3. (G) Alizarin red staining. Data presented as mean ± SD. *p<0.05, Unpaired student’s t-test.
Figure 5—figure supplement 1
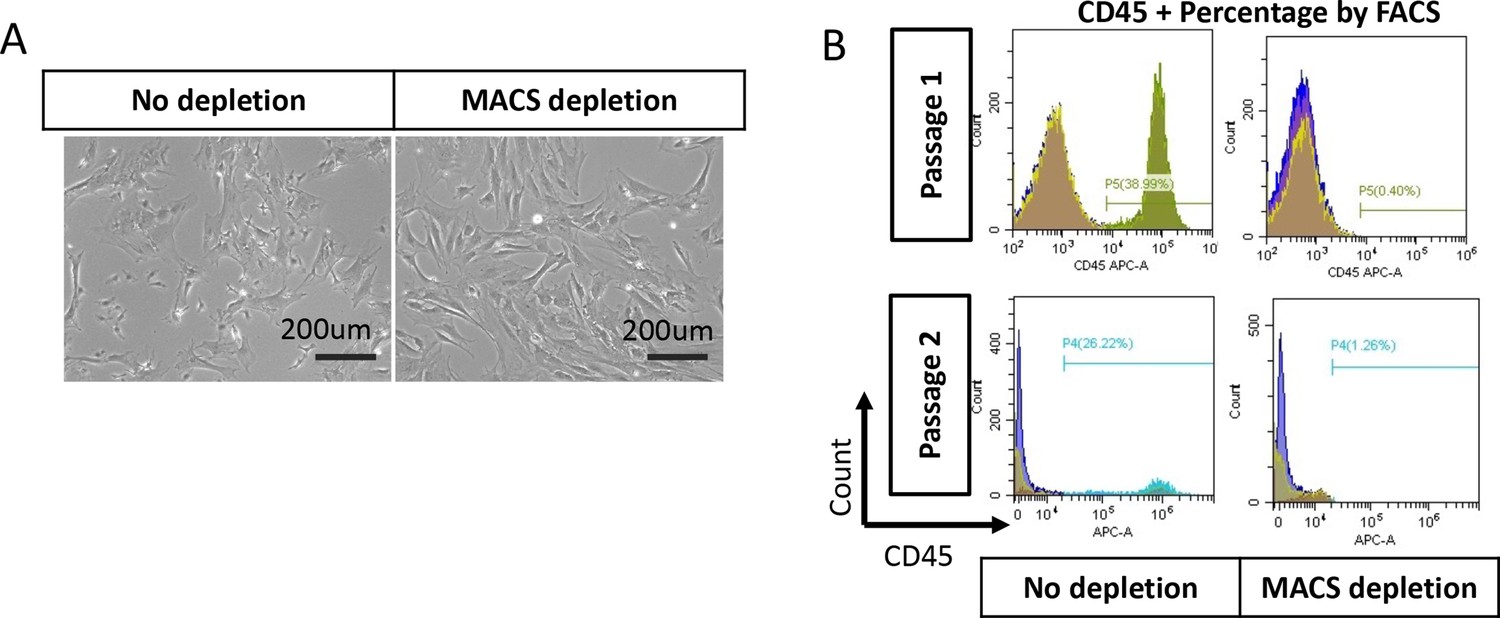
Bone marrow stromal cells (BMSC) purification with MACS beads.
(A) Bright field of BMSC with or without depletion of CD45 + cells. (B) FACS analysis of CD45+ cell percentage for BMSC with or without depletion after one or two passages.
Figure 5—figure supplement 2
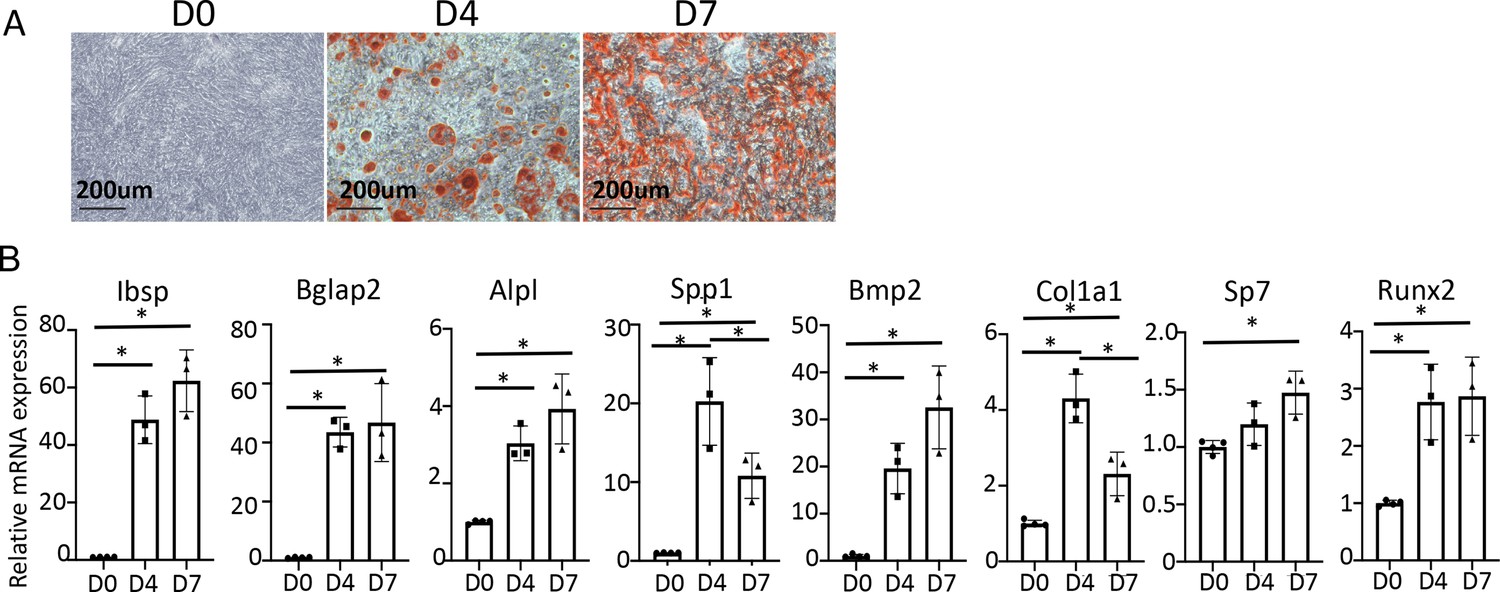
In vitro osteoblast differentiation of MACS-purified bone marrow stromal cells (BMSC) from wild-type mice.
(A) Alizarin red staining with differentiation at day 0, day 4, and day 7. (B) qPCR of osteoblast marker genes. n=3. Data are represented as mean ± SD. *p<0.05, one-way ANOVA.
Figure 6 with 1 supplement
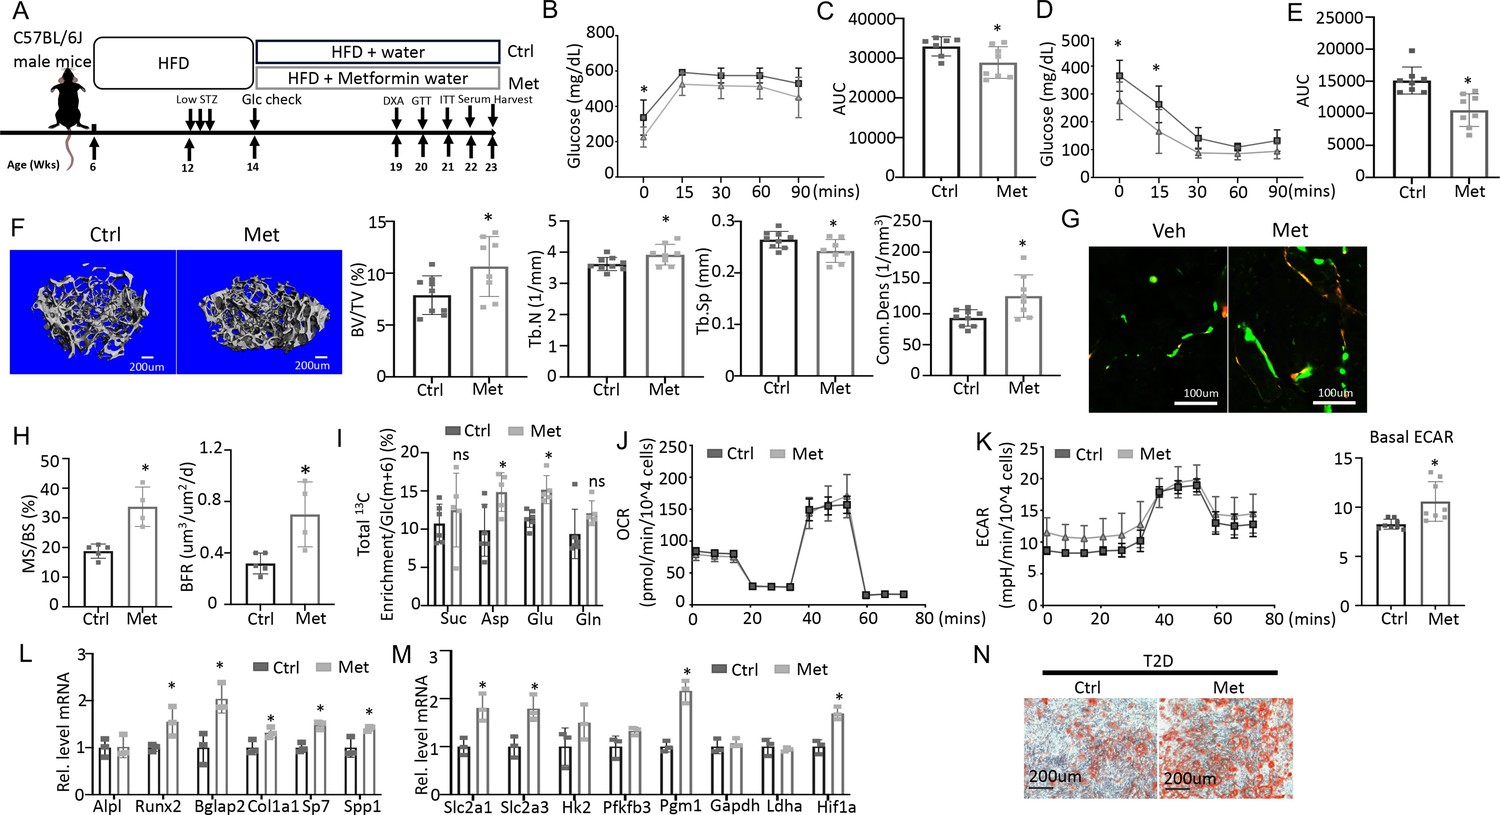
Metformin improves bone mass and glucose metabolism impaired by Type 2 diabetes (T2D).
(A) A schematic for metformin regimen. T2D animals were randomly divided into Control (Ctrl) and metformin (Met) groups. (B, C) Glucose tolerance test (GTT) curve (B) and area under curve (C). Ctrl, n=7; Met, n=8. (D, E) ITT curve (D) and area under curve (E). n=8. (F) Representative µCT images and quantification of trabecular bone in the distal femur. Ctrl, n=9; Met, n=8. (G, H) Representative images (G) and quantification (H) of double labeling in trabecular bone of the distal femur. Ctrl, n=5; Met, n=4. (I) Carbon enrichment of TCA metabolites normalized to Glc(m+6). Ctrl, n=6; Met, n=5. (J, K) Seahorse measurements of oxygen consumption rate (OCR) (J) and extracellular acidification rate (ECAR) (K) with or without 1 mM metformin treatment for 24 hr. n=8. (L, M) qPCR analyses of osteoblast markers (L) and glycolysis-related genes (M) in bone marrow stromal cells (BMSC) at day 7 of differentiation with or without 1 mM metformin treatment. n=3. (N) Alizarin red staining at day 7 of osteoblast differentiation. Data are presented as mean ± SD. *p<0.05, two-way ANOVA followed by Sidak’s multiple comparisons (B, D) or Student’s t-test (all others).
Figure 6—figure supplement 1
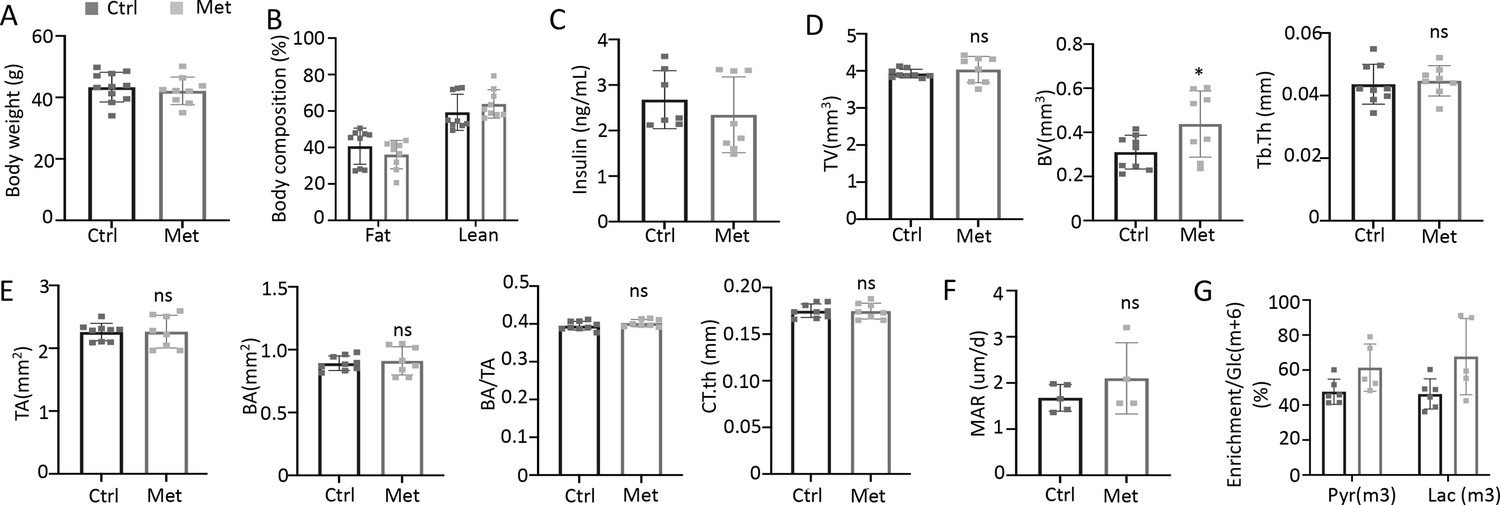
Metformin improves bone mass in Type 2 diabetes (T2D) mice.
(A) Body weight. Ctrl, n=11; Met, n=9. (B) Body composition. n=9. (C) Serum insulin level. Ctrl, n=7; Met, n=8. (D) Trabecular bone parameters of femurs by µCT. Ctrl, n=9; Met, n=8. (E) Cortical bone parameters of femur midshaft. Ctrl, n=9; Met, n=8. (F) Mineral apposition rate by double labeling method. Ctrl, n=5; Met, n=4. (G) Relative enrichment of specific isotopomers normalized to Glc(m+6). Ctrl, n=6; Met, n=5. Data are represented as mean ± SD. *p<0.05 by Student’s t-test.
Figure 7 with 2 supplements
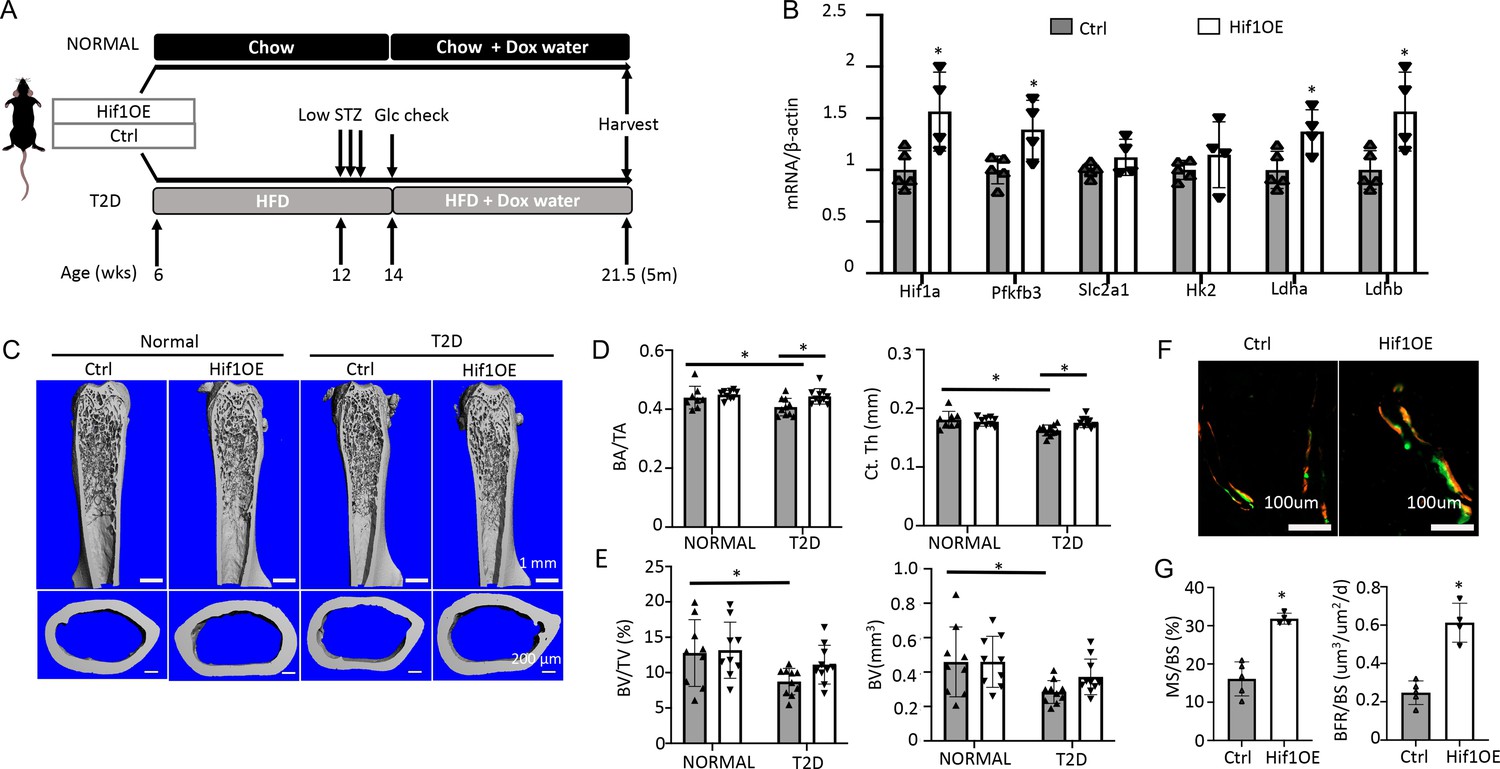
Targeted overexpression of Hif1a in osteoblasts rescues low bone mass in Type 2 diabetes (T2D) mice.
(A) A schematic for Hif1a overexpression (Hif1OE) in normal or T2D conditions. (B) qPCR analyses of glycolysis-related genes in bones of diabetic mice with or without Hif1a overexpression. n=4. (C–E) Representative µCT images (C) and quantification of cortical bone (D) and distal trabecular bone (E) of the femur. n=10. (F, G) Representative images (F) and quantification (G) of double labeling in trabecular bone of proximal tibia in diabetic mice. Ctrl, n=5, Hif1OE, n=4. Data presented as mean ± SD. *p<0.05 Unpaired Student’s t-test (B, G) or two-way ANOVA followed by Fisher’s LSD test (D, E).
Figure 7—figure supplement 1
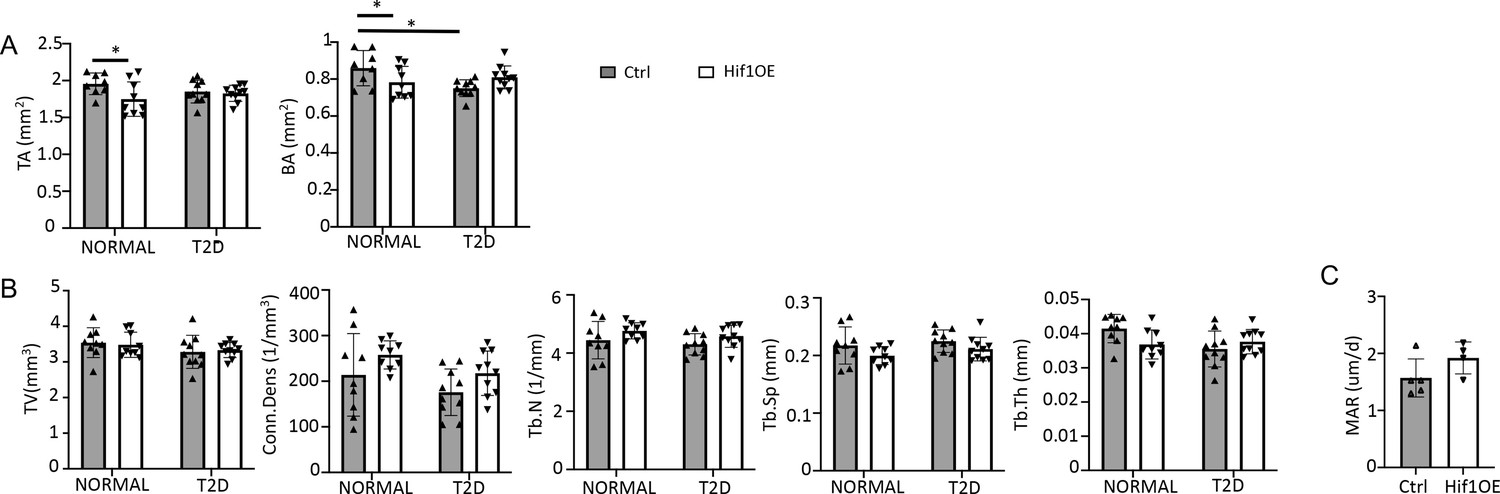
Hif1a overexpression improves bone mass in Type 2 diabetes (T2D) mice.
(A, B) Cortical (A) and trabecular (B) bone parameters by µCT. (C) Mineral apposition rate (MAR) from double labeling in the T2D group. Ctrl, n=5; Hif1OE; n=4. Data are represented as mean ± SD. *p<0.05, two-way ANOVA followed by Fisher’s LSD test (A, B) or Student’s t-test (C).
Figure 7—figure supplement 2
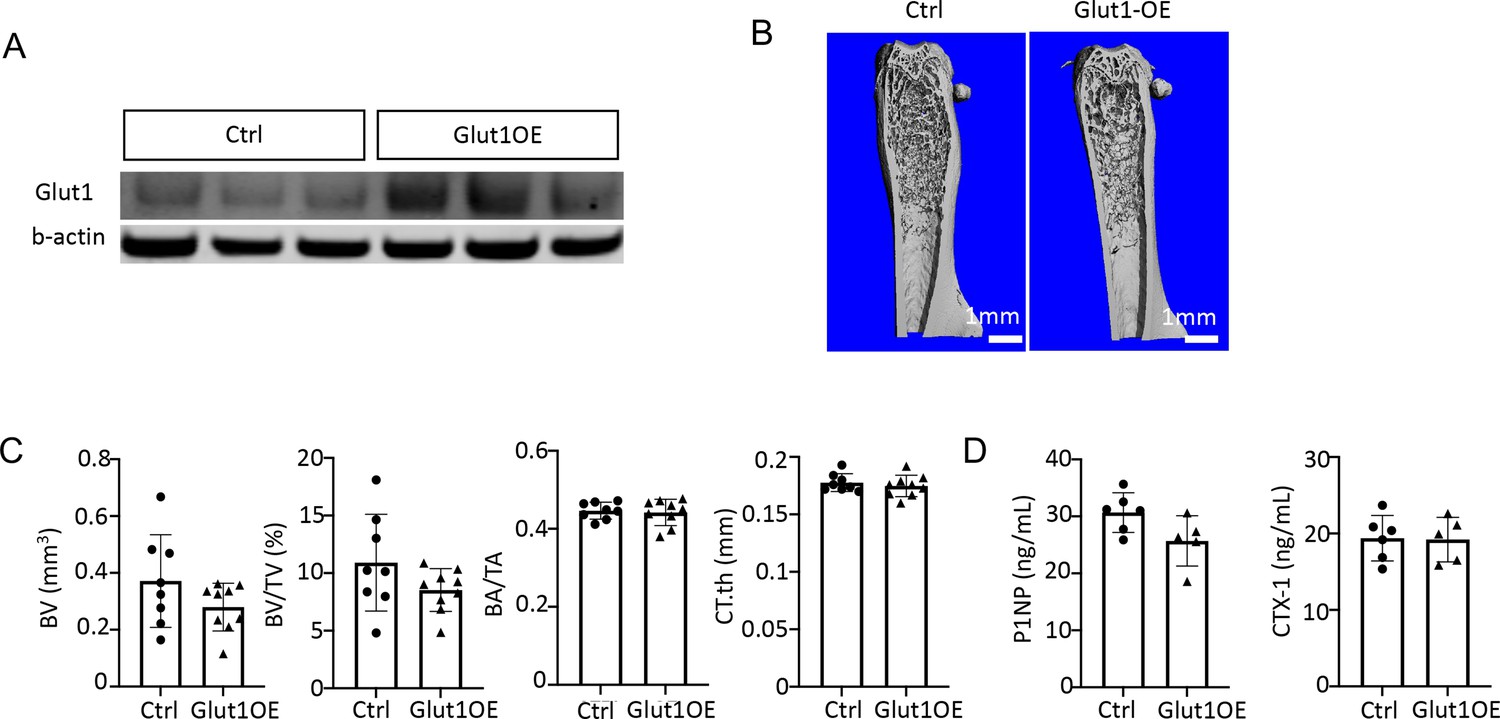
Glut1 overexpression does not improve bone in Type 2 diabetes (T2D) mice.
(A) Glut1 overexpression in the bone shaft by Western blot. (B) Representative µCT images. (C) Quantification by µCT. Ctrl, n=8; Glut1OE; n=9. (D) Serum P1NP and CTX-1 levels. Ctrl, n=6; Glut1OE; n=5. Data are represented as mean ± SD. *p<0.05 by Student’s t-test.
-
Figure 7—figure supplement 2—source data 1
Raw images of Western blots for Figure 7—figure supplement 2A.
- https://cdn.elifesciences.org/articles/85714/elife-85714-fig7-figsupp2-data1-v2.zip
-
Figure 7—figure supplement 2—source data 2
Raw western blots.
- https://cdn.elifesciences.org/articles/85714/elife-85714-fig7-figsupp2-data2-v2.zip
Figure 8 with 1 supplement
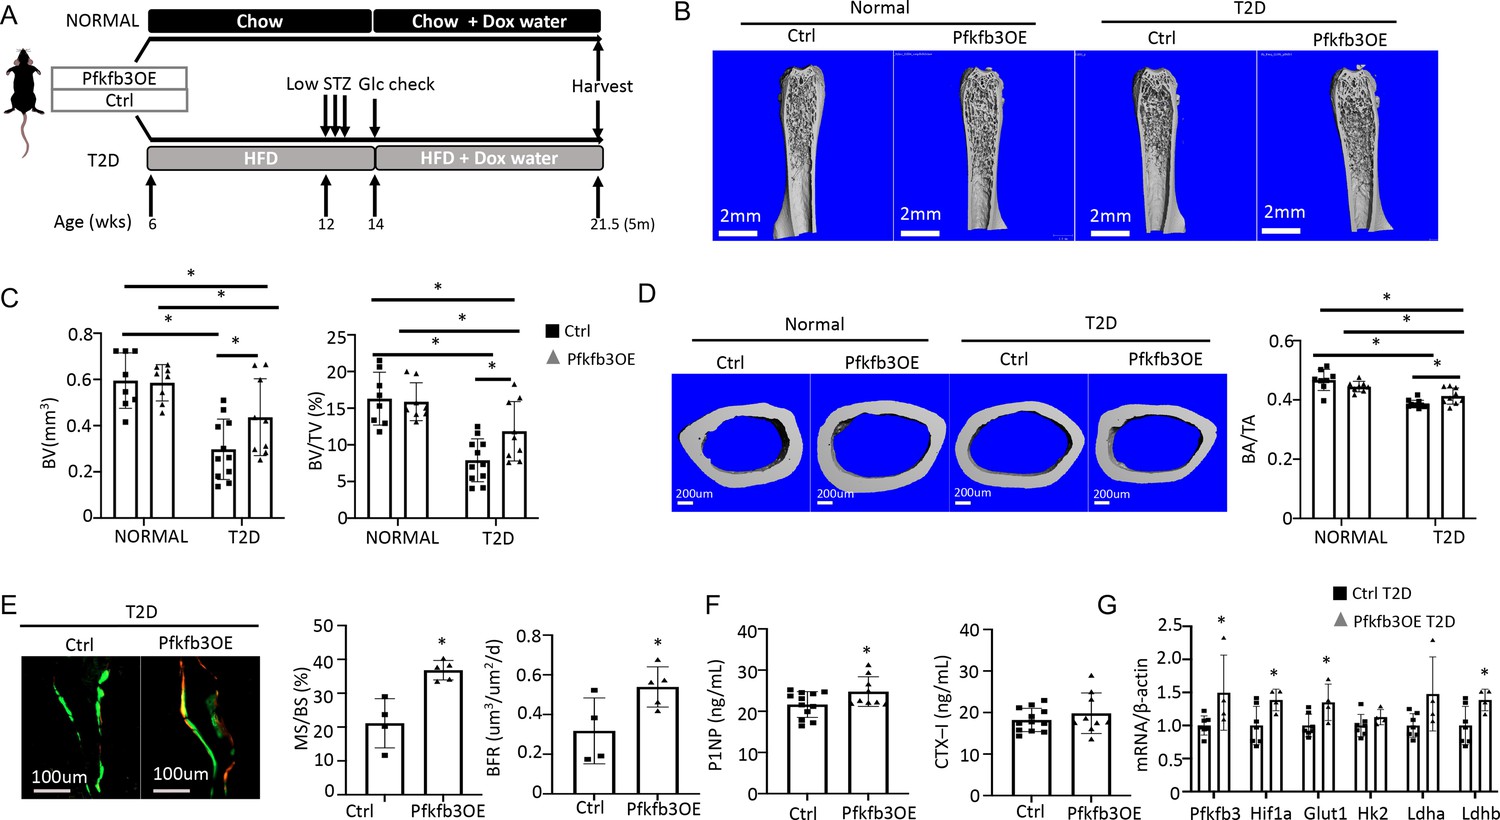
Osteoblast-directed Pfkfb3 overexpression corrects bone loss in Type 2 diabetes (T2D).
(A) A schematic for experimental design. Representative µCT images (B) and quantification (C) of trabecular bone in the distal femur. (D) Representative µCT images and quantification of cortical bone in femur. Ctrl NORMAL, n = 8; Pfkfb3OE NORMAL, n = 8; Ctrl T2D, n = 11; Pfkfb3OE T2D, n = 9. (E) Representative images and quantification of double labeling in trabecular bone of the proximal tibia. Ctrl T2D, n = 4; Pfkfb3OE T2D, n = 5. (F) Serum markers for bone formation (P1NP) and resorption (CTX-1). Ctrl T2D, n = 12; Pfkfb3OE T2D, n = 9. (G) qPCR analyses of glycolysis-related genes in bone. Ctrl T2D, n = 7; Pfkfb3OE T2D n = 4. Data presented as mean ± SD. *p<0.05, Two-way ANOVA followed by Fisher’s LSD test (C, D) or Student’s t-test (all others).
Figure 8—figure supplement 1
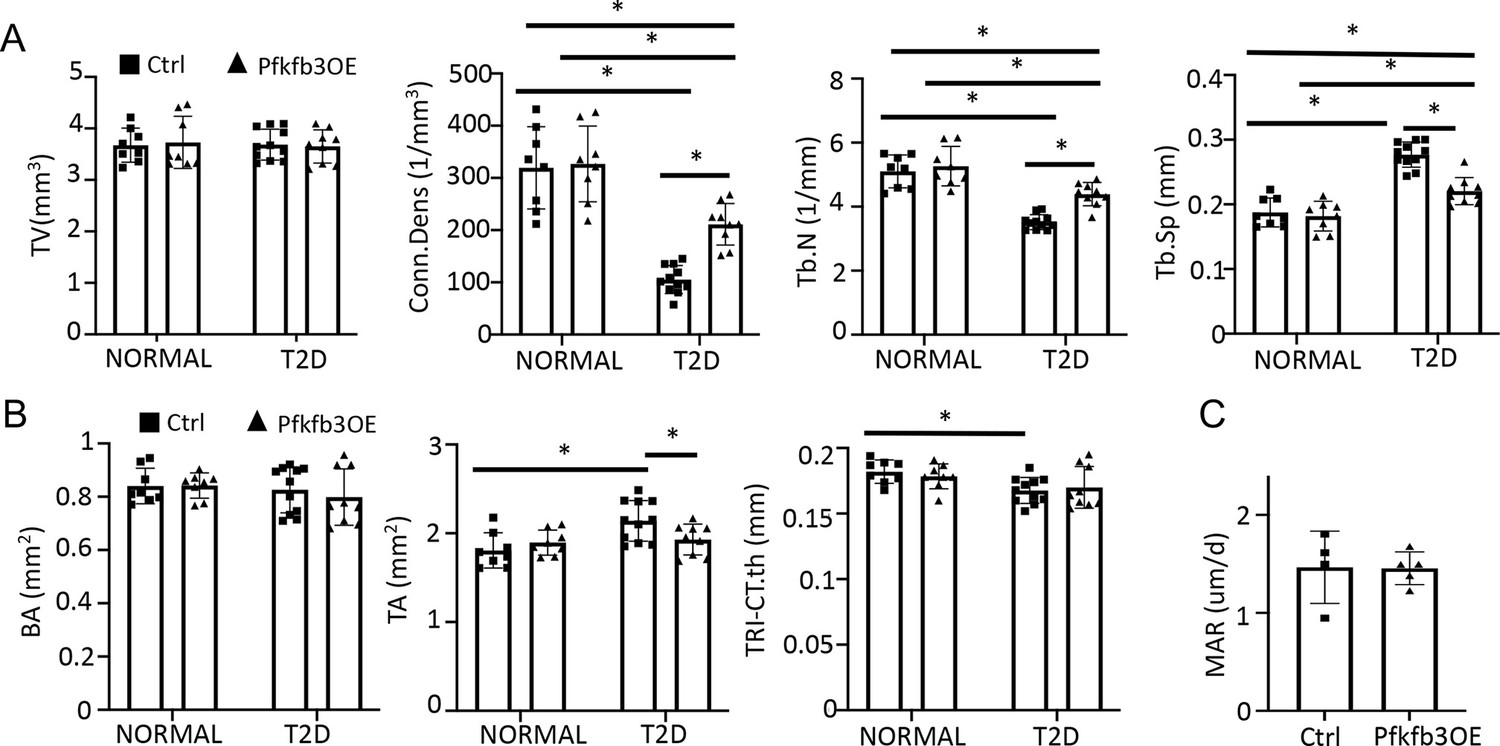
Pfkfb3 overexpression improves bone mass in Type 2 diabetes (T2D mice).
(A, B) Trabecular (A) and cortical (B) bone parameters of Pfkfb3OE versus Ctrl mice in T2D or NORMAL groups. Ctrl NORMAL, n = 8; Pfkfb3OE NORMAL, n = 8; Ctrl T2D, n = 11; Pfkfb3OE T2D, n = 9. (C) Quantification of mineral apposition rate (MAR) by double labeling in T2D mice with or without Pfkfb3OE. Ctrl T2D, n = 4; Pfkfb3OE T2D, n = 5. Data are represented as mean ± SD. *p<0.05, two-way ANOVA followed by Fisher’s LSD test (A, B) or by Student’s t-test (C).
Author response image 1
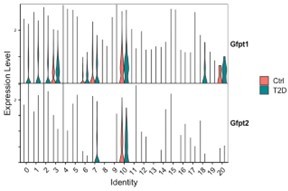
scRNA-seq detects increased expression of Gfpt1 in multiple mesenchymal cell clusters in the bone marrow of T2D mice compared to control.
Violin plots show relative gene expression levels in each cell cluster (x-axis) in control (red) versus T2D (green) mice.
Additional files
-
Supplementary file 1
GSEA analysis of gene expression changes in each cell cluster identified by scRNA-seq (T2D vs CTRL, FDR q<0.25).
- https://cdn.elifesciences.org/articles/85714/elife-85714-supp1-v2.docx
-
Supplementary file 2
Nucleotide sequences of qPCR primers.
- https://cdn.elifesciences.org/articles/85714/elife-85714-supp2-v2.docx
-
MDAR checklist
- https://cdn.elifesciences.org/articles/85714/elife-85714-mdarchecklist1-v2.docx
Download links
A two-part list of links to download the article, or parts of the article, in various formats.
Downloads (link to download the article as PDF)
Open citations (links to open the citations from this article in various online reference manager services)
Cite this article (links to download the citations from this article in formats compatible with various reference manager tools)
Osteoblast-intrinsic defect in glucose metabolism impairs bone formation in type II diabetic male mice
eLife 12:e85714.
https://doi.org/10.7554/eLife.85714


