A modelled analysis of the impact of COVID-19-related disruptions to HPV vaccination
- Daffodil Centre, The University of Sydney, a joint venture with Cancer Council NSW, Australia
- School of Population and Global Health, University of Melbourne, Australia
- Australian Centre for Prevention of Cervical Cancer, Australia
- The Kirby Institute, University of New South Wales, Australia
Figures
Figure 1
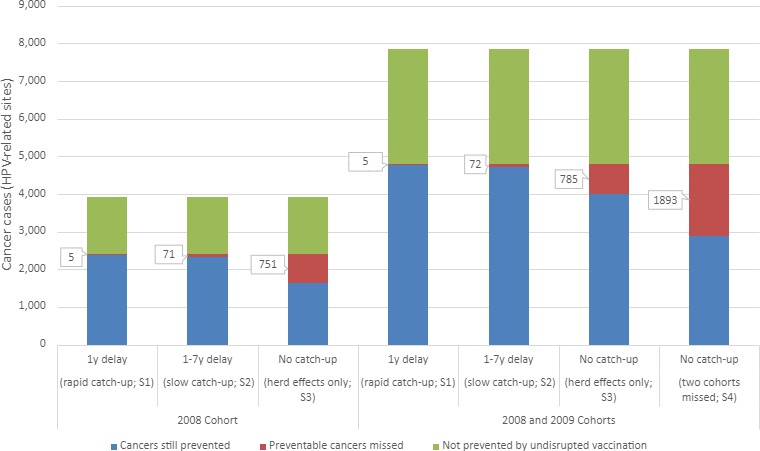
Estimated lifetime human papillomavirus (HPV)-related cancer cases from four modelled scenarios.
Scenarios include two HPV vaccination catch-up scenarios [S1: 1-year delay in vaccination (rapid); S2: 1- to 7-year delay in vaccination (slow)] and two scenarios modelling the absence of vaccination catch-up, varying in the cohort affected (S3: scenario 3 affecting the 2008 birth cohort; S4: scenario 4 affectioning the 2008 and 2009 birth cohorts).
Tables
Table 1
Estimated number of human papillomavirus (HPV)-related cancer cases and cases prevented for vaccinated and unvaccinated cohorts, and four vaccination disruption scenarios.
| Modelled scenarios | Outcomes in 2008 birth cohort* | Outcomes in 2008 and 2009 birth cohorts† | ||||||||
|---|---|---|---|---|---|---|---|---|---|---|
| Total cases | Prevented cases (unvax comparator) | Additional cases (compared to no disruption) | % Prevented (unvax comparator) | % Additional(compared to no disruption) | Total cases | Prevented cases (unvax comparator) | Additional cases(compared to no disruption) | % Prevented (unvax comparator) | % Additional(compared to no disruption) | |
| Unvaxed | 3923 | 7847 | ||||||||
| No disruption | 1532 | 2583 | 63 | 3061 | 4876 | 63 | ||||
| S1: 1-year delay | 1537 | 2579 | 4 | 63 | 0.3 | 3066 | 4781 | 5‡ | 63 | 0.2 |
| S2: 1- to 7-year delay | 1603 | 2513 | 70 | 61 | 5 | 3133 | 4714 | 72‡ | 62 | 2 |
| S3: no catch-up | 2282 | 1833 | 750 | 45 | 49 | 3846 | 4001 | 785‡ | 53 | 26 |
| S4: no catch-up (two missed cohorts) | 2503 | 1613 | 970 | 39 | 63 | 4954 | 2893 | 1892 | 40 | 62 |
-
No disruption: uninterrupted HPV vaccination in females and males at age 12 with status quo uptake; scenario 1: disruption with rapid catch-up, 1-year delay in HPV vaccine catch-up; scenario 2: disruption with slow catch-up, 1- to 7-year delay in HPV vaccine catch-up; scenario 3: disruption with no HPV vaccine catch-up (herd effects only; 2008 cohort affected); scenario 4: disruption with no HPV vaccine catch-up (herd effects only; 2008 and 2009 cohorts affected).
-
*
Includes outcomes specifically for the cohort consisting of females and males born in 2008 (any effects on the 2009 cohort are not included).
-
†
Includes outcomes specifically for the cohort consisting of females and males born in either 2008 or 2009.
-
‡
Differences between these additional cases compared to additional cases in the outcomes specific to the 2008 cohort (left-hand side of table) are additional cases in unvaccinated individuals in the 2009 cohort, due to a loss in the indirect protection they received from vaccination of the 2008 cohort in the No disruption scenario due to herd effects.
-
vax: vaccine; unvaxed: unvaccinated i.e. assuming no HPV vaccination in cohort(s).
Table 2
Estimated number of cancer cases in modelled scenarios according to sex and cancer type.
| Modelled scenarios | Total cases (additional compared to no disruption) | Females, N (additional compared to no disruption) | Males, N (additional compared to no disruption) | ||||||
|---|---|---|---|---|---|---|---|---|---|
| Anal | Cervical | Oropharyngeal | Vaginal | Vulvar | Anal | Oropharyngeal | Penile | ||
| 2008 cohort | |||||||||
| Unvaxed | 3923 | 489 | 788 | 185 | 162 | 729 | 389 | 911 | 271 |
| No disruption | 1532 | 100 | 62 | 86 | 61 | 580 | 74 | 423 | 146 |
| Scenario 1 | 1537 (4)* | 101 (1) | 63 (1) | 86 | 61 | 580 | 75 (1) | 424 (1) | 146 |
| Scenario 2 | 1603 (70)* | 114 (14) | 74 (12) | 90 (4) | 64 (3) | 586 (6) | 85 (11) | 440 (17) | 150 (4) |
| Scenario 3 | 2282 (750)* | 236 (136) | 250 (188) | 121 (35) | 96 (35) | 632 (52) | 175 (101) | 593 (170) | 180 (34) |
| 2008 and 2009 cohorts | |||||||||
| Unvaxed | 7847 | 978 | 1576 | 370 | 324 | 1458 | 778 | 1822 | 542 |
| No disruption | 3061 | 199 | 125 | 172 | 122 | 1160 | 148 | 845 | 292 |
| Scenario 4 2008 cohort | 2503 (971)* | 276 (176) | 303 (241) | 131 (45) | 107 (46) | 647 (67) | 205 (131) | 644 (221) | 190 (44) |
| 2009 cohort | 2451 (922) | 268 (169) | 285 (222) | 129 (43) | 104 (43) | 644 (64) | 199 (125) | 634 (212) | 188 (42) |
| Scenario 4 total | 4954 (1892)* | 544 (345) | 588 (463) | 260 (88) | 211 (89) | 1291 (131) | 404 (256) | 1278 (433) | 378 (86) |
-
Sum of cases may not add to ‘total cases’ due to rounding.
-
Unvaxed: assuming no HPV vaccination in cohort(s); No disruption: HPV vaccination in females and males at age 12 with coverage of 82.4% in females and 75.5% in males; scenario 1: disruption with rapid catch-up, 1-year delay; scenario 2: disruption with slow catch-up, 1- to 7-year delay; scenario 3: disruption with no catch-up (herd effects only; 2008 cohort affected); scenario 4: disruption with no catch-up (herd effects only; 2008 and 2009 cohorts affected).
-
*
The number of additional cases presented in the table does not always match the difference between case figures stated for individual scenarios in Table 2, due to rounding.
Additional files
-
Supplementary file 1
Data used to inform the model.
(A) Age-specific cancer rates for females in Australia (per 100,000), 2020 projections; (B) age-specific cancer rates for males in Australia (per 100,000), 2020 projections; (C) human papillomavirus HPV attributable fractions and HPV9 preventable proportions for the cancers modelled; (D) estimated number of cervical and total cancer cases in modelled scenarios for explicit screening (main analysis) vs incidence-based approach.
- https://cdn.elifesciences.org/articles/85720/elife-85720-supp1-v1.docx
-
MDAR checklist
- https://cdn.elifesciences.org/articles/85720/elife-85720-mdarchecklist1-v1.pdf
Download links
A two-part list of links to download the article, or parts of the article, in various formats.
Downloads (link to download the article as PDF)
Open citations (links to open the citations from this article in various online reference manager services)
Cite this article (links to download the citations from this article in formats compatible with various reference manager tools)
A modelled analysis of the impact of COVID-19-related disruptions to HPV vaccination
eLife 12:e85720.
https://doi.org/10.7554/eLife.85720


